 Yingsu Mu1,2Li Cheng3Xiaojian Gong1,2Jiangxiong Ma1,2Shiyu Zhang1,2Yinghua Mu4Kang Liang5
 Xin Zhou1,2*
 Chao Zhao1,2*
- 1Key Laboratory for Information System of Mountainous Areas and Protection of Ecological Environment, Guizhou Normal University, Guiyang, China
- 2Guizhou Engineering Laboratory for Quality Control and Evaluation Technology of Medicine, Guizhou Normal University, Guiyang, China
- 3Guizhou University of Traditional Chinese Medicine, Guiyang, China
- 4College of Food and Pharmaceutical Sciences, Ningbo University, Ningbo, China
- 5Guizhou Forestry Scientific Research Institute, Guiyang, China
Dendrobium officinale Kimura et Migo (D. officinale), one of the nine everlasting types of grass, has gained increasing attention owing to its important roles in alternative medicines and drug discovery. Due to its natural resources being in danger of being extinct, imitation wild planting is becoming increasingly common. To assess the product’s quality completely, an efficient ultrahigh performance liquid chromatography-triple quadrupole tandem mass spectrometry (UHPLC-QQQ-MS/MS) method was established to simultaneously quantify nine phenolic compounds in D. officinale samples. The extraction parameters, including solvent, solvent concentration, solid–liquid ratio, and extraction time, were systematically optimized with the single-factor test. The results demonstrated that extraction with a 1:200 solid-to-liquid ratio of 80% methanol for 1.5 h was the most efficient condition for the extraction of flavonoids. Satisfactory retention times and resolution of the nine analytes were acquired on the Thermo Scientific Hypersil GOLD column with multiple reaction monitoring in negative ion scanning mode. The method was validated to demonstrate its selectivity, linearity, precision, accuracy, and robustness. Thus, the verified UHPLC-QQQ-MS/MS method was successfully applied to the quantification of phenolic components present in D. officinale samples. The results indicated that the quantity and composition of phenolic components in D. officinale from various provenances were significantly different. This work provides a theoretical foundation for the cultivation and assessment of wild D. officinale quality.
1. Introduction
Dendrobium officinale Kimura et Migo (D. officinale), a perennial epiphytic member of the Orchidaceae, is considered to have the best medicinal properties in traditional Chinese medicine (1, 2). Dendrobium officinale, is a well-known medicinal and food homologous plant, that strengthens the stomach and promotes the production of body fluid, nourishing Yin and clearing heat (3, 4). It is known that D. officinale is primarily distributed in several nations, including the United States, Japan, and Australia, and is more broadly distributed in southern China, including the provinces of Zhejiang, Anhui, Fujian, Guangxi, Yunnan, and Guizhou (3, 5). However, D. officinale has strict requirements for habitat conditions, a slow growth rate, low yield, and excessive harvesting, which has led to a sharp decrease in the number of wild plants and has been included in the “China Plant Red Data Book” (6). Currently, the market for D. officinale mainly comes from greenhouse cultivation and imitation wild planting, among which imitation wild planting improves the quality of D officinale while making full use of woodland resources, with low cultivation cost and a good ecological environment. However, the 2020 edition of the Chinese Pharmacopoeia only uses polysaccharide content as its quality evaluation index, which is contrary to the theory that complex components in Chinese medicine interact with each other and work synergistically. Therefore, we should comprehensively analyze the active ingredients of D officinale and establish a more scientific quality control standard for D officinale (7).
Phenolic compounds include flavonoids, simple phenols and quinones. Numerous natural phenols have attracted great interest from scientists around the world because they are considered safer and have a wide range of health-promoting properties. Flavonoids are a widespread group of secondary metabolites in plants that not only play a key role in the pharmaceutical industry but also serve as excellent chemical markers for quality control of medicinal plants (8). Dendrobium officinale’s active pharmaceutical ingredients include phenols, flavonoids, alkaloids, amino acids, coumarins, terpenes, benzylic compounds, and several trace minerals, in addition to polysaccharides (9–12), which have been widely used to treat hyperglycemia (13), hyperlipidemia (14), and immune enhancement (15) and to benefit the stomach (16). Polysaccharides are the predominant bioactive compounds in these substances. Of course, phenolic components are a group of compounds that are also prevalent in D. officinale. In recent years, interest has increased due to the potent antioxidant and protective effects of phenolic components against cell toxicity (17). Phenolic contents have been effectively isolated, and their structures have been validated. Unfortunately, the development of phenolic components from D. officinale has been hampered by the lack of a reliable method for quantitative determination. With the birth and development of large-scale instruments and equipment such as gas chromatographs (GC), liquid chromatography (LC), ultrahigh-performance liquid chromatography (HPLC), and mass spectrometers (MS), instrumental analysis methods have become the most commonly used methods for quantitative analysis of secondary metabolites of plants (18–20). Zhu et al. (21) used an HPLC assay to simultaneously quantify 11 phenolics in four Dendrobium species. The contents of kaempferol, quercetin and myricetin in flavonoids are mainly determined based on the HPLC method (22). However, some phenolic components cannot be effectively identified and quantified using HPLC because of poor separation from more abundant components (23). Compared with ultrahigh-performance liquid chromatography (HPLC), ultrahigh-performance liquid chromatography–tandem mass spectrometry (UHPLC–MS/MS) has the characteristics of higher-resolution separation and better identification and quantification of individual components (19, 24–27).
To establish the method of UHPLC-QQQ–MS/MS for the first time for the simultaneous determination of various components of phenolic D. officinale for overall quality control. The extraction conditions were optimized, and the extraction method, extraction solvent, solvent concentration, extraction time, and material-to-liquid ratio were investigated. The contents of ferulic acid, chrysin, naringenin, luteolin, L-epicatechin, quercetin, isorhamnetin, cynaroside, and naringin in D. officinale from different provenances were determined, and the quality of nine phenolic compounds was comprehensively evaluated by the TOPSIS comprehensive evaluation method. This study may offer a workable and straightforward technique for quality control of imitation wild D. officinale as well as a theoretical framework for its development and cultivation.
2. Materials and methods
2.1. Instruments, reagents, and materials
The TSQ Quantum Liquid Chromatography–Mass Spectrometer (UHPLC–MS/MS) included a triple quadrupole mass analyzer, ESI ion source, and Xcalibur workstation. The liquid phase part was a Thermo Accela UHPLC, including an Accela PDA detector, Accela autosampler and Accela 1250 infusion pump, which were purchased from Thermo Fisher Scientific, Inc. XS-105DU 1/100000 and the AL204 1/10000 electronic analytical as well as the KQ-5200E type ultrasonic cleaner were both obtained from Kunshan Ultrasonic Instruments Co.
Quercetin was purchased from the China Institute of Food and Drug Control; Ferulic acid and L-epicatechin were purchased from the China Institute for Testing and Certification of Pharmaceutical and Biological Products. Chrysin, naringenin, luteolin, and cynaroside were acquired from Guizhou Dida Biotechnology Co., Ltd. Isorhamnetin was acquired from Chengdu Pfeiffer Biotechnology Co., Ltd. Quercetin was acquired from the China Institute of Food. Naringin was purchased from Chengdu Botanical Standard Pure Biotechnology Co., Ltd., Research Central Reference Materials Research Center. The purities of the 9 reference substances were all greater than 98%. The analytical purities of methanol (MeOH) and ethanol were purchased from Tianjin Comitry Co., Ltd. Acetonitrile (HPLC grade) was purchased from American TEDIA Company. Formic acid (LC/MS grade) was acquired by ROE SCIENTIFIC Corporation, United States. Food-grade distilled water was purchased from Watson’s Food and Beverage Guangzhou Co. The structural formulas of the 9 compounds are shown in Figure 1.

Figure 1. The chemical structures of nine phenolic components in this study. (1) ferulic acid; (2) chrysin; (3) naringenin; (4) luteolin; (5) L-epicatechin; (6) quercetin; (7) isorhamnetin; (8) cynaroside; (9) naringin.
The majority of medicinal plants are harvested and grown in Yun Guan Shan, a state-owned forest farm in Guizhou Province, China, where they mimic wild D. officinale from Pinus massoniana Lamb. tree species.
2.2. Sample pretreatment and standard solution
All dry ingredients were ground up and put through a sieve with a mesh size of 60. As mentioned below, 0.1 g of samples were weighed exactly (within 0.00001), and they were then extracted once with 80% methanol (20 ml) by reflux for 1.5 h. The sample was meticulously weighed before extraction, and the weight loss was compensated once the sample solution was weighed and cooled to room temperature. All of the solutions were filtered through a 0.22 μm microporous membrane before being put on the device.
Each standard was properly weighed. The reference standards’ standard stock solutions were made by combining and evaporating in 80% methanol. The working standard solution was then made by gradient-diluting the standard stock solution with the same solvent, and both of these solutions were stored at 4°C for further analysis.
2.3. Instrumentation and chromatography
2.3.1. Ultrahigh-performance liquid chromatography conditions
The chromatographic separations were performed on a thermostat-controlled, 25°C, Thermo Scientific Hypersil GOLD column (50 mm × 2.1 mm, 5 μm). The following procedure was used for the gradient elution of 0.1% formic acid acetonitrile (solvent A) and 0.1% formic acid aqueous solution (solvent B) at a flow rate of 200 μl/min: 0–3 min, 5% A; 3–3.1 min, 5–80% A; 3.1–6 min, 80% A; 6.0–6.1 min, 80–5% A and 6.1–12 min, 5% A. The injection volume was 10 μl.
2.3.2. Mass spectrometer conditions
Electrospray ionization in the negative ionization mode was used to obtain the mass spectra. The ESI source performed best under the following conditions: spray voltage of 2,500 V, the capillary temperature of 350°C, vaporizer temperature of 200°C, sheath gas pressure of 35 Arb, the auxiliary gas pressure of 15 Arb, and vaporizer temperature of 200°C. Multiple reaction monitoring (MRM) was used as the measurement technique, and 0.1 s was the scanning interval. Table 1 displays the precise quantitative analysis. Figure 2 displays 9 compounds’ MRM diagrams.
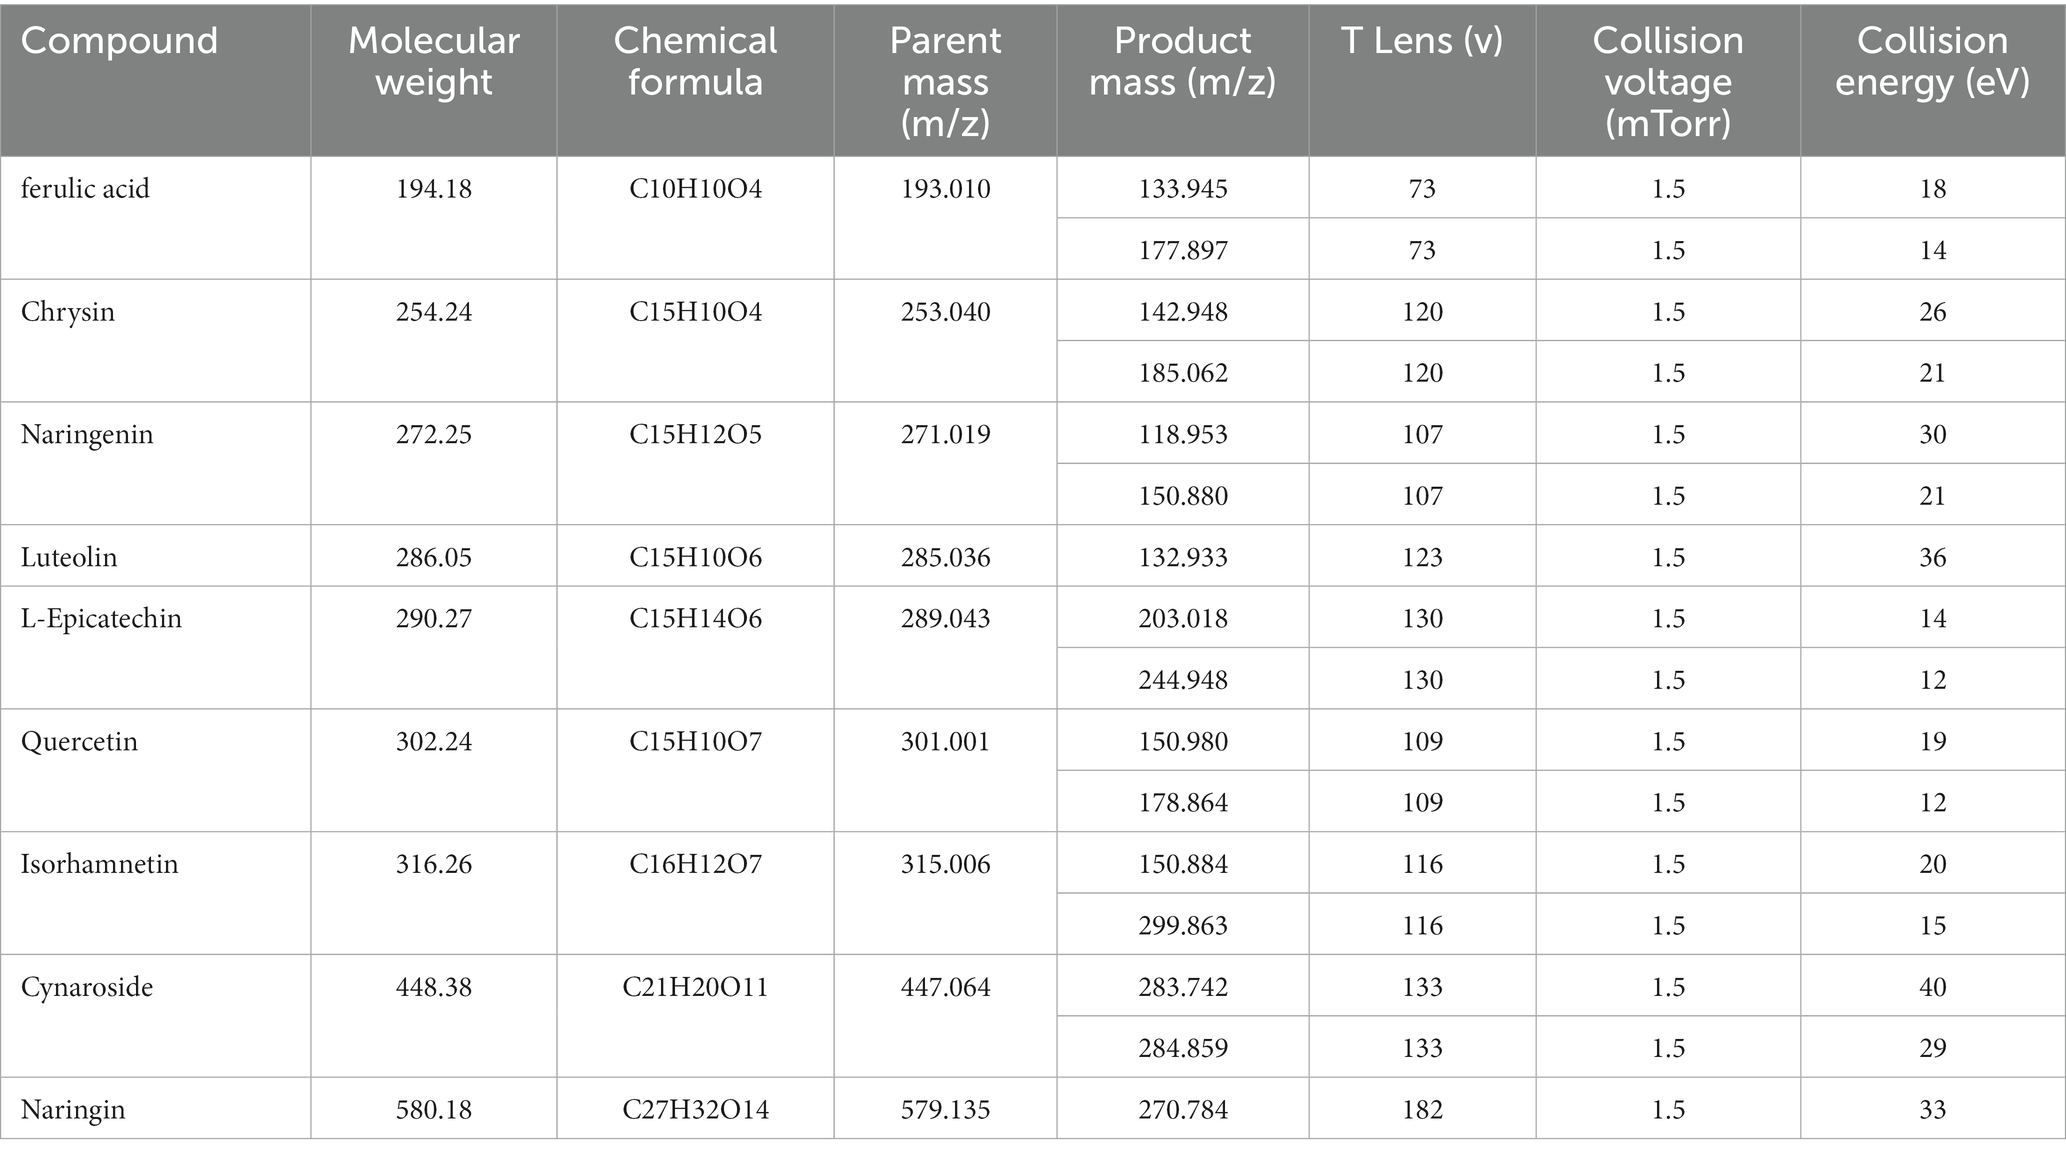
Table 1. Mass spectral parameters of the nine components.
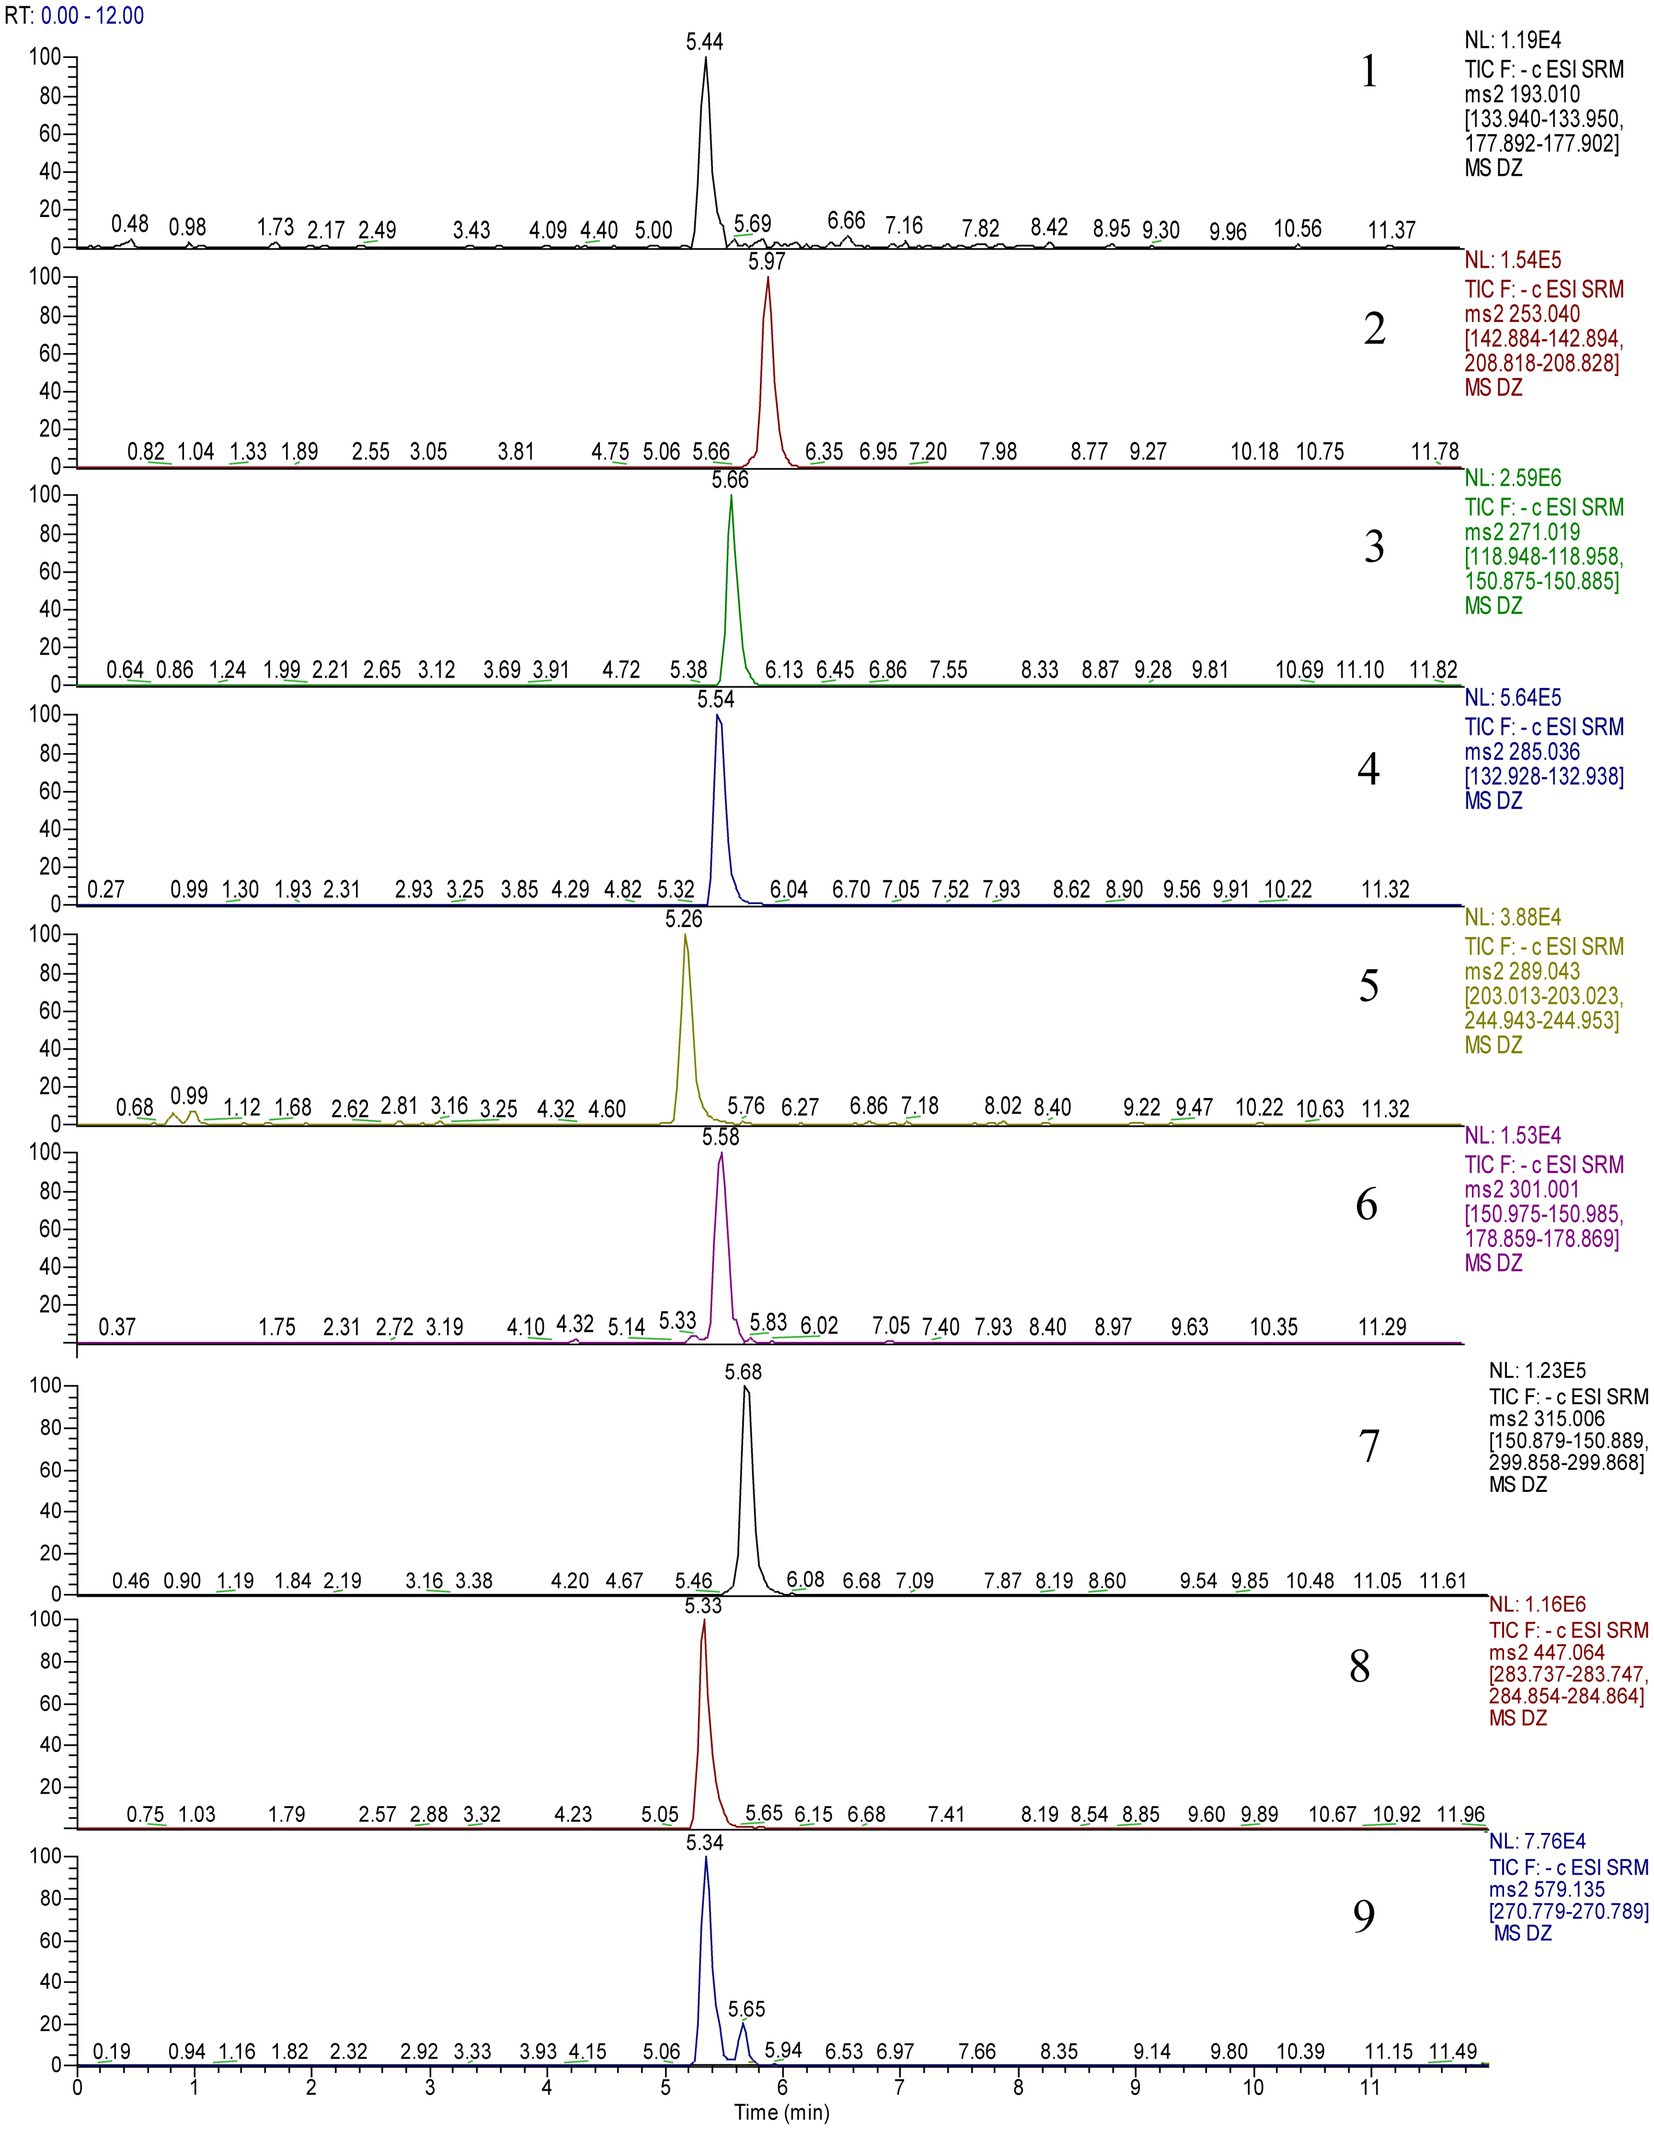
Figure 2. Multiple reaction monitoring (MRM) chromatograms of 9 components.
2.4. Extraction optimization
Different extraction methods were investigated by a single-factor experiment: ultrasound (100 W, 90 kHz, 60 min), reflux (60 min, 67°C), and cold soaking (60 min); different solvents: ethanol, methanol, water, different concentrations: methanol (40, 60, 80, and 100%). Then the effects of different solid–liquid ratios of 1:200, 1:300, 1:400, and 1:500 (m/v), and reflux extraction times of 0.5, 1, 1.5, and 2 h on the extraction were studied. The supernatant was examined by “2.3” chromatography after being filtered using a 0.22 μm microporous organic membrane. Nine peaks’ response values, peak areas, and peak forms were compared.
2.5. Method validation for quantitative analysis
2.5.1. Linearity LOQ and LOD
The master batch of the control solution was aspirated and prepared into a mass concentration gradient solution. Following “2.3″‘s chromatographic conditions, the mass concentration was employed as the horizontal coordinate (X), and the peak area as the vertical coordinate (Y). The standard curve’s lowest concentration point is called the LOQ. Signal-to-noise ratios (S/N) of 3 were used to calculate the limits of detection (LOD).
2.5.2. Precision, stability, repeatability, and recovery
The intraday and interday variations were used to investigate the accuracy of the suggested approach. The intraday precision was calculated by following the standard curve for three consecutive days, mixing 9 standards, injecting them six times, and calculating the concentration and relative standard deviation (RSD%) at each level. At various time intervals of 0, 2, 4, 8, 12, and 24 h, the sample was injected and examined. Six identical samples were prepared in parallel to test the repeatability of the process. Three different concentration levels of the standard solutions—50, 100, and 150%—were added to the sample powder for the recovery test to assess the method’s accuracy. The sample powder was then extracted, and the results were examined. For each level, three parallel samples were taken.
2.6. The Technique for Order Preference by Similarity to Ideal Solution evaluation
The Technique for Order Preference by Similarity to Ideal Solution (TOPSIS) method is a multi-index decision analysis method, that calculates the multi-index as a comprehensive index, and transforms the multidimensional problem into a one-dimensional problem, which greatly reduces the interference of different types of indicators on decision-making in the analysis process, and significantly improves the scientificity and accuracy of multiobjective decision analysis (28). It has been widely used in the quality evaluation of various Chinese medicinal materials.
3. Results and discussion
3.1. Qualitative analysis
In this paper, 597 metabolites were detected based on the UHPLC–MS/MS detection platform and a self-built database, and 185 flavonoids were screened through primary classification. This part of the experiment was performed by Wuhan Maitville Biotechnology Co., Ltd. Therefore, the UHPLC–ESI MS/MS method was established to compare the total ion current diagram and fragment ion diagram of the D officinale extract and standard sample, and nine phenolic compounds were identified, ferulic acid (1), chrysin (2), naringenin (3), luteolin (4), L-epicatechin (5), quercetin (6), isorhamnetin (7), cynaroside (8), and naringin (9), as shown in Figure 3.
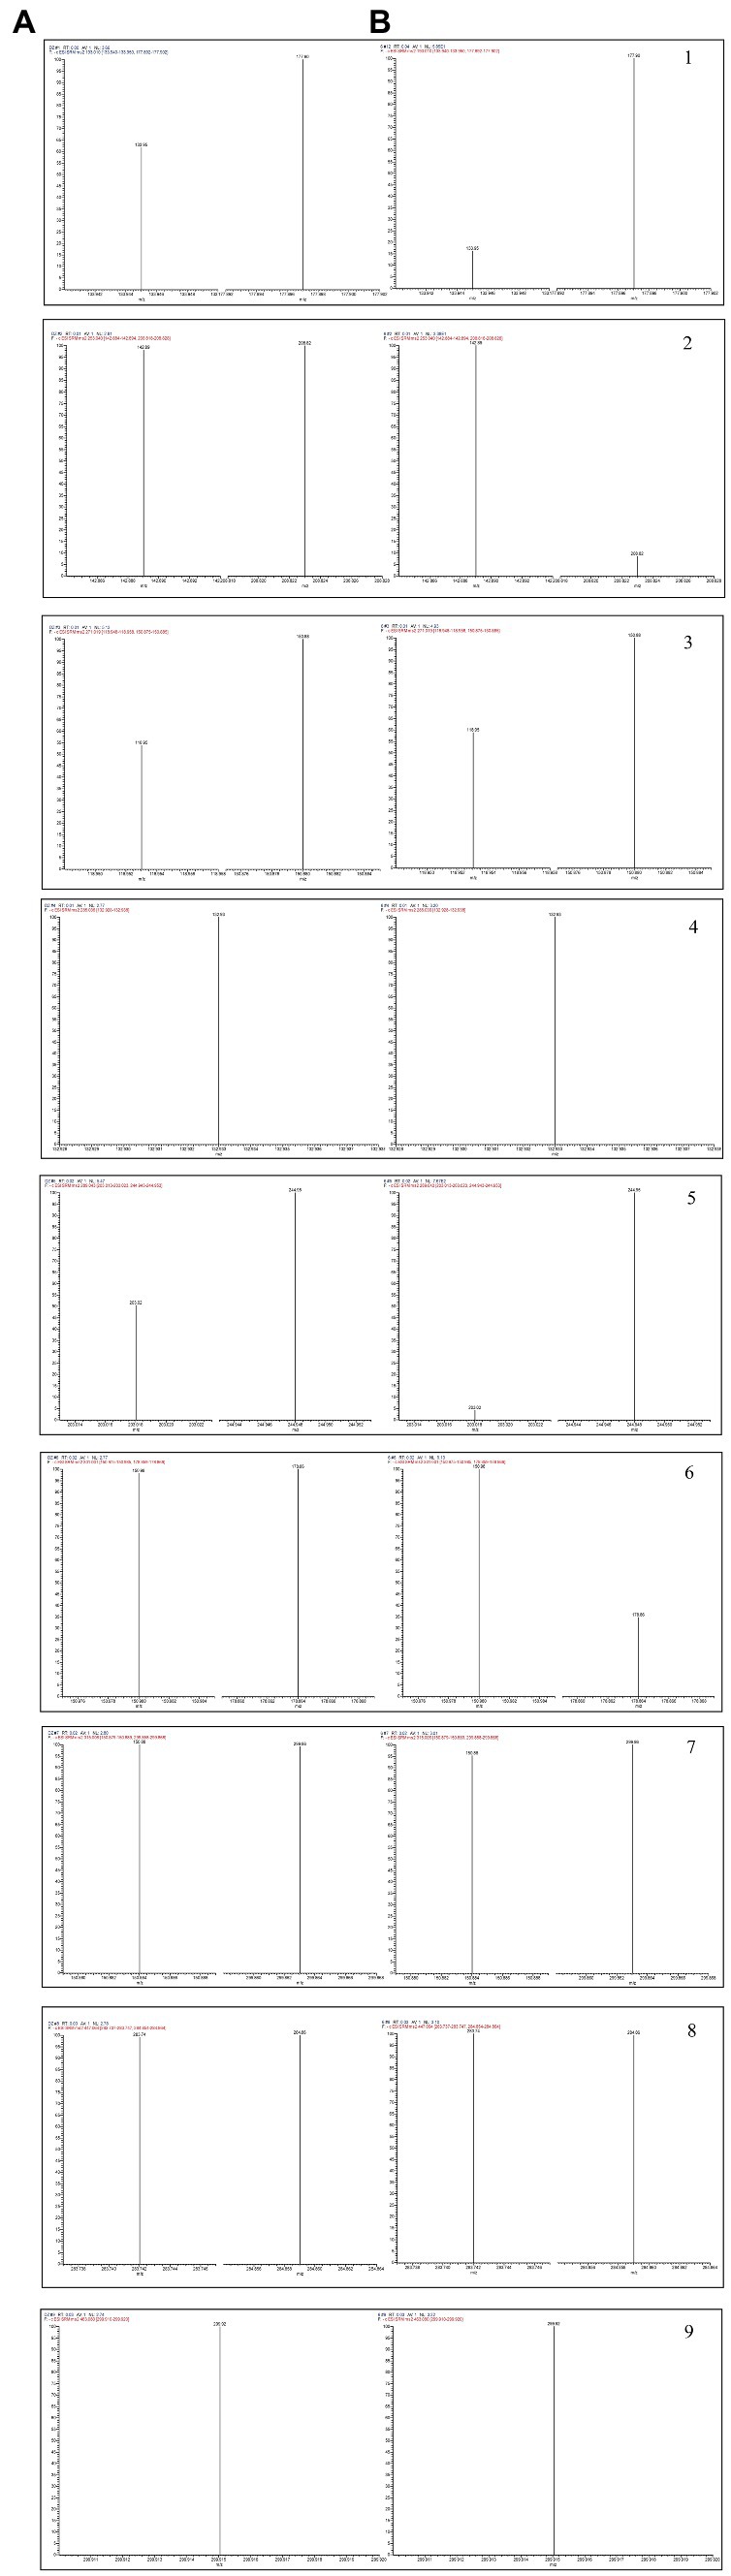
Figure 3. The tandem mass spectrometry (MS/MS) spectra of the standards (A) and the phenolic components in the samples (B).
3.2. Extraction optimization
The following extraction methods (sonication, reflux, cold soak), extraction solvents (ethanol, methanol, water), solvent concentrations (40, 60, 80, 100% methanol), extraction stock ratios [1:200, 1:300, 1:400, 1:500 (m/v)], and extraction times (0.5, 1, 1.5, and 2 h) were optimized, as shown in Figure 4. Reflux extraction was chosen for the herb’s extraction because it produced much more naringenin and cynaroside than the other two extraction techniques. More phenols were extracted from methanol, while more polysaccharides were extracted from aqueous extracts that were not well filtered. The longer the extraction time was, the greater the extracted phenol content increased, but when the time was 1.5 h after the slow growth. The extraction of phenolic compounds was not significantly impacted by the material-to-liquid ratio. The feed-to-liquid ratio of 1:200 and 1.5 h of refluxing 80% methanol resulted in the best extraction conditions.
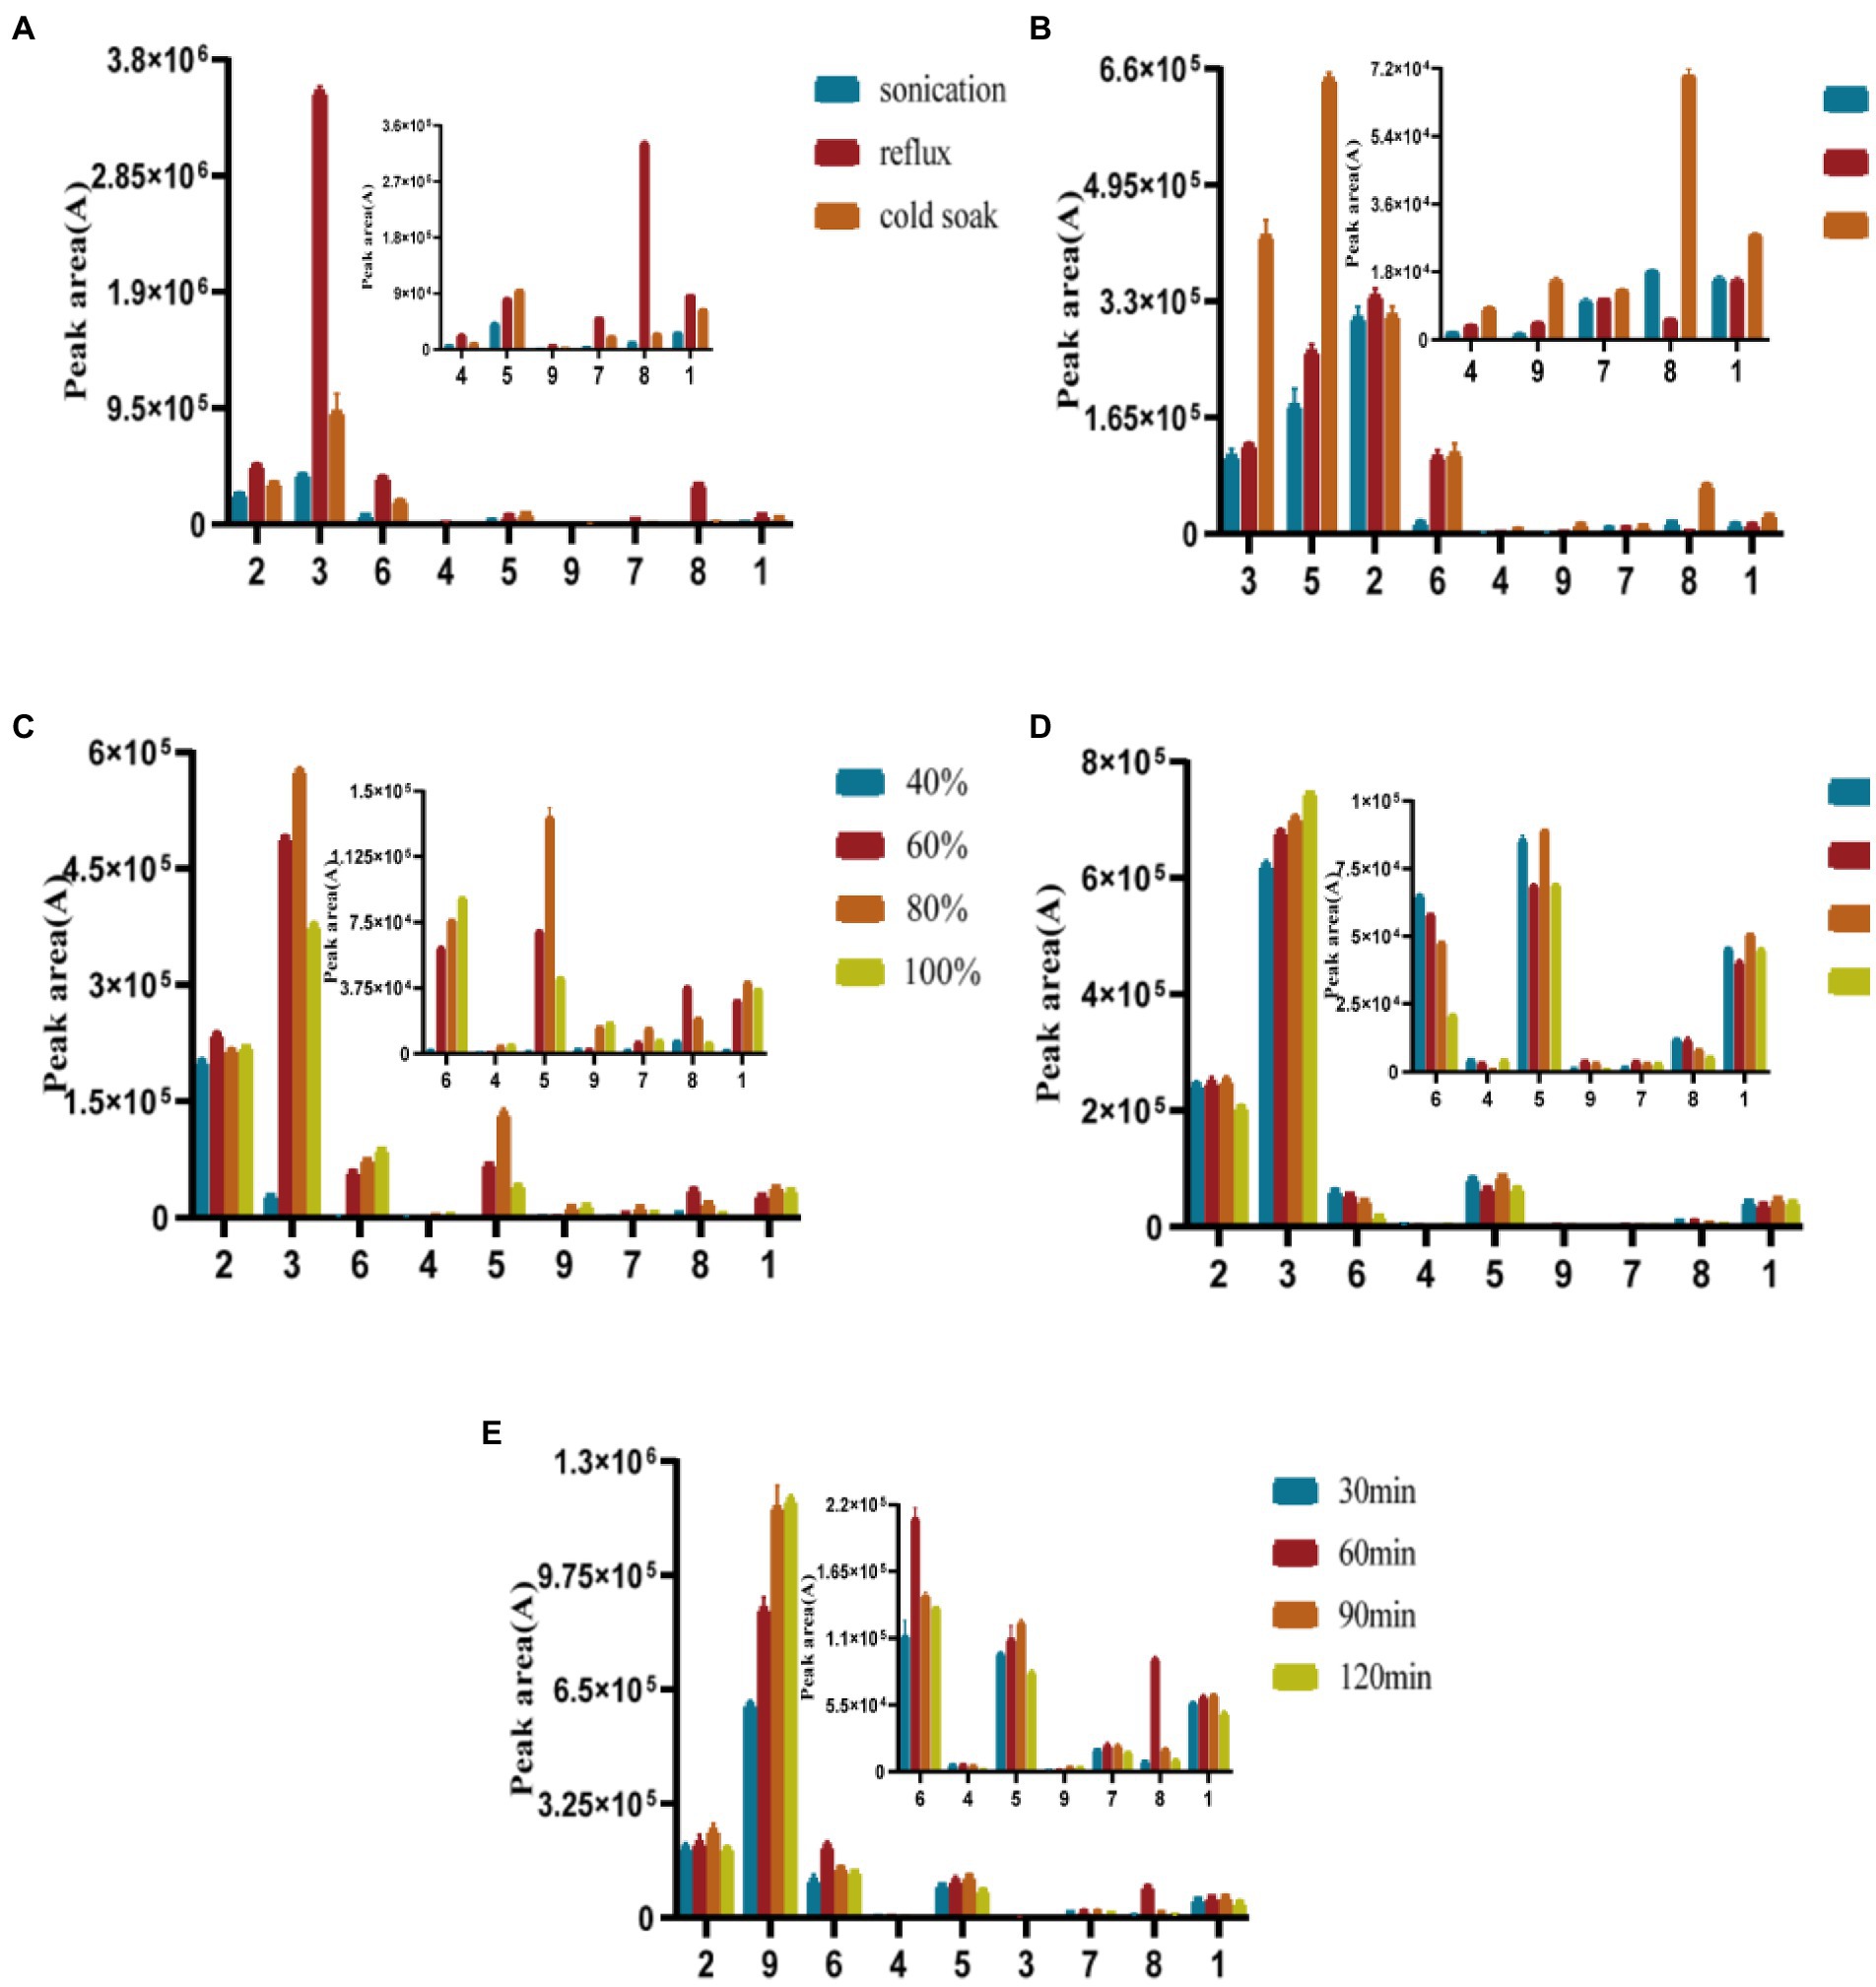
Figure 4. Optimization of extraction methods (A), extraction solvent (B), solvent concentrations (C), extraction stock ratios (D), and extraction times(E).
3.3. Validation of the quantitative analysis method
The mass concentration was used as the horizontal coordinate (X), and the peak area was used as the vertical coordinate in the linear regression (Y). The regression equation and correlation coefficient (R2) were calculated, and the maximum LOD and LOQ of the 9 compounds were 16.89 and 15 ng/ml, respectively. The result shown in Table 2, show good linearity.
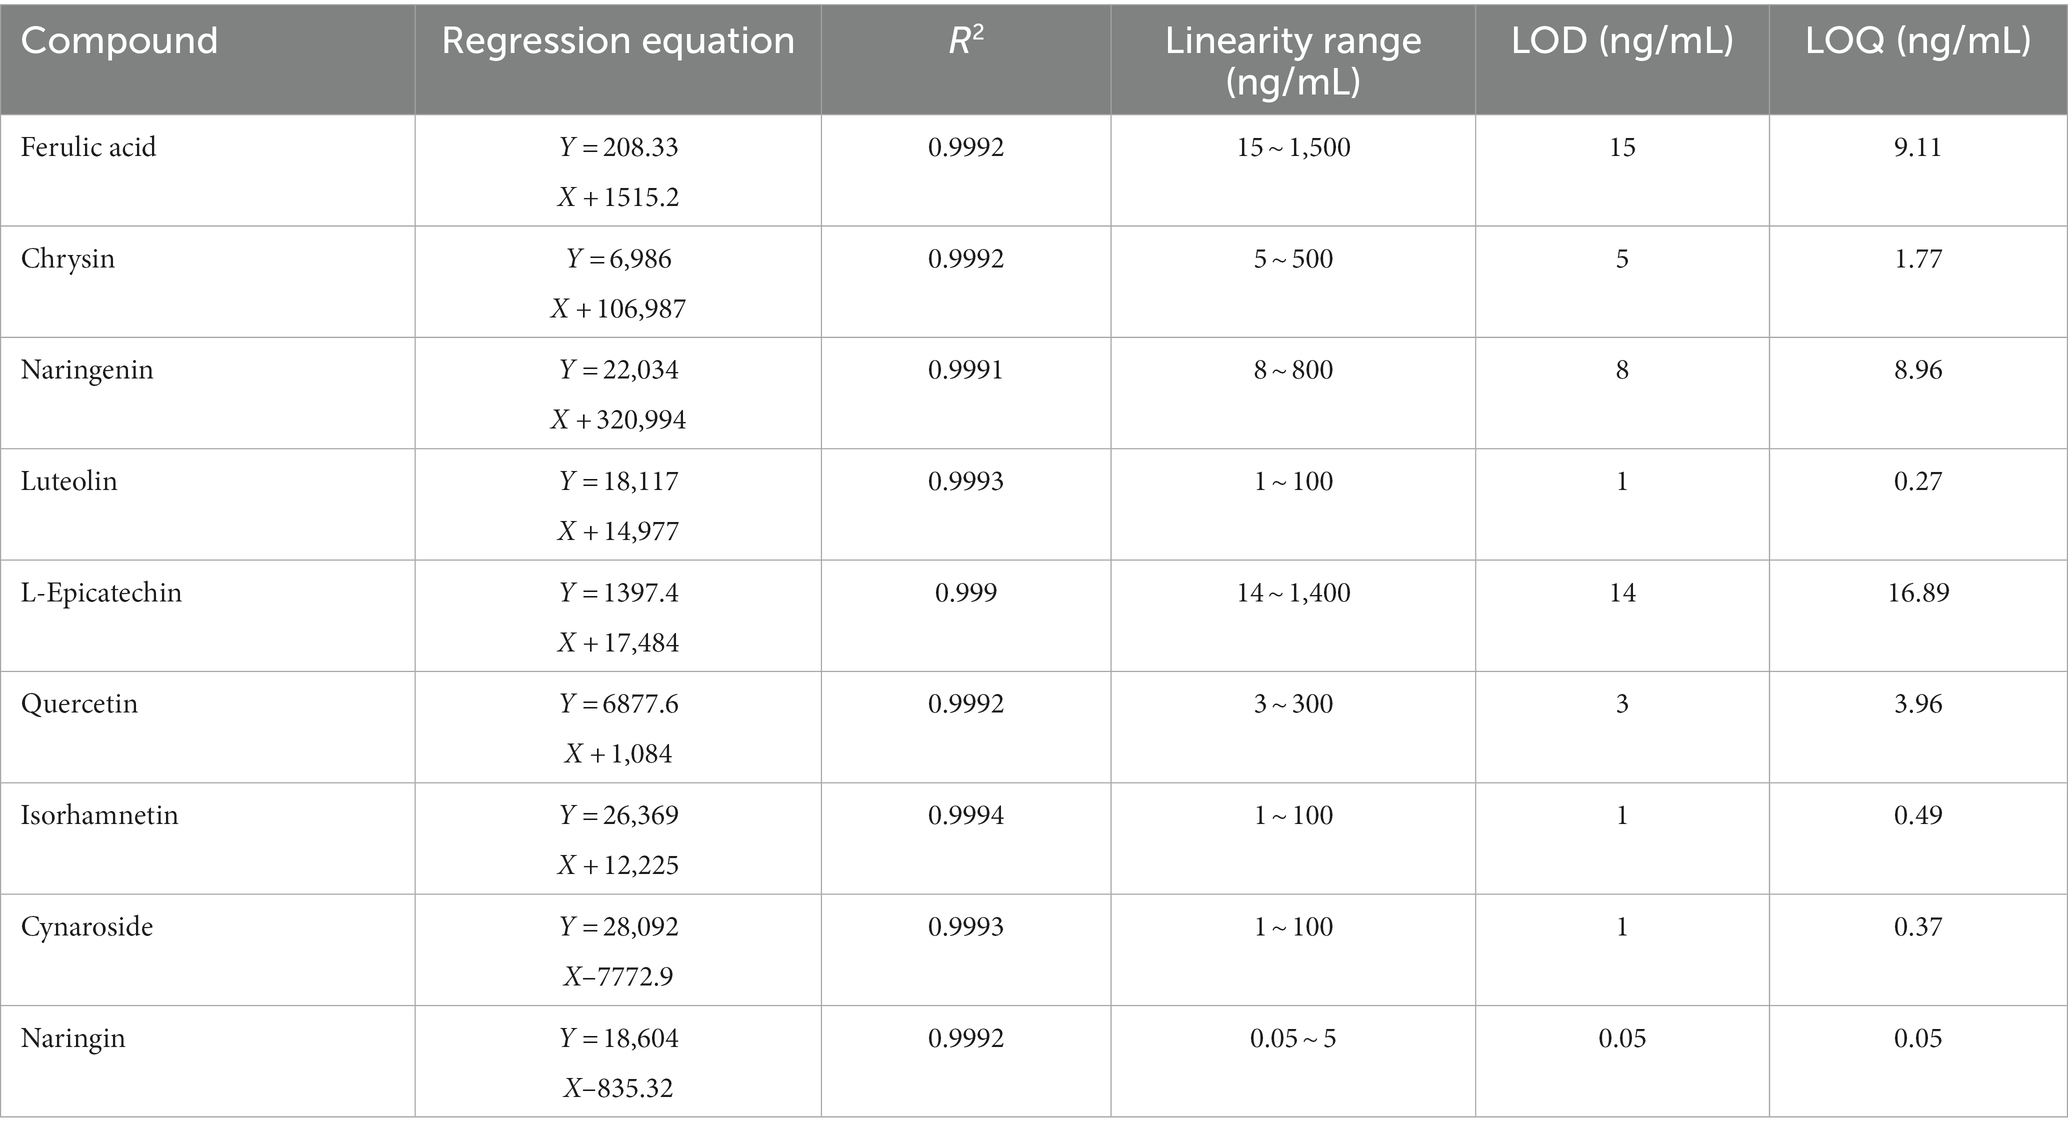
Table 2. Linear regression date of nine components.
The within-day and between-day variations were used to evaluate the precision of this UHPLC–MS/MS method for measuring D. officinale. The relative standard deviation RSD for the intraday and interday precision ranged from 1.60 to 7.49% and from 5.89 to 9.99%, respectively. Then, the relative standard deviation for repeatability and stability varies from 1.49 to 12.50%. Table 3 presents the outcomes. According to Table 4, the average recoveries of the spiked trials ranged from 79.87 to 99.15%, with RSDs between 7.02 and 16.98%. The experimental outcomes further showed that the analytical approach is reliable and capable of fulfilling the assay’s requirements.
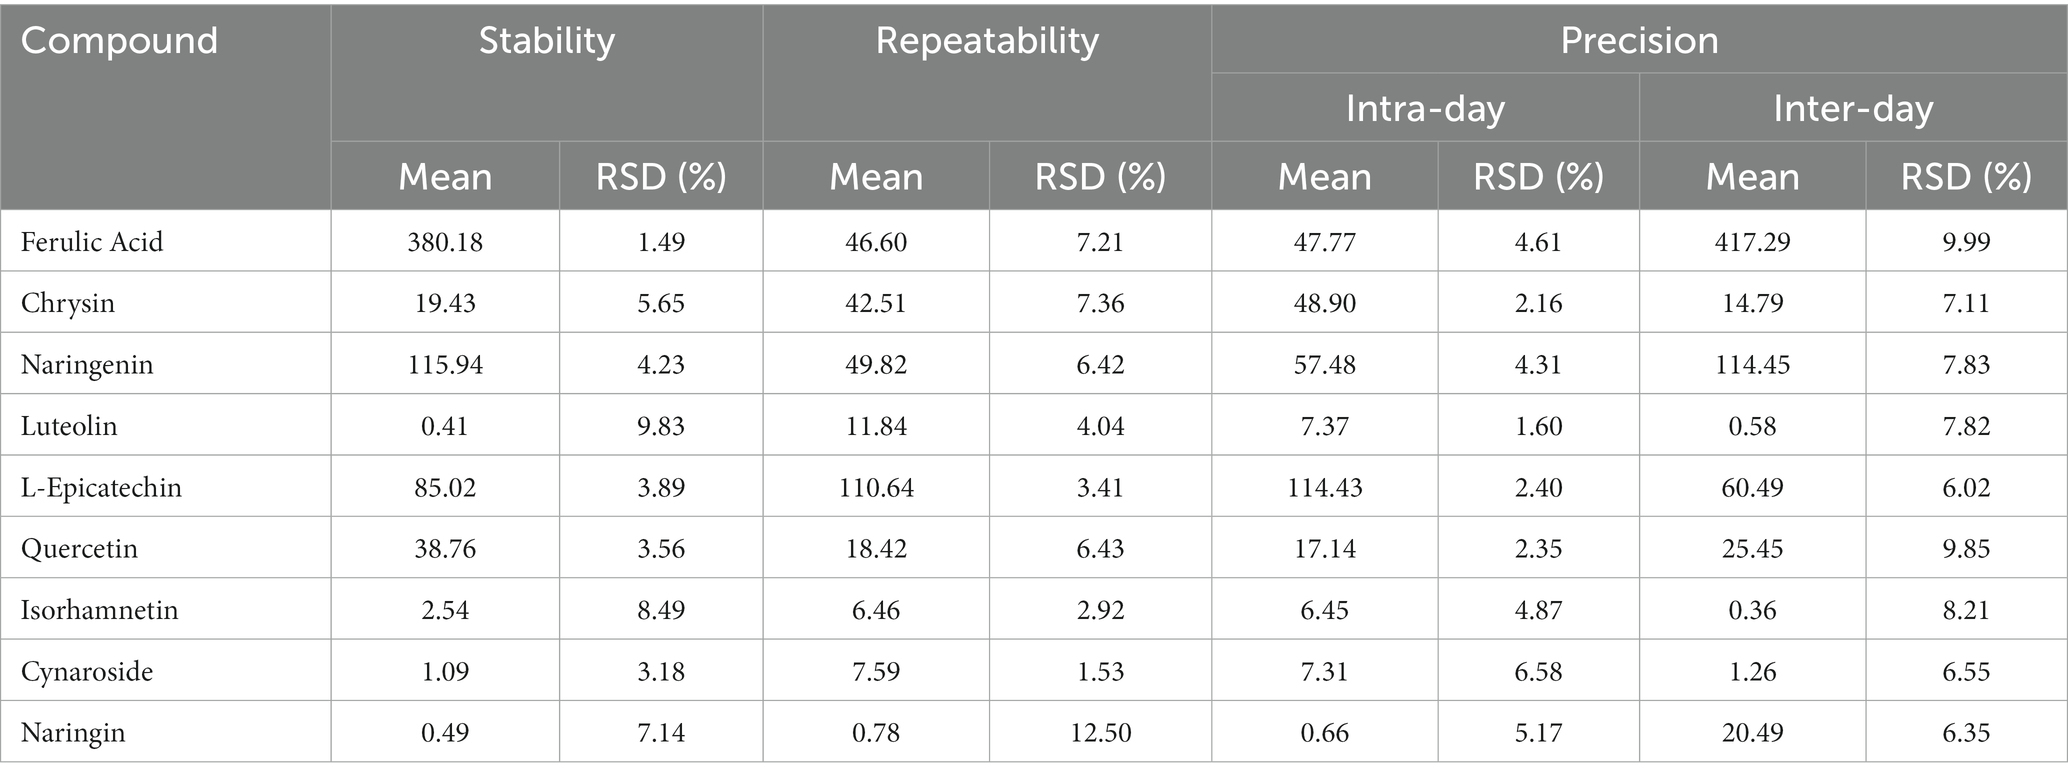
Table 3. Stability, repeatability, inter-day precision, and intra-day precision of nine components.

Table 4. Results of Dendrobium officinale spiked sample recovery experiment.
3.4. Dendrobium officinale sample analysis
The validated method is used to analyze samples from different sources. Table 5 displays the quantitative results obtained from the calibration curve. Each sample was analyzed in triplicate. A total of 9 flavonoids were detected in the D officinale samples. The ferulic acid, naringenin, and epicatechin contents were higher in each provenance than the other components, while the luteolin content was lower in each provenance. Of these, the Guangxi provenance had the highest levels of ferulic acid and L-epicatechin, at 88.27 and 109.68 μg/g, respectively. Chrysin, naringenin, quercetin, and isorhamnetin were all much more abundant in ZJ origin than they were in other compounds, while luteolin and naringenin were the least abundant of all ZJ provenances. The impacts of geographical origins and storage conditions may account for the significant variations in flavonoid composition and content between batches of D. officinale samples.
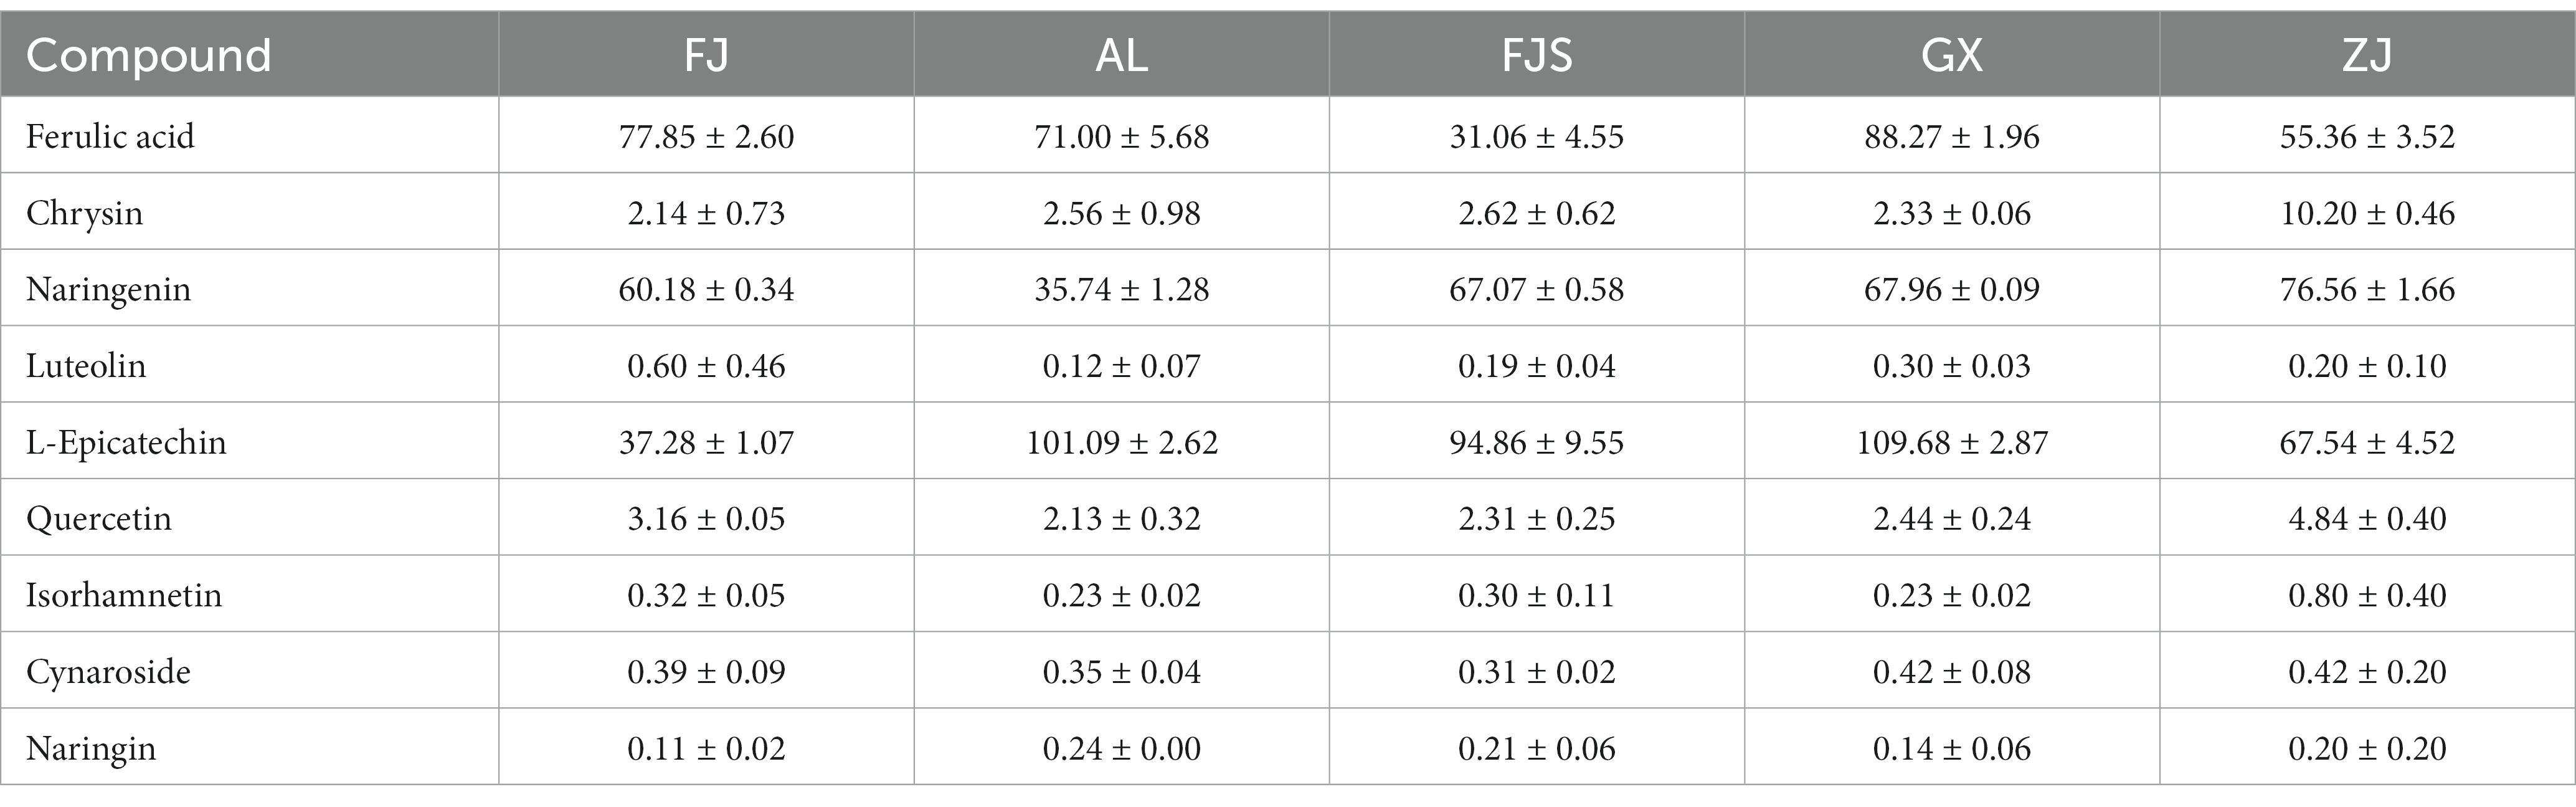
Table 5. The content of nine compounds in Dendrobium officinale samples (ng/g).
The quality of imitation wild D. officinale was properly evaluated by TOPSIS, and elevated provenances were selected based on their phenol content. D + is the distance between each treatment and the optimal index, and D − is the distance from the worst vector. The smaller the value is, the closer it is to the optimal index or the worst index. CI = D–/(D + + D–), the greater the value, the better the overall efficiency. According to the CI value of each index, the advantages and disadvantages of the 5 provenances were as follows: Zhejiang > Fujian > Guangxi > Anlong > Fanjingshan. Among them, the Anlong, Fanjingshan, and Guangxi CI values are close to the specific data shown in Table 6. The maximum CI of the ZJ provenance is 0.7296, which can be further studied and developed as a superior quality provenance (Table 6).
4. Conclusion
In this study, an effective UHPLC-QQQ-MS/MS technique for the isolation and quantification of nine phenolic compounds in D. officinale was effectively established and verified. Following optimization, samples were extracted using reflux and an aqueous solution of 80% methanol. The UHPLC-QQQ-MS/MS technology developed in the current study is precise and sensitive for quantifying the main phenolic components. Further analysis with TOPSIS using the contents of the nine phenolic compounds suggested that D. officinale should be screened for high-quality ZJ seed sources. The validation data demonstrated satisfactory linearity, precision, accuracy, repeatability, and stability. According to the findings, the UHPLC-QQQ-MS/MS approach shows excellent potential for use in the investigation of bioactive substances in herbal medicines.
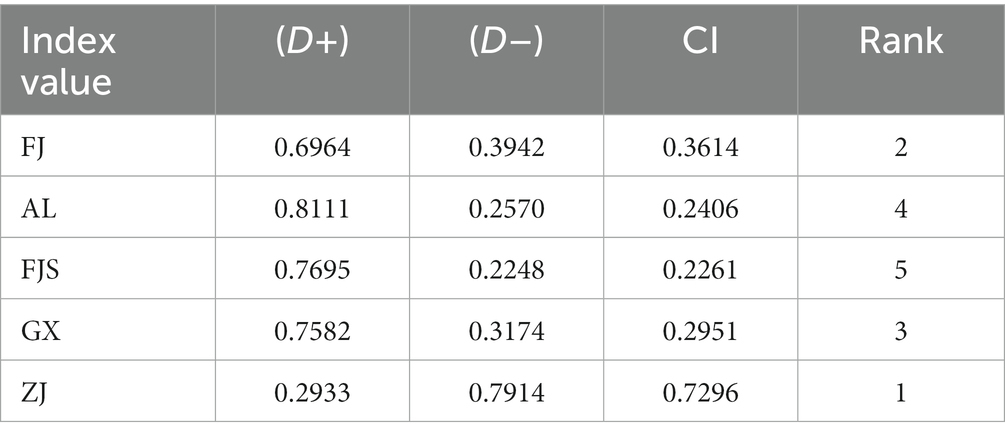
Table 6. The Technique for Order Preference by Similarity to Ideal Solution (TOPSIS) evaluation results (7).
Data availability statement
The original contributions presented in the study are included in the article/supplementary material, further inquiries can be directed to the corresponding authors.
Author contributions
YsM, LC, and XG finished all the experiments. CZ and XZ contributed to the concept development and outline arrangement, and revised the work critically for important intellectual content. YhM and SZ contributed to relevant references by collecting and drawing pictures. JM and KL analyzed the data and participated in the discussion on views in the manuscript. All authors contributed to the article and approved the submitted version.
Funding
This research was supported by Guizhou Forestry Scientific Research Project [Qianlin Kehe (202112)]; High level innovative talents training project of Guizhou Province (20154033); Guizhou Rural Industrial Revolution Dendrobium Industry Development Special Funds; He Chengyao National Medical Master Inheritance Studio.
Conflict of interest
The study’s authors affirm that there were no financial or commercial ties that might be viewed as having a potential conflict of interest.
Publisher’s note
All claims expressed in this article are solely those of the authors and do not necessarily represent those of their affiliated organizations, or those of the publisher, the editors and the reviewers. Any product that may be evaluated in this article, or claim that may be made by its manufacturer, is not guaranteed or endorsed by the publisher.
Supplementary material
The Supplementary material for this article can be found online at: https://www.frontiersin.org/articles/10.3389/fnut.2023.1129953/full#supplementary-material
Abbreviations
D. officinale , Dendrobium officinale Kimura et Migo; UHPLC-QQQ-MS/MS, ultrahigh performance liquid chromatography-triple quadrupole tandem mass spectrometry; TOPSIS, technique for order preference by similarity to ideal solution; LOD, limits of determination; LOQ, limits of quantification; D–, negative ideal solution distance; CI, composite score index.
References
1. Fu, Y, Wang, Q, Zhang, L, Ling, S, Jia, H, and Wu, Y. Dissipation, occurrence, and risk assessment of 12 pesticides in dendrobium Officinale Kimura et Migo. Ecotoxicol Environ Saf. (2021) 222:112487. Epub 2021/07/13. doi: 10.1016/j.ecoenv.2021.112487
2. Yu, ZM, Yang, ZY, da Silva, JAT, Luo, JP, and Duan, J. Influence of low temperature on physiology and bioactivity of postharvest dendrobium Officinale stems. Postharvest Biol Technol. (2019) 148:97–106. doi: 10.1016/j.postharvbio.2018.10.014
3. Chen, W, Lu, J, Zhang, J, Wu, J, Yu, L, Qin, L, et al. Traditional uses, phytochemistry, pharmacology, and quality control of Dendrobium officinale Kimura et. Migo. FPHAR. (2021) 12:726528. doi: 10.3389/fphar.2021.726528
4. Wang, Y, Tong, Y, Adejobi, OI, Wang, Y, and Liu, A. Research advances in multi-omics on the traditional Chinese herb dendrobium Officinale. Front Plant Sci. (2021) 12:808228. doi: 10.3389/fpls.2021.808228
5. Chen, W-h, Wu, J-j, Li, X-f, Lu, J-m, Wu, W, Sun, Y-q, et al. Isolation, structural properties, bioactivities of polysaccharides from Dendrobium officinale Kimura et. Migo: a review. Int J Biol Macromol. (2021) 184:1000–13. doi: 10.1016/j.ijbiomac.2021.06.156
7. Yang, L, Zhang, W, Deng, W, Wang, H, and Liu, H. Simultaneous quantification and evaluate the differences of two skeleton components in raw, salt and wine Angelicae Pubescentis radix by UPLC–MS/MS in negative/positive modes coupled with Chemometrics. J Future Foods. (2022) 2:82–90. doi: 10.1016/j.jfutfo.2022.03.020
8. Zhou, C, Xie, Z, Lei, Z, Huang, Y, and Wei, G. Simultaneous identification and determination of flavonoids in dendrobium Officinale. BMC Chem. (2018) 12:40. doi: 10.1186/s13065-018-0403-8
9. Yuan, Y, Zhang, J, Liu, X, Meng, M, Wang, J, and Lin, J. Tissue-specific transcriptome for dendrobium Officinale reveals genes involved in flavonoid biosynthesis. Genomics. (2020) 112:1781–94. doi: 10.1016/j.ygeno.2019.10.010
10. Li, M, Yue, H, Wang, Y, Guo, C, Du, Z, Jin, C, et al. Intestinal microbes derived butyrate is related to the immunomodulatory activities of Dendrobium Officinale polysaccharide. Int J Biol Macromol. (2020) 149:717–23. doi: 10.1016/j.ijbiomac.2020.01.305
11. Tang, FPS, Zhao, T, Sheng, Y, Zheng, T, Fu, L, and Zhang, Y. Dendrobium officinale Kimura et Migo: a review on its ethnopharmacology, phytochemistry, pharmacology, and industrialization. Evid Based Complement Alternat Med. (2017) 2017:7436259:1–19. doi: 10.1155/2017/7436259
12. Yang, J, Kuang, M-t, Yang, L, Huang, W, and Hu, J-m. Modern interpretation of the traditional application of Shihu–a comprehensive review on Phytochemistry and pharmacology Progress of dendrobium Officinale. J Ethnopharmacol. (2023) 302:115912. doi: 10.1016/j.jep.2022.115912
13. Xu, X, Zhang, C, Wang, N, Xu, Y, Tang, G, Xu, L, et al. Bioactivities and mechanism of actions of dendrobium Officinale: a comprehensive review. Oxidative Med Cell Longev. (2022) 2022:1–21. doi: 10.1155/2022/6293355
14. Ye, Z, Dai, JR, Zhang, CG, Lu, Y, and Wang, ZT. Chemical differentiation of Dendrobium officinale and Dendrobium devonianum by using HPLC fingerprints, HPLC-Esi-MS, and HPTLC analyses. Evid Based Complement Alternat Med. (2017) 2017:8647212:1–9. doi: 10.1155/2017/8647212
15. Xu, Z, Li, L, Xu, Y, Wang, S, and Zhao, X. Pesticide multi-residues in dendrobium Officinale Kimura et Migo: method validation, residue levels and dietary exposure risk assessment. Food Chem. (2021) 343:128490. doi: 10.1016/j.foodchem.2020.128490
16. He, T-B, Huang, Y-P, Yang, L, Liu, T-T, Gong, W-Y, Wang, X-J, et al. Structural characterization and immunomodulating activity of polysaccharide from Dendrobium officinale. Int J Biol Macromol. (2016) 83:34–41. doi: 10.1016/j.ijbiomac.2015.11.038
17. Li, J, Huang, H-Y, and Wang, Y-Z. Optimized determination of phenolic compounds in Dendrobium officinale stems by reverse-phase high performance liquid chromatography. J Liq Chromatogr Relat Technol. (2018) 41:508–16. doi: 10.1080/10826076.2018.1470983
18. Kalogiouri, NP, and Samanidou, VF. HPLC fingerprints for the characterization of walnuts and the detection of fraudulent incidents. Foods. (2021) 10:2145. doi: 10.3390/foods10092145
19. Biao, H, Wei, H, Jianhong, W, Hongmei, W, and Wei, L. Simultaneous determination of phenolic components in Dendrobium officinale stems, leaves and flowers of by UPLC–MS/MS. J Food Sci. (2021) 42:2145:7. doi: 10.7506/spkx1002-6630-20200529-363
20. Wang, J, Peng, L, Shi, M, Li, C, Zhang, Y, and Kang, W. Spectrum effect relationship and component knock-out in Angelica dahurica radix by high performance liquid chromatography-Q exactive hybrid quadrupole-Orbitrap mass spectrometer. Molecules. (2017) 22:1231. doi: 10.3390/molecules22071231
21. Zhu, A-L, Hao, J-W, Liu, L, Wang, Q, Chen, N-D, Wang, G-L, et al. Simultaneous quantification of 11 phenolic compounds and consistency evaluation in four Dendrobium species used as ingredients of the traditional Chinese medicine Shihu. Front Nutr. (2021) 8:771078. doi: 10.3389/fnut.2021.771078
22. Toth, A, Riethmuller, E, Vegh, K, Alberti, A, Beni, S, and Kery, A. Contribution of individual flavonoids in Lysimachia species to the antioxidant capacity based on HPLC-DPPH assay. Nat Prod Res. (2018) 32:2058–61. doi: 10.1080/14786419.2017.1359176
23. Fei, S, Minmin, T, Hui, W, Yufeng, Z, Kexue, Z, Xiaoai, C, et al. UHPLC–MS/MS identification, quantification of flavonoid compounds from Areca catechu L. extracts and in vitro evaluation of antioxidant and key enzyme inhibition properties involved in hyperglycemia and hypertension. Ind Crop Prod. (2022) 189:115787. doi: 10.1016/j.indcrop.2022.115787
24. Zhang, Z, Li, Q, Li, Q, Du, S, Zhou, Y, Lv, C, et al. Simultaneous determination of nineteen major components in qi she pill by ultra-high-performance liquid chromatography-tandem mass spectrometry. Acta Pharm Sin B. (2014) 4:384–93. doi: 10.1016/j.apsb.2014.05.003
25. Luo, D, Mu, T, and Sun, H. Profiling of phenolic acids and flavonoids in sweet potato (Ipomoea Batatas L.) leaves and evaluation of their anti-oxidant and hypoglycemic activities. Food Biosci. (2021) 39:100801. doi: 10.1016/j.fbio.2020.100801
26. Li, C, Cui, Y, Lu, J, Meng, L, Ma, C, Liu, Z, et al. Spectrum-effect relationship of immunologic activity of Ganoderma lucidum by UPLC–MS/MS and component knock-out method. Food Sci Human Wellness. (2021) 10:278–88. doi: 10.1016/j.fshw.2021.02.019
27. Li, W, Zhang, Y, Shi, S, Yang, G, Liu, Z, Wang, J, et al. Spectrum-effect relationship of antioxidant and tyrosinase activity with malus Pumila flowers by UPLC–MS/MS and component knock-out method. Food Chem Toxicol. (2019) 133:110754. doi: 10.1016/j.fct.2019.110754
Keywords: Dendrobium officinale , phenolic components, UHPLC-QQQ-MS/MS, provenance, method validation
Citation: Mu Y, Cheng L, Gong X, Ma J, Zhang S, Mu Y, Liang K, Zhou X and Zhao C and (2023) Simultaneous determination of nine phenolic compounds in imitation wild Dendrobium officinale samples using ultrahigh-performance liquid chromatography–tandem mass spectrometry. Front. Nutr. 10:1129953. doi: 10.3389/fnut.2023.1129953
Edited by:
Haining Zhuang, Shanghai Urban Construction Vocational College, ChinaReviewed by:
Shuzhen Mu, Key Laboratory of Chemistry for Natural Products of Guizhou Province (CAS), ChinaZhang Qianjun, Guizhou University, China
Yang Zhao, United States Food and Drug Administration, United States
Copyright © 2023 Mu, Cheng, Gong, Ma, Zhang, Mu, Liang, Zhou and Zhao. This is an open-access article distributed under the terms of the Creative Commons Attribution License (CC BY). The use, distribution or reproduction in other forums is permitted, provided the original author(s) and the copyright owner(s) are credited and that the original publication in this journal is cited, in accordance with accepted academic practice. No use, distribution or reproduction is permitted which does not comply with these terms.
*Correspondence: Chao Zhao, Y2hhb3poYW9AMTI2LmNvbQ==; Xin Zhou, YWxpY2U5ODAwQHNpbmEuY29t