 Matthew Breit1*
 Jonathan Padia2
 Tyson Marden2
 Dan Forjan2Pan Zhaoxing3
 Wenru Zhou3
 Tonmoy Ghosh4Graham Thomas5
 Megan A. McCrory6
 Edward Sazonov4
 Janine Higgins1*
- 1Department of Medicine, Division of Endocrinology, Metabolism, and Diabetes, University of Colorado Anschutz Medical Campus, Aurora, CO, United States
- 2Colorado Clinical and Translational Sciences Institute, University of Colorado Anschutz Medical Campus, Aurora, CO, United States
- 3Research Institute Biostatistics Core, Department of Pediatrics, University of Colorado Anschutz Medical Campus, Aurora, CO, United States
- 4Department of Electrical and Computer Engineering, The University of Alabama, Tuscaloosa, AL, United States
- 5Department of Psychiatry and Human Behavior, Weight Control and Diabetes Research Center, Alpert Medical School of Brown University and The Miriam Hospital, Providence, RI, United States
- 6Department of Health Sciences, Boston University, Boston, MA, United States
Introduction: The aim of this feasibility and proof-of-concept study was to examine the use of a novel wearable device for automatic food intake detection to capture the full range of free-living eating environments of adults with overweight and obesity. In this paper, we document eating environments of individuals that have not been thoroughly described previously in nutrition software as current practices rely on participant self-report and methods with limited eating environment options.
Methods: Data from 25 participants and 116 total days (7 men, 18 women, Mage = 44 ± 12 years, BMI 34.3 ± 5.2 kg/mm2), who wore the passive capture device for at least 7 consecutive days (≥12h waking hours/d) were analyzed. Data were analyzed at the participant level and stratified amongst meal type into breakfast, lunch, dinner, and snack categories. Out of 116 days, 68.1% included breakfast, 71.5% included lunch, 82.8% included dinner, and 86.2% included at least one snack.
Results: The most prevalent eating environment among all eating occasions was at home and with one or more screens in use (breakfast: 48.1%, lunch: 42.2%, dinner: 50%, and snacks: 55%), eating alone (breakfast: 75.9%, lunch: 89.2%, dinner: 74.3%, snacks: 74.3%), in the dining room (breakfast: 36.7%, lunch: 30.1%, dinner: 45.8%) or living room (snacks: 28.0%), and in multiple locations (breakfast: 44.3%, lunch: 28.8%, dinner: 44.8%, snacks: 41.3%).
Discussion: Results suggest a passive capture device can provide accurate detection of food intake in multiple eating environments. To our knowledge, this is the first study to classify eating occasions in multiple eating environments and may be a useful tool for future behavioral research studies to accurately codify eating environments.
1. Introduction
Overweight and obese populations continue to grow throughout the U.S., with currently 73.6% of U.S. adults having overweight or obesity (1). Behavior, environment, and genetic factors all contribute to the rise in overweight and obesity (2). Increasing physical activity and reducing energy intake remain the most common strategies to combat overweight and obesity. However, health extends beyond physical activity and energy intake and novel weight loss strategies are focusing on the broader health spectrum of the individual within their environment (3). The influence of environment on health and behavior can span across social structures, access to food, mental health, socioeconomic status, and a variety of influences among an individual’s daily hierarchy of priority (4, 5).
Eating environments have become of particular interest due to the role of environment on health and health behavior (6–8). Research has shown eating environment can influence energy intake (7), types of foods eaten, and rate of eating (6). Categorizing eating environments has proven challenging thus far for multiple reasons, largely dependent on an individual’s daily routine spanning across multiple environments throughout the day (4). For example, two individuals living in the same neighborhood can have vastly different eating environments based on work time and location, mode of transportation, and extracurricular activities. Social structures (i.e., living alone, with a spouse and/or children) can further complicate how eating environments can be stratified. A growing body of evidence continues to illustrate how eating environments significantly influence amounts and types of food that are eaten (7). Eating while watching the television is an example of an environmental stimulus, which has been shown to increase energy intake, and influences subsequent meals and snacking episodes (7). Watching screens while eating has also been shown to increase the rate of food consumption and reduce the time interval between eating types of food (8). Conversely, increasing the frequency of family mealtimes is positively associated with reduced energy consumption and increased intake of fruits, vegetables, whole grains, and decreased soft drink consumption (9).
Currently, the immediate free-living eating environment is assessed via 24-h recall, food record/diary, food frequency questionnaire (FFQ), or a screening questionnaire (10). Common sources of error for these methods are well documented: 24-h recalls provide random error mainly driven by recall bias; food record/diaries provide error from reactivity bias and perceived desirability of answers; FFQs have systematic error driven by lack of detail and estimation of usual intake over a period of time; screener systems have systematic error caused by lack of detail and estimating intakes over periods of time (10). Inconsistencies and inaccuracies often arise due to participant memory and heterogeneity in measures used to assess eating environment (10). Additionally, in contrast to the many validation studies documenting the energy intake accuracy of each method, to our knowledge, there are no data that validate self-report for free living eating environment against an objective measure. Furthermore, biases can emerge when a study participant is required to track meals and eating locations due to their positive and/or negative influences on dietary intake and location (10). Therefore, obtaining a catalog of possible eating environments in free-living situations and codifying eating environments to standardize data analysis has been challenging.
Novel technologies are emerging to passively capture the eating episodes of individuals (11, 12). Camera-based systems (13), body-worn sensors (14), EMG and force sensors (15, 16), and accelerometer-based monitoring systems (17) have all been proposed for passive capture of food consumption, which do not rely on self-report. Novel research involving wearable devices has been developed to alleviate the burden and accuracy problems with self-reported data and offer automatic detection and monitoring of food intake (18). A recent systematic review assessing available methods to automatically detect eating behavior found the use of facial landmarks (i.e., localize and track key points on a human face) is the most promising method for detecting eating events (19). Using novel wearable devices that automatically capture images during food and beverage intake, direct annotation of eating environment can be obtained by capturing meal images, eating location, and who someone is eating with (12). These methods have the advantage of not relying on participant memory or a previously codified but generic and incomplete list of eating environment options (12). Passive intake measurements can improve accuracy of such measurements as they are in free-living conditions and capture data without recall (12).
Our Automated Ingestion Monitor v2 (AIM-2) has the ability to capture images at and around eating episodes under controlled or free-living conditions (20). Our goal is to expand the understanding of eating environments via wearable technologies and categorize the full range of free-living eating environments that can build the framework for future behavioral nutrition studies (21, 22).
2. Methods
2.1. Participants
Data were collected from Brown University and Boston University from November 2020 through August 2021. Data collection dates occurred during several phases of COVID-19 restrictions and reopening phases that varied between both states and by time of data collection. Such restrictions changed over time. For example, limited capacity in restaurants (the lowest being 25% of capacity during some dates at Boston University site) to full capacity, remote work guidance (in office work allowed), and several indoor gathering recommendations (23, 24). The University of Alabama processed eating episode data and the Colorado Clinical and Translational Sciences Institute (CCTSI) Nutrition Core carried out analysis of eating episodes and categorization of eating environments. The Miriam Hospital Institutional Review Board (IRB) approved the study.
Inclusion/exclusion criteria were deliberately broad to recruit a range of participants from different backgrounds. All participants needed to be non-smoking, over 18 years, with a body mass index (BMI) of 27–45 kg/m2 and no previously diagnosed medical conditions that could affect their ability to eat or chew food. Participants were openly recruited via electronic newsletter on campuses and posted on lab websites. Participants interested in the study completed an online survey link to assess their eligibility and select the Boston or Rhode Island site. Online questionnaires collected basic dietary habits via an abbreviated food frequency questionnaire (FFQ) in addition to any food allergies that would influence eating behavior. Self-reported participant demographics, including height and weight to calculate BMI were collected using the online questionnaire. The abbreviated FFQ included details for foods and beverages necessary to assess total energy intake but that are difficult to assess from images, such as type of milk (skim, 2%, whole, or a variant such as soy or almond) usually used, type of salad dressing, and type of butter or mayonnaise used in sandwiches (regular, light, or no fat).
Participants were asked to wear the Automatic Ingestion Monitor (AIM-2) under free-living conditions for at least 12 h per day during waking hours for at least seven consecutive days. No additional instructions were given to participants and they were instructed to go about their normal daily lives. The AIM-2 captures eating episodes in real time within the eye gaze with use of an accelerometer and an optical sensor monitor of the temporalis muscle to detect chewing (20). Placement of the sensor is on the right leg of eyeglasses. Eight-second segments of the sensor signals are processed in real time on the AIM-2 device by a lightweight machine learning classifier based on Linear Discriminant Analysis. For each segment recognized as eating or drinking, the AIM-2 captures 3 consecutive images, each 10s apart. The image capture continues for as long as ingestion is detected, resulting in approximately 3–100 images captured for each eating event. The images and sensor signals are stored internally on an SD card. The data from the SD card are extracted at the end of the study and processed by a more powerful classification algorithm on a stand-alone PC. This algorithm further refines the detection of eating and drinking by eliminating most of the false positives.
An algorithm is used to assess compliance with device wear (25). Participant compliance was defined as a minimum of 8 h of AIM-2 wear time and a minimum of two eating episodes between midnight and 11:59 pm. Only days on which participants were compliant were included for analysis. There were 25 participants (18 female, 7 male), that met criteria with a total of 116 days of analysis. The total days analyzed of compliant wear per participant were: 1 day 20%, 2 days 8%, 3 days 8%, 4 days 8%, 5 days 16%, 6 days 8%, 7 days 12%, 8 days 20%. Three participants did not meet criteria for minimum wear time or minimum number of eating episodes. Participants (18 female, 7 male) had a mean (± SD) age of 44 ± 12 years (range: 18–63 years) and BMI of 34.3 ± 5.2 kg/m2 (range: 27.4–44.2). Participants were 60% Caucasian, 16% Hispanic or Latino, 20% Black or African American, and 4% Asian.
2.2. Eating environment categories
Eating environments were initially classified using the Nutrition Data System for Research (NDS-R) software version 2021, developed by the Nutrition Coordinating Center (NCC), University of Minnesota, Minneapolis, MN. Upon initial analysis, further expansion from the NDS-R eating environments was warranted, as there were a significant number of eating environments that fell beyond the NDS-R definitions. For example, within the “home” environment, which is a single location category in NDS-R, we observed eating in the living room, bedroom, bathroom, and kitchen. The approach to eating behavior is likely different in each of these home sub-locations, which led to the development of subsets for the “home” category. Five additional sub-locations were added to the home category to include home bedroom, home living room, home (outside), and home dining room. The outside category was defined as any eating episode eaten outside. Eating episodes with a screen were defined as any screen that was used during the eating episode and includes TVs, computers, phones, or tablets. The NDS-R travel category, which combines all modes of transport (car, airport, and train/bus) was expanded as to classify modes individually as car, air, and train/bus (Table 1). This study was conducted during the third wave of COVID, so air travel was rare.
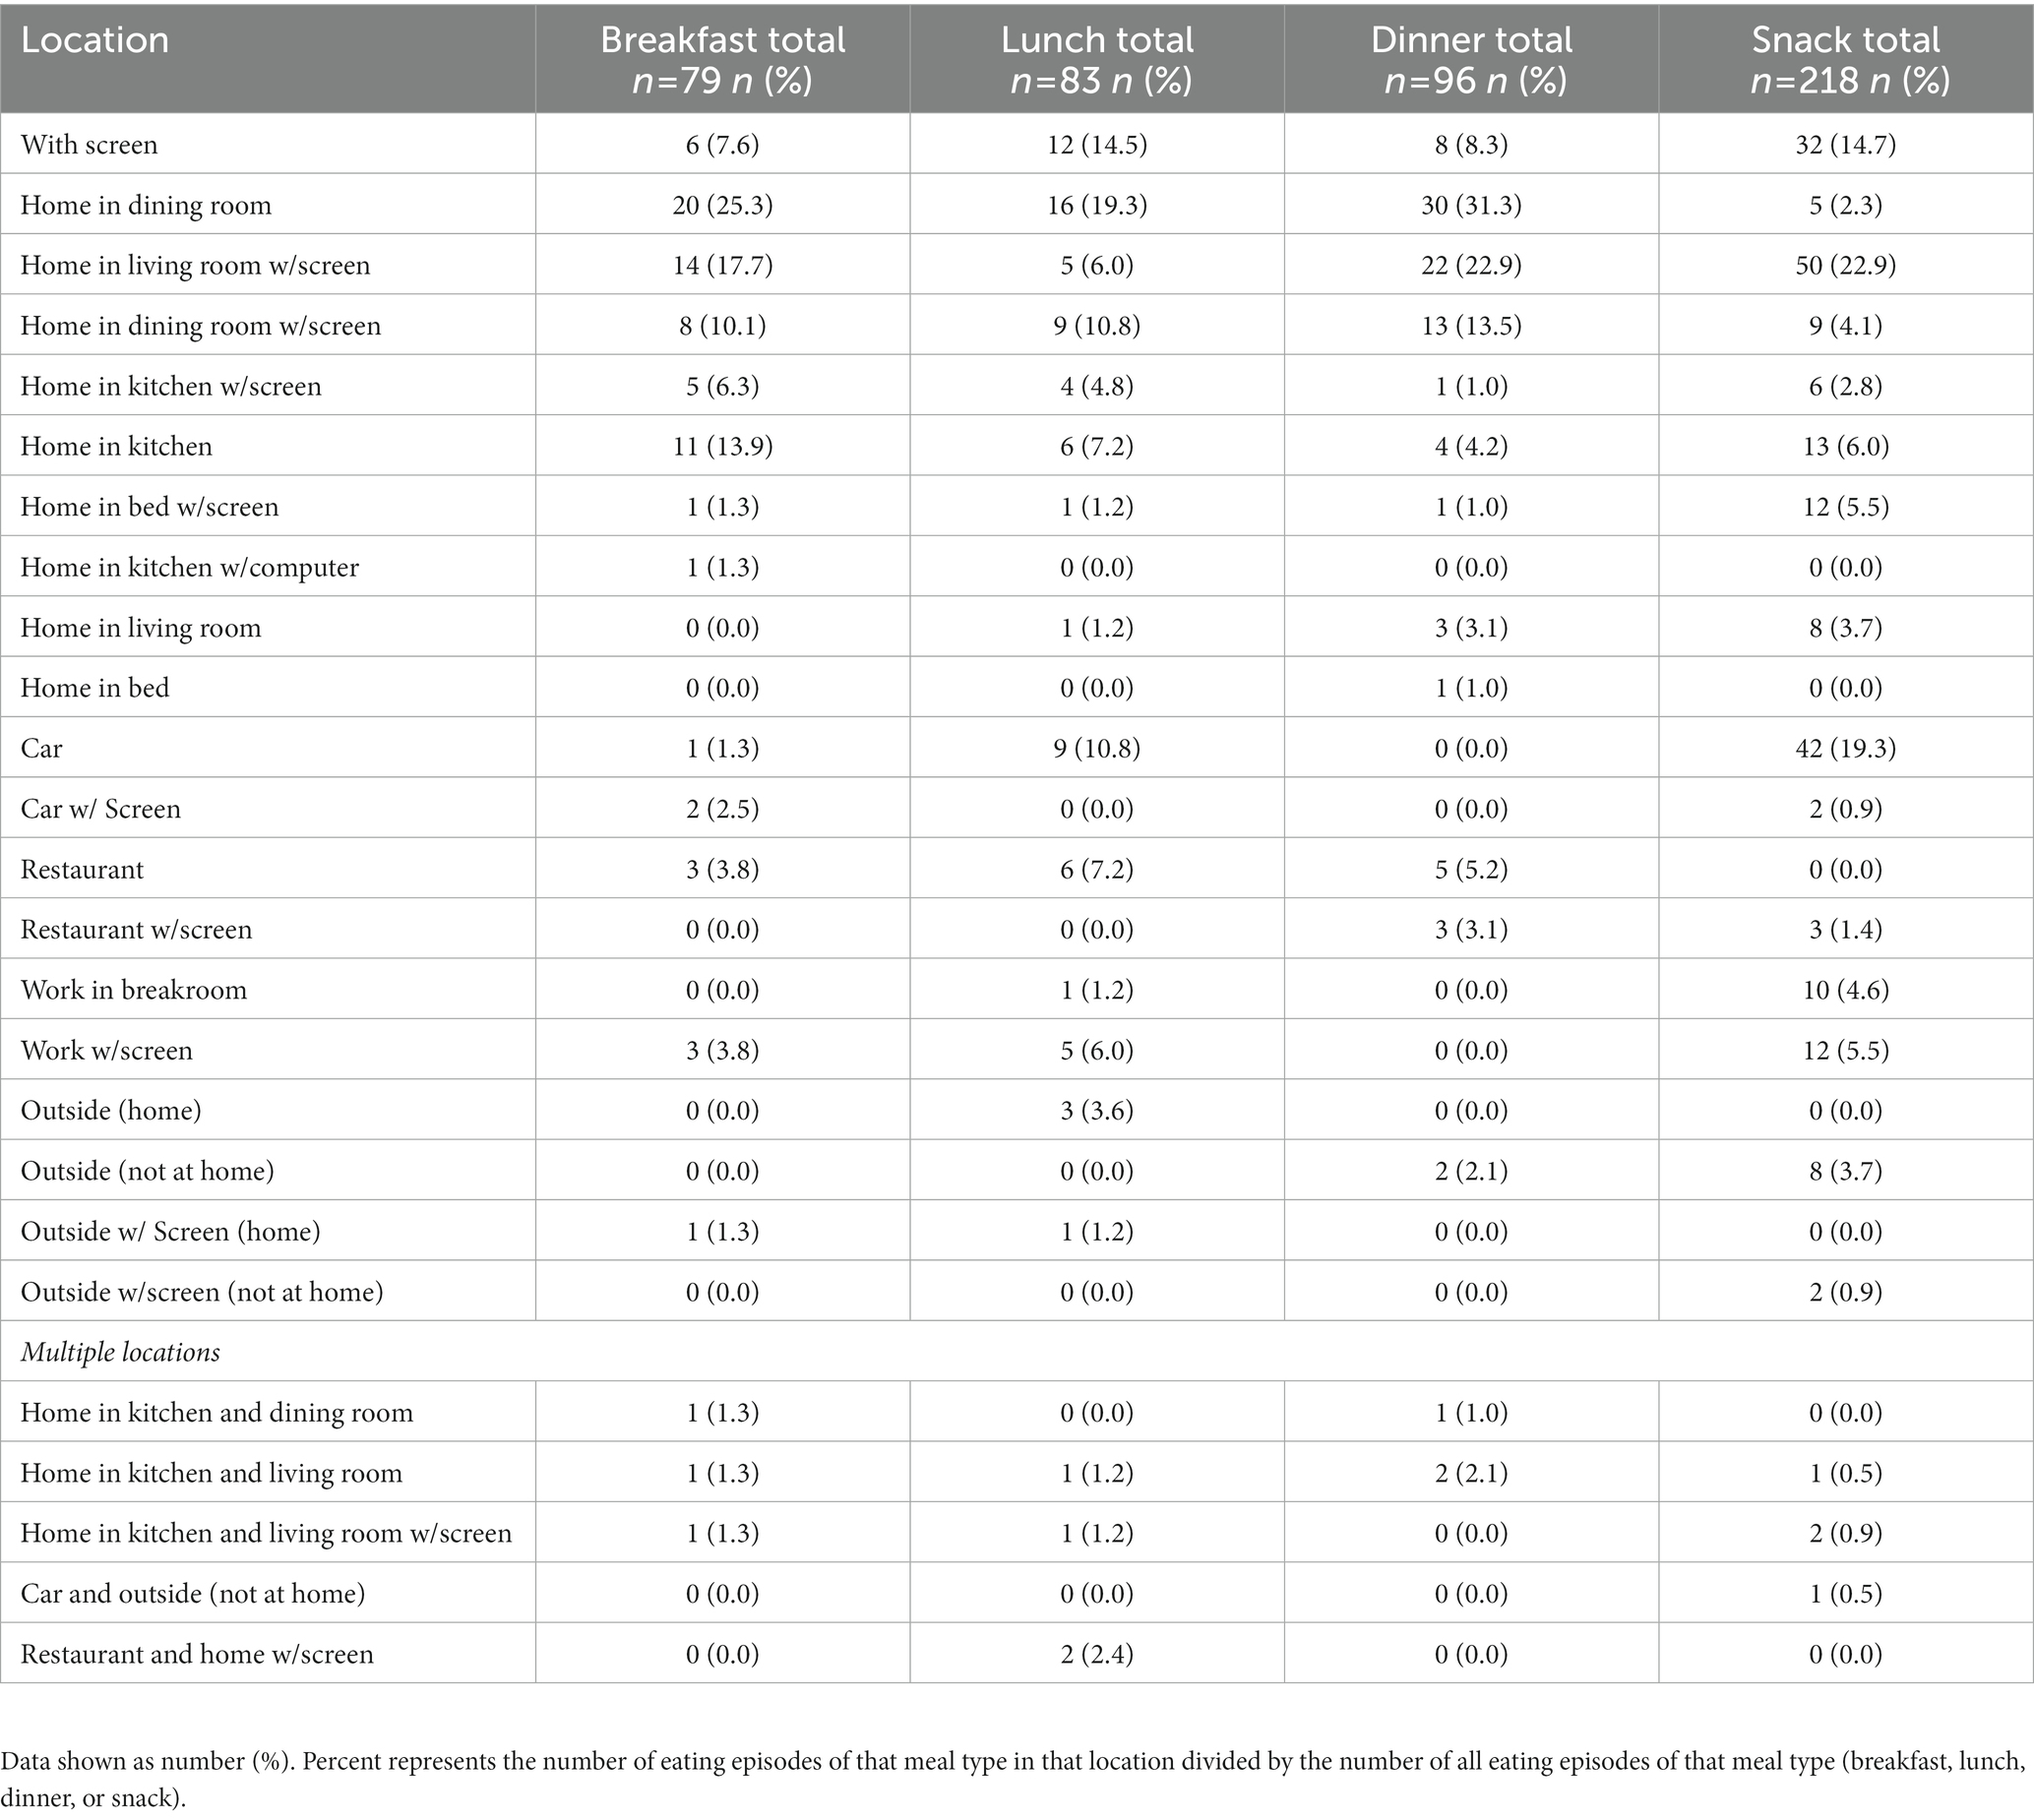
Table 1. Number of eating episodes at each meal, stratified to include multiple eating locations during a single eating episode and eating occasions with a screen present.
2.3. Classification of eating environments by meal type and location
Eating environments were classified manually by examining each image associated with eating episodes. All analysis was conducted within the AIM-2 annotation software (20). Three trained nutritionists from the CCTSI Nutrition Core classified eating environment/s per eating episode. For each day of compliant AIM-2 wear, the date, wear time, number of eating episodes, and eating environment were recorded. If another person was observed in any image/s during an eating episode captured by the AIM-2, they were counted as a person that the meal was eaten with. Any individual that appeared to be under 18 years of age upon visual assessment was counted as a child. As participants are mobile in a free-living setting, multiple eating environments were indicated if a participant changed environment during an eating episode, i.e., started eating in the kitchen but then moved to the living room.
Assessing mealtimes for standard meals (breakfast, lunch, dinner, snack) proved to be difficult as this is highly variable among individuals. A priori mealtimes were defined as: Breakfast-6:00 a.m. to 10:00 a.m.; Lunch-12:00 p.m. to 2:00 p.m.; Dinner-6:00 p.m. to 8:00 p.m. Snacks were defined as eating episodes that occurred outside of these times. Upon initial analysis, 26.7% of days had no “meals” as designated by the a priori definition of mealtimes but did have multiple snacks throughout the day. A single nutritionist retrospectively analyzed all days with multiple snacks but no designated meals. This involved manual classification into a meal if, for example, the eating episode was outside of the mealtime definition but was a substantial meal, i.e., a large spaghetti entrée, sandwich, pizza, etc. Participant ID, date, eating episode, designation change, and the rationale behind manual change was recorded. A meal was classified as having three or more separate food components, accounting for more than 10% of total number of foods consumed over the day, and the participant had to consume over 25% of the meal. As these variabilities were vital in classifying environments, the dataset with the retrospective analysis were used.
The incidence of eating locations was tabulated descriptively using percent distribution, with the total number of eating episodes for a particular meal type as the denominator. If an eating episode occurred in more than one environment, each environment contributed to the denominator of the calculation for environment specific incidence. For example, if a participant started eating at home in the kitchen then took the meal to their home living room, this would count as two eating environments for a single eating episode.
3. Results
Of the 116 days analyzed, 68% included a breakfast, 72% included a lunch, 83% included a dinner, and 86% included at least one snack. Distribution of breakfast location indicated that 36.7% of eating episodes occurred within the home dining room, 25.3% within the home kitchen, 20.3% within the home living room, with all other categories occurring under 5.1%. In addition, 48.1% of eating episodes occurred with a screen (Figure 1A). Eating episodes in multiple eating environments accounted for 44.3% of all eating episodes. As eating with a screen was tallied as a separate environment, data were further stratified to indicate the distribution of multiple eating environment locations to include eating environments with a screen and/or multiple locations (Table 1). Breakfast eating episodes were mostly eaten alone (75.9%).
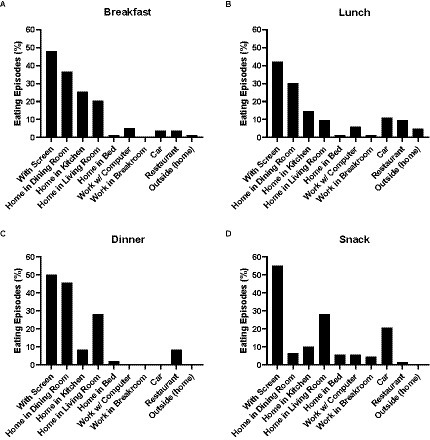
Figure 1. Eating environment distribution (non-stratified) at (A) Breakfast; (B) Lunch; (C) Dinner; (D) Snack.
Lunch eating episode distribution indicated that 30.1% of eating episodes occurred within the home dining room, 14.5% within the home kitchen, and 10.8% in a car, with all other categories occurring less than 10%. 42.2% of lunches occurred with a screen (Figure 1B). Eating episodes in multiple environments accounted for 28.8% of eating episodes. Data were further stratified to analyze multiple locations (Table 1). Eating lunch alone accounted for 67.5% of all episodes.
Distribution of dinner location indicated 45.8% of eating episodes occurred within the home dining room, 28.1% within the home living room, and all other categories occurring in less than 9% of eating episodes. 50% of dinners occurred with a screen (Figure 1C). Eating environments in multiple places accounted for 44.8% of eating episodes with all data further stratified to indicate multiple environments (Table 1). Eating dinner alone accounted for 74.3% of all dinners.
Snacking episodes occurred 28% within the home living room, 20.6% within a car, with all other categories occurring less than 10.1%. 55% of snacks occurred with a screen (Figure 1D). Eating episodes in multiple environments occurred with 41.3% of all episodes with all data further stratified by locations (Table 1). Eating snacks alone occurred in 74.3% of all snacks.
4. Discussion
This proof-of-concept study examined the use of the AIM-2 device to capture the spectrum of eating environments of individuals with obesity in free-living conditions. Results showed that the AIM-2 was successful in capturing substantially more eating environments and providing a richer dataset of combined eating environments compared to NDS-R or any currently available nutrition questionnaire. Results indicated eating at home and with a screen was the most prevalent eating environment among all eating occasions. Of the remaining eating environments, the most common were eating alone, eating at home in the living or dining room, and eating in multiple locations. To our knowledge, this is the first study to classify a single eating episode occurring across multiple eating environments. This may be because this was not previously a codified option in existing nutrition software or questionnaires.
NDS-R is commonly used for eating environment analysis; however, NDS-R meal locations are broad (i.e., home, work, other) and do not capture the nuances of each location (i.e., home – bedroom, bathroom, kitchen, living room, with or without screens, work – breakroom, on laptop, outside, etc.). For example, in the “home” environment, we observed individuals eating in the living room, bathroom, bedroom, and kitchen. This study expanded on codified eating environments and captured significantly more eating environments where an individual consumes food than commonly used software or questionnaires. In addition, other environments not encountered or taken into account in this study are possible, such as school/university, store/mall, etc. Given that this study was conducted during the third wave of COVID, it is possible that future studies may encounter eating environments that we have not categorized. These might include eating at a party or banquet and eating on different forms of public transport. Even though many participants wore the AIM-2 when there were few or no local COVID restrictions, some participants may have chosen to avoid crowded spaces and communal eating. This could be one reason that we observed many meals and snacks being eaten alone. In addition, this study examined only the eating environments of adults with overweight or obesity that cannot be extrapolated to other populations, such as lean adults or children, who eat more often in a family context or in groups at school. Therefore, further research is needed to fully categorize and compare the eating environments of different populations. Data obtained in the current study demonstrate that the AIM-2 device would be valuable for such future research.
The finding of >65% of meals eaten at home in this study differs compared to the National Health and Nutrition Examination Survey (NHANES) data from 2013 to 2014, showing that 50% of daily energy intake occurred outside the home (26). Moreover, the data from the 2011–2018 NHANES showed that 65% US adults consumed ≥2 meals/week outside of the home (27). Our high rate of eating at home may have resulted from public health orders during the coronavirus disease 19 (COVID-19) pandemic. This study was conducted during wave 3 of the pandemic (Nov 2020-Aug 2021) and individuals were confined to their homes at a higher rate than normal for part of this time period. Even after many COVID restrictions were lifted, some participants may have chosen to continue to avoid crowded spaces and communal eating. Future research should build upon this dataset by examining eating environments when no public health restrictions are in place.
We show that 31.9% of days contained no breakfast meal, which is consistent with 2015–2018 NHANES data, showing 15.6% of adults skip breakfast (28). Aurélie Ballon et al. conducted a meta-analysis of 96,175 participants from prospective cohort studies and showed that skipping breakfast 4–5 d/week is associated with a 55% higher risk of developing type 2 diabetes mellitus (T2DM) (29). The high prevalence of snacks throughout the day (85.3% of days with ≥1 snack/day) also is consistent with 2015–2016 NHANES data, showing that 86% of adults reported at least one snack/day, contributing 23% of energy intake throughout the day (30). A review by Skoczek et al. showed the consumption of energy-dense snacks contributes to higher energy intake and body weight in adults (31). The results of this study shed light on snacking occasions and the eating environments they occur in, which commonly include eating in the car. Codifying and defining the eating environment of snacks may provide additional specificity to behavioral interventions aimed at energy restriction for weight loss and/or maintenance.
In this study, more than 50% of all meals were eaten with a screen. Prior to the COVID-19 pandemic, a study had shown 30% of all eating occasions occurring at non-designated eating places, such as with a screen or watching television (32). The high prevalence of eating occasions with screens in this study was not surprising as studies have shown significant increases in screen time and digital device use during the COVID-19 lockdown period across the globe (33, 34). Research from nine European countries involving 4,108 participants found a 65% increase in screen time during the pandemic (33). In a study from Tebar et al., increased screen time during the COVID-19 pandemic was associated with increased sweetened food consumption and increased desire to drink alcoholic beverages (35). Several pre-pandemic studies have shown that energy intake is increased while watching the television (8, 36, 37). Increased screen time during food consumption has been thought to reduce mindful eating. Mindful and intuitive eating constitute an awareness of the present moment while eating (38) and consists of making conscious food choices, an awareness of psychological vs. physical hunger, and eating healthfully in response to those cues (39, 40). The results of this study point to high screen usage, which can reduce mindful eating. This aspect of eating environments, in particular the high prevalence of eating in multiple locations with screens at a single episode, needs to be studied further to determine the direct effects of this behavior on energy and nutrient intake.
This is the first study to examine the prevalence of multiple eating locations during a single meal. Overall, 39.8% of all meals were eaten in multiple locations in and outside of the home. Ogden et al. reported that “eating on the go” disinhibits eating restraint which results in overeating (41). Studies indicate that social interaction may influence eating behavior by increasing meal size and energy intake during meals (42). In this study, 73% of all meals were eaten alone. De Castro et al. found that people consume 50% more food when eating in groups than eating alone (43). The implications of eating alone vs. eating with others in the many locations that we have categorized needs to be studied further.
Strengths of this study include the AIM-2 camera capturing images every 10s when eating was detected, allowing for detection of food intake in multiple eating environments in real-time. The custom-designed software allowed for review of images associated with food intake events as detected by sensors and codifying the eating environments in real time. Limitations of this study include a small sample size and manual codification of eating environments which may lead to errors in location detection. Additionally, the a priori designation of mealtimes did not fit one quarter of participants’ circadian patterns. In future studies, this limitation could be addressed by defining meals as a percentage of daily energy or a combination of energy intake and number of food items. Additionally, using the AIM-2 to capture eating episodes has the potential for reactivity bias when participants know that we will be assessing eating habits. It is likely that participant instructions to adhere to their regular activities of daily living, including eating, will not overcome reactivity bias, but wearing the device for multiple days likely decreased the chances that any dietary intake changes would persist throughout the entire period.
5. Conclusion
The present study sheds light on the multiple eating environments encountered during free-living that have not previously been documented. Our findings indicate that individuals consumed a majority of meals at home with a screen, alone, and often in multiple rooms during the same eating occasion. Future studies should investigate the correlation of eating environments with energy intake and participant characteristics to facilitate personalized nutrition interventions.
Data availability statement
The original contributions presented in the study are included in the article/supplementary material, further inquiries can be directed to the corresponding authors.
Ethics statement
The studies involving human participants were reviewed and approved by University of Rhode Island Institutional Review Board (URI IRB). The patients/participants provided their written informed consent to participate in this study.
Author contributions
JH, MM, and ES designed the study. MM and GT collected the data. TM, JP, DF, and TG analyzed the data. PZ and WZ performed statistical analysis. JH, MM, GT, TM, MB, JP, and ES provided data interpretation. MB and JP wrote the manuscript draft. All authors reviewed and edited the manuscript and approved the final manuscript. All authors contributed to the article and approved the submitted version.
Funding
This work was supported by the National Institutes of Health through the National Institute of Diabetes and Digestive and Kidney Diseases award numbers R21DK085462 and R01DK100796 and National Center for Advancing Translational Sciences award number U01TR002535.
Conflict of interest
GT is a consultant and advisory board member for the Lumme Health, Inc. and the Medifast Inc. MM serves on the Avocado Nutrition Science Advisory for the Haas Avocado Board.
The remaining authors declare that the research was conducted in the absence of any commercial or financial relationships that could be construed as a potential conflict of interest.
Publisher’s note
All claims expressed in this article are solely those of the authors and do not necessarily represent those of their affiliated organizations, or those of the publisher, the editors and the reviewers. Any product that may be evaluated in this article, or claim that may be made by its manufacturer, is not guaranteed or endorsed by the publisher.
References
1. Fryar, CD, Carroll, MD, and Afful, J. Prevalence of overweight, obesity, and severe obesity among adults aged 20 and over: United States, 1960–1962 through 2017–2018. NCHS Health E-Stats (2020).
2. Centers for Disease Control and Prevention . (2018). Behavior, environment, and genetic factors all have a role in causing people to be overweight or obese. Available at: https://www.cdc.gov/genomics/resources/diseases/obesity/index.htm (Accessed August 8, 2022).
3. Swinburn, B, Egger, G, and Raza, F. Dissecting obesogenic environments: the development and application of a framework for identifying and prioritizing environmental interventions for obesity. Prev Med. (1999) 29:563–08. doi: 10.1006/pmed.1999.0585
4. Kremers, SP, de Bruijn, GJ, Visscher, TL, van Mechelen, W, de Vries, NK, and Brug, J. Environmental influences on energy balance-related behaviors: a dual-process view. Int J Behav Nutr Phys Act. (2006) 3:9. doi: 10.1186/1479-5868-3-9
5. Ball, K, Timperio, AF, and Crawford, DA. Understanding environmental influences on nutrition and physical activity behaviors: where should we look and what should we count? Int J Behav Nutr Phys Act. (2006) 3:33. doi: 10.1186/1479-5868-3-33
6. Souza, T, Andrade, G, Rauber, F, Levy, R, and Da Costa Louzada, M. Consumption of ultra-processed foods and the eating location: can they be associated? Br J Nutr. (2022) 128:1587–94. doi: 10.1017/S0007114521004992
7. Lock, C, Brindal, E, Hendrie, GA, and Cox, DN. Contextual and environmental influences on reported dietary energy intake at evening eating occasions. Eat Behav. (2016) 21:155–08. doi: 10.1016/j.eatbeh.2016.03.012
8. Blass, EM, Anderson, DR, Kirkorian, HL, Pempek, TA, Price, I, and Koleini, M. On the road to obesity: television viewing increases intake of high-density foods. Physiol Behav. (2006) 88:597–604. doi: 10.1016/j.physbeh.2006.05.035
9. Melo GR, DAE, Silva, PO, Nakabayashi, J, Bandeira, MV, Toral, N, and Monteiro, R. Family meal frequency and its association with food consumption and nutritional status in adolescents: a systematic review. PLoS One. (2020) 15:e0239274. doi: 10.1371/journal.pone.0239274
10. Kirkpatrick, SI, Reedy, J, Butler, EN, Dodd, KW, Subar, AF, Thompson, FE, et al. Dietary assessment in food environment research: a systematic review. Am J Prev Med. (2014) 46:94–2. doi: 10.1016/j.amepre.2013.08.015
11. Fontana, JM, Farooq, M, and Sazonov, E. Automatic ingestion monitor: a novel wearable device for monitoring of ingestive behavior. IEEE Trans Biomed Eng. (2014) 61:1772–9. doi: 10.1109/TBME.2014.2306773
12. Doulah, A, Ghosh, T, Hossain, D, Marden, T, Parton, JM, Higgins, JA, et al. Energy intake estimation using a novel wearable sensor and food images in a laboratory (pseudo-free-living) meal setting: quantification and contribution of sources of error. Int J Obes. (2022) 46:2050–7. doi: 10.1038/s41366-022-01225-w
13. Schmalz, M.S., Helal, A., and Mendez-Vasquez, A. Algorithms for the detection of chewing behavior in dietary monitoring applications. Proceedings of the SPIE mathematics for signal and information processing San Diego, CA, USA. (2009).
14. Cadavid, S, Abdel-Mottaleb, M, and Helal, A. Exploiting visual quasi-periodicity for real-time chewing event detection using active appearance models and support vector machines. Pers Ubiquitous Comput. (2011) 16:729–9. doi: 10.1007/s00779-011-0425-x
15. Fueki, K, Sugiura, T, Yoshida, E, and Igarashi, Y. Association between food mixing ability and electromyographic activity of jaw-closing muscles during chewing of a wax cube. J Oral Rehabil. (2008) 35:345–52. doi: 10.1111/j.1365-2842.2008.01849.x
16. Bousdras, VA, Cunningham, JL, Ferguson-Pell, M, Bamber, MA, Sindet-Pedersen, S, Blunn, G, et al. A novel approach to bite force measurements in a porcine model in vivo. Int J Oral Maxillofac Surg. (2006) 35:663–7. doi: 10.1016/j.ijom.2006.01.023
17. Wang, S., Zhou, G., Hu, L., Chen, Z., and Chen, Y. CARE: chewing activity recognition using noninvasive single Axis accelerometer. Proceedings of the 2015 ACM international joint conference on pervasive and ubiquitous computing and proceedings of the 2015 ACM international symposium on wearable computers Osaka, Japan (2015). 109–2.
18. Farooq, M, and Sazonov, E. A novel wearable device for food intake and physical activity recognition. Sensors (Basel). (2016) 16:1067. doi: 10.3390/s16071067
19. Tufano, M, Lasschuijt, M, Chauhan, A, Feskens, EJM, and Camps, G. Capturing eating behavior from video analysis: a systematic review. Nutrients. (2022) 14:4847. doi: 10.3390/nu14224847
20. Doulah, A, Ghosh, T, Hossain, D, Imtiaz, MH, and Sazonov, E. Automatic ingestion monitor version 2″ – a novel wearable device for automatic food intake detection and passive capture of food images. IEEE J Biomed Health Inform. (2021) 25:568–6. doi: 10.1109/JBHI.2020.2995473
21. Farooq, M, and Sazonov, E. Detection of chewing from piezoelectric film sensor signals using ensemble classifiers. Annu Int Conf IEEE Eng Med Biol Soc. (2016) 2016:4929–32. doi: 10.1109/EMBC.2016.7591833
22. State of Rhode Island . (2020). Ninety-fifth supplemental emergency declaration-Rhode island on pause. State of Rhode Island. Available at: https://governor.ri.gov/executive-orders/executive-order-20-100 (Accessed February 17, 2022).
23. Commonwealth of Massachusetts . Phased reopening plan. Executive Office of Housing and Economic Development. Massachusetts: Commonwealth of Massachusetts (2020).
24. McClung, HL, Ptomey, LT, Shook, RP, Aggarwal, A, Gorczyca, AM, Sazonov, ES, et al. Dietary intake and physical activity assessment: current tools, techniques, and technologies for use in adult populations. Am J Prev Med. (2018) 55:e93–e104. doi: 10.1016/j.amepre.2018.06.011
25. Ghosh, T, Hossain, D, and Sazonov, E. Detection of food intake Sensor's Wear compliance in free-living. IEEE Sensors J. (2021) 21:27728–35. doi: 10.1109/jsen.2021.3124203
26. Saksena, M., Okrent, A., Tobenna, D., Anekwe, C.C., Dicken, C., Effland, A., et al. America’s eating habits, food away from home. U.S. Department of Agriculture, Economic Research Service, EIB-196.c2021 [updated 2018 Sep, cited 2021 Nov] (2021).
27. Nagao-Sato, S, and Reicks, M. Food away from home frequency, diet quality, and health: cross-sectional analysis of NHANES data 2011-2018. Nutrients. (2022) 14:3386. doi: 10.3390/nu14163386
28. Terry, Al, and Wambogo, E. QuickStats: percentage of adults aged ≥20 years consuming breakfast on a given day, by sex and age — United States, 2015–2018. MMWR Morb Mortal Wkly Rep. (2021) 69:1665. doi: 10.15585/mmwr.mm695152a9
29. Ballon, A, Neuenschwander, M, and Schlesinger, S. Breakfast skipping is associated with increased risk of type 2 diabetes among adults: a systematic review and Meta-analysis of prospective cohort studies. J Nutr. (2019) 149:106–3. doi: 10.1093/jn/nxy194
30. Morton, S, Rhodes, D, and Moshfegh, A. Where do adults obtain snacks? What we eat in America, NHANES, 2013–2016. Curr Dev Nutrit. (2019) 3:115–9. doi: 10.1093/cdn/nzz039
31. Skoczek-Rubińska, A, and Bajerska, J. The consumption of energy dense snacks and some contextual factors of snacking may contribute to higher energy intake and body weight in adults. Nutr Res. (2021) 96:20–36. doi: 10.1016/j.nutres.2021.11.001
32. Liu, JL, Han, B, and Cohen, DA. Associations between eating occasions and places of consumption among adults. Appetite. (2014) 87:199–4. doi: 10.1016/j.appet.2014.12.217
33. Pišot, S, Milovanović, I, Šimunič, B, Gentile, A, Bosnar, K, Prot, F, et al. Maintaining everyday life praxis in the time of COVID-19 pandemic measures (ELP-COVID-19 survey). Eur J Pub Health. (2020) 30:1181–6. doi: 10.1093/eurpub/ckaa157
34. Richa, A, Alka, T, Ahmed, KI, and Mohit, A. Effect of increased screen time on eyes during COVID-19 pandemic. J Family Med Prim Care. (2022) 11:3642–7. doi: 10.4103/jfmpc.jfmpc_2219_21
35. Tebar, WR, Christofaro, DGD, Diniz, TA, Lofrano-Prado, MC, Botero, JP, Correia, MA, et al. Increased screen time is associated with alcohol desire and sweetened foods consumption during the COVID-19 pandemic. Front Nutr. (2021) 8:630586. doi: 10.3389/fnut.2021.630586
36. Bellisle, F, Dalix, AM, and Slama, G. Non food-related environmental stimuli induce increased meal intake in healthy women: comparison of television viewing versus listening to a recorded story in laboratory settings. Appetite. (2004) 43:175–08. doi: 10.1016/j.appet.2004.04.004
37. Temple, JL, Giacomelli, AM, Kent, KM, Roemmich, JN, and Epstein, LH. Television watching increases motivated responding for food and energy intake in children. Am J Clin Nutr. (2007) 85:355–1. doi: 10.1093/ajcn/85.2.355
38. Hendrickson, KL, and Rasmussen, EB. Effects of mindful eating training on delay and probability discounting for food and money in obese and healthy-weight individuals. Behav Res Ther. (2013) 51:399–9. doi: 10.1016/j.brat.2013.04.002
39. Miller, CK, Kristeller, JL, Headings, A, and Nagaraja, H. Comparison of a mindful eating intervention to a diabetes self-management intervention among adults with type 2 diabetes: a randomized controlled trial. Health Educ Behav. (2014) 41:145–4. doi: 10.1177/1090198113493092
40. Dalen, J, Smith, BW, Shelley, BM, Sloan, AL, Leahigh, L, and Begay, D. Pilot study: mindful eating and living (MEAL): weight, eating behavior, and psychological outcomes associated with a mindfulness-based intervention for people with obesity. Complement Ther Med. (2010) 18:260–4. doi: 10.1016/j.ctim.2010.09.008
41. Ogden, J, Oikonomou, E, and Alemany, G. Distraction, restrained eating and disinhibition: an experimental study of food intake and the impact of ‘eating on the go’. J Health Psychol. (2017) 22:39–50. doi: 10.1177/1359105315595119
42. De Castro, JM . Social facilitation of the spontaneous meal size of humans occurs on both weekdays and weekends. Physiol Behav. (1991) 49:1289–91. doi: 10.1016/0031-9384(91)90365-U
Keywords: wearable device, eating environment, dietary intake, obesity, passive capture
Citation: Breit M, Padia J, Marden T, Forjan D, Zhaoxing P, Zhou W, Ghosh T, Thomas G, McCrory MA, Sazonov E and Higgins J (2023) The spectrum of eating environments encountered in free living adults documented using a passive capture food intake wearable device. Front. Nutr. 10:1119542. doi: 10.3389/fnut.2023.1119542
Edited by:
Monica Tarcea, George Emil Palade University of Medicine, Pharmacy, Sciences and Technology of Târgu Mureş, RomaniaReviewed by:
Luh Ade Wiradnyani, SEAMEO Regional Centre for Food and Nutrition, IndonesiaBlake L. Jones, Brigham Young University, United States
Samantha Kling, Stanford University, United States
Copyright © 2023 Breit, Padia, Marden, Forjan, Zhaoxing, Zhou, Ghosh, Thomas, McCrory, Sazonov and Higgins. This is an open-access article distributed under the terms of the Creative Commons Attribution License (CC BY). The use, distribution or reproduction in other forums is permitted, provided the original author(s) and the copyright owner(s) are credited and that the original publication in this journal is cited, in accordance with accepted academic practice. No use, distribution or reproduction is permitted which does not comply with these terms.
*Correspondence: Matthew Breit, bWF0dGhldy5icmVpdEBjdWFuc2NodXR6LmVkdQ==; Janine Higgins, amFuaW5lLmhpZ2dpbnNAY2hpbGRyZW5zY29sb3JhZG8ub3Jn