
94% of researchers rate our articles as excellent or good
Learn more about the work of our research integrity team to safeguard the quality of each article we publish.
Find out more
ORIGINAL RESEARCH article
Front. Nutr., 10 February 2023
Sec. Nutrition and Food Science Technology
Volume 10 - 2023 | https://doi.org/10.3389/fnut.2023.1105207
This article is part of the Research TopicAdvances in Cereals and Millets Nutrition ResearchView all 6 articles
 Karthik Kumar Manjunath1
 Hari Krishna1*
 Narayana Bhat Devate1
 V. P. Sunilkumar1
 Divya Chauhan1
 Shweta Singh1
 C. N. Mishra2
 J. B. Singh3
 Nivedita Sinha1
 Neelu Jain1
 Gyanendra Pratap Singh4Pradeep Kumar Singh1*
Biofortification is gaining importance globally to improve human nutrition through enhancing the micronutrient content, such as vitamin A, iron, and zinc, in staple food crops. The present study aims to identify the chromosomal regions governing the grain iron concentration (GFeC), grain zinc concentration (GZnC), and thousand kernel weight (TKW) using recombinant inbred lines (RILs) in wheat, developed from a cross between HD3086 and HI1500. The experiment was conducted in four different production conditions at Delhi viz., control, drought, heat, and combined heat and drought stress and at Indore under drought stress. Grain iron and zinc content increased under heat and combined stress conditions, while thousand kernel weight decreased. Medium to high heritability with a moderate correlation between grain iron and zinc was observed. Out of 4,106 polymorphic markers between the parents, 3,407 SNP markers were used for linkage map construction which spanned over a length of 14791.18 cm. QTL analysis identified a total of 32 chromosomal regions governing the traits under study, which includes 9, 11, and 12 QTLs for GFeC, GZnC, and TKW, respectively. A QTL hotspot was identified on chromosome 4B which is associated with grain iron, grain zinc, and thousand kernel weight explaining the phenotypic variance of 29.28, 10.98, and 17.53%, respectively. Similarly, common loci were identified on chromosomes 4B and 4D for grain iron, zinc, and thousand kernel weight. In silico analysis of these chromosomal regions identified putative candidate genes that code for proteins such as Inositol 1,3,4-trisphosphate 5/6-kinase, P-loop containing nucleoside triphosphate hydrolase, Pleckstrin homology (PH) domains, Serine-threonine/tyrosine-protein kinase and F-box-like domain superfamily proteins which play role in many important biochemical or physiological process. The identified markers linked to QTLs can be used in MAS once successfully validated.
Hidden hunger, often referred as micronutrient deficiency, occurs due to inadequate intake of minerals like iron, zinc, iodine, and vitamin A. The main cause of hidden hunger is the consumption of energy-rich but nutrient-poor diet. According to reports, 2 billion people suffer from micronutrient deficiency worldwide (1). The devastating effects of malnutrition are seen in underdeveloped and developing countries with low-income levels and reduced dietary diversification (2). Essential micronutrients are required in minute quantities for a healthy life, otherwise, deficiencies will lead to morbidity and mortality (3).
Among essential micronutrients, iron is the most important element needed for oxygen transportation, synthesis and repair of DNA (4). The deficiency of iron causes anemia around 32.9% of people suffer from anemia worldwide (5). The recommended average daily intake of iron is 27 mg per day for pregnant women, 18 mg for women, 9 mg for lactating mother, and 8 mg for men (6). Zinc is a trace mineral that acts as a catalyst for many enzymes, restore impaired energy metabolism, and helps to regulate gene expression (7). Zinc deficiency leads to alopecia, poor growth, and sexual dysfunction (8). It’s reported that 17.3% of the world’s population is affected by zinc deficiency (9). The average recommended intake of zinc is 8 mg for women, 11 mg for men and pregnant women, 12 mg for lactating mother (6).
Wheat is a staple food crop and the second-largest grain in both acreage and production worldwide. It’s the second largest consumed food grain and accounts for 20% of protein and calories (10). The wheat cereal-based diets fail to provide the necessary amount of minerals like iron and zinc (11). Hidden hunger is more pronounced in the areas with cereals as sole source of food supply, low dietary diversification and unavailability of biofortified varieties (12). Biofortification is the most ideal as it is cost-effective and sustainable way to improve grain micronutrient concentration (13). Therefore, attention should be given to develop biofortified varieties using breeding and molecular techniques (14).
Enrichment of grain micronutrients through traditional breeding approach is difficult because of polygenic inheritance and interaction with environment. With the advent of novel molecular techniques breeders have put a step forward in utilizing markers for assessment of genetic diversity, germplasm characterization, identification of QTLs and their utilization in practical plant breeding. Identification of loci governing GFeC and GZnC with high PVE and the markers linked to them will be very useful in molecular breeding. Several QTLs have been identified previously from the populations derived from crosses between tetraploid and hexaploid wheat varieties (15–18). Few biofortified wheat varieties released so far in India include, WB2 and HPBW 01 (high Zn and Fe), PBW1Zn (high Zn content), Pusa Tejas and Pusa Ujala (high protein content along with Zn) (19). However, only a few QTLs are identified in wheat with high phenotypic variance and are hardly being used in Indian molecular breeding for grain nutrient improvement. Hence, the present study aims to identify the novel and stable QTLs for grain zinc concentration, grain iron concentration and thousand kernel weight using mapping population derived from a cross between HD3086 and HI1500. The study was conducted across the environments viz, Delhi and Indore, in control and stress conditions (drought, heat, and combined drought and heat).
The mapping population consists of 166 recombinant inbred lines (RILs) derived from a cross between HD3086 and HI1500. HD3086 is an Indian high-yielding hexaploid wheat variety suitable for timely sown, irrigated condition developed at IARI, New Delhi (20, 21). HI1500 is a popular variety recommended for cultivation under restricted irrigation in central zone harboring many important traits related to drought and heat tolerance (21, 22). The variety HI1500 has higher GFeC, GZnC, and TKW (44.50 mg/kg GFeC, 53.50 mg/kg GZnC, and 35.88 g TKW) in all the conditions as compared to HD3086 (38.60 mg/kg GFeC, 38.60 mg/kg GZnC, and 35.58 g TKW). The RILs population along with parents were evaluated under four conditions namely timely sown irrigation (TSIR) taken as control, timely sown restricted irrigation (TSRI), late sown irrigation (LSIR), and late sown restricted irrigation (LSRI) conditions at Delhi, and under restricted irrigation condition at Indore. Two irrigations were given in TSRI, one at germination and other at 21 days after sowing; six irrigations were provided during cropping period in irrigated condition (TSIR). Late sown trials (LSIR and LSRI) were planted in second fortnight of December to expose plants to heat stress, and under LSRI condition irrigation was withheld to expose plants to both terminal heat and drought stress. The genotypes were evaluated in an alpha-lattice design with two replications. Each genotype was sown in 3 rows of 1 m each with 22.5 cm distance between rows and 10 cm distance between plants. Uniform agronomic practises were practiced for proper establishment of crop stand. The details of the sowing conditions and locations are presented in Table 1.
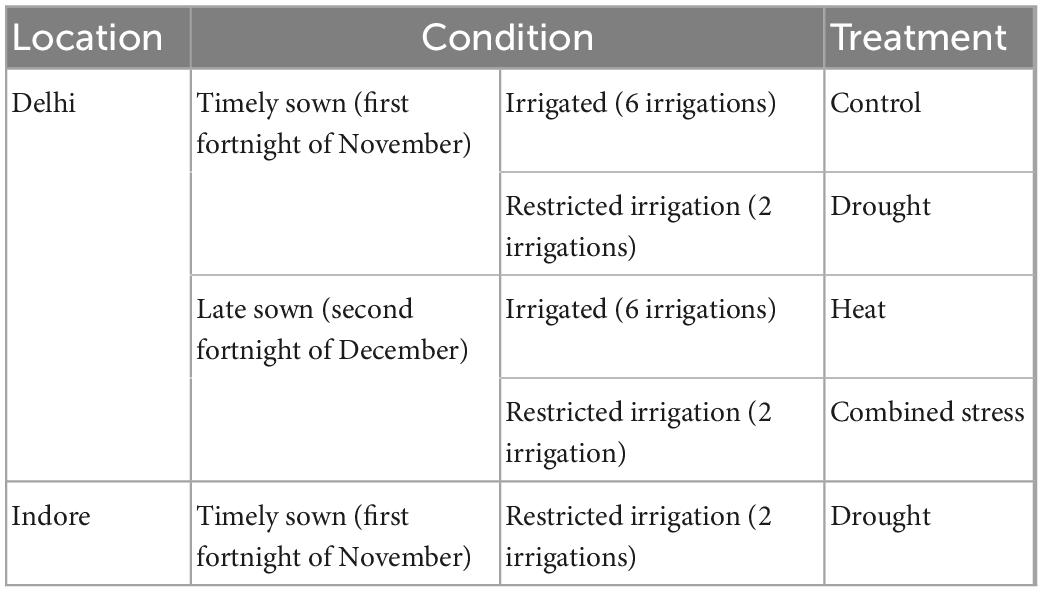
Table 1. Details of the experiment locations, sowing conditions of the mapping population.
From each plot, 20 random spikes were harvested and spikes from each plot were threshed separately. While cleaning, care was taken to prevent metal and dust contamination. The grain iron concentration (GFeC) and grain zinc concentration (GZnC) were measured using Energy Dispersive X-ray Fluorescence (ED-XRF) machine (model X-Supreme 8000 M/s Oxford Inc., USA). The thousand kernel weight (TKW) was recorded by counting 1,000 grains manually and weighted with an electronic balance.
Analysis of variance was done using PBTools v1.4 software (23). Heritability and correlations among traits were calculated using the MetaRv6.0 (Multi Environment Trial Analysis with R) software (24). From phenotypic data best linear unbiased predictors (BLUPs) were calculated for the individual conditions and combined across all production conditions and environments for further QTL mapping.
DNA was extracted from 21 days old seedling using the CTAB method (25). Genomic DNA quality was determined using 0.8% agarose gel electrophoresis with λ DNA as the standard and quantified using nanodrop. The 35K SNP Axiom breeders’ array was used for genotyping of parents and the RILs population.
A total of 4,106 SNP markers were polymorphic between the two parents. Among these, the redundant markers were removed by binning and markers deviating from mendelian segregation were deleted. Finally, a set of 3,407 non-redundant SNP markers spanning all over the chromosomes were used for the linkage map construction using IciMapping v4.2 software (26). Kosambi mapping function was used to calculate map distances between markers. Marker grouping was done using a rec value of 0.37 and the linear order of markers was determined. Ordering is done using function K-optimality 3-optMAP with NN initials of 10. Rippling was carried out using recombination with a window size of 5 cm. The final generated linkage map is used for QTL mapping.
QTL mapping was performed using IciMapping 4.2 software (26) with inclusive composite interval mapping (ICIM-ADD) model (27). BLUP values were calculated in the individual environment and pooled over environments along with genotypic data used for QTL analysis. “Mean replacement” was used to address missing phenotypic data. The walking speed of 1.0 cm, with P = 0.001 was used in stepwise regression. The LOD score of 3.0 along with 1,000 permutations was chosen for the declaration of the QTL. Identified QTLs were named following standard nomenclature available in the catalog of wheat gene symbols (28). The candidate genes (CGs) were identified based on the positions of flanking markers of the QTL. BLAST search was done to identify putative candidate genes in the physical location of markers against IWGSC wheat (Triticum aestivum L.) reference genome embedded in the Ensembl Plants database.1
The parents of RIL population showed promising variability for GFeC, GZnC, and TKW. The variety HI1500 had higher GFeC, GZnC, and TKW (44.50 mg/kg GFeC, 53.50 mg/kg GZnC, and 35.88 g TKW) in all the conditions as compared to HD3086 (38.60 mg/kg GFeC, 38.60 mg/kg GZnC, and 35.58 g TKW). The parental mean difference for GFeC, GZnC and TKW was given in Table 2.
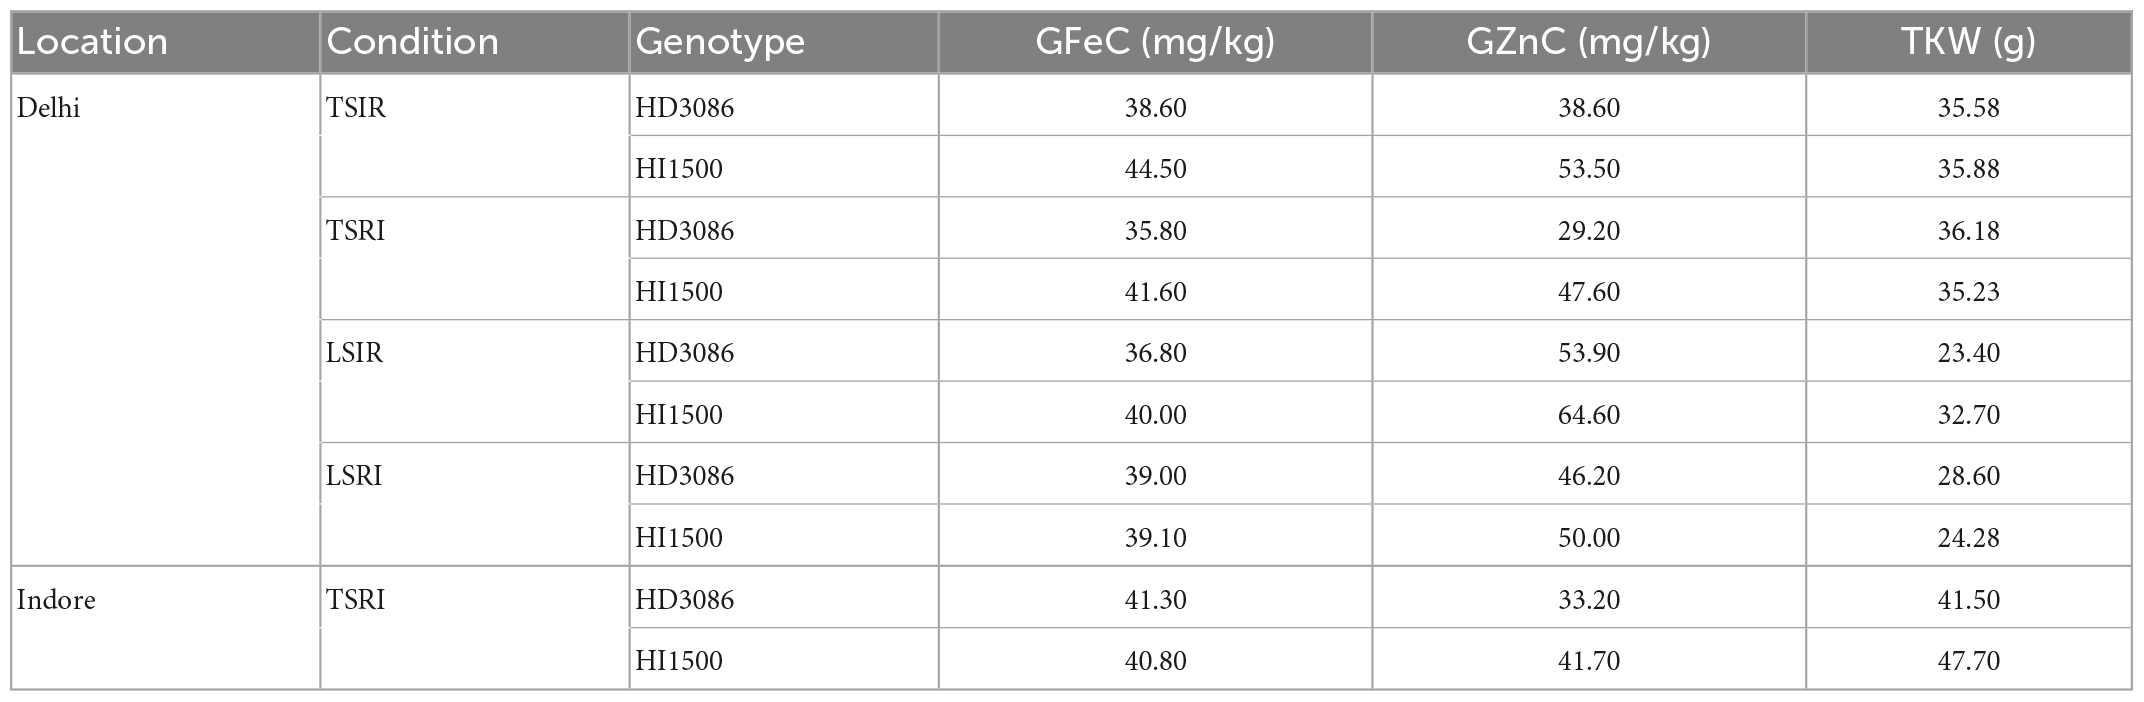
Table 2. Parental difference for the grain iron, zinc content, and thousand kernel weight.
The mean TKW of the RILs was highest in the timely sown condition compared to drought, heat and combined stress, whereas the GFeC and GZnC were low under control condition as compared to combined stress. The mean TKW in control was 38.28 g, which decreased to 37.36 g under drought, 29.99 g under heat, and 25.49 g under combined stress condition, while TKW in restricted irrigated condition at Indore increased to 41.88 g (Table 3). The GFeC under control was 39.22 mg/kg and increased to 41.51 mg/kg under drought, 40.75 mg/kg under combined stress, and 42.05 mg/kg under drought in the Indore, in contrast it was reduced to 38.41 mg/kg in heat stress. The GZnC in control was 43.31 mg/kg and increased to 59.33 mg/kg under heat and 50.44 mg/kg under combined stress, decreased to 40.46 and 37.77 mg/kg under drought condition in Delhi and Indore, respectively. Violin plots depicting GFeC, GZnC and TKW under all the studied condition are given in the Figure 1. The mean decrease in TKW and increase in GFeC and GZnC was found significant (p-value of 0.05) using one tailed and two tailed z-test (Table 3). Analysis of variance showed significant variation among the RILs for the traits GFeC, GZnC, and TKW in all the conditions viz., control (TSIR), drought (TSRI), heat (LSIR), and combined stress (LSRI) in Delhi and drought stress (TSRI) in Indore.
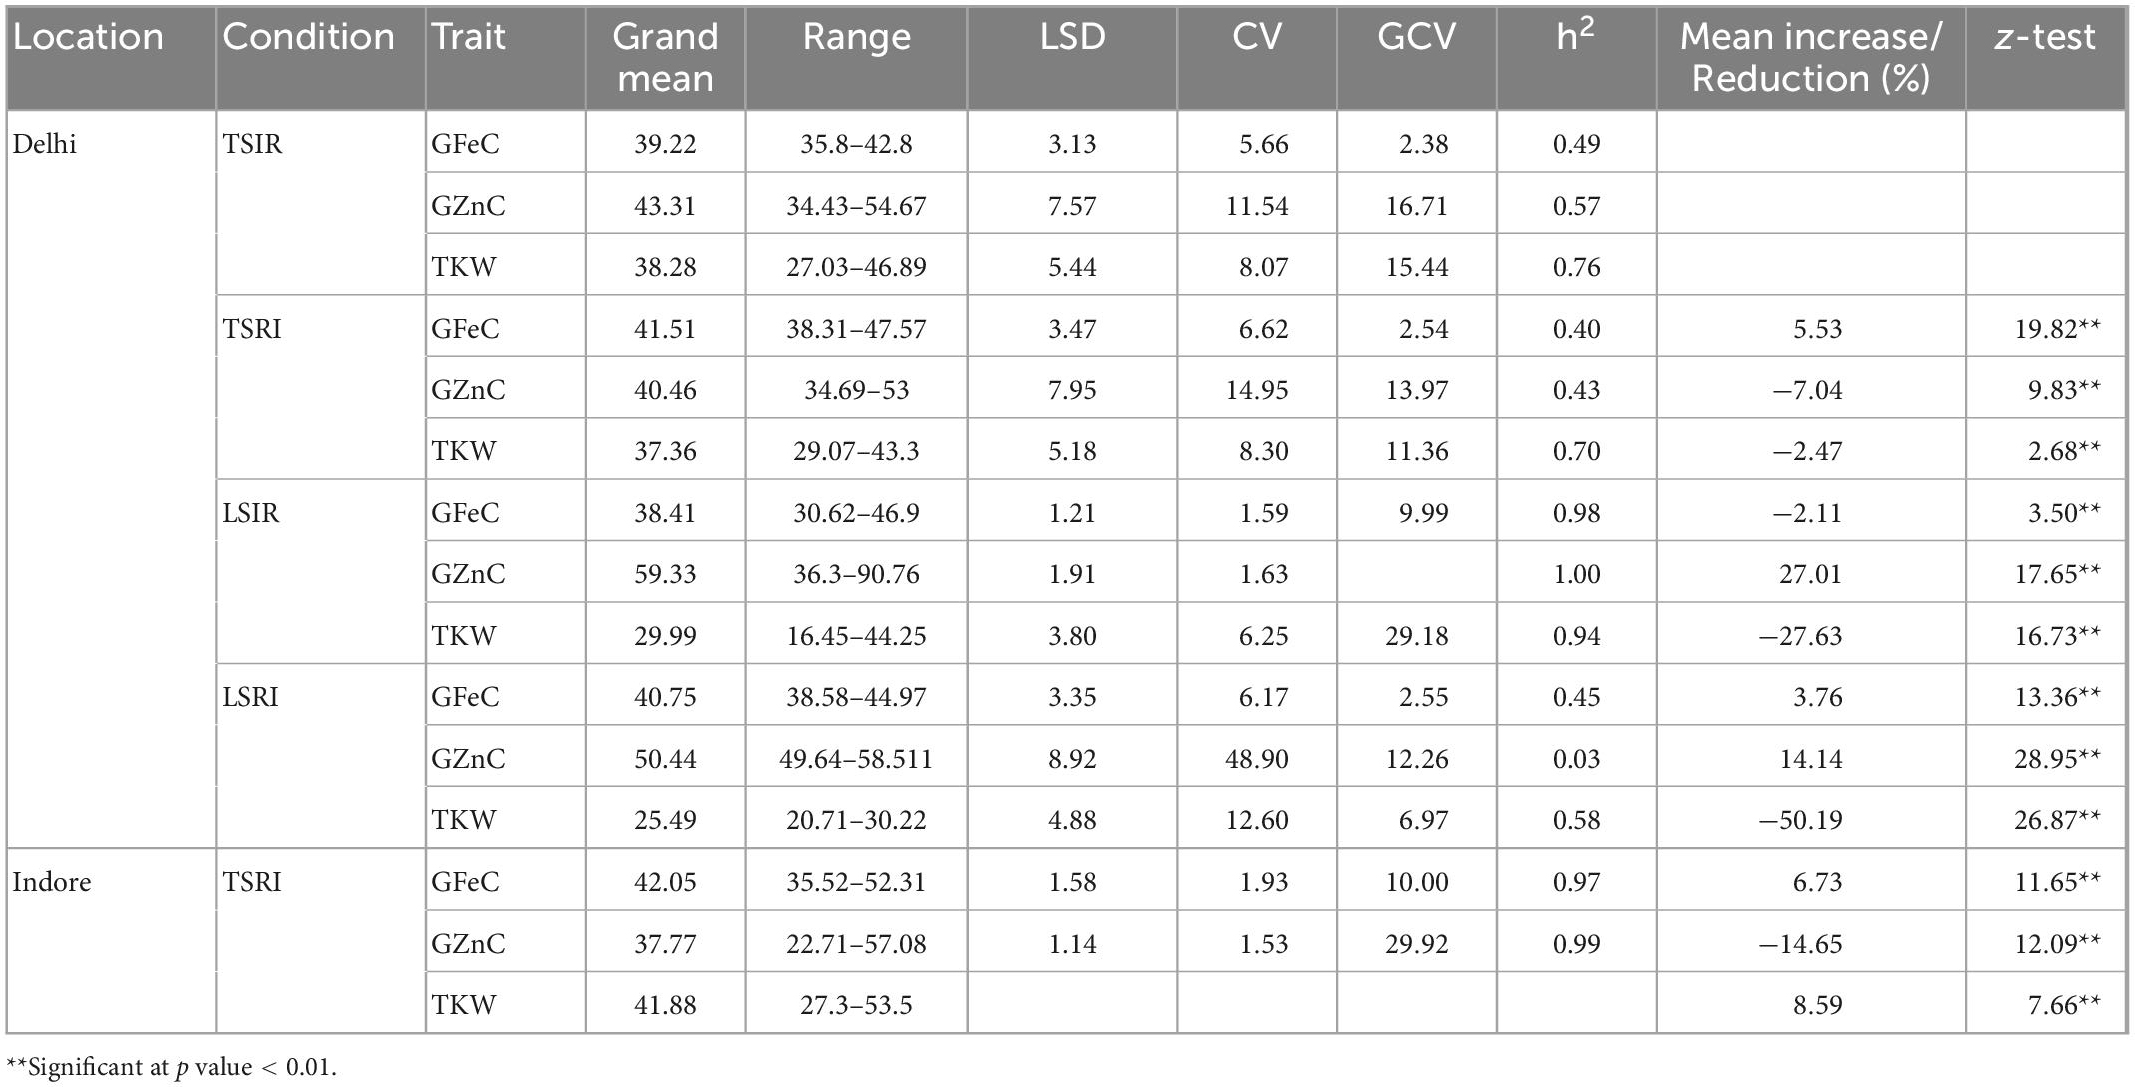
Table 3. Descriptive statistics, heritability, and percent mean increase/decrease under drought, heat, and combined stress.
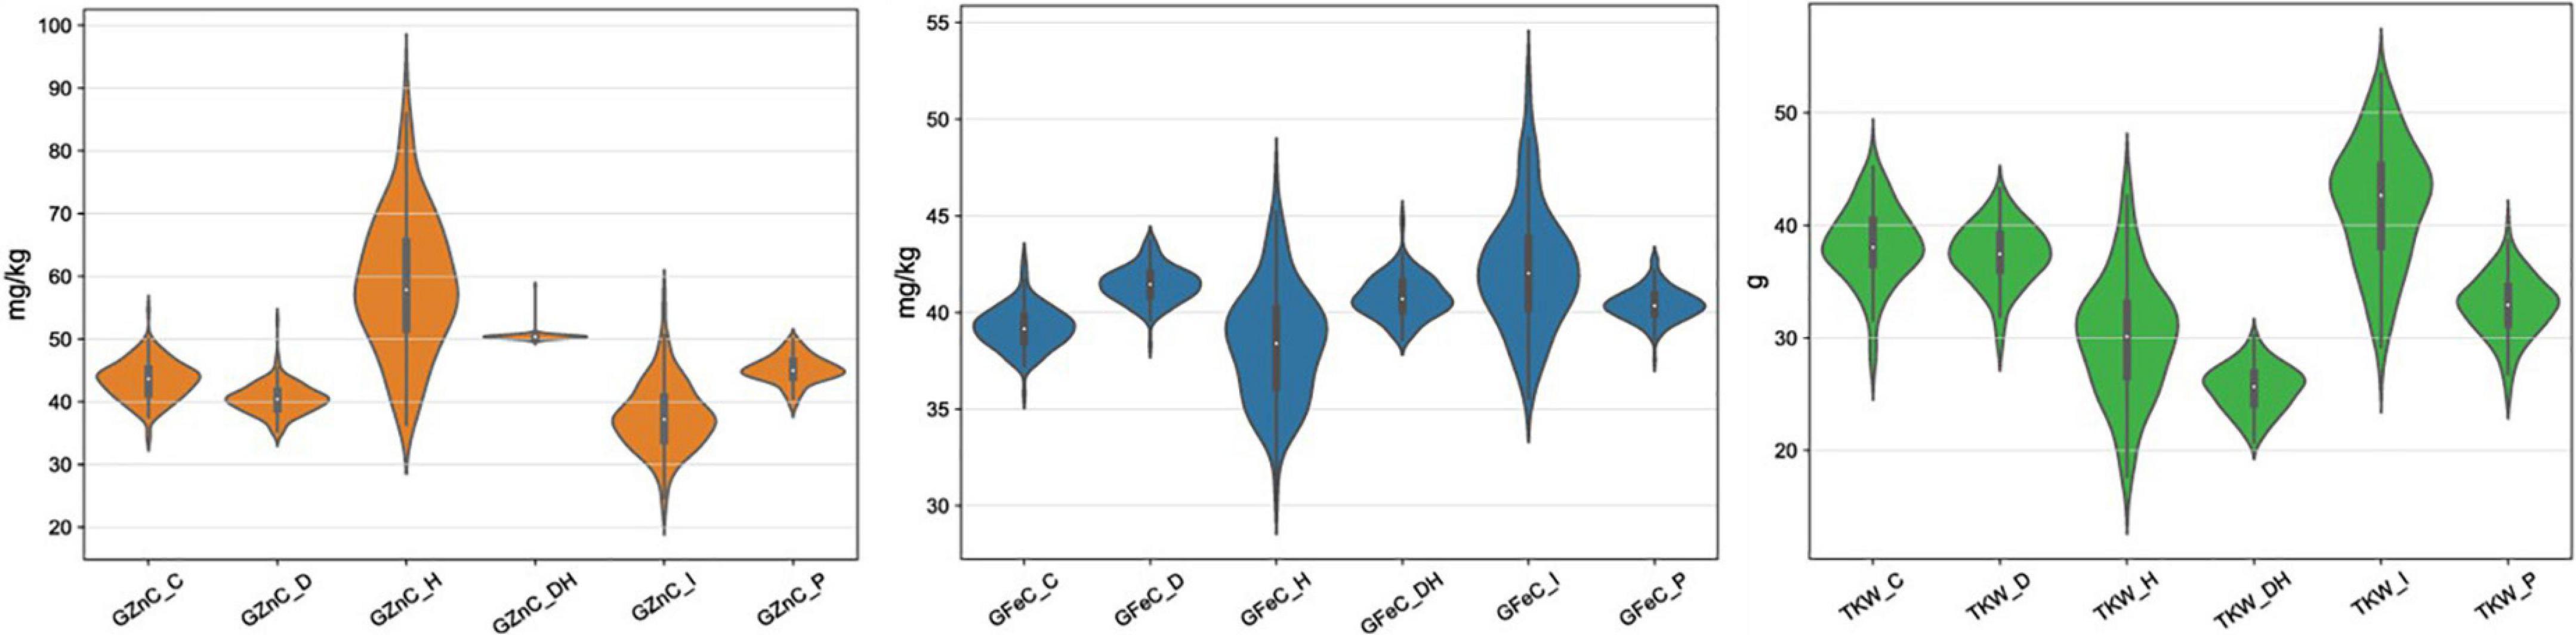
Figure 1. Depiction of the distribution of GFeC, GZnC, and GZnC under control, drought, heat, and combined stress conditions through violin plots.
The coefficient of variation was high under drought and combined stress conditions compared to the control but heritability was found to be lower under drought and combined stress conditions for all the traits. Broad sense heritability of the traits studied was medium to high except for the GZnC which was low under combined stress condition. The range, heritability, coefficient of variation and mean decrease/increase are given in Table 3. Significant association among GFeC and GZnC under control (0.51***), drought (0.57***) and heat (0.50***) at Delhi location and GFeC and GZnC under drought stress (0.41***) at Indore (at p-value of 0.001) was observed. Traits viz., GFeC and GZnC did not show significant association with TKW except positive significant (0.20**) association between TKW and GZnC (at p-value of 0.01) under the drought (Table 4).
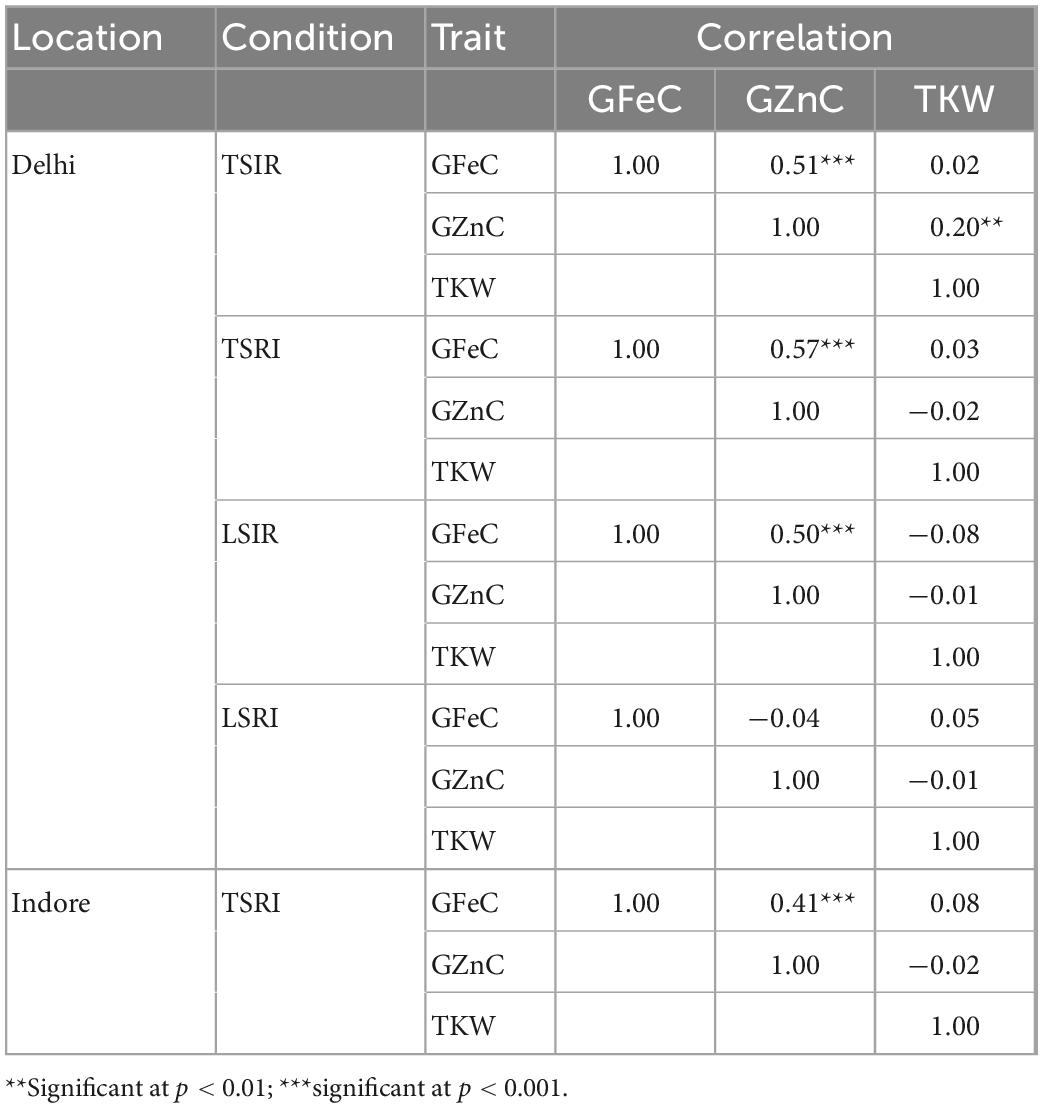
Table 4. Genotypic correlation coefficients among grain iron, zinc, and thousand kernel weight in the RIL population.
A total of 4,106 polymorphic markers were identified between HD3086 and HI1500, out of which 3,407 non-redundant markers uniformly distributed over all the 21 chromosomes were used for the linkage map construction. The linkage map spanned a genetic length of 14791.18 cm, ranging from 2.03 cm/marker in 1B to 9.41 cm/marker in 4D chromosome with an average marker density of 4.34 cm/marker. The highest number of markers mapped on genome B with a total of 1386 followed by A and D with 1,046 and 975 markers, respectively. Chromosome 2B had the highest number of markers 239 while chromosome 4B had only 61 markers (Table 5).
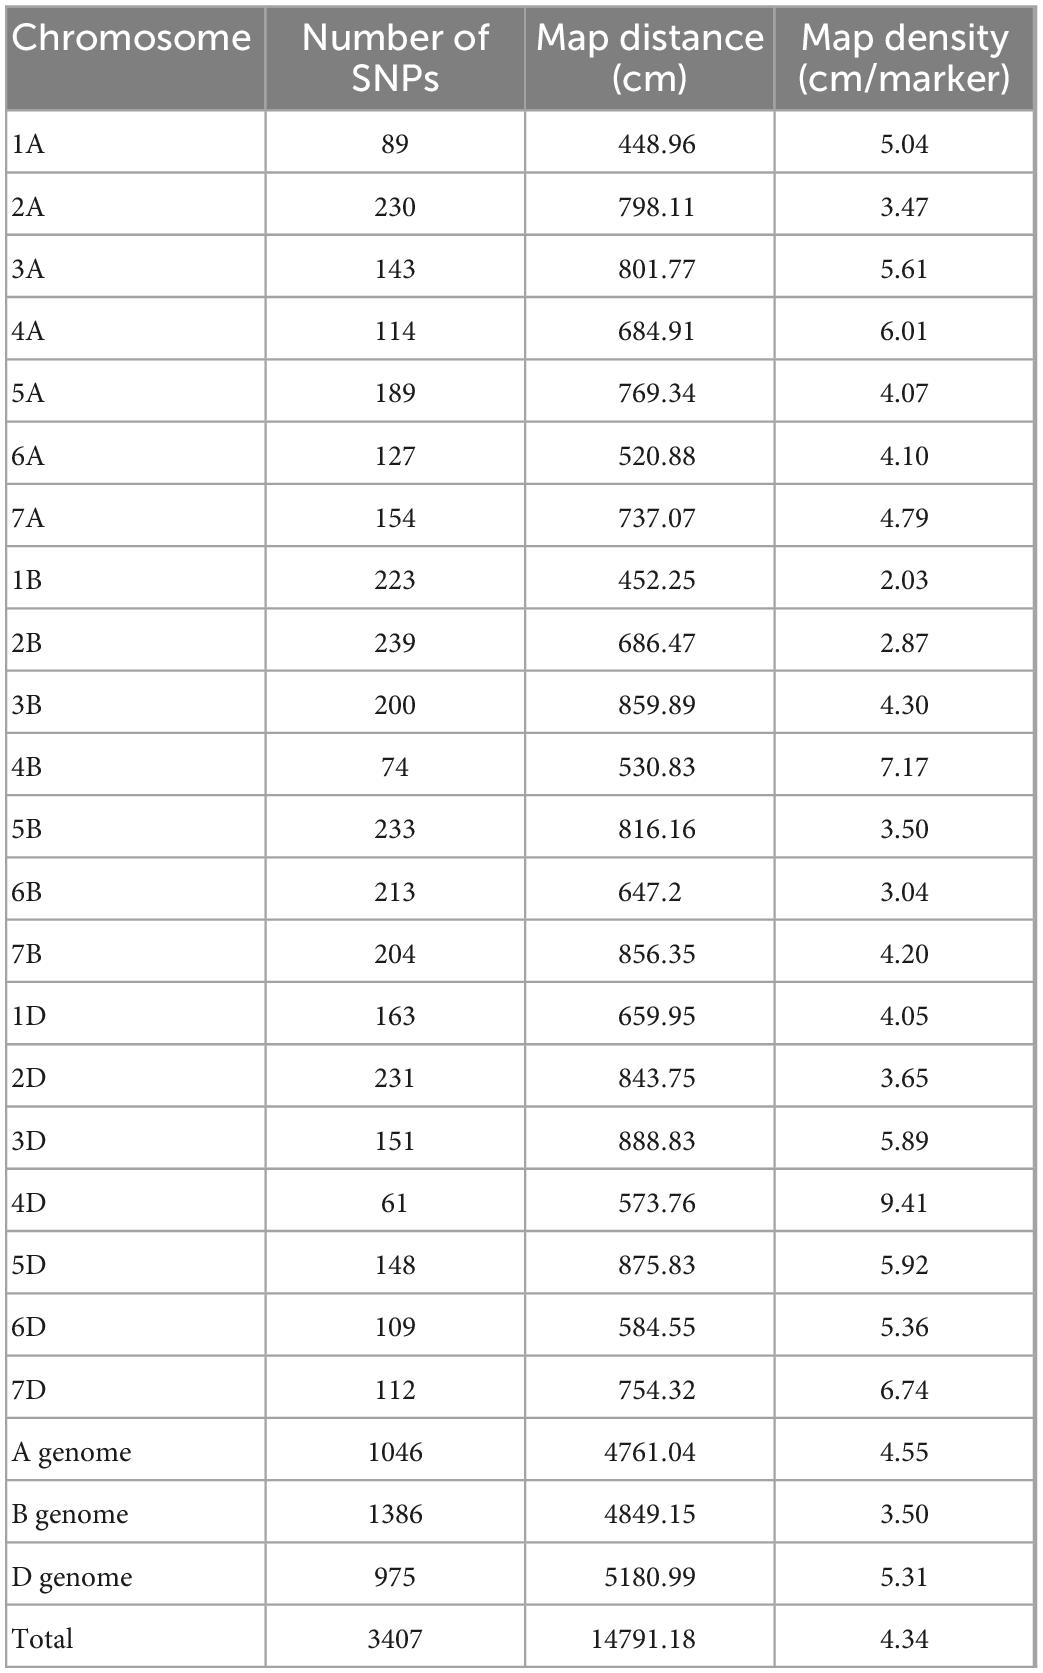
Table 5. Distribution of markers and marker density across chromosomes in the linkage map developed in RILs of HD3086/HI1500.
A total of 32 QTLs were mapped on 17 different chromosomes for the traits GFeC, GZnC, and TKW across the environment. Out of 32, nine QTLs were mapped for GFeC, eleven for GZnC, and twelve for TKW. Chromosome 4B carried the highest number of QTLs i.e., 5, followed by chromosome 2D which carried 4 QTLs, while chromosomes 1D, 2A, 3B, 4D, 5D, 6A, 7A, and 7B carried 2 QTLs each, and the remaining chromosomes 3A, 4A, 5A, 5B, 6B, 6D, and 7D carried only one QTL. A list of QTLs identified along with flanking markers, LOD score, PVE (%), and additive effects are given in Table 6. In silico analysis of QTL regions identified a few important candidate genes which are having various roles in different pathways of growth and development were given in Table 7.
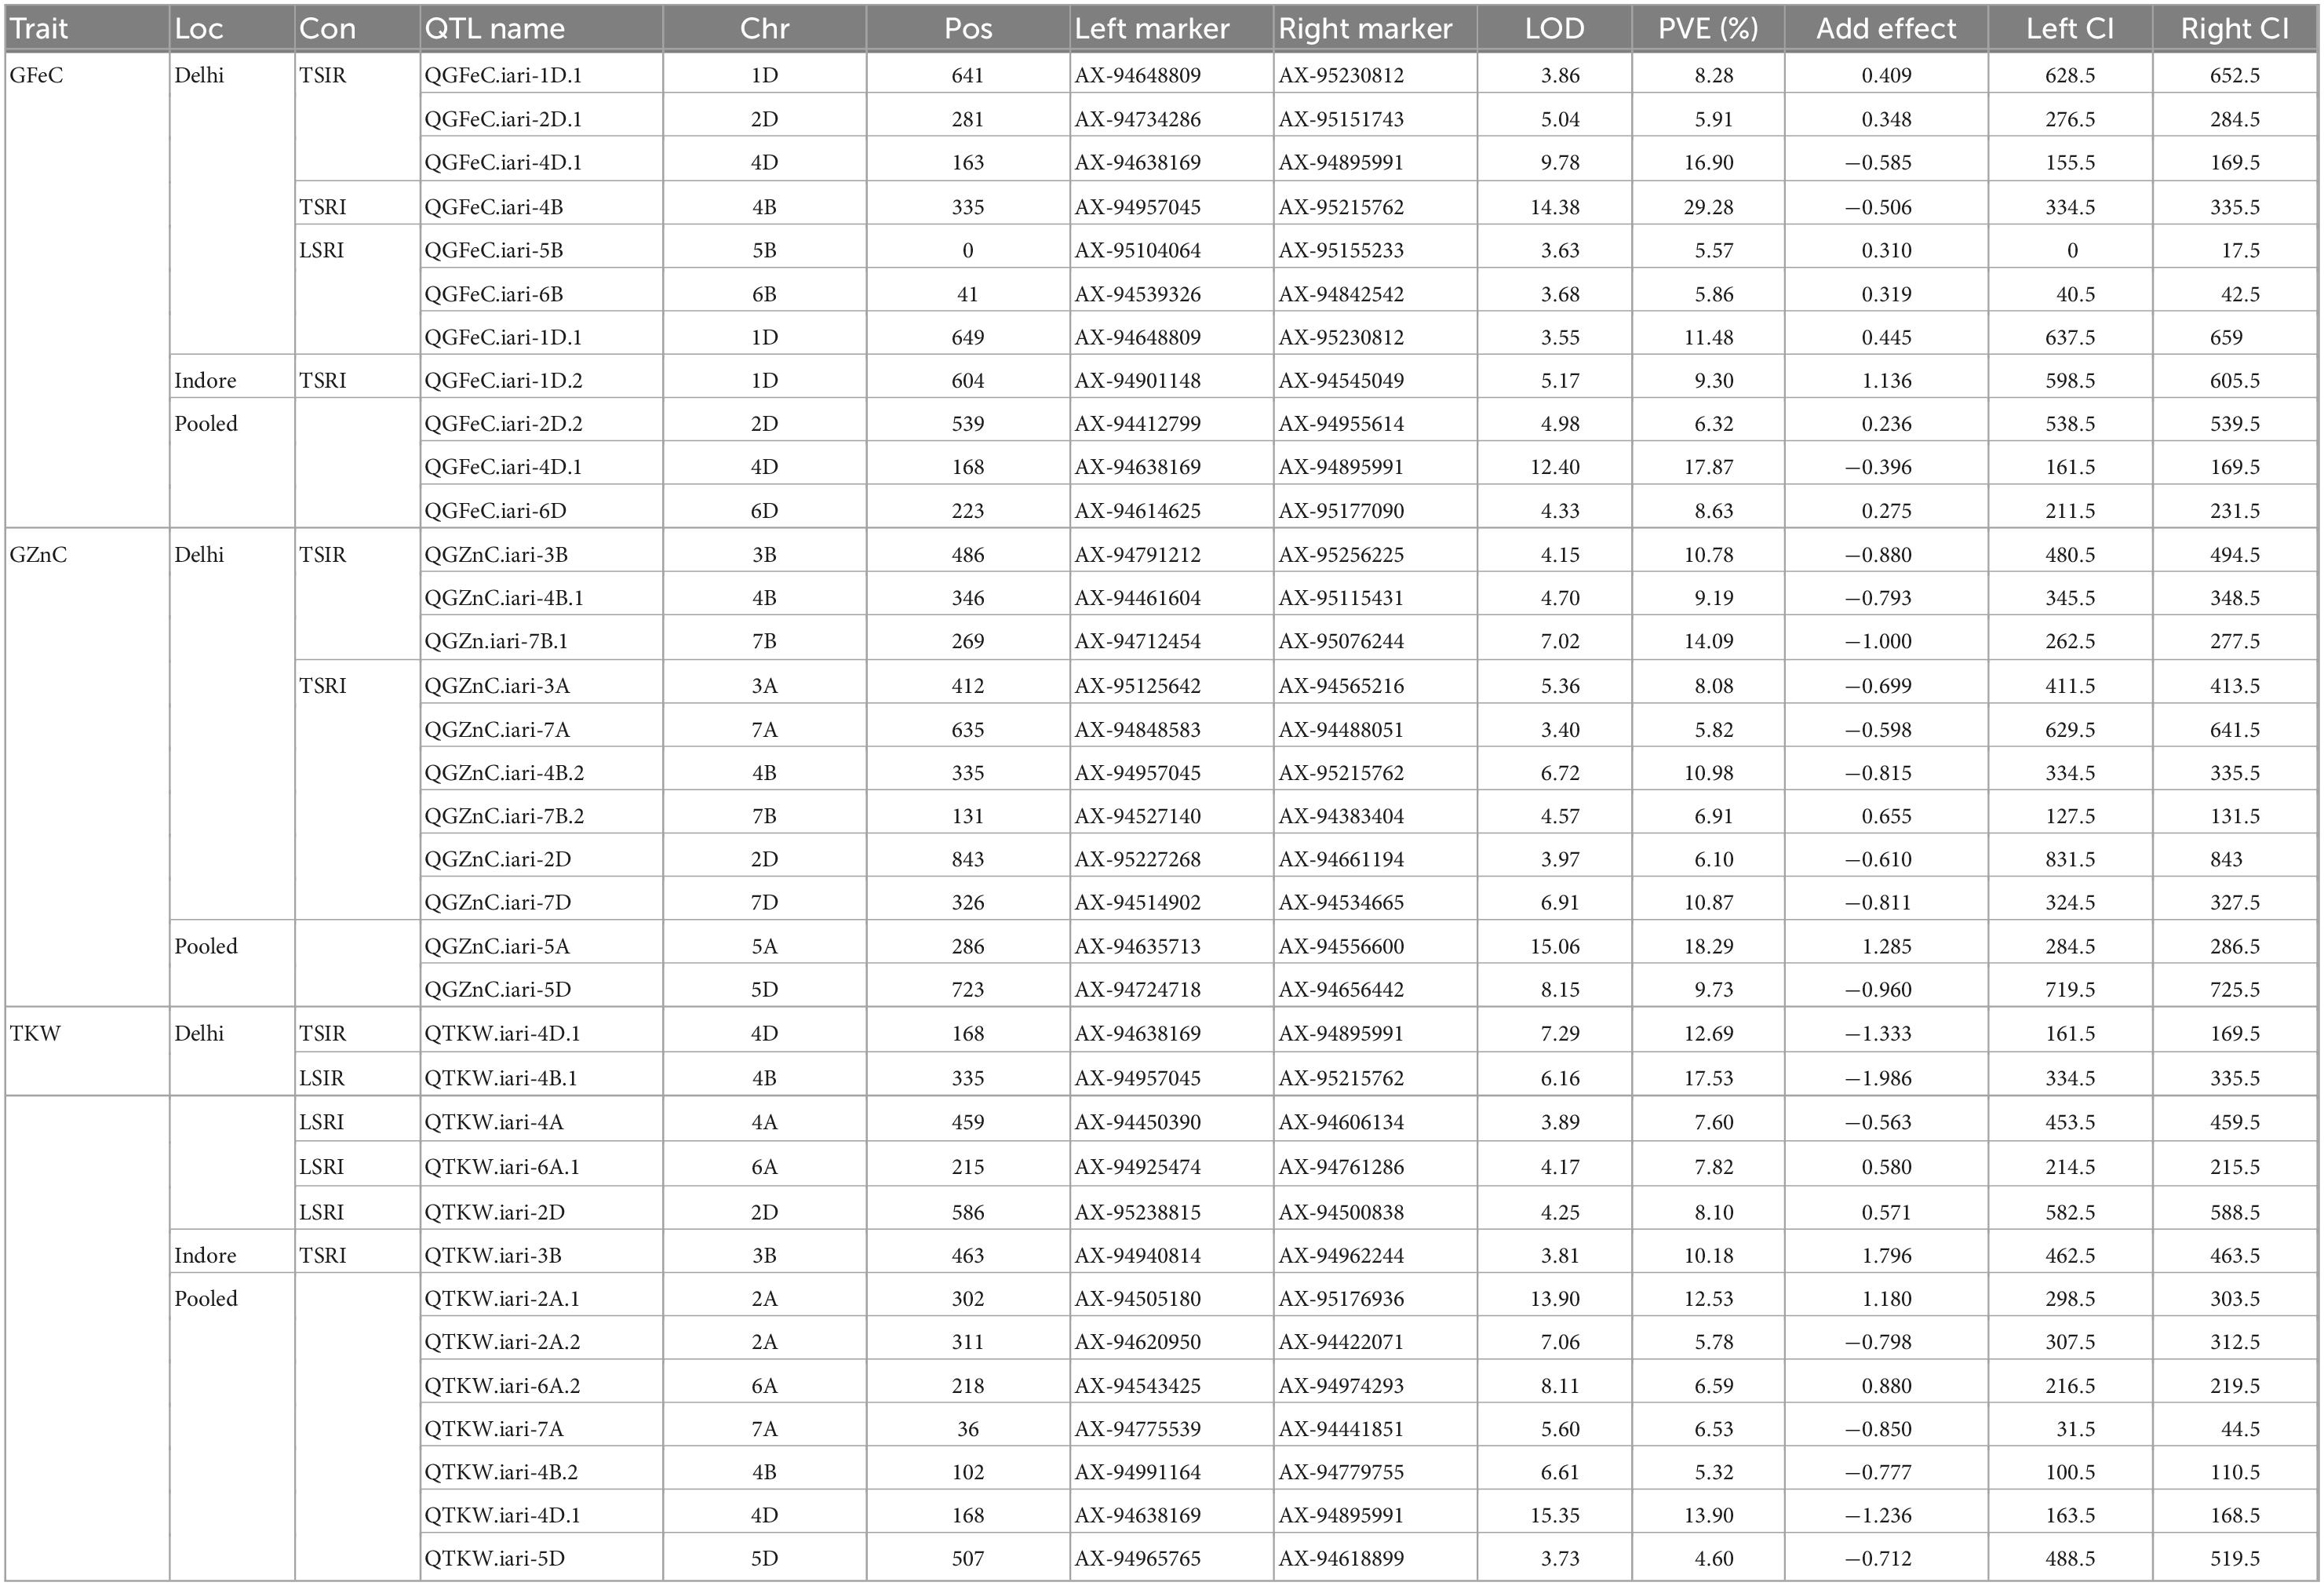
Table 6. QTLs identified for GFeC, GZnC, and TKW in the RIL population under control, drought, heat, and combined stress conditions.
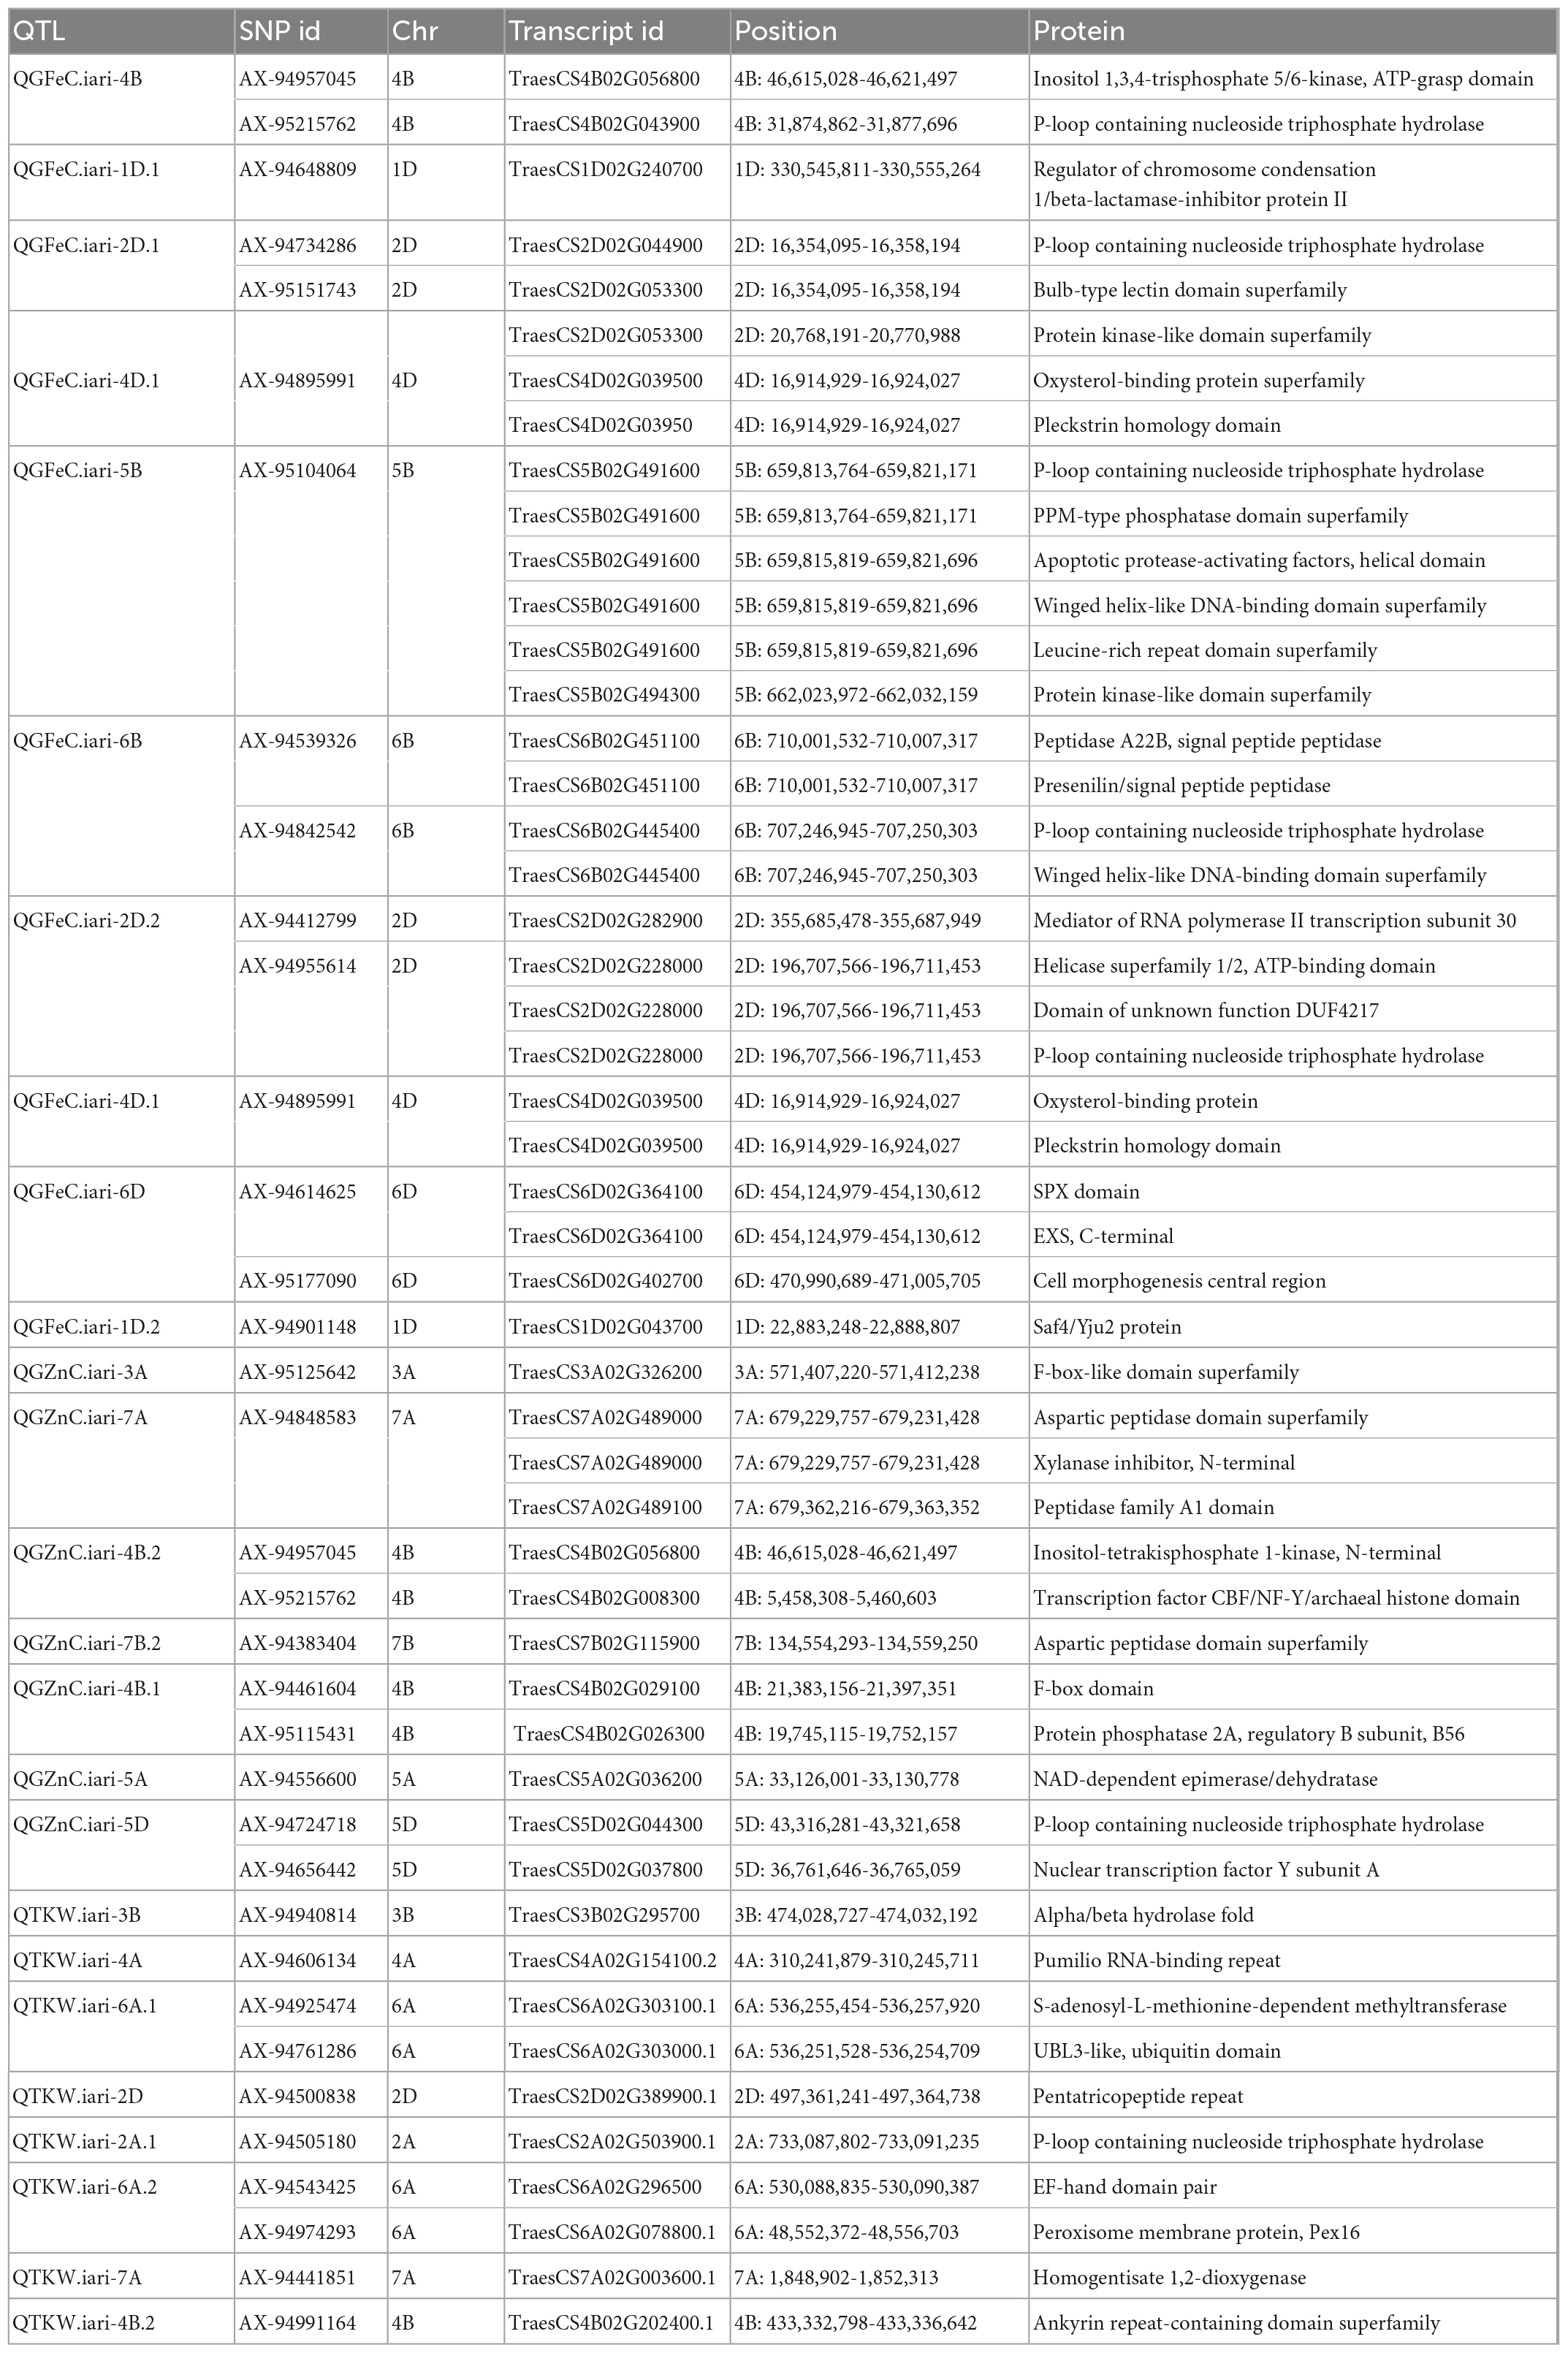
Table 7. Putative candidate genes identified in the QTL region and proteins produced.
QTL analysis identified nine QTLs for GFeC with the LOD score ranging from 3.54 to 14.37. The number of QTLs identified in different treatments viz., control, drought, combined stress and pooled BLUP of all the environments were 3, 2, 3, and 3, respectively. Three major QTLs QGFeC.iari-4D.1, QGFeC.iari-4B, and QGFeC.iari-1D.1 explained greater than 10 percent phenotypic variance: (i) The QTL QGFeC.iari-4B explained the highest phenotypic variance of 29.28% flanked by markers AX-94957045 and AX-95215762 with a 1 cm confidence interval. (ii) The QTL QGFeC.iari-4D.1 was identified in control and pooled BLUP data and found to be stable explaining the phenotypic variance of 16.90 and 17.87%, respectively. The region is associated with two candidate genes TraesCS4D02G03950 and TraesCS4D02G03950 which code for Oxysterol-binding protein and Pleckstrin homology domain, respectively. (iii) QTL QGFeC.iari-1D.1 was identified between markers AX-94648809 and AX-95230812 with the phenotypic variance of 11.47 and 8.28% in combined stress and control conditions, respectively. In addition to the major QTLs, six minor QTLs QGFeC.iari-2D.1, QGFeC.iari-5B, QGFeC.iari-6B, QGFeC.iari-1D.2, QGFeC.iari-2D.2, and QGFeC.iari-6D were also identified with a phenotypic variance of 5.91, 5.57, 5.86, 9.30, 6.32, and 8.63%, respectively. The chromosome regions of these QTLs were found to harbor important candidate genes encoding proteins for Bulb-type lectin domain superfamily, Winged helix-like DNA-binding domain superfamily, Protein kinase-like domain superfamily, Apoptotic protease-activating factors, Presenilin/signal peptide peptidase, Protein kinase-like domain superfamily, Peptidase A22B, signal peptide peptidase, and Leucine-rich repeat domain superfamily.
A total of 11 QTLs were identified for GZnC with the LOD value ranging from 3.40 to 15.06 out of which QGZnC.iari-3B, QGZn.iari-7B.1, QGZnC.iari-4B.2, QGZnC.iari-7D, and QGZnC.iari-5A were the major QTLs explaining phenotypic variance greater than 10 percent. The QTL QGZn.iari-3B flanked with markers AX-94791212 and AX-95256225, explained 10.78% phenotypic variance. This region contains a putative candidate gene TraesCS3A02G326200 that codes for F-box-like domain superfamily proteins. The QTL QGZnC.iari-4B.2 explained a phenotypic variance of 10.98% and the region contained candidate genes TraesCS4B02G056800 and TraesCS4B02G008300 encoding Inositol-tetrakisphosphate 1-kinase, N-terminal and Transcription factor CBF/NF-Y/archaeal histone domain, respectively. The QTL QGZn.iari-7D contributed 10.87% to the total phenotypic variance and had a candidate gene TraesCS7B02G115900 encoding protein belonging to the Aspartic peptidase domain superfamily. QTL QGZn.iari-5A explained 18.29% phenotypic variance and a candidate gene TraesCS5A02G036200 coding for protein NAD-dependent epimerase/dehydratase. The QTL QGZn.iari-7B.1 explained a phenotypic variance of 14.09%. Six minor QTLs viz., QGZnC.iari-4B.1, QGZnC.iari-3A, QGZnC.iari-7A, QGZnC.iari-7B.2, QGZnC.iari-2D, and QGZnC.iari-5D were identified with phenotypic variance of 9.19, 8.08, 5.82, 6.91, 6.10, and 9.73 percent, respectively. The chromosomal regions of these QTLs harbors candidate genes that codes for Aspartic peptidase domain superfamily, P-loop containing nucleoside triphosphate hydrolase, Xylanase inhibitor, N-terminal Peptidase family A1 domain, and nuclear transcription factor Y subunit A.
A total of twelve QTLs was identified on nine different chromosomes ranging from 3.81 to 15.35 LOD value; chromosomes 2A, 4B, and 6A carried two QTLs each. The QTKW.iari-4D.1, QTKW.iari-4B.1, QTKW.iari-3B, and QTKW.iari-2A.1 were the major QTLs with a phenotypic variance of 12.69, 17.53, 10.18, and 12.53 percent, respectively. The genomic region of the QTKW.iari-3B contains important candidate gene TraesCS3B02G295700 coding Alpha/Beta hydrolase fold protein. One stable QTL QTKW.iari-4D.1 was identified on in control and pooled data that explained a phenotypic variance of 12.69 and 13.90%, respectively. The QTL region was found to have putative candidate gene TraesCS4D02G039500 which codes for Oxysterol-binding protein and Pleckstrin homology domain. QTKW.iari-4A, QTKW.iari-6A.1, QTKW.iari-2D, QTKW.iari-2A.2, QTKW.iari-6A.2, QTKW.iari-7A, QTKW.iari-4B.2, and QTKW.iari-5D are the minor QTLs identified with PVE of 7.60, 7.82, 8.10, 5.78, 6.59, 6.53, 5.32, and 4.60%, respectively. The chromosomal regions of the QTLs codes proteins/enzymes such as Pumilio RNA-binding repeat, S-adenosyl-L-methionine-dependent methyltransferase, UBL3-like ubiquitin domain, EF-hand domain pair, Peroxisome membrane protein (Pex16), Homogentisate 1,2-dioxygenase, and Ankyrin repeat-containing domain superfamily.
Micronutrient elements such as grain iron, grain zinc, are governed by many genes whose expression is influenced by the external environment. In the present study, to identify QTLs expressed in different stress conditions the experiment was carried out in drought, heat, and combined stress conditions taking timely sown environment as control. The treatment-wise highest mean for GFeC 41.51 mg/kg, GZnC 59.33 mg/kg, and TKW 41.88 g was observed in drought (Indore), heat, and drought (Indore) conditions, respectively, as observed in previous studies (29, 30). The GFeC and GZnC were increased in late sown conditions but the TKW decreased because the high temperature during grain filling caused forced maturity, reduced photosynthetic assimilation and starch content leading to the development of undernourished shriveled seeds (31). Although the grain micronutrients concentration was highest in late sown condition, the total micronutrient yield per area was highest in timely sown condition as the grain yield was highest in timely sown condition similar kind of results were also observed in a study by Velu et al. (30). GCV for GFeC ranged from 2.33 to 10.00, GCV for GZnC ranged from 12.26 to 29.92 and GCV for TKW ranged from 7.18 to 29.18 in different treatment conditions. The lower the value of GCV, the greater the influence of the environment on the expression of the particular trait whereas higher value of GCV, indicates the variation in the population mainly attributes to the genetic makeup of the individual. The CV for GFeC was ranged from 5.66 to 6.62, GZnC ranged from 1.63 to 48.90, TKW ranged from 6.97 to 15.44, similar findings were observed in previous studies by 29, 32, 33. A wide variation was observed for GFeC, GZnC, and TKW (Table 3) (17, 34, 35). Heritability is important selection parameter that aids plant breeders in determining the characters for which selection is to be performed (36). The heritability of the traits studied was found to be medium to high indicating a predominance of genotypic variance which can be exploited by selection in crop improvement, (17, 37). GFeC is significantly correlated with GZnC in all the conditions, indicating they are positively associated with each other and the selection for improvement of one character will simultaneously bring improvement in another. The results were similar to previous studies by 38, 39.
In the present study a total of 32 QTLs were identified out of which 9, 11, and 12 for GFeC, GZnC, and TKW, respectively (Figure 2). Most of the QTLs for GZnC and TKW were derived from parent HI1500 while QTLs for GFeC were derived from parent HD3086. Interestingly, one pleiotropic QTL QGFe.iari-4B/QGZnC.iari-4B.2/QTKW.iari-4B.1 has been identified at position 335 cm which explained the phenotypic variance of 29.28% for GFeC, 10.98% for GZnC, and 17.53% for TKW. Two Stable QTLs QGFeC.iari-1D.1 and QTL QGFeC.iari-4D.1 were identified for GFeC, and one for TKW QTKW.iari-4D.1 and. were also reported in earlier studies (40–42). QTLs for grain iron content are mapped most on the D genome while B genome carried the highest number of QTLs for grain zinc content and A genome carried highest number of QTLs for TKW.
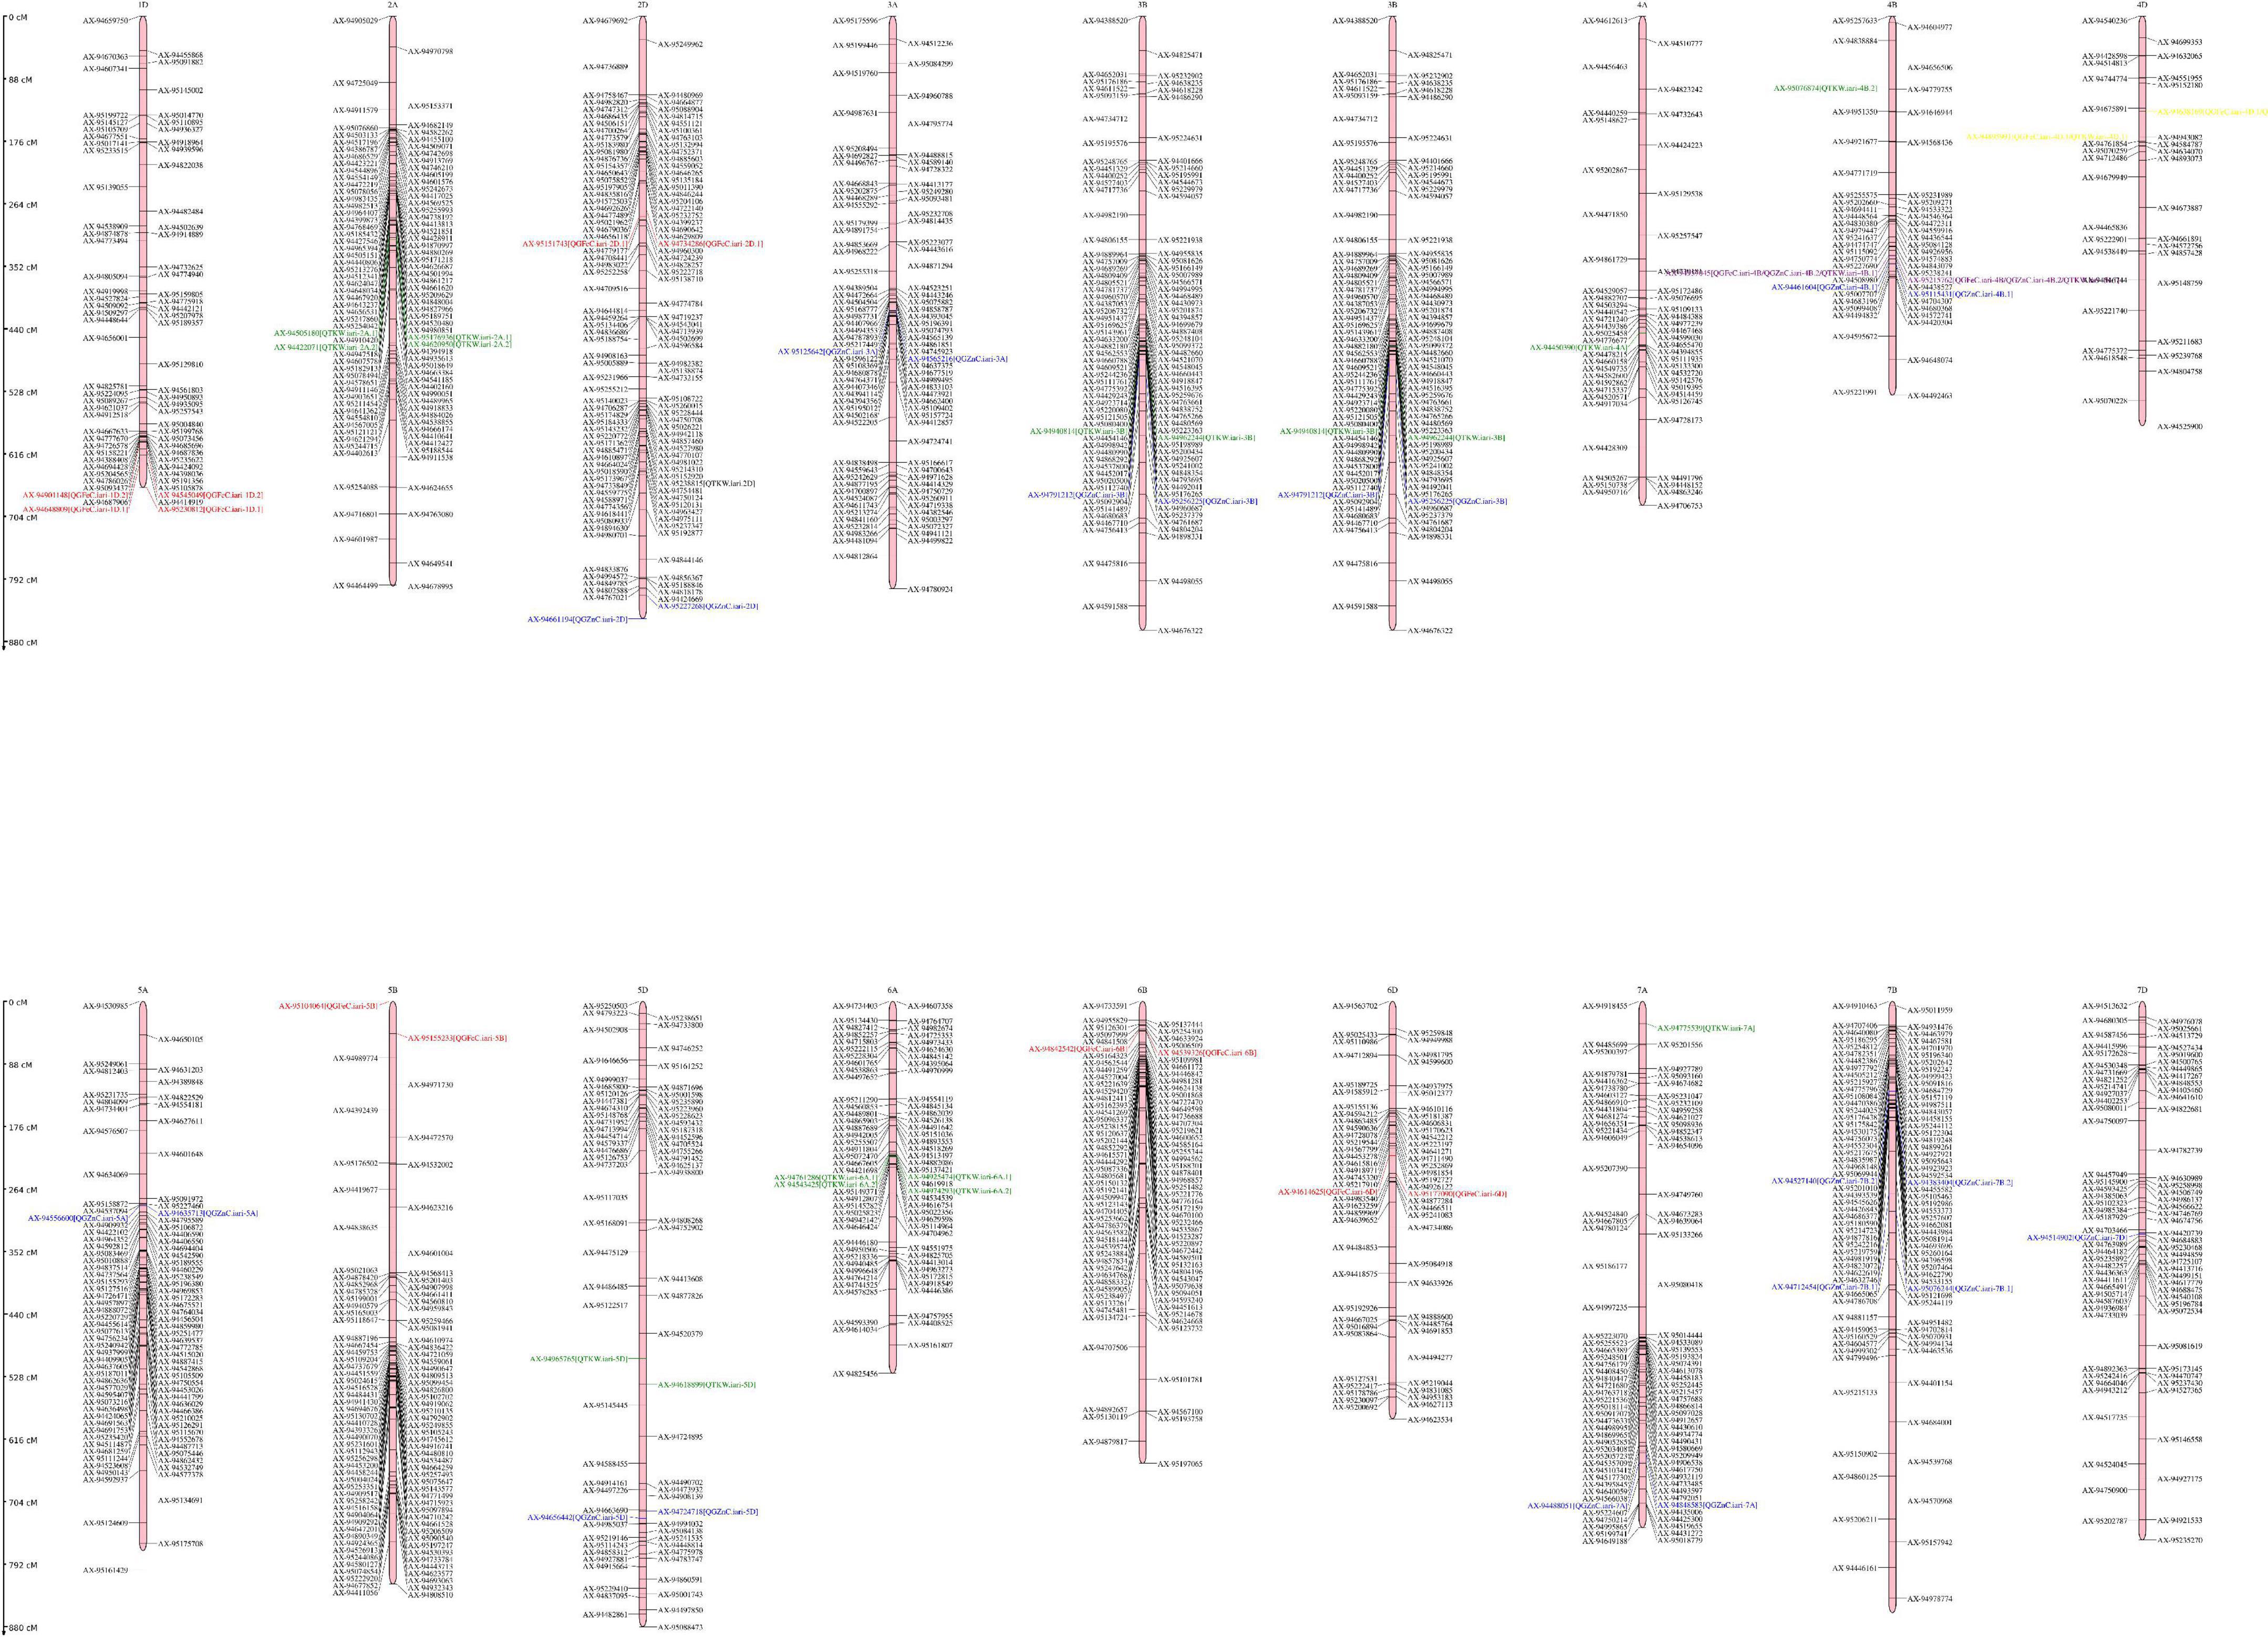
Figure 2. Genetic linkage map and QTL positions identified on A, B, and D genomes of RILs derived from the cross HD3086/HI1500. Red color indicates QTLs for GFeC; blue color indicates QTLs for GZnC; green color indicates QTLs for TKW; purple color indicates QTL governing GFe, GZn and TKW; yellow color indicates QTL governing both GFe and TKW.
The stable QTLs for GFeC was identified on chromosome 1D and 4D as also reported by previous workers on 4D (32, 37), 1D (18). The putative candidate gene TraesCS4D02G03950 in the QTL QGFeC.iari-4D.1 region coded Pleckstrin homology (PH) domains; these are protein modules made up of 100–120 amino acids and has the potential to bind phosphoinositides (43). Phosphoinositides are known to regulate intracellular membrane trafficking by providing intrinsic membrane signals (44) and also help in regulation of ion channel function (45). Another stable QTL QGFeC.iari-1D.1 harbors a putative candidate gene TraesCS1D02G240700 which codes for Regulator of chromosome condensation 1/beta-lactamase-inhibitor protein II. Three major QGFeC.iari-4D.1, QGFeC.iari-4B, and QGFeC.iari-1D.1 for GFeC were also reported by previous workers on 4D (32, 37), 1D (18), and 4B (37) in different mapping populations. In silico analysis of chromosomal regions harboring QTL QGFeC.iari-4B found a putative candidate gene TraesCS1D02G240700 near right marker AX-95215762 which codes for P-loop containing nucleoside triphosphate hydrolase, and belong to the special class of metallochaperones (46). Metallochaperones are specific class of molecular chaperones that mediate the intracellular transport of metal ions to metalloproteins and metalloenzymes through protein-protein interactions (47). These proteins are Fe2+ chaperones and important multifunctional adaptors that function in the nuclear and cytosolic compartmentalization, storage and export of iron in the form of ferritin and ferroportin (48). Another putative candidate gene TraesCS4B02G056800 codes for Inositol 1,3,4-trisphosphate 5/6-kinase, it acts as a chelator of metal ions such as iron and zinc.
Five major QTLs corresponding to GZnC viz., QGZnC.iari-3B, QGZn.iari-7B.1, QGZnC.iari-4B.2, QGZnC.iari-7D, and QGZnC.iari-5A were identified. The similar localization of QTL for GZnC were reported in earlier studies on 3B (29, 32, 37, 49), 7B (29, 32, 37), 4B (49), 5A (18, 29, 49), and 7D (18, 29, 37) in different mapping populations. The QTL region QGZn.iari-3B was found to have candidate genes coding for F-box-like domain superfamily which takes part in several biological processes like flowering, photomorphogenesis, seed development, leaf senescence, the regulation of circadian rhythms, and hormone signaling (50). The QTLs for TKW were reported in earlier studies on chromosome 3B (33, 51), 4B (51–53), 4A (51), 6A (51, 54), 2D (53, 54), 2A (33, 54), and 7A (51, 54). Candidate gene TraesCS3B02G295700 was found in the QTL QTKW.iari-3B region coding Alpha/Beta hydrolase fold protein. This protein serves as the core structure for phytohormone and ligand receptors in the gibberellin, strigolactone, and karrikin signaling pathways in plants (55).
The number of QTLs identified for GFeC, GZnC and TKW are 9, 11, and 12, respectively. One pleiotropic QTL was identified on chromosome 4B which is associated with grain iron, grain zinc concentration and thousand kernel weight. The common locus was identified for Zn content and TKW on chromosome 4B, while common locus for Fe and TKW was found on 4D. The same genes might be functioning in the accumulation of Fe, Zn, and TKW which need to be studied further in detail at molecular and biochemical levels. Genomic regions on chromosomes 1D and 4D were associated with Fe content, 2A and 6A associated with TKW, while on chromosome 4B were associated with Zn content, therefore fine mapping of the such regions may be rewarding. Further in silico analysis of QTL regions identified putative candidate genes which are directly or indirectly related to these traits. So, the identified QTLs can be used in practical plant breeding to develop biofortified varieties after the successful validation of these identified markers.
The original contributions presented in this study are included in the article/Supplementary material, further inquiries can be directed to the corresponding authors.
PS, NJ, GS, and HK conceptualized the investigation and edited the manuscript. KM conducted the investigation and prepared the draft of the manuscript. KM, CM, JS, and ND generated the phenotypic data. KM, HK, VS, SS, and DC contributed in the generation of genotyping data. KM and HK did the statistical and QTL analysis. All authors contributed to the article and approved the submitted version.
Part of the research supported by a grant from the Bill & Melinda Gates Foundation (Grant number: # OPP1215722) sub grant to India for Zn mainstreaming project and National Innovations on Climate Resilient Agriculture (NICRA), a network project of the Indian Council of Agricultural Research (ICAR).
KM acknowledges the Council of Scientific and Industrial Research (CSIR), New Delhi and Indian Council of Agricultural Research Institute (ICAR), and New Delhi for Junior Research Fellow Scholarships to complete this work as part of Ph.D. thesis.
The authors declare that the research was conducted in the absence of any commercial or financial relationships that could be construed as a potential conflict of interest.
All claims expressed in this article are solely those of the authors and do not necessarily represent those of their affiliated organizations, or those of the publisher, the editors and the reviewers. Any product that may be evaluated in this article, or claim that may be made by its manufacturer, is not guaranteed or endorsed by the publisher.
The Supplementary Material for this article can be found online at: https://www.frontiersin.org/articles/10.3389/fnut.2023.1105207/full#supplementary-material
1. FAO. Preventing Micronutrient Malnutrition a Guide to Food-based Approaches - Why Policy Makers Should Give Priority to Food-based Strategies. Washington, DC: ILSI PRESS (1997).
2. Lowe NM. The global challenge of hidden hunger: perspectives from the field. Proc Nutr Soc. (2021) 80:283–9. doi: 10.1017/S0029665121000902
3. Wedner SH, Ross DA. Vitamin A deficiency and its prevention. In: Heggenhougen K editor. Encyclopedia of Public Health. San Diego: Elsevier (2008). doi: 10.1016/B978-012373960-5.00642-0
4. Dev S, Babitt JL. Overview of iron metabolism in health and disease. Hemodialysis Int. (2017) 21:S6–20. doi: 10.1111/hdi.12542
5. World Health Organization. WHO Global Anaemia Estimates, 2021 Edition. Anaemia in Women and Children. (2021). Available online: https://www.who.int/data/gho/data/themes/topics/anaemia_in_women_and_children (accessed on February 18, 2022).
6. Institute of Medicine. Dietary Reference Intakes for Vitamin A, Vitamin K, Arsenic, Boron, Chromium, Copper, Iodine, Iron, Manganese, Molybdenum, Nickel, Silicon, Vanadium, and Zinc: a Report of the Panel on Micronutrients. Washington, DC: National Academy Press (2001).
7. Yang X, Wang H, Huang C, He X, Xu W, Luo Y, et al. Zinc enhances the cellular energy supply to improve cell motility and restore impaired energetic metabolism in a toxic environment induced by OTA. Sci Rep. (2017) 7:1–11. doi: 10.1038/s41598-017-14868-x
8. Maxfield L, Shukla S, Crane JS. Zinc deficiency. StatPearls [Internet]. Treasure Island, FL: StatPearls Publishing (2021).
9. Wessells KR, Brown KH. Estimating the global prevalence of zinc deficiency: results based on zinc availability in national food supplies and the prevalence of stunting. PLoS One. (2012) 7:e50568. doi: 10.1371/journal.pone.0050568
10. Reynolds M, Foulkes J, Furbank R, Griffiths S, King J, Murchie E, et al. Achieving yield gains in wheat. Plant Cell Environ. (2012) 35:1799–823. doi: 10.1111/j.1365-3040.2012.02588.x
11. Borrill P, Connorton JM, Balk J, Miller AJ, Sanders D, Uauy C. Biofortification of wheat grain with iron and zinc: integrating novel genomic resources and knowledge from model crops. Front Plant Sci. (2014) 5:53. doi: 10.3389/fpls.2014.00053
12. Kiran A, Wakeel A, Mahmood K, Mubaraka R, Haefele SM. Biofortification of staple crops to alleviate human malnutrition: contributions and potential in developing countries. Agronomy. (2022) 12:452. doi: 10.3390/agronomy12020452
13. Malik KA, Maqbool A. Transgenic crops for biofortification. Front Sustain Food Syst. (2020) 4:571402. doi: 10.3389/fsufs.2020.571402
14. Garg M, Sharma N, Sharma S, Kapoor P, Kumar A, Chunduri V, et al. Biofortified crops generated by breeding, agronomy, and transgenic approaches are improving lives of millions of people around the world. Front Nutr. (2018) 5:12. doi: 10.3389/fnut.2018.00012
15. Krishnappa G, Singh AM, Chaudhary S, Ahlawat AK, Singh SK, Shukla RB, et al. Molecular mapping of the grain iron and zinc concentration, protein content and thousand kernel weight in wheat (Triticum aestivum L.). PLoS One. (2017) 12:e0174972. doi: 10.1371/journal.pone.0174972
16. Velu G, Tutus Y, Gomez-Becerra HF, Hao Y, Demir L, Kara R, et al. QTL mapping for grain zinc and iron concentrations and zinc efficiency in a tetraploid and hexaploid wheat mapping populations. Plant Soil. (2017) 411:81–99. doi: 10.1007/s11104-016-3025-8
17. Krishnappa G, Rathan ND, Sehgal D, Ahlawat AK, Singh SK, Singh SK, et al. Identification of novel genomic regions for biofortification traits using an SNP marker-enriched linkage map in wheat (Triticum aestivum L.). Front Nutr. (2021) 8:669444. doi: 10.3389/fnut.2021.669444
18. Rathan ND, Sehgal D, Thiyagarajan K, Singh R, Singh AM, Govindan V. Identification of genetic loci and candidate genes related to grain zinc and iron concentration using a zinc-enriched wheat ‘Zinc-Shakti’. Front Genet. (2021) 12:652653. doi: 10.3389/fgene.2021.652653
19. Yadava DK, Hossain F, Mohapatra T. Nutritional security through crop biofortification in India: Status & future prospects. Indian J Med Res. (2018) 148:621. doi: 10.4103/ijmr.IJMR_1893_18
20. Singh GP, Prabhu KV, Singh PK, Singh AM, Jain N, Ramya P, et al. HD 3086: a new wheat variety for irrigated, timely sown condition of North Western Plains Zone of India. J Wheat Res. (2014) 6:179–80.
21. Sunilkumar VP, Krishna H, Devate NB, Manjunath KK, Chauhan D, Singh S, et al. Marker assisted improvement for leaf rust and moisture deficit stress tolerance in wheat variety HD3086. Front Plant Sci. (2022) 13:1035016. doi: 10.3389/fpls.2022.1035016
22. Singh GP, Jain N, Singh PK, Pandey MK, Sharma K, Kumar A, et al. Effect of recurrent selection on drought tolerance and related morpho-physiological traits in bread wheat. PLoS One. (2016) 11:e0156869. doi: 10.1371/journal.pone.0156869
23. International Rice Research Institute. PBTools, Version 1.4 2014. Biometrics and Breeding Informatics. Los Banos: PBGP Division, International Rice Research Institute (2014).
24. Alvarado G, Rodríguez FM, Pacheco A, Burgueño J, Crossa J, Vargas M, et al. META-R: a software to analyze data from multi-environment plant breeding trials. Crop J. (2020) 8:745–56. doi: 10.1016/j.cj.2020.03.010
25. Murray MG, Thompson W. Rapid isolation of high molecular weight plant DNA. Nucleic Acids Res. (1980) 8:4321–6. doi: 10.1093/nar/8.19.4321
26. Meng L, Li H, Zhang L, Wang J. QTL IciMapping: integrated software for genetic linkage map construction and quantitative trait locus mapping in biparental populations. Crop J. (2015) 3:269–83. doi: 10.1016/j.cj.2015.01.001
27. Wang J. Inclusive composite interval mapping of quantitative trait genes. Acta Agron Sin. (2009) 35:239–45. doi: 10.3724/SP.J.1006.2009.00239
28. McIntosh RA, Yamazak Y, Dubcovsky J, Rogers J, Morris C, Apples R, et al. Catalogue of gene symbols for wheat. Proceedings of the 12th International Wheat Genetics Symposium. GrainGenes. Washington, DC: USDA (2013).
29. Devate NB, Krishna H, Sunilkumar VP, Manjunath KK, Mishra CN, Jain N, et al. Identification of genomic regions of wheat associated with grain Fe and Zn content under drought and heat stress using genome-wide association study. Front Genet. (2022) 13:1034947. doi: 10.3389/fgene.2022.1034947
30. Velu G, Guzman C, Mondal S, Autrique JE, Huerta J, Singh RP. Effect of drought and elevated temperature on grain zinc and iron concentrations in CIMMYT spring wheat. J Cereal Sci. (2016) 69:182–6. doi: 10.1016/j.jcs.2016.03.006
31. Djanaguiraman M, Boyle DL, Welti R, Jagadish SVK, Prasad PVV. Decreased photosynthetic rate under high temperature in wheat is due to lipid desaturation, oxidation, acylation, and damage of organelles. BMC Plant Biol. (2018) 18:55. doi: 10.1186/s12870-018-1263-z
32. Wang Y, Xu X, Hao Y, Zhang Y, Liu Y, Pu Z, et al. QTL mapping for grain zinc and iron concentrations in bread wheat. Front Nutr. (2021) 8:680391. doi: 10.3389/fnut.2021.680391
33. Liu J, Wu B, Singh RP, Velu G. QTL mapping for micronutrients concentration and yield component traits in a hexaploid wheat mapping population. J Cereal Sci. (2019) 88:57–64. doi: 10.1016/j.jcs.2019.05.008
34. Tiwari VK, Rawat N, Chhuneja P, Neelam K, Aggarwal R, Randhawa GS, et al. Mapping of quantitative trait loci for grain iron and zinc concentration in diploid A genome wheat. J Heredity. (2009) 100:771–6. doi: 10.1093/jhered/esp030
35. Tahir M, Shafi S, Khan MA, Sheikh FA, Bhat MA, Sofi PA, et al. Grain micronutrient evaluation of wheat (Triticum aestivum) germplasm and molecular characterisation via genic and random SSR markers. Crop Past Sci. (2021) 73. doi: 10.1071/CP21116
36. Regmi S, Poudel B, Ojha BR, Kharel R, Joshi P, Khanal S, et al. Estimation of genetic parameters of different wheat genotype traits in Chitwan, Nepal. Int J Agron. (2021) 2021:1–10. doi: 10.1155/2021/6651325
37. Crespo-Herrera LA, Govindan V, Stangoulis J, Hao Y, Singh RP. QTL mapping of grain Zn and Fe concentrations in two hexaploid wheat RIL populations with ample transgressive segregation. Front Plant Sci. (2017) 8:1800. doi: 10.3389/fpls.2017.01800
38. Liu H, Wang ZH, Li F, Li K, Yang N, Yang Y, et al. Grain iron and zinc concentrations of wheat and their relationships to yield in major wheat production areas in China. Field Crops Res. (2014) 156:151–60. doi: 10.1016/j.fcr.2013.11.011
39. Crespo-Herrera LA, Velu G, Singh RP. Quantitative trait loci mapping reveals pleiotropic effect for grain iron and zinc concentrations in wheat. Ann Appl Biol. (2016) 169:27–35. doi: 10.1111/aab.12276
40. Liu T, Wu L, Gan X, Chen W, Liu B, Fedak G, et al. Mapping quantitative trait loci for 1000-grain weight in a double haploid population of common wheat. Int J Mol Sci. (2020) 21:3960. doi: 10.3390/ijms21113960
41. Cabral AL, Jordan MC, Larson G, Somers DJ, Humphreys DG, McCartney CA. Relationship between QTL for grain shape, grain weight, test weight, milling yield, and plant height in the spring wheat cross RL4452/‘AC Domain’. PLoS One. (2018) 13:e0190681. doi: 10.1371/journal.pone.0190681
42. Ma J, Liu Y, Zhang P, Chen T, Tian T, Wang P, et al. Identification of quantitative trait loci (QTL) and meta-QTL analysis for kernel size-related traits in wheat (Triticum aestivum L.). BMC Plant Biol. (2022) 22:1–18. doi: 10.1186/s12870-022-03989-9
43. Lemmon MA, Ferguson KM, Abrams CS. Pleckstrin homology domains and the cytoskeleton. FEBS Lett. (2002) 513:71–6. doi: 10.1016/S0014-5793(01)03243-4
44. Simonsen A, Wurmser AE, Emr SD, Stenmark H. The role of phosphoinositides in membrane transport. Curr Opin Cell Biol. (2001) 13:485–92. doi: 10.1016/S0955-0674(00)00240-4
45. Hille B, Dickson EJ, Kruse M, Vivas O, Suh BC. Phosphoinositides regulate ion channels. Biochim Biophys Acta. (2015) 1851:844–56. doi: 10.1016/j.bbalip.2014.09.010
46. Vaccaro FA, Drennan CL. The role of nucleoside triphosphate hydrolase metallochaperones in making metalloenzymes. Metallomics. (2022) 14:mfac030. doi: 10.1093/mtomcs/mfac030
47. Rosenzweig AC. Metallochaperones: bind and deliver. Chem Biol. (2002) 9:673–7. doi: 10.1016/S1074-5521(02)00156-4
48. Philpott CC, Ryu MS, Frey A, Patel S. Cytosolic iron chaperones: proteins delivering iron cofactors in the cytosol of mammalian cells. J Biol Chem. (2017) 292:12764–71. doi: 10.1074/jbc.R117.791962
49. Zhou Z, Shi X, Zhao G, Qin M, Ibba M I, Wang Y, et al. Identification of novel genomic regions and superior alleles associated with Zn accumulation in wheat using a genome-wide association analysis method. Int J Mol Sci. (2020) 21:1928. doi: 10.3390/ijms21061928
50. Hong MJ, Kim JB, Seo YW, Kim DY. F-box genes in the wheat genome and expression profiling in wheat at different developmental stages. Genes. (2020) 11:1154. doi: 10.3390/genes11101154
51. Negisho K, Shibru S, Matros A, Pillen K, Ordon F, Wehner G. Genomic dissection reveals QTLs for grain biomass and correlated traits under drought stress in Ethiopian durum wheat (Triticum turgidum ssp. durum). Plant Breed. (2022) 141:338–54. doi: 10.1111/pbr.13010
52. Abdollahi Sisi N, Stein N, Himmelbach A, Mohammadi SA. High-density linkage mapping of agronomic trait QTLs in wheat under water deficit condition using genotyping by sequencing (GBS). Plants. (2022) 11:2533. doi: 10.3390/plants11192533
53. Ramya P, Chaubal A, Kulkarni K, Gupta L, Kadoo N, Dhaliwal HS, et al. QTL mapping of 1000-kernel weight, kernel length, and kernel width in bread wheat (Triticum aestivum L.). J Appl Genet. (2010) 51:421–9. doi: 10.1007/BF03208872
54. Goel S, Singh K, Singh B, Grewal S, Dwivedi N, Alqarawi AA, et al. Analysis of genetic control and QTL mapping of essential wheat grain quality traits in a recombinant inbred population. PLoS One. (2019) 14:e0200669. doi: 10.1371/journal.pone.0200669
Keywords: wheat, drought, heat, combined stress, QTL, RILs
Citation: Manjunath KK, Krishna H, Devate NB, Sunilkumar VP, Chauhan D, Singh S, Mishra CN, Singh JB, Sinha N, Jain N, Singh GP and Singh PK (2023) Mapping of the QTLs governing grain micronutrients and thousand kernel weight in wheat (Triticum aestivum L.) using high density SNP markers. Front. Nutr. 10:1105207. doi: 10.3389/fnut.2023.1105207
Received: 22 November 2022; Accepted: 27 January 2023;
Published: 10 February 2023.
Edited by:
K. N. Ganapathy, ICAR-Indian Institute of Millets Research (IIMR), IndiaReviewed by:
Dinesh Joshi, ICAR-Vivekananda Institute of Hill Agriculture, IndiaCopyright © 2023 Manjunath, Krishna, Devate, Sunilkumar, Chauhan, Singh, Mishra, Singh, Sinha, Jain, Singh and Singh. This is an open-access article distributed under the terms of the Creative Commons Attribution License (CC BY). The use, distribution or reproduction in other forums is permitted, provided the original author(s) and the copyright owner(s) are credited and that the original publication in this journal is cited, in accordance with accepted academic practice. No use, distribution or reproduction is permitted which does not comply with these terms.
*Correspondence: Hari Krishna,  aGFyaWtyaXNobmEuYWdyaUBnbWFpbC5jb20=; Pradeep Kumar Singh, cGtzaW5naGlhcmlAZ21haWwuY29t
Disclaimer: All claims expressed in this article are solely those of the authors and do not necessarily represent those of their affiliated organizations, or those of the publisher, the editors and the reviewers. Any product that may be evaluated in this article or claim that may be made by its manufacturer is not guaranteed or endorsed by the publisher.
Research integrity at Frontiers
Learn more about the work of our research integrity team to safeguard the quality of each article we publish.