 Zheng Qin
 Xinyang Chen
 Jiantong Sun1
 Luojia Jiang
95% of researchers rate our articles as excellent or good
Learn more about the work of our research integrity team to safeguard the quality of each article we publish.
Find out more
ORIGINAL RESEARCH article
Front. Nutr. , 10 March 2023
Sec. Clinical Nutrition
Volume 10 - 2023 | https://doi.org/10.3389/fnut.2023.1076301
This article is part of the Research Topic Improving Body Composition and Functional Capacity in Chronic Kidney Disease Patients View all 6 articles
Aims: We aimed to investigate the association of visceral adiposity index (VAI) with decreased renal function in US adults.
Design and methods: Cross-sectional data were analyzed for 35,018 adults in the National Health and Nutrition Examination Survey (NHANES) 2005–2018. VAI was determined using waist circumference, body mass index (BMI), triglycerides (TGs) and high-density lipoprotein-cholesterol. Albuminuria was defined as urinary albumin-to-creatinine ratio (ACR) >30 mg/g. A low estimated-glomerular filtration rate (eGFR) was defined as an eGFR lower than 60 ml/min/1.73 m2. Chronic kidney disease (CKD) was defined as either albuminuria or low-eGFR. A multivariable logistic regression analysis was utilized to explore the relationship of VAI with albuminuria, low-eGFR and CKD. Subgroup analysis and interaction tests were also conducted.
Results: A total of 35,018 participants were enrolled with albuminuria, low-eGFR, and CKD prevalence rates of 5.18, 6.42, and 10.62%, respectively, which increased with the higher VAI tertiles. After full adjustment, a positive association of VAI with albuminuria (OR = 1.03, 95% CI: 1.00, 1.06) and CKD (OR = 1.04, 95% CI: 1.02, 1.06) was observed. Participants in the highest VAI tertile had a significantly 30% increased risk for albuminuria (OR = 1.30, 95% CI: 1.07, 1.58) and a 27% increased risk for CKD (OR = 1.27, 95% CI: 1.08, 1.49) compared with those in the lowest VAI tertile. No statistically significant association between VAI and low-eGFR was detected. Subgroup analysis and the interaction term indicated that there was no significant difference among different stratifications.
Conclusion: Visceral adiposity accumulation evaluating by VAI was associated with increased likelihood of the decline in renal function.
The damage of renal function could be reflected in albuminuria, a decrease in the estimated-glomerular filtration rate (eGFR) and even the development of chronic kidney disease (CKD) (1). Approximately 5–19% of the general population suffer from albuminuria, which is a putative marker of an impaired glomerular filtration barrier and abnormal urinary albumin excretion (2–4). Decreased renal function is usually defined as eGFR <60 mL/min/1.73 m2 (5). Both albuminuria and low-eGFR are not only markers of early kidney disease, but also predictors of CKD progression and cardiovascular disease (6, 7). CKD is a chronic condition presented as kidney structural or functional abnormalities caused by multiple factors with a global prevalence of 10.5–13.1%, which represents a significant global health burden as well (8, 9). Globally, the incidence of CKD increased by 89%, prevalence increased by 87%, death due to CKD increased by 98%, and disability-adjusted-life-years (DALYs) increased by 62% from 1990 to 2016 (10).
Visceral Adiposity index (VAI), which is also known as visceral fat grade, has proven to be a reliable indicator of visceral fat accumulation and dysfunction in adipose tissue (11, 12). It was calculated using anthropometric [waist circumference (13), body mass index (BMI)] and metabolic parameters [triglyceride (TG) and high density lipoprotein-cholesterol (HDL-C) concentrations] to evaluate visceral obesity function, which has been broadly used in previous studies (14). The higher the index value, the higher the content of visceral fat. Compared to other traditional body assessment parameters including BMI, WC, and waist-to-height ratio (WHtR), VAI can accurately distinguish visceral adiposity from subcutaneous adiposity. Magnetic Resonance Imaging (MRI) and Computed Tomography (CT) are precise and reliable to identify visceral fat, however, these machine-based measurements can be costly and difficult to conduct for some individuals. Thus, using VAI, a mathematical model that takes into account both anthropometric and metabolic parameters to evaluate the adipose distribution may be a better tool for assessing the impacts of visceral adiposity on clinical outcomes. Many studies have confirmed the positive predictive value of VAI for insulin insensitivity and diabetes (15–18). Moreover, VAI is significantly associated with cardiovascular diseases, such as hypertension and arterial atherosclerosis (19–22). The correlation of VAI with non-alcoholic fatty liver disease (NAFLD) (23, 24), metabolic syndrome (MS) (25), and some tumors (26, 27) has also been widely reported. More particularly, VAI may also be a superior predictor for kidney disease. Several studies have suggested a relationship between visceral fat and renal function. An epidemiological study in Netherlands revealed that visceral fat was associated with microalbuminuria in women while liver fat was not, which was supported by Mendelian randomization (28). Another retrospective study including 14,529 male and 10,561 female adults in China demonstrated independent predictive power of visceral obesity on renal damage in all ages and both genders, except men under 45 years of age (29). Moreover, there is evidence to suggest that obesity, especially central obesity, is an important risk factor for CKD (30–33). However, the association has not been studied in a nationally representative sample of US adults.
Hence, we investigated whether VAI was associated with decreased renal function among National Health and Nutrition Examination Survey (NHANES) subjects. Our hypothesis was that an elevated VAI would increase the risk of reduced kidney function.
National Health and Nutrition Examination Survey is a national population-based cross-sectional cohort study to assess the nutrition and health status of non-institutionalized civilian populations in the US (34). For recruitment of a representative sample of the US population, a stratified, multistage and probability sampling design was used.
The National Center for Health Statistics (NCHS) Research Ethics Review Board approved all NHANES protocols. All survey participants provided written informed consent. A detailed description of the NHANES study and its data is available online at https://www.cdc.gov/nchs/nhanes/.
We used the NHANES survey cycles 2005–2018 because these surveys have provided complete data to calculate the VAI, urinary albumin: creatinine ratio (ACR) and eGFR using the same protocols. An in-home interview and a physical examination were conducted at a mobile examination center to collect blood and urine samples.
The analysis included participants with complete information about VAI and renal function. There were initially 70,190 participants enrolled in the study. After excluding participants aged <18 years (n = 28047), pregnant (n = 737), missing data about ACR (n = 2646), VAI (total, n = 3741; BMI, n = 445; TG, n = 2124; WC, n = 1163; HDL-C, n = 9), and eGFR (n = 1), our final analysis included 35,018 eligible participants (Figure 1).
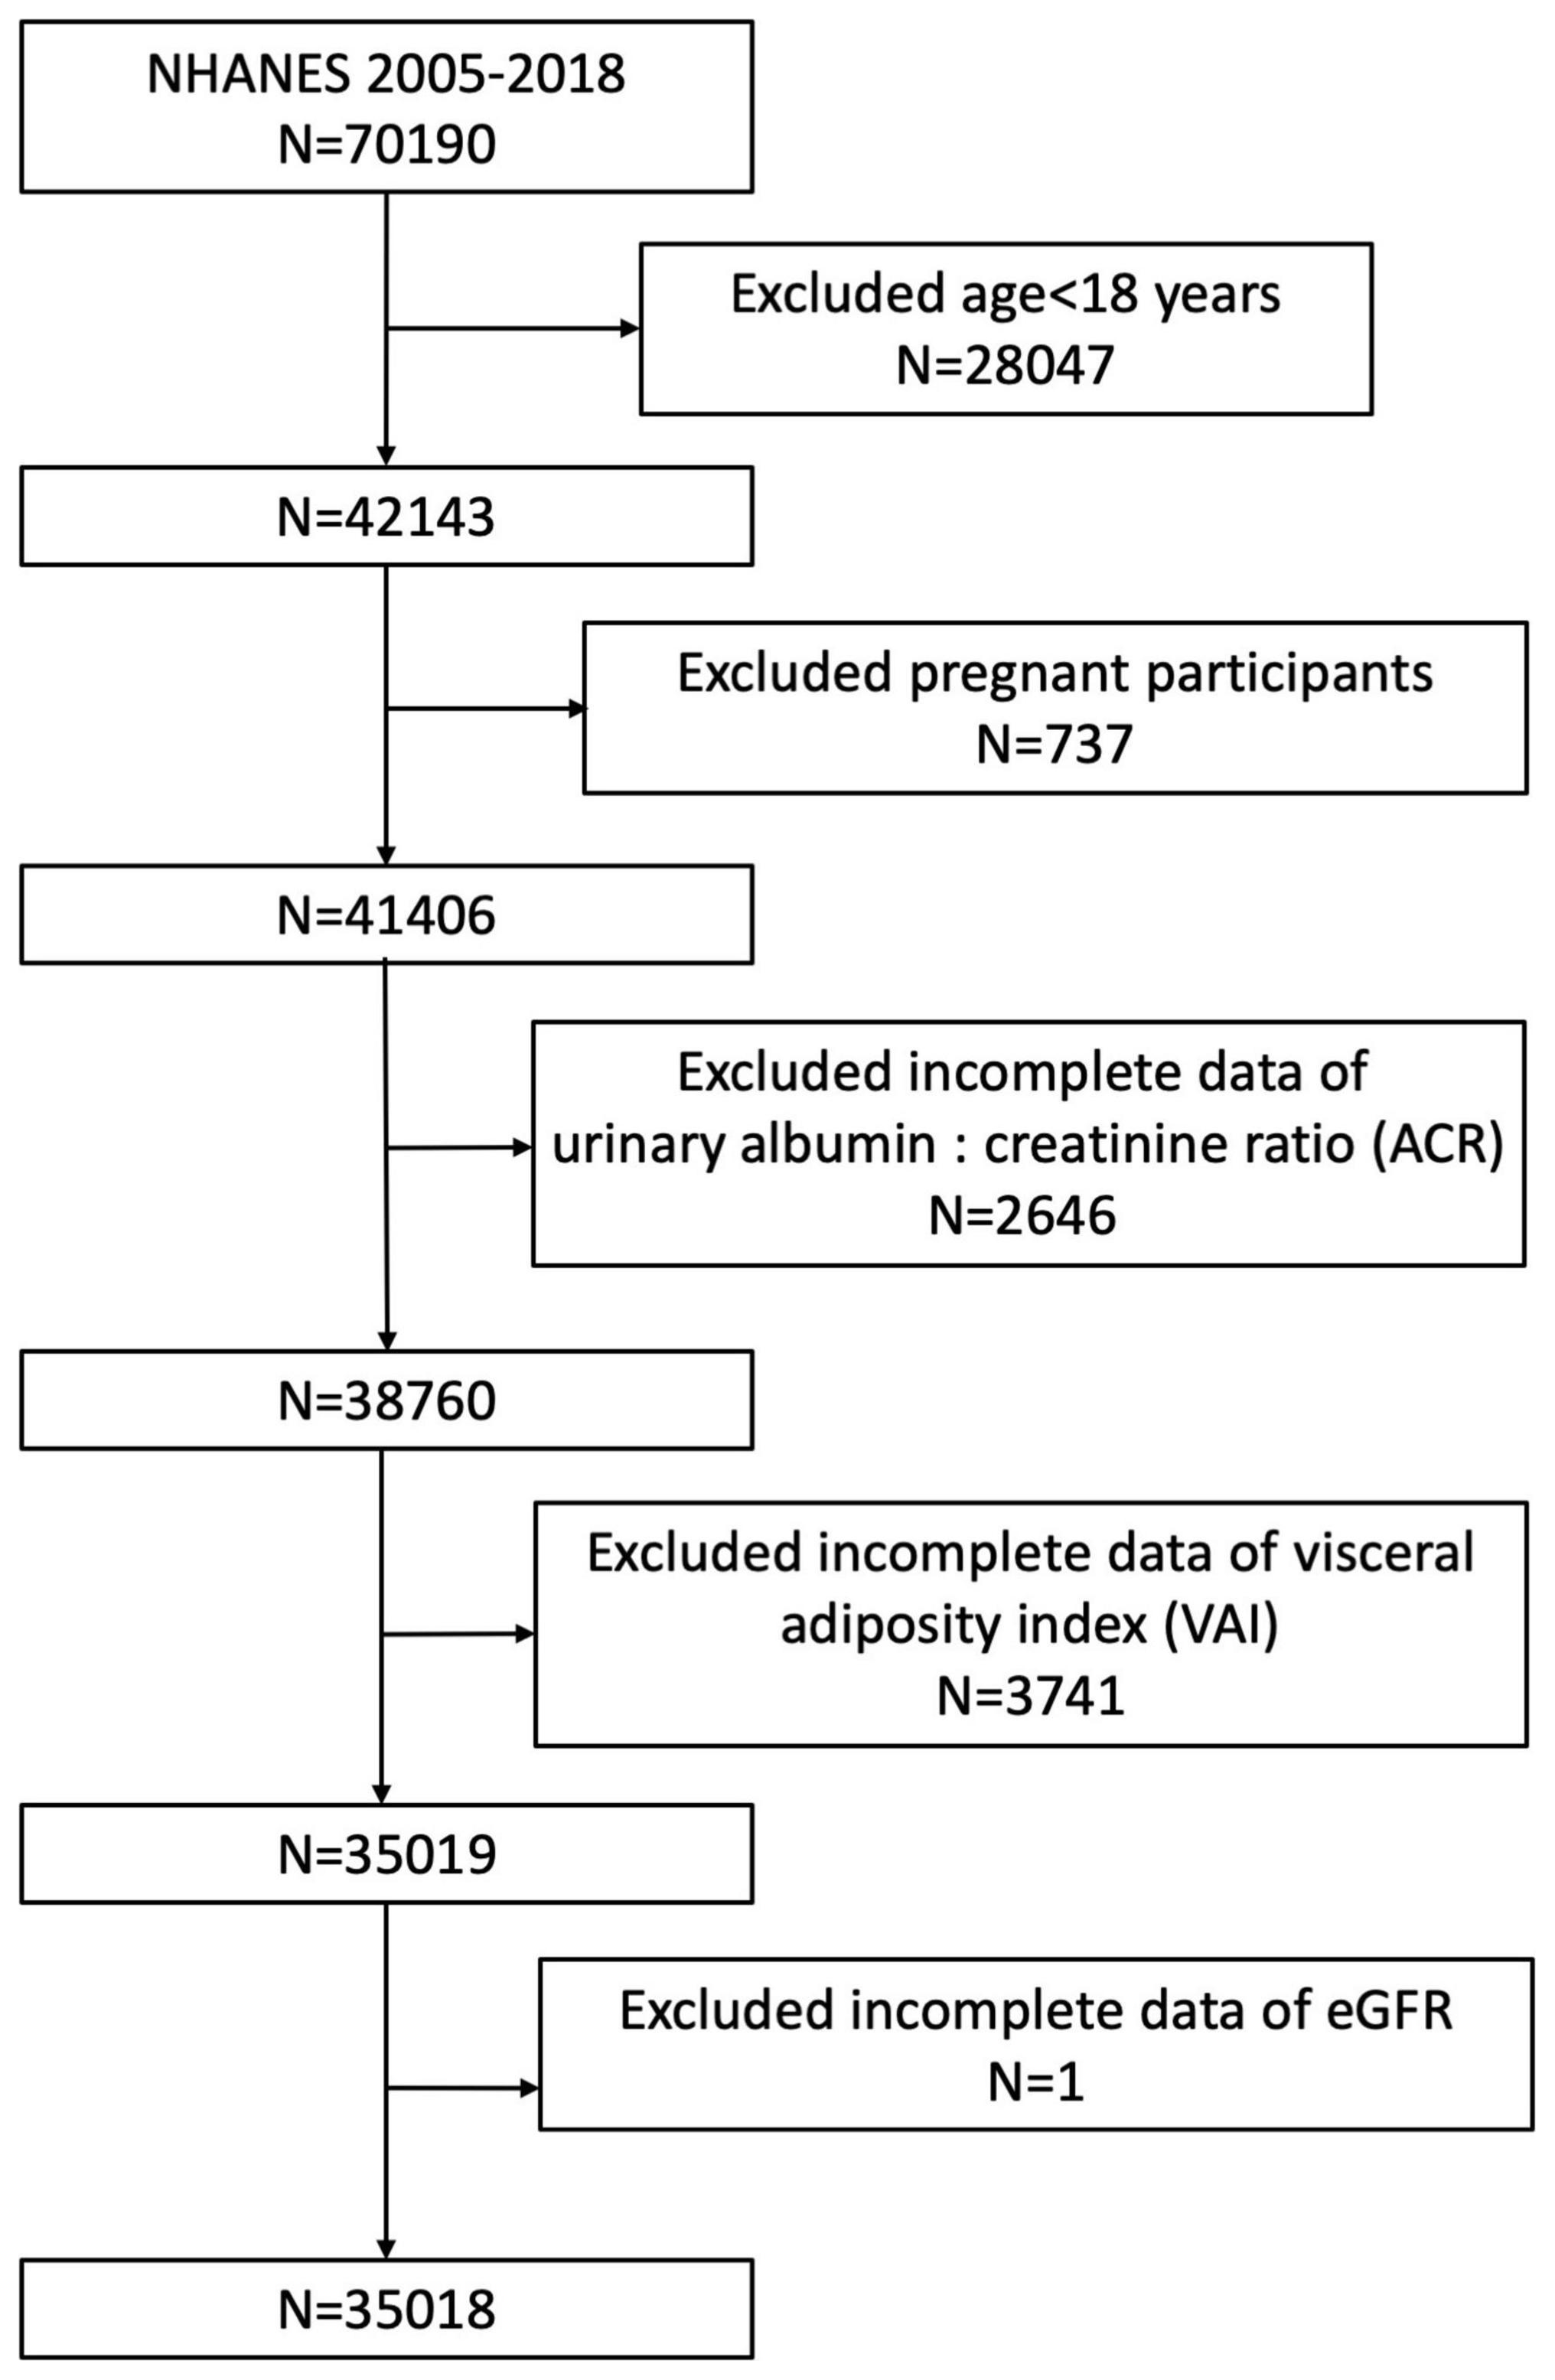
Figure 1. Flowchart of the sample selection from NHANES 2005–2018.
Visceral adiposity index is a gender-specific index that estimates visceral adiposity by combining WC, BMI, TG, and HDL-C. Higher VAI scores indicate more estimated visceral fat. The VAI for each participant was calculated by using the following formulas (19). For males: VAI = WC/(39.68 + (1.88 × BMI)) × (TG/1.03) × (1.31/HDL-C); For females: VAI = WC/(36.58 + (1.89 × BMI)) × (TG/0.81) × (1.52/HDL-C). TG and HDL-C were calculated in mmol/L, and WC was calculated in cm in the formulas. The VAI was analyzed as a continuous variable and further analysis was conducted by grouping participants according to their VAI tertiles.
A single, spot urine sample was used to determine urinary albumin and creatinine using a solid-phase fluorescent immunoassay and a modified Jaffe kinetic method. Based on the urinary ACR, we defined albuminuria as ACR >30 mg/g. Serum creatinine was measured using the Jaffe rate method and calibrated isotope dilution mass spectrometry. The CKD Epidemiology Collaboration (CKD-EPI) creatinine equation was used to calculate eGFR based on data about gender, race, age, and SCr (35). Low-eGFR was defined as an eGFR lower than 60 ml/min/1.73 m2. CKD is characterized by albuminuria or a low-eGFR as defined by Kidney Disease: Improving Global Outcomes 2012 (36).
In our study, VAI were designed as an exposure variable, albuminuria, low-eGFR and CKD were treated as outcome variables.
Several potential covariates that may confound the association between VAI and decreased renal function were summarized in our analysis, including gender, age, race, education level, smoking status, BMI, serum creatinine, serum uric acid, total cholesterol, ALT, AST, hypertension and diabetes. According to BMI, participants were considered normal weight, overweight and obese when their BMI fell between <25, 25–29.9, and ≥30 kg/m2. In addition, we also treated gender (male/female), age (<60/≥60 years), BMI (normal weight/overweight/obesity), hypertension (yes/no), diabetes (yes/no) as stratified factors to conduct subgroup analysis and pre-specified effect modifiers to evaluate the interaction effect. All details regarding these variables are available on the website at www.cdc.gov/nchs/nhanes/.
According to NHANES analytic guidelines, statistical analyses were performed with appropriate sampling weights and accounting for complex multistage cluster surveys. Means with standard error (SE) was calculated for continuous variables, and proportions were calculated for categorical variables. Participants grouped by VAI tertiles were compared using a weighted Student’s t-test (for continuous variables) or a weighted chi-square test (for categorical variables). Three different models were analyzed using multivariable logistic regression to determine the effects of VAI on outcome variables (albuminuria, low eGFR, and CKD). In model 1, no covariates were adjusted. Model 2 was adjusted for gender, age and race. Model 3 was adjusted for gender, age, race, education level, BMI, ALT, AST, serum creatinine, serum uric acid, total cholesterol, hypertension, diabetes and smoking status. To reduce the potential bias and enhance the reliability of our study, first, we conducted all analysis with the consideration of NHANES sampling weights to make our samples more representative and reduce the selection bias. In addition, we adjusted for many confounding covariates to reduce the confounding bias. We also treated VAI as tertiles to evaluate the robustness in sensitivity analysis. Subgroup analyses of the associations of VAI with albuminuria, low-eGFR and CKD were conducted with stratified factors, including gender (male/female), age (<60/≥60 years), BMI (normal weight/overweight/obesity), hypertension (yes/no), and diabetes (yes/no). In addition, the stratified factors were also treated as pre-specified potential modifiers, with an interaction term added to measure heterogeneity among subgroups. Input of missing values was done by median for continuous variables or mode for categorical variables. All analyses were preformed using R version 3.4.3 (The R Foundation)1 and Empower software (X&Y Solutions, Inc., Boston MA, USA).2 The level of statistical significance was set at P < 0.05.
There were 35,018 participants enrolled in this study, whose average age was 46.44 ± 0.23 years. Among them, 49.20% were male and 50.80% were female. The prevalence rates of albuminuria, low-eGFR and CKD was 5.18, 6.42, and 10.62%, respectively. Participants in higher VAI tertiles had increased rates of albuminuria, low-eGFR, CKD as well. In the lowest VAI tertile participants, 3.93% had albuminuria, 4.23% had low-eGFR and 7.65% had CKD. In the middle VAI tertile participants, 5.17% had albuminuria, 6.26% had low-eGFR and 10.54% had CKD. Participants in the highest VAI tertile showed the highest rates of albuminuria (6.44%), low-eGFR (8.78%) and CKD (13.67%). Age, gender, smoking status, BMI, diabetes, hypertension, serum creatinine, serum uric acid, total cholesterol, HDL-C, ALT, AST, waist circumference, TGs, urinary albumin and ACR were significantly different among the VAI tertiles (all P < 0.05). Compared to the lowest VAI group, participants with increased VAI group were significantly more likely to have hypertension, diabetes, elevated BMI, serum uric acid, total cholesterol, ALT, AST, waist circumference, TGs, urinary albumin, ACR and decreased HDL-C levels (all P < 0.05). There was no statistically significant difference between tertiles in race, education level or urinary creatinine (all P > 0.05) (Table 1).
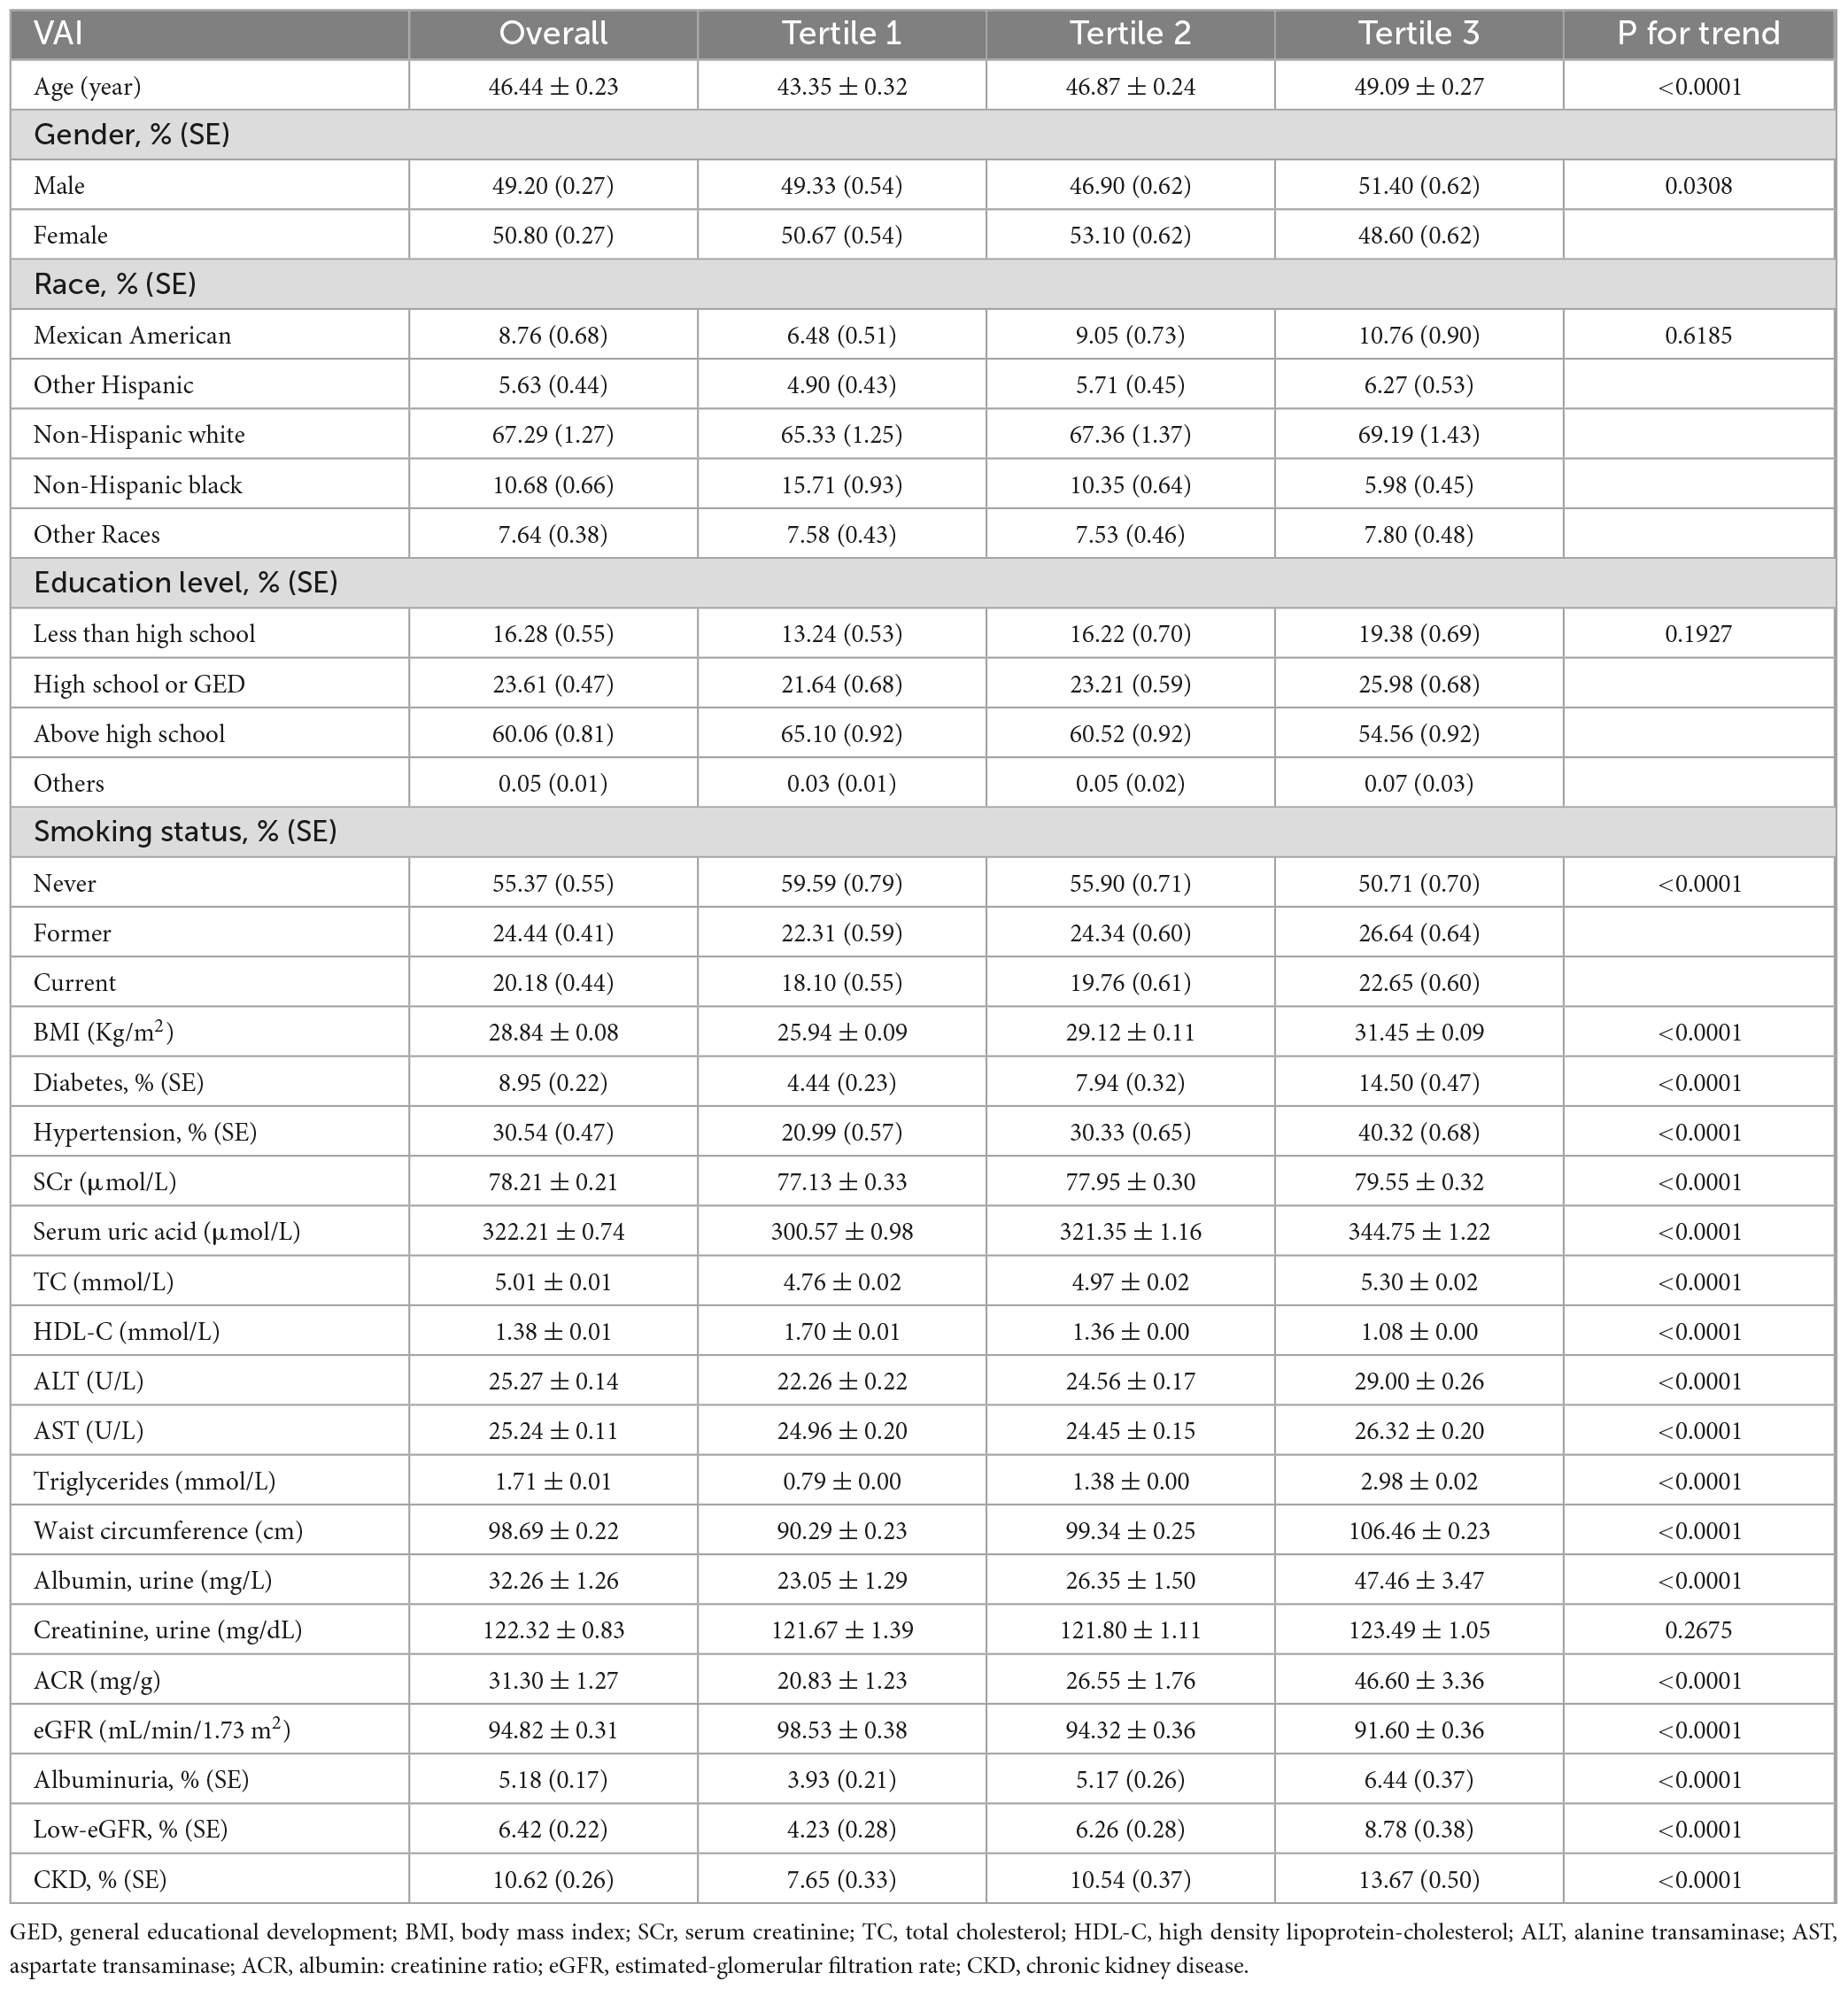
Table 1. Baseline characteristics according to visceral adiposity index tertiles.
Our results showed that a higher VAI was associated with an increased risk of albuminuria. This association was significant both in our crude model (OR = 1.04, 95% CI: 1.03, 1.06) and minimally adjusted model (OR = 1.06, 95% CI: 1.04, 1.09). After full adjustment, a positive association between VAI and albuminuria still remained stable (OR = 1.03, 95% CI: 1.00, 1.06), indicating that each unit of VAI score was associated with a 4% increase in albuminuria risk. When treating VAI as tertiles, participants in the highest VAI tertile had a significantly 30% increased risk of albuminuria compared with those in the lowest tertile (OR = 1.30, 95% CI: 1.07, 1.58) (Table 2).
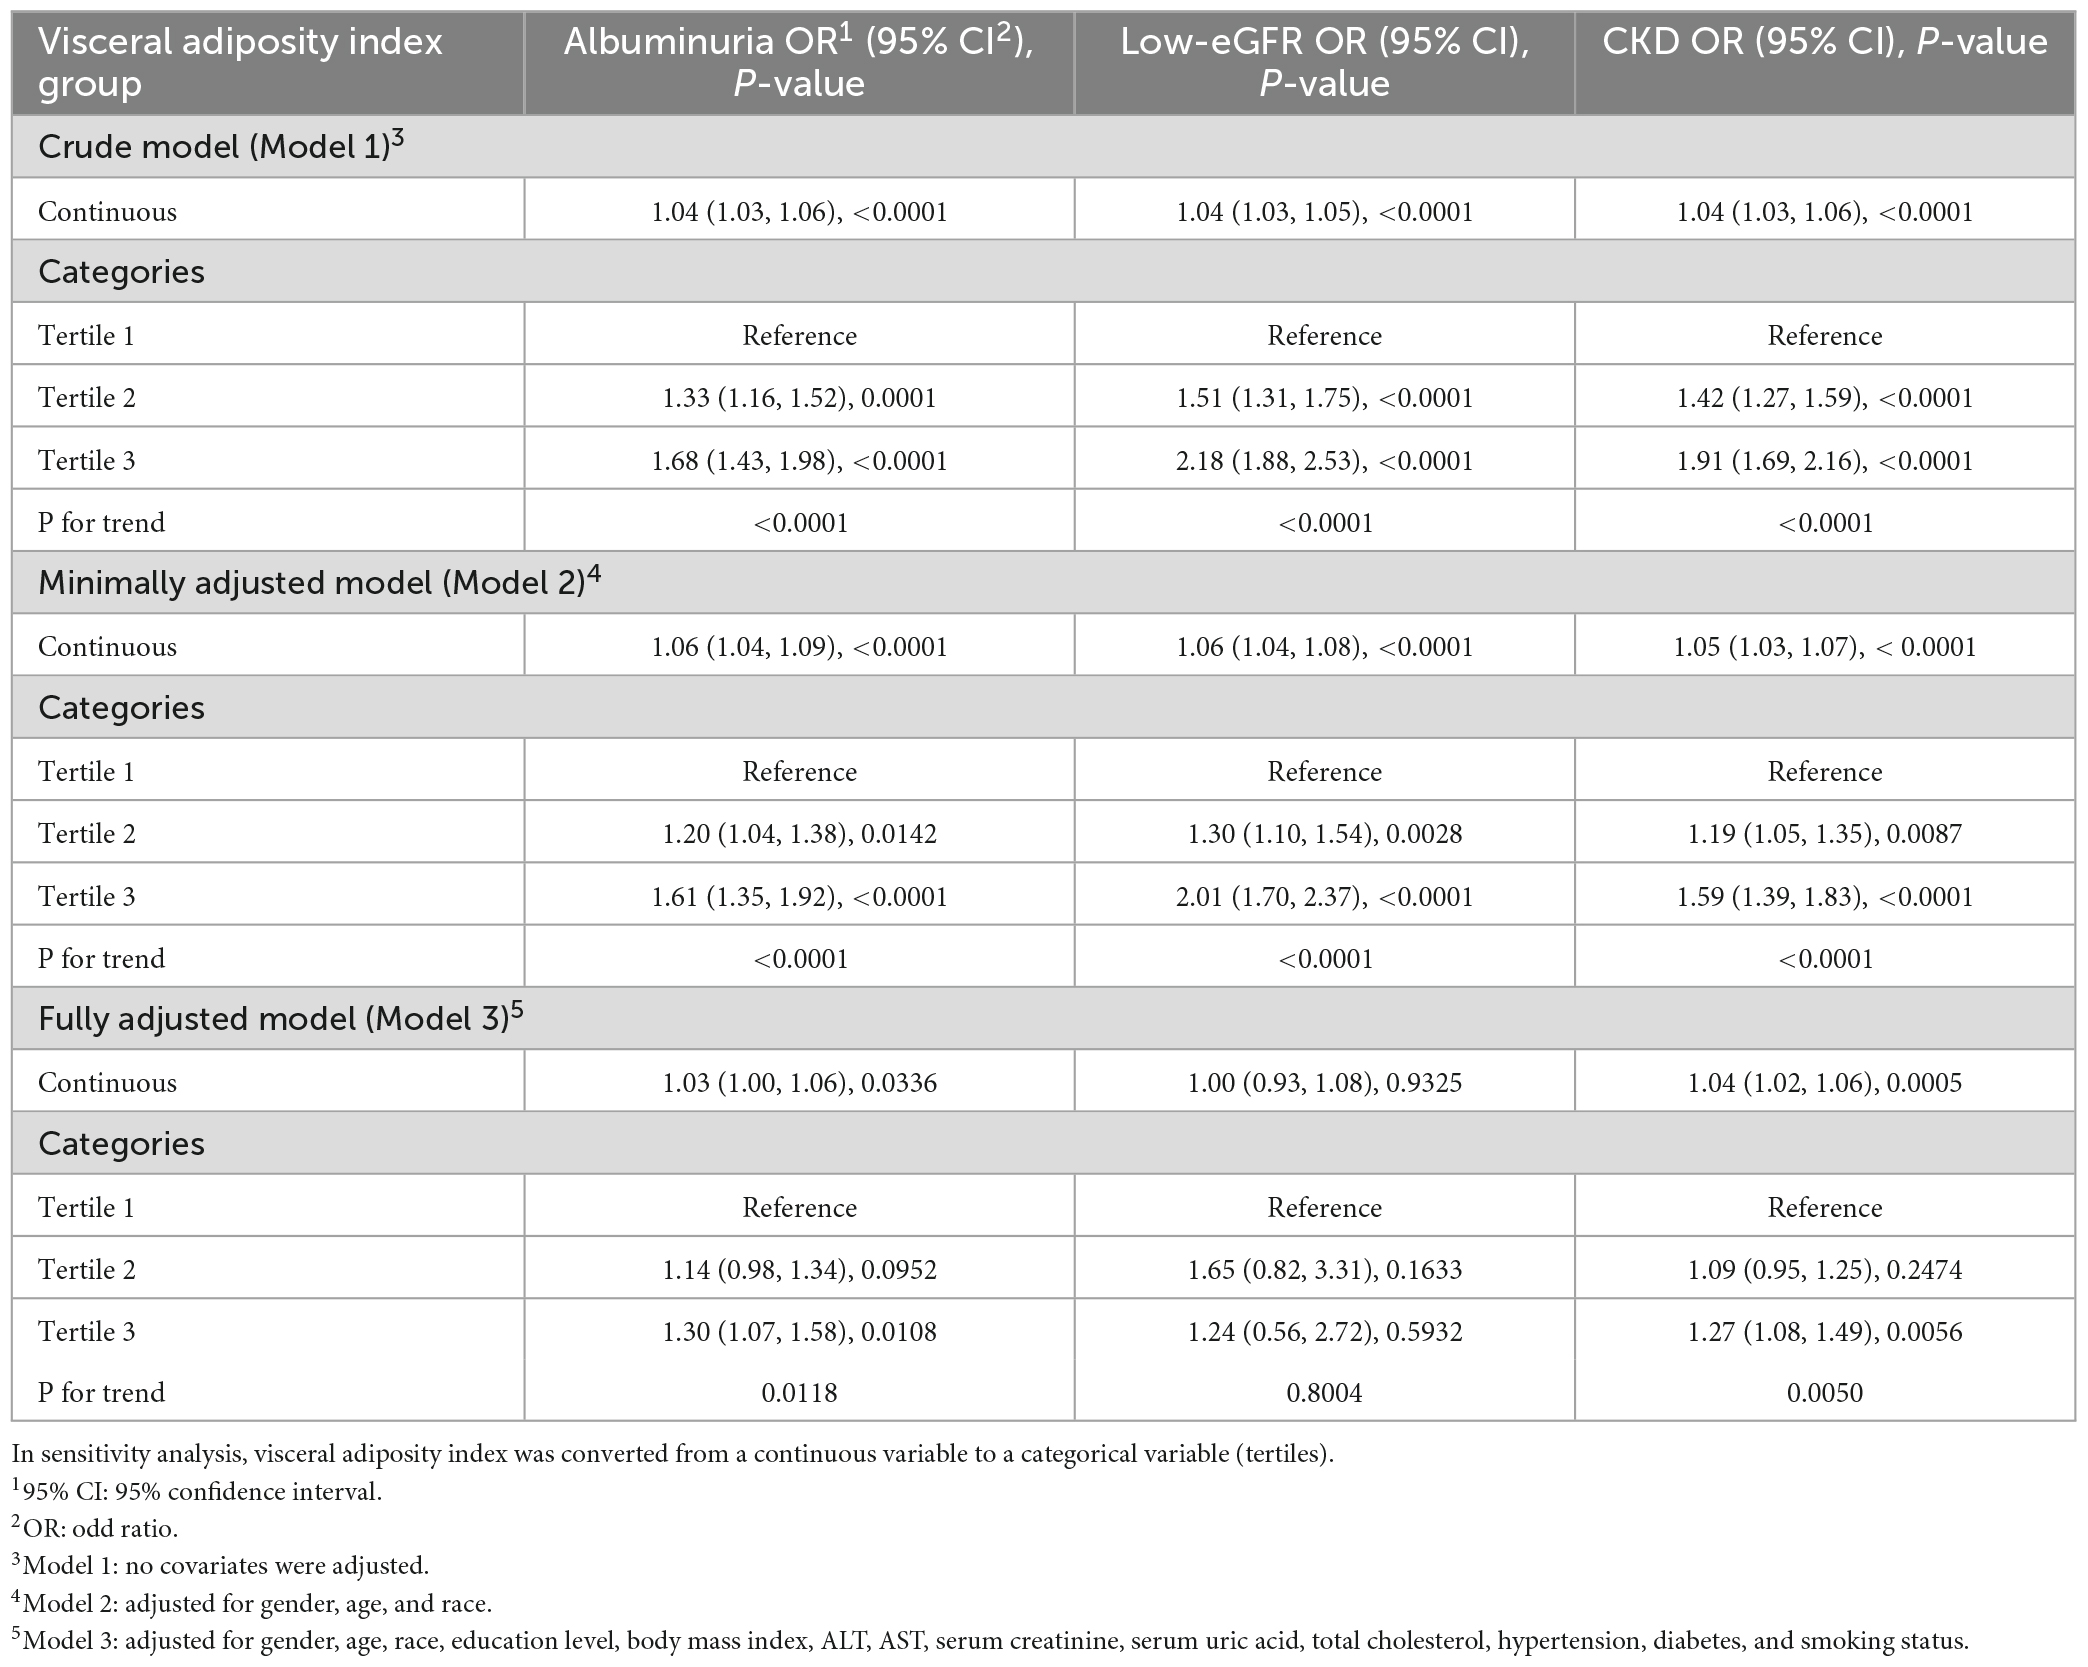
Table 2. Association between visceral adiposity index and decreased renal function.
We also estimated the association of VAI with low-eGFR in three different models. We found a significant positive association between VAI and low-eGFR both in both the crude (Model 1: OR = 1.04, 95% CI: 1.03, 1.05) and minimally adjusted models (Model 2: OR = 1.06, 95% CI: 1.04, 1.08). Despite this, this positive relationship did not reach statistical significance in fully adjusted analysis (OR = 1.00, 95% CI: 0.93, 1.08). Additionally, they did not show any statistically significant association when VAI was treated as tertiles (Table 2).
For CKD, we also found a positive association between VAI and the increased likelihood of CKD with statistical significance. In our crude model and minimally adjusted model, participants with a higher VAI tended to show an increased risk of CKD (Model 1: OR = 1.04, 95% CI: 1.03, 1.06; Model 2: OR = 1.05, 95% CI: 1.03, 1.07). A unit higher of VAI increased CKD risk by 4% after full adjustment (Model 3: OR = 1.04, 95% CI: 1.02, 1.06). Even after treating VAI as tertiles, there was still a statistically significant association. A significant 27% higher risk was experienced by participants in the highest VAI tertile compared to those in the lowest VAI tertile (OR = 1.27, 95% CI: 1.08, 1.49) (Table 2).
Our results indicated that the associations of VAI level with decreased renal function were not consistent. A significant relationship of VAI with albuminuria was detected in female (OR = 1.03), age ≥60 years (OR = 1.05), normal weight (OR = 1.06) and obese (OR = 1.04), hypertension (OR = 1.04) and non-diabetes subjects (OR = 1.03), respectively. In the interaction test, VAI and albuminuria were not significantly associated with each stratification (Figure 2).
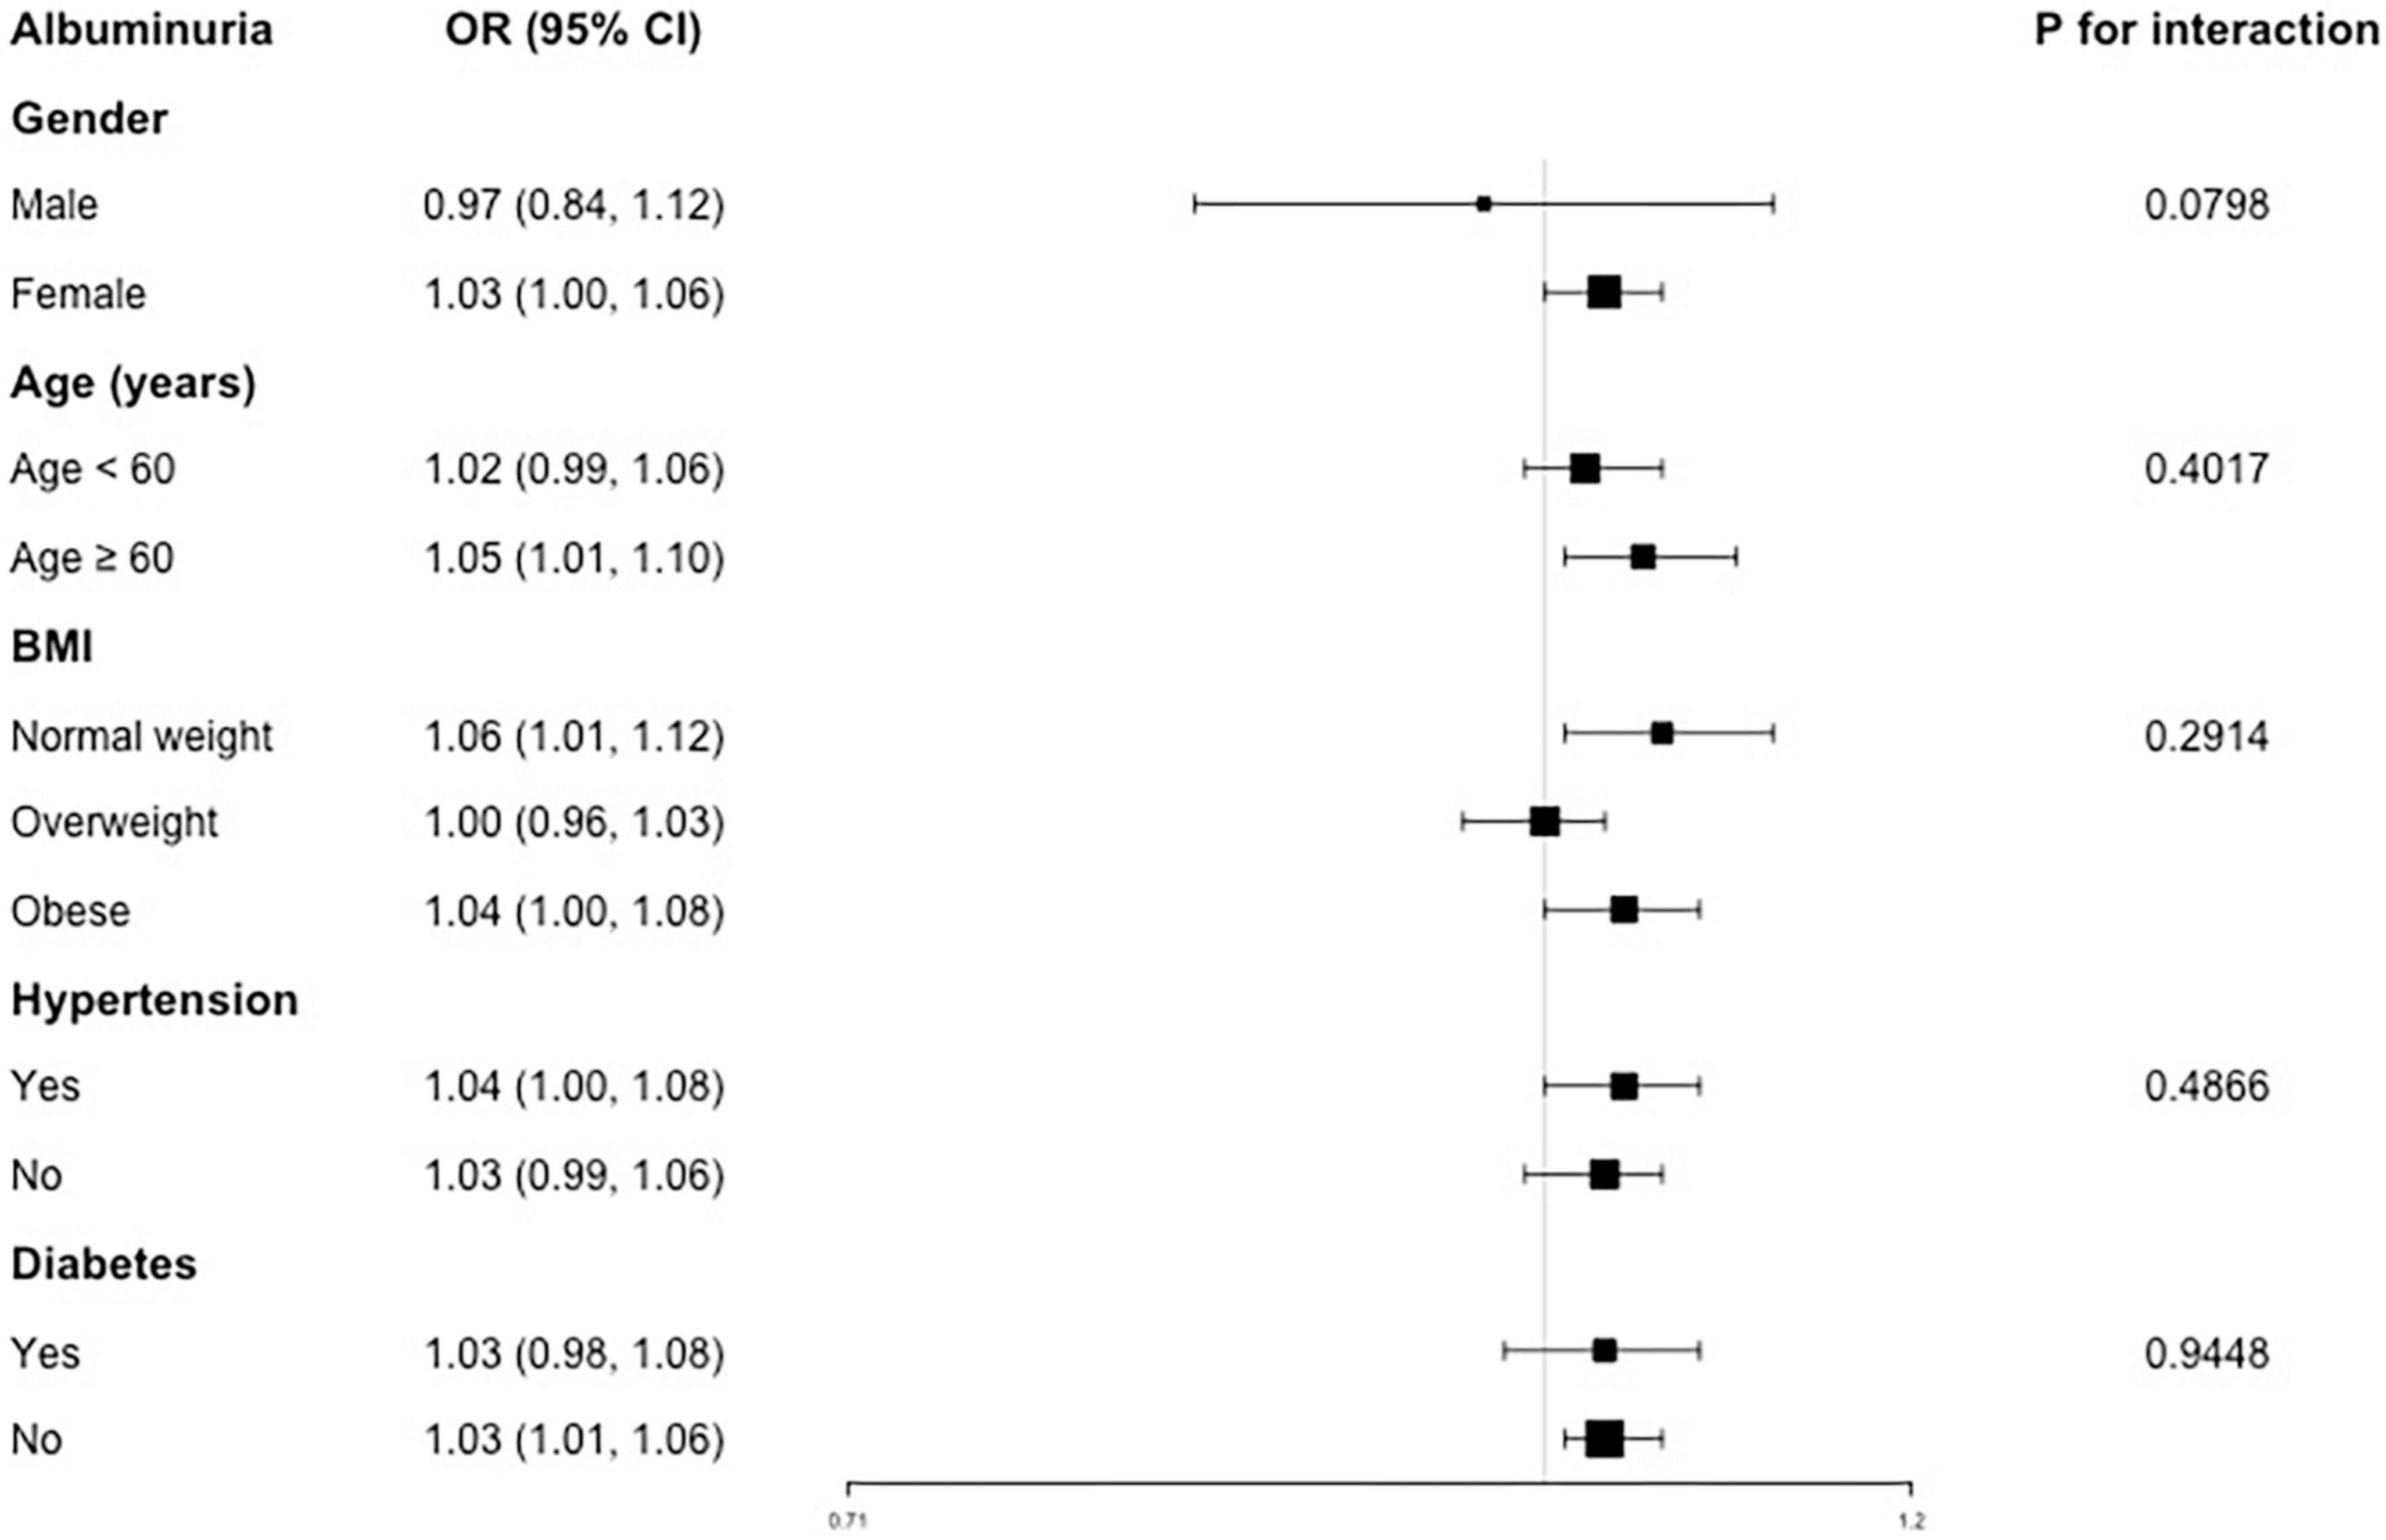
Figure 2. Subgroup analysis for the association between VAI and albuminuria.
For the association between VAI and low-eGFR, consistent previous results, we still did not observe any statistically significant relationship (Figure 3).
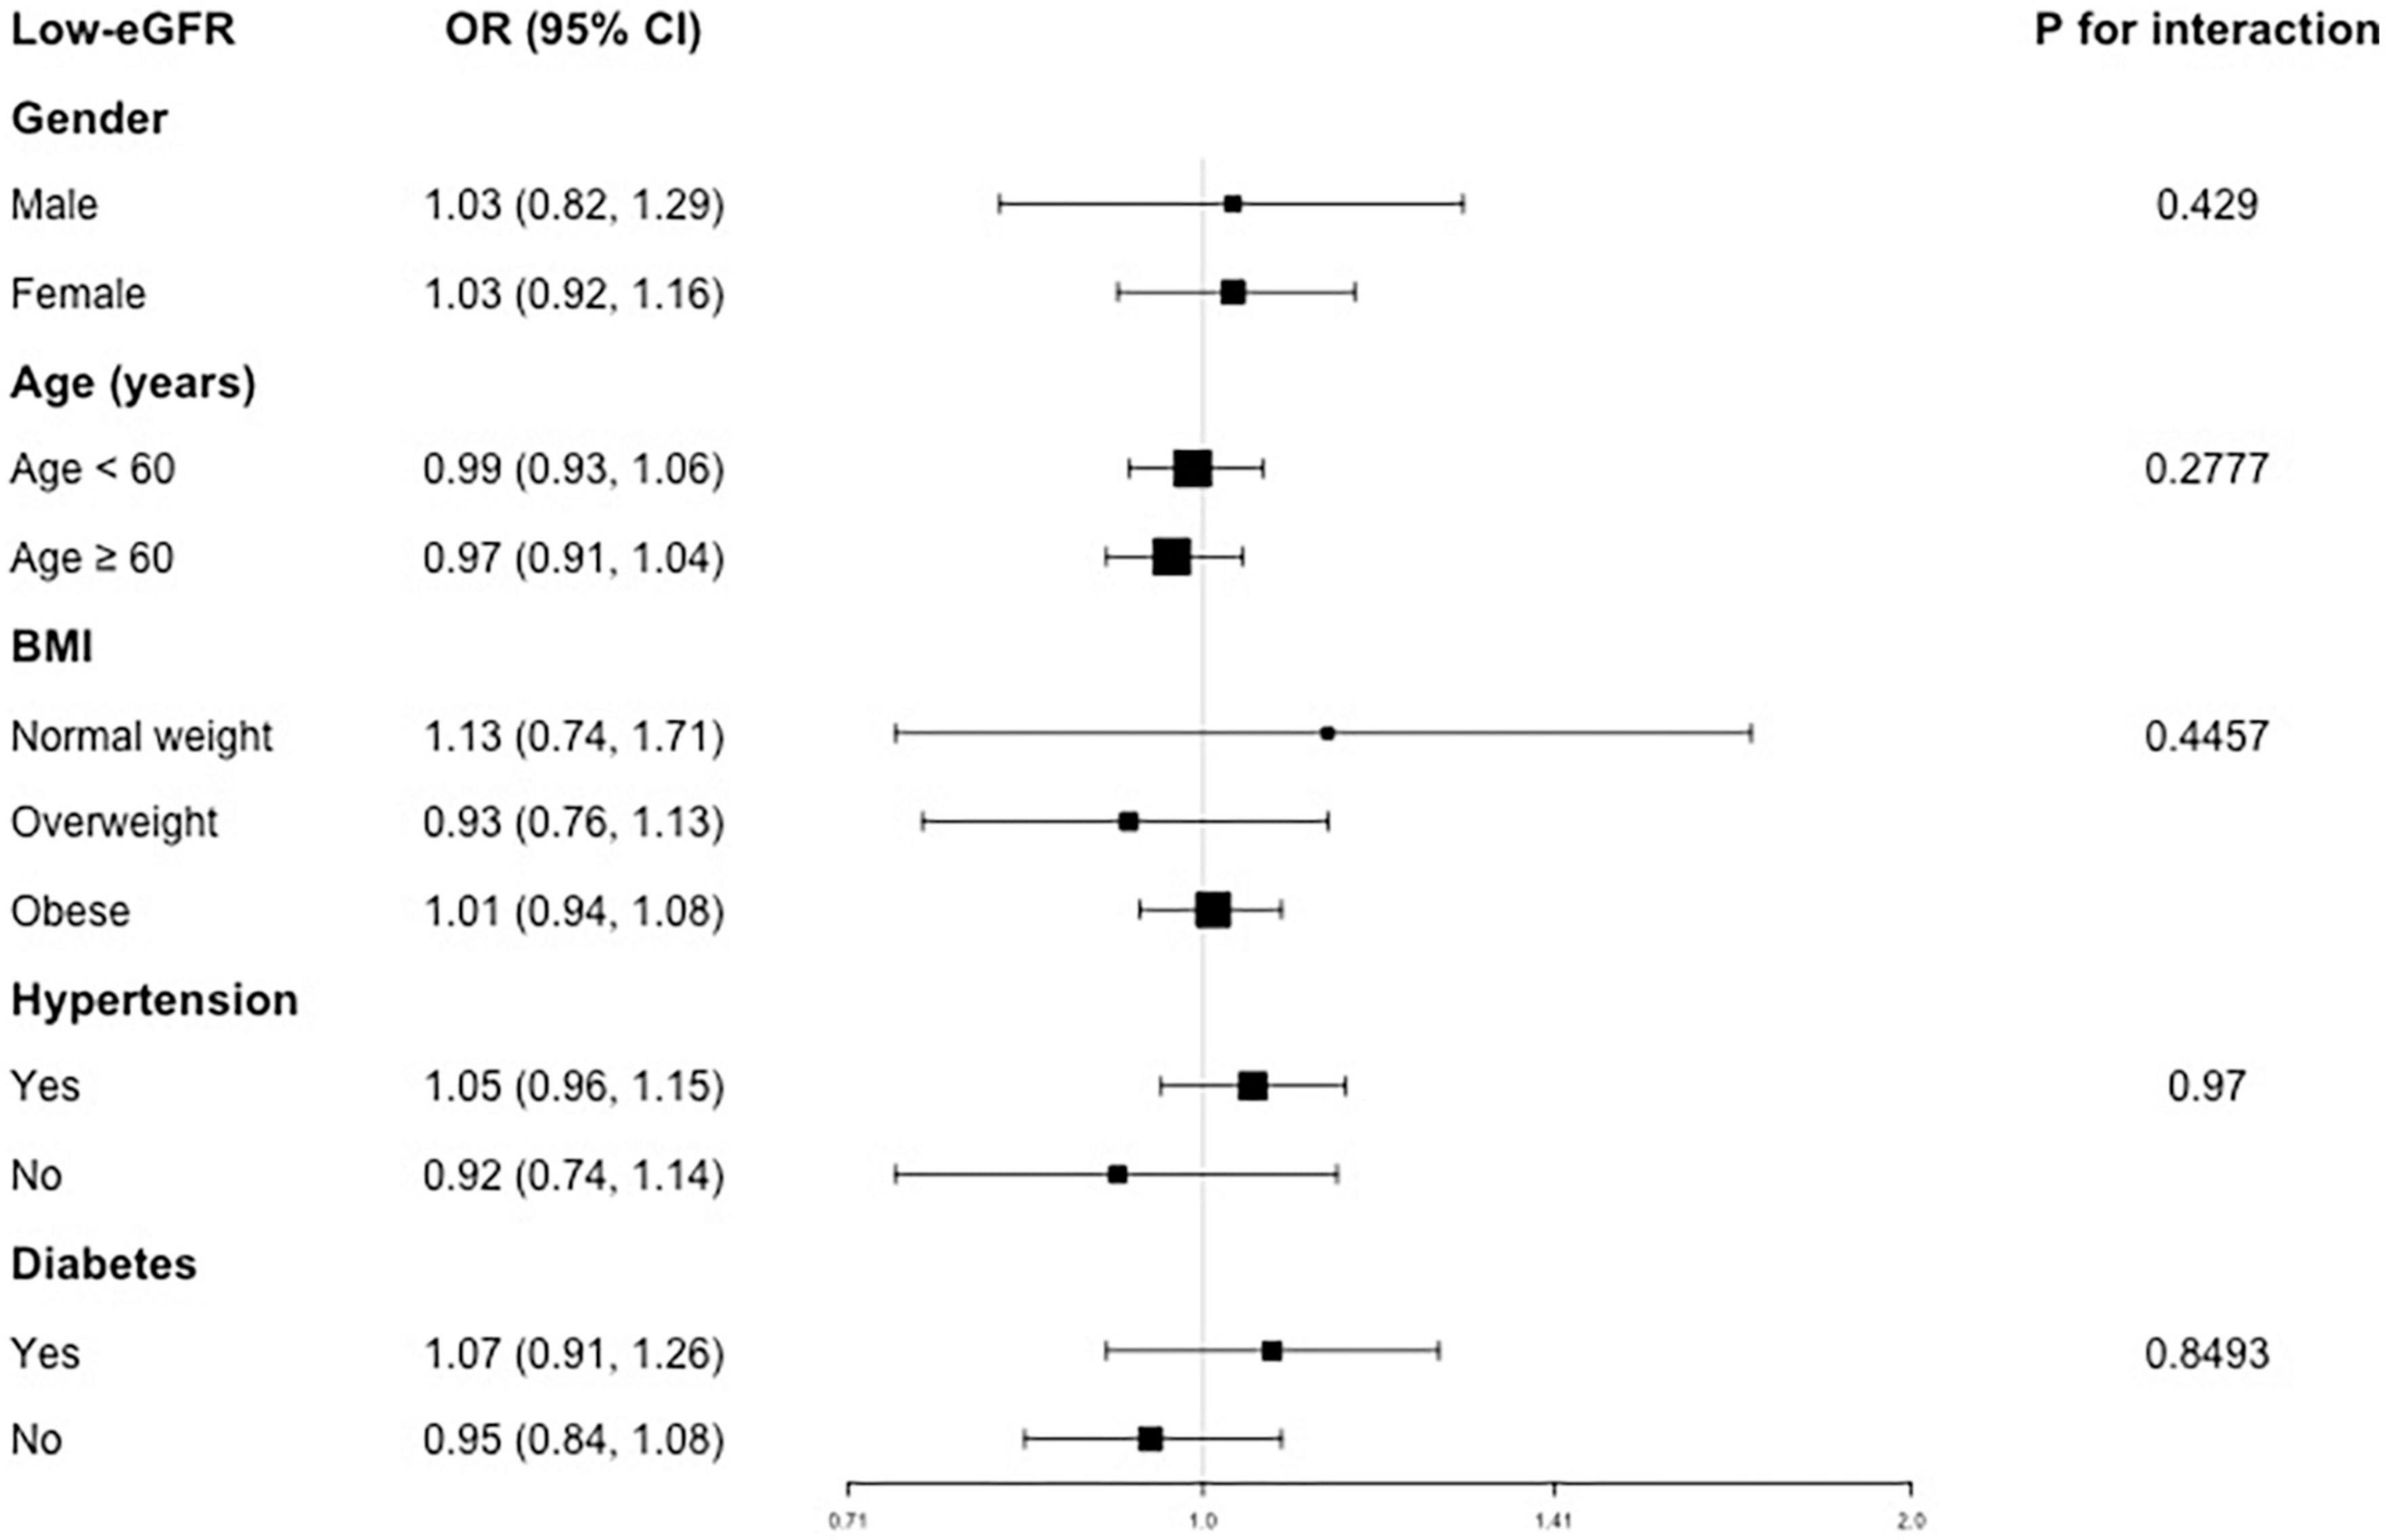
Figure 3. Subgroup analysis for the association between VAI and low-eGFR.
For CKD, a positive association was found in females (OR = 1.04), both age <60 (OR = 1.03) and ≥60 years (OR = 1.05), normal weight (OR = 1.08) and obese (OR = 1.04), both hypertension (OR = 1.05) and non-hypertension (OR = 1.03), both diabetes (OR = 1.04) and non-diabetes (OR = 1.04) subjects (Figure 4). In addition, there was no significant difference suggested by the interaction test among different stratifications, indicating that this positive association was not significantly influenced by gender, age, BMI, hypertension and diabetes on this positive association (all P for interaction >0.05).
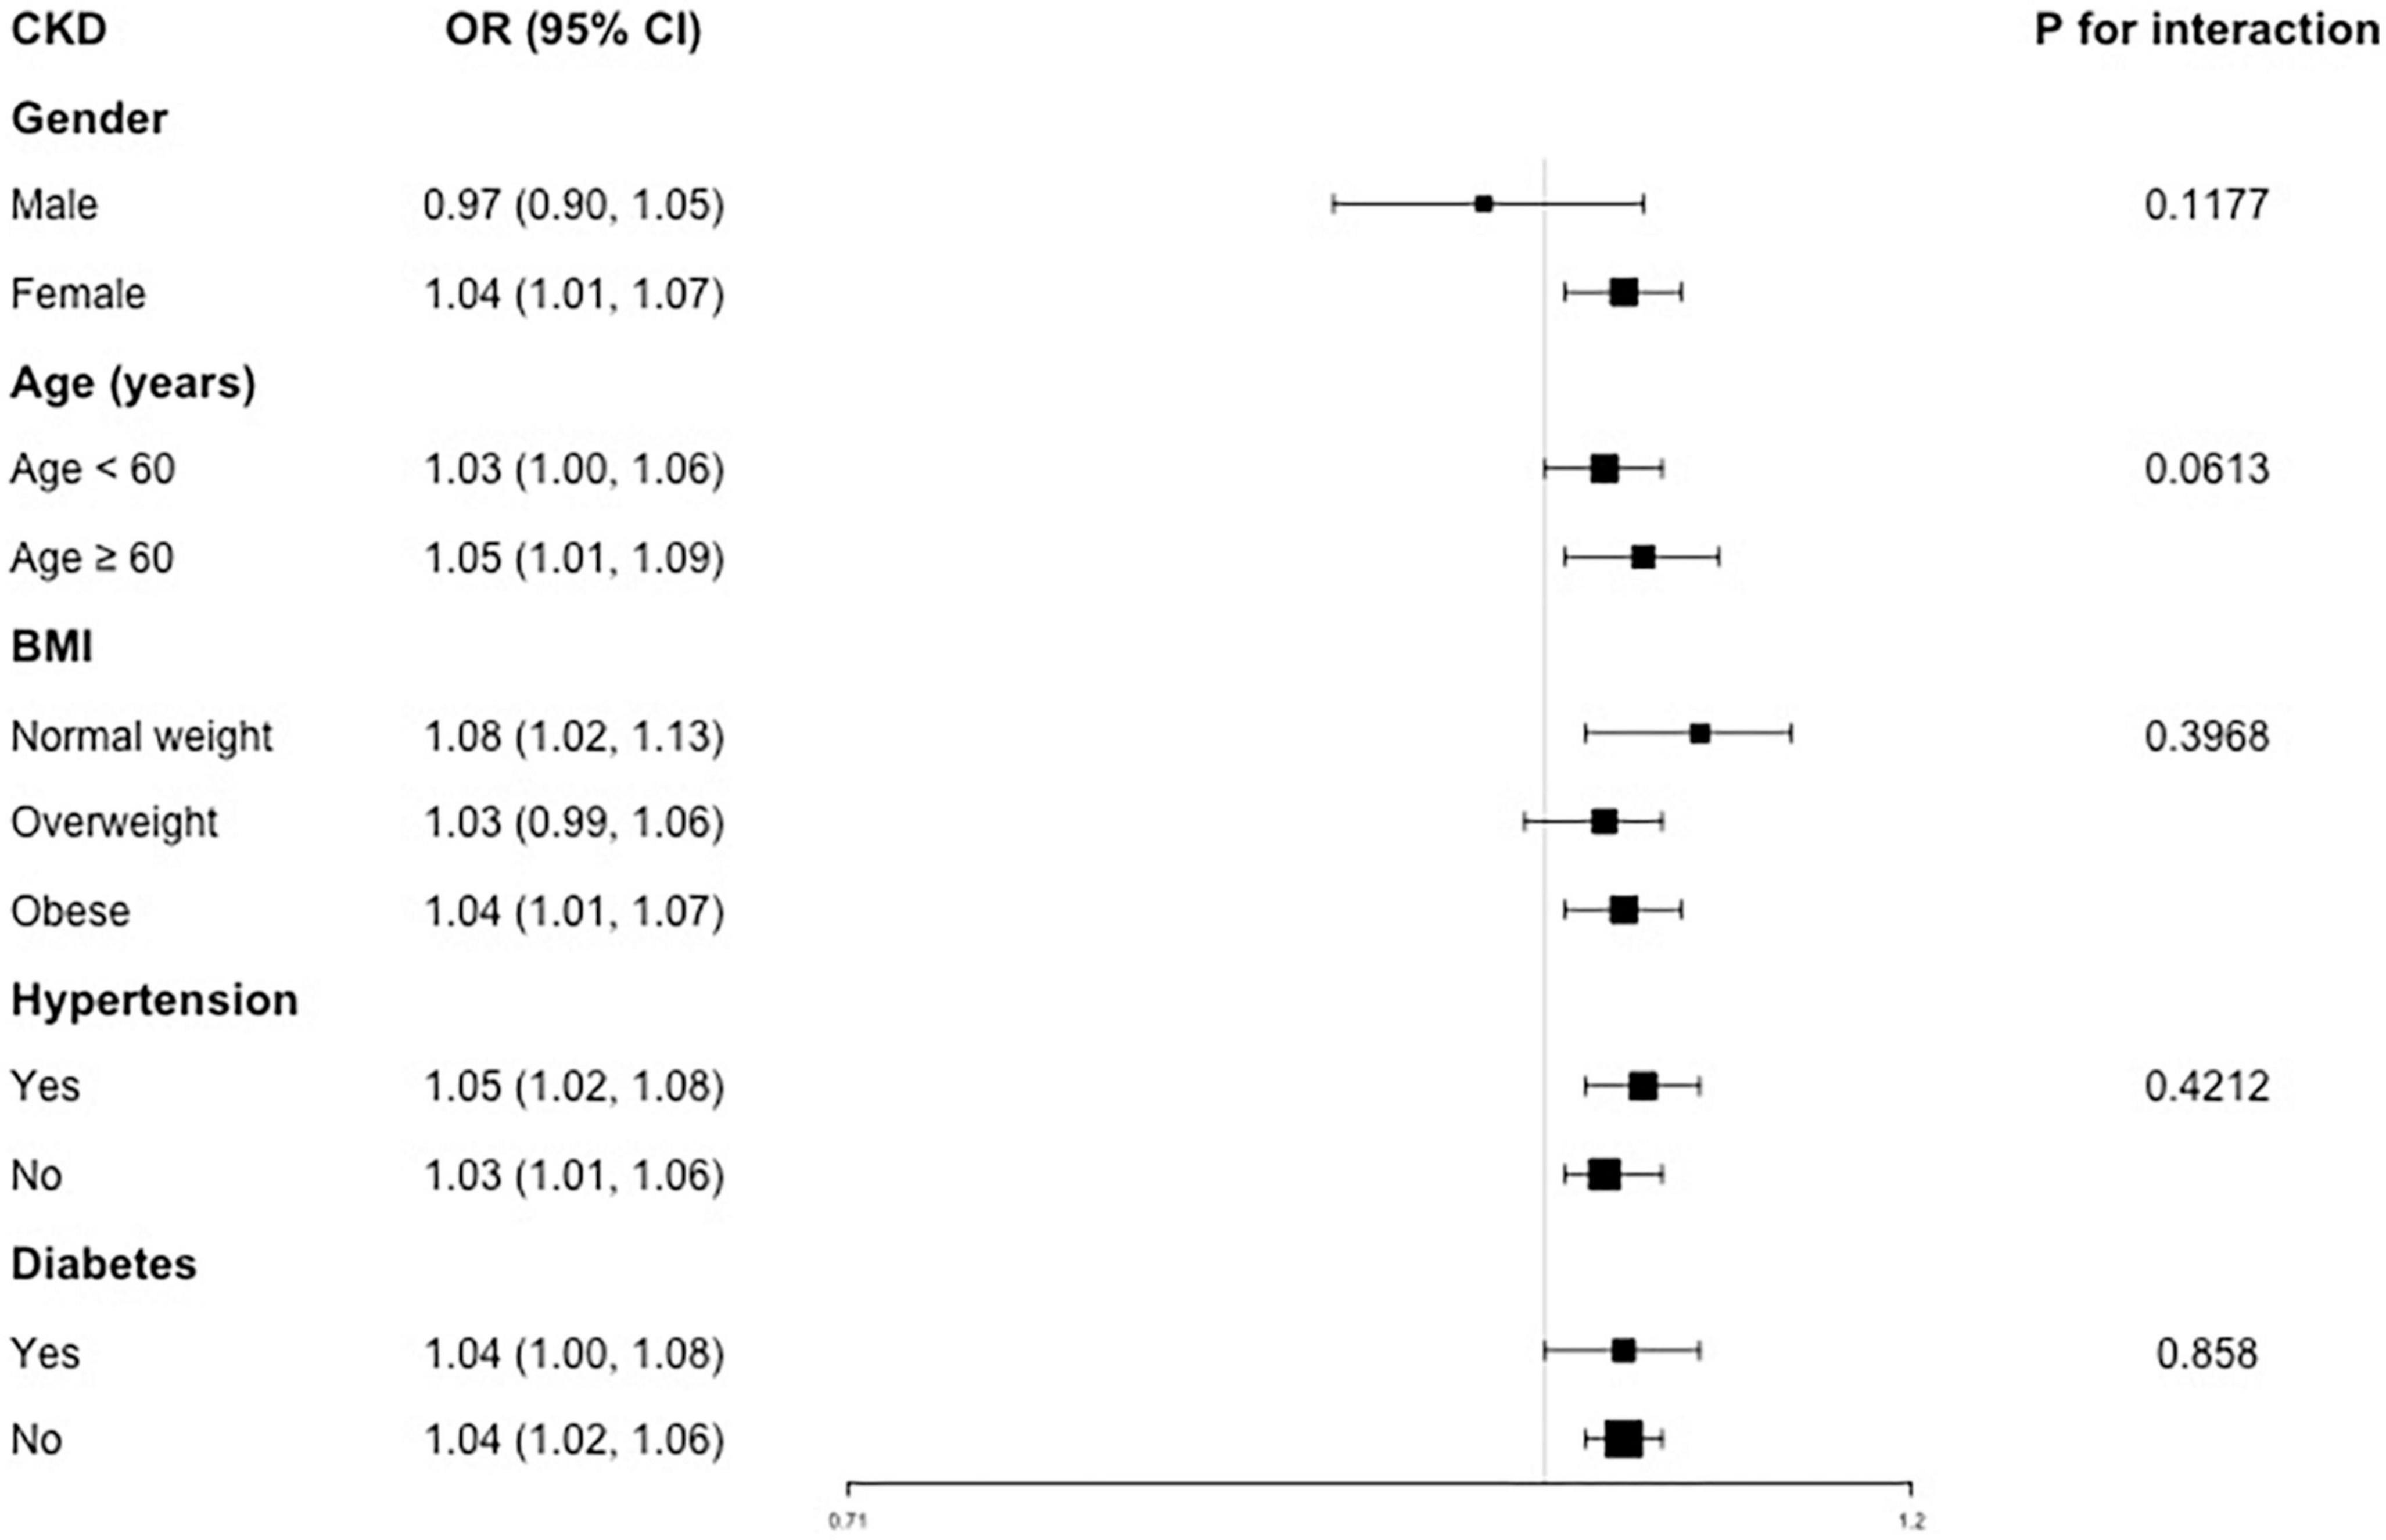
Figure 4. Subgroup analysis for the association between VAI and CKD.
Our cross-sectional study with 35,018 participants found that participants with higher VAI were more likely to have albuminuria and CKD. Subgroup analysis and interaction tests revealed similar associations across different populations. Based on our results, visceral adiposity accumulation should be considered, and the management of visceral fat distribution may alleviate the decrease in renal function. Our results also indicated the negative effects of the accumulation of visceral adiposity on renal health. Since the calculation of VAI was simple and cheap, and it could distinguish visceral adiposity from subcutaneous adiposity accurately, individuals should pay more attention to this mathematical parameter for their health.
Our study assessed the association between VAI and decreased renal function. The impact of the VAI on renal function has been previously evaluated in the different regions and populations (37–43). A study conducted in 6,693 non-diabetic participants in Iran observed that VAI seems to be an independent predictor of renal function decline only in males (37). A cross-sectional study that enrolled 4,947 participants in Korea confirmed that the VAI was a good predictor of the pathogenesis of CKD in men but not in women (38). However, Dai and colleagues has previously demonstrated that VAI was significantly associated with CKD in women in rural population of northeast China (39). A recent study of 400 individuals aged 50–90 years also reported a stronger correlation of VAI with CKD in Taiwan, China, especially for middle-aged and elderly females (40). Similarly, Huang et al. reported a consistent result based on a cross-sectional study that included 2,142 individuals in South China (41). Furthermore, a population-based study of 15,159 participants conducted by Bamba et al. demonstrated that VAI can be a predictor of incident CKD in both males and females in Japan (42). Wen et al. also showed a clear association between the VAI and urinary albumin excretion in Chinese type 2 diabetic patients regardless of the gender (43). Similarly, we highlighted the negative effects of visceral adiposity accumulation on renal health and our present study was consistent with those reports of Bamba et al. and Wen et al., suggesting that higher VAI indicated increased likelihood of albuminuria and CKD. As for different results reported before, we think the variance of population characteristics, including race, region, sample size, CKD definition, and eGFR-related calculation methods may contribute to the discrepancy among these studies. In addition, the results without adjustment for established risk factors for CKD, such as blood pressure, plasma glucose, and serum low density lipoprotein-cholesterol, might lead to misleading conclusions as well (44). VAI can distinguish visceral adiposity from subcutaneous adiposity accurately compared to some other body assessment parameters, such as BMI, WC, and WHtR. For the application of VAI in clinical practice, we think individuals can measure the VAI index of each patient and stratify patients’ risk according to the VAI. According to different risk stratification of patients, more targeted health management for patients could be conducted. In addition, considering the negative effect of visceral fat on renal health, individuals can take the initiative to change their lifestyle, use drugs and other methods to reduce their visceral obesity.
The association between obesity and an increased risk of incident CKD (45, 46), end-stage renal disease (47, 48), and mortality (49, 50) has already been demonstrated by previous studies. In addition to VAI, other visceral adiposity accumulation indicators, such as lipid accumulation product (LAP), BMI, WC, WHtR, and waist-to-hip ratio (WHR), also have clinical predictive effects. BMI is the most classic indicator in the assessment of adiposity (37). A meta-analysis including 39 cohorts covering 630,677 participants revealed that higher BMI was associated with an increased risk of low-eGFR (hazard ratio, HR = 1.02, 95% CI: 1.01–1.03) and albuminuria (HR = 1.02, 95% CI: 1.00–1.04) (51). However, due to the deficiency in distinguishing between fat and muscle as well as between subcutaneous and visceral fat tissues, BMI may lead to bias in measuring the effects of obesity on health outcomes (52). In a prospective study of a Korean population, Oh H et al. reported that WC, not BMI, could predict a decline in renal function. Simultaneously, WHR and WHtR were reported to be associated with renal function decline as well (53). Moreover, Elsayed et al. revealed that the assessment of CKD risk should use WHR rather than BMI as an anthropomorphic measure of obesity (54). Unfortunately, both WC and WHR have limited accuracy in distinguishing between visceral adipose tissue (VAT) and subcutaneous adipose tissue (SAT) (55). Previous studies have shown that LAP and VAI are superior to BMI, WC, WHtR and WHR in the evaluation of renal function decline in clinical practice (37, 39). Furthermore, Mousapour et al. suggested that while LAP and VAI outperform BMI, WC, WHtR and WHR, VAI could be an independent predictor of renal function decline in non-diabetic males (37). Similarly, our study focused on the association between VAI and decreased renal function, and detected a positive relationship of higher VAI with increased likelihood of albuminuria and CKD. Since VAI was a reliable parameter of visceral fat, our results highlighted the negative effects of visceral obesity on renal health.
Several potential mechanisms may explain the association of VAI and decreased kidney function. Visceral adiposity has a positive relationship with the development of inflammation, oxidative stress, endothelial dysfunction, and atherosclerosis, resulting in glomerulosclerosis and tubulointerstitial fibrosis (56–58). Thus, it may lead to a decrease in kidney function. Adiposity accumulation could induce pro-inflammatory pathways, including interleukin-6 (IL-6), tumor necrosis factor-alpha (TNF-α), and transforming growth factor-beta (TGF-β), as well as augment the production of reactive oxygen species (59, 60). Furthermore, this accumulation could also activate the renin-angiotensin-aldosterone system (RAAS), causing hypertension and increasing insulin resistance, which are recognized renal injury factors (61, 62). Additionally, the distribution of central fat might increase the glomerular filtration rate relative to effective renal plasma flow, leading to an increased filtration fraction, and ultimately to glomerular hyper-perfusion, hypertension and even functional loss (63). In addition, it was noting that participants in the third tertile of VAI seems to have worse conditions, such as higher age, obesity, hypertension, diabetes and disorder of lipid metabolism, these comorbidities may contribute to the increased risk of decreased renal function.
Although we detected a significantly positive association of VAI and CKD, it may be mediated by some other diseases and conditions. Using same NHANES dataset, Ciardullo et al. found that participant with MS (both obese and non-obese) showed higher prevalence of albuminuria and reduced eGFR compared with those without obesity or MS, while there was no significant difference in those with MS but without obese. They suggested that MS and but not increased body fat alone was related with CKD (64). Indeed, the association between MS and CKD was controversial. Some studies did not find increased risk of CKD in metabolically healthy obese individuals compared to metabolically healthy non-obese individuals, while others found a residual increase in CKD risk that remained (65–69). A possible explanation of these inconsistencies is related to different definitions of CKD and MS. Some studies did not include albuminuria as an indicator of CKD and the MS diagnostic criteria varied among different studies as well. In addition to MS, NAFLD and related fibrosis may also influence the relationship between VAI and CKD. The correlation of VAI with NAFLD has been reported before (23, 24). Meanwhile, liver fibrosis, but not steatosis, has been proven to associated with reduced kidney function independently (70). In a meta-analysis enrolled seven cross-sectional studies, Ciardullo et al. reported that elevated liver stiffness was associated with higher likelihood of kidney outcomes including albuminuria and CKD among patients with NAFLD (71). Taken together, at least part of the association between VAI and CKD may be mediated by MS, NAFLD and associated fibrosis, etc. In our analysis, VAI is calculated considering TG and HDL levels, which are MS parameters. Even VAI representing visceral fat accumulation, perhaps some metabolism-related factor could have influenced our results as well. Thus, more large-scale prospective studies are still needed to valid our findings.
This study has several strengths. First, the sample selection and sample size are representative and sufficient. To our knowledge, the present study included the largest number of samples on this topic. Additionally, we adjusted for confounding covariates to reduce the confounding bias. Therefore, more reliable conclusions can be obtained. However, the limitations should also be noted. Our cross-sectional study design did not permit us to establish a causal relationship. Prospective studies with larger sample sizes are needed to clarify this issue. In addition, even though some potential covariates have been adjusted, other potentially confounding variables could not be completely excluded, such as the use of drugs including diuretics and steroids, etc. The use of a single spot of urine to evaluate albuminuria is a limitation as well. Although it is a validated method, is not the best option compared to 24 h urine.
Elevated VAI levels were independently associated with albuminuria and CKD, which highlights the importance of managing decreased renal function in patients with visceral adipose accumulation. However, the validity of our findings needs to be further confirmed by large-scale prospective studies.
Publicly available datasets were analyzed in this study. This data can be found here: https://www.cdc.gov/nchs/nhanes/.
The studies involving human participants were reviewed and approved by the National Center for Health Statistics (NCHS) Research Ethics Review Board. The patients/participants provided their written informed consent to participate in this study.
ZQ: software, data analysis, and writing—original draft. XC: writing—original draft, formal analysis, and methodology. JS: data analysis. LJ: conceptualization, funding acquisition, and writing—reviewing and editing. All authors contributed to the article and approved the submitted version.
This work was supported by Chinese Medicine Project in Jiangxi Province, China (Grant No. 2021A78).
We thank the assistance of Drs. Yawen Zhang and Ke Hu in the manuscript preparation.
The authors declare that the research was conducted in the absence of any commercial or financial relationships that could be construed as a potential conflict of interest.
All claims expressed in this article are solely those of the authors and do not necessarily represent those of their affiliated organizations, or those of the publisher, the editors and the reviewers. Any product that may be evaluated in this article, or claim that may be made by its manufacturer, is not guaranteed or endorsed by the publisher.
1. Gillen DL, Worcester EM, Coe FL. Decreased renal function among adults with a history of nephrolithiasis: a study of NHANES III. Kidney Int. (2005) 67:685–90. doi: 10.1111/j.1523-1755.2005.67128.x
2. Böhm M, Thoenes M, Danchin N, Bramlage P, La Puerta P, Volpe M. Association of cardiovascular risk factors with microalbuminuria in hypertensive individuals: the i-SEARCH global study. J Hypertens. (2007) 25:2317–24. doi: 10.1097/HJH.0b013e3282ef1c5f
3. Romagnani P, Remuzzi G, Glassock R, Levin A, Jager KJ, Tonelli M, et al. Chronic kidney disease. Nat Rev Dis Primers. (2017) 3:17088. doi: 10.1038/nrdp.2017.88
4. Comper WD, Hilliard LM, Nikolic-Paterson DJ, Russo LM. Disease-dependent mechanisms of albuminuria. Am J Physiol Renal Physiol. (2008) 295:F1589–600. doi: 10.1152/ajprenal.00142.2008
5. Inker LA, Eneanya ND, Coresh J, Tighiouart H, Wang D, Sang Y, et al. New Creatinine- and Cystatin C-based equations to estimate GFR without race. N Engl J Med. (2021) 385:1737–49. doi: 10.1056/NEJMoa2102953
6. Matsushita K, van der Velde M, Astor BC, Woodward M, Levey AS, de Jong PE, et al. Association of estimated glomerular filtration rate and albuminuria with all-cause and cardiovascular mortality in general population cohorts: a collaborative meta-analysis. Lancet. (2010) 375:2073–81.
7. Perkovic V, Verdon C, Ninomiya T, Barzi F, Cass A, Patel A, et al. The relationship between proteinuria and coronary risk: a systematic review and meta-analysis. PLoS Med. (2008) 5:e207. doi: 10.1371/journal.pmed.0050207
9. ópez-Novoa JML, Martínez-Salgado C, Rodríguez-Peña AB, ópez-Hernández FJL. Common pathophysiological mechanisms of chronic kidney disease: therapeutic perspectives. Pharmacol Ther. (2010) 128:61–81.
10. Cong J, Cheng B, Liu J, He P. RTEF-1 inhibits vascular smooth muscle cell calcification through regulating Wnt/β-catenin signaling pathway. Calcif Tissue Int. (2021) 109:203–14. doi: 10.1007/s00223-021-00833-4
11. Li R, Li Q, Cui M, Ying Z, Li L, Zhong T, et al. Visceral adiposity index, lipid accumulation product and intracranial atherosclerotic stenosis in middle-aged and elderly Chinese. Sci Rep. (2017) 7:7951. doi: 10.1038/s41598-017-07811-7
12. Roriz AK, Passos LC, de Oliveira CC, Eickemberg M, Moreira Pde A, Sampaio LR. Evaluation of the accuracy of anthropometric clinical indicators of visceral fat in adults and elderly. PLoS One. (2014) 9:e103499. doi: 10.1371/journal.pone.0103499
13. Zdziechowska M, Gluba-Brzozka A, Poliwczak AR, Franczyk B, Kidawa M, Zielinska M, et al. Serum NGAL, KIM-1, IL-18, L-FABP: new biomarkers in the diagnostics of acute kidney injury (AKI) following invasive cardiology procedures. Int Urol Nephrol. (2020) 52:2135–43. doi: 10.1007/s11255-020-02530-x
14. Amato MC, Giordano C, Pitrone M, Galluzzo A. Cut-off points of the visceral adiposity index (VAI) identifying a visceral adipose dysfunction associated with cardiometabolic risk in a Caucasian Sicilian population. Lipids Health Dis. (2011) 10:183. doi: 10.1186/1476-511X-10-183
15. Tsou MT, Chang YC, Hsu CP, Kuo YC, Yun CH, Huang WH, et al. Visceral adiposity index outperforms conventional anthropometric assessments as predictor of diabetes mellitus in elderly Chinese: a population-based study. Nutr Metab. (2021) 18:87. doi: 10.1186/s12986-021-00608-6
16. Wei J, Liu X, Xue H, Wang Y, Shi Z. Comparisons of visceral adiposity index, body shape index, body mass index and waist circumference and their associations with diabetes mellitus in adults. Nutrients. (2019) 11:1580. doi: 10.3390/nu11071580
17. Ahn N, Baumeister SE, Amann U, Rathmann W, Peters A, Huth C, et al. Visceral adiposity index (VAI), lipid accumulation product (LAP), and product of triglycerides and glucose (TyG) to discriminate prediabetes and diabetes. Sci Rep. (2019) 9:9693. doi: 10.1038/s41598-019-46187-8
18. Han M, Qin P, Li Q, Qie R, Liu L, Zhao Y, et al. Chinese visceral adiposity index: a reliable indicator of visceral fat function associated with risk of type 2 diabetes. Diabetes Metab Res Rev. (2021) 37:e3370. doi: 10.1002/dmrr.3370
19. Amato MC, Giordano C, Galia M, Criscimanna A, Vitabile S, Midiri M, et al. Visceral adiposity index: a reliable indicator of visceral fat function associated with cardiometabolic risk. Diabetes Care. (2010) 33:920–2. doi: 10.2337/dc09-1825
20. Leite NN, Cota BC, Gotine A, Rocha D, Pereira PF, Hermsdorff HHM. Visceral adiposity index is positively associated with blood pressure: a systematic review. Obes Res Clin Pract. (2021) 15:546–56. doi: 10.1016/j.orcp.2021.10.001
21. Yu Y, Zhang FL, Yan XL, Zhang P, Guo ZN, Yang Y. Visceral adiposity index and cervical arterial atherosclerosis in northeast China: a population based cross-sectional survey. Eur J Neurol. (2021) 28:161–71. doi: 10.1111/ene.14513
22. Li J, Zhu J, Tan Z, Yu Y, Luo L, Zhou W, et al. Visceral adiposity index is associated with arterial stiffness in hypertensive adults with normal-weight: the china H-type hypertension registry study. Nutr Metab. (2021) 18:90. doi: 10.1186/s12986-021-00617-5
23. Ismaiel A, Jaaouani A, Leucuta DC, Popa SL, Dumitrascu DL. The visceral adiposity index in non-alcoholic fatty liver disease and liver fibrosis-systematic review and meta-analysis. Biomedicines. (2021) 9:1890. doi: 10.3390/biomedicines9121890
24. Vural Keskinler M, Mutlu HH, Sirin A, Erkalma Senates B, Colak Y, Tuncer I, et al. Visceral adiposity index as a practical tool in patients with biopsy-proven nonalcoholic fatty liver disease/nonalcoholic steatohepatitis. Metab Syndr Relat Disord. (2021) 19:26–31. doi: 10.1089/met.2020.0054
25. Bijari M, Jangjoo S, Emami N, Raji S, Mottaghi M, Moallem R, et al. The accuracy of visceral adiposity index for the screening of metabolic syndrome: a systematic review and meta-analysis. Int J Endocrinol. (2021) 2021:6684627. doi: 10.1155/2021/6684627
26. Cardoso-Peña E, Soto Pina AE, Villanueva Á, López Chavez G, Ramírez Martínez P, Ramírez Montoya H, et al. Visceral adiposity index in breast cancer survivors: a case-control study. Int J Endocrinol. (2020) 2020:8874916.
27. Okamura T, Hashimoto Y, Hamaguchi M, Obora A, Kojima T, Fukui M. Visceral adiposity index is a predictor of incident colorectal cancer: a population-based longitudinal study. BMJ Open Gastroenterol. (2020) 7:e000400. doi: 10.1136/bmjgast-2020-000400
28. Dekkers IA, de Vries APJ, Smit RAJ, Rosendaal FR, Rabelink TJ, Lamb HJ, et al. The separate contributions of visceral fat and liver fat to chronic kidney disease-related renal outcomes. J Ren Nutr. (2020) 30:286–95. doi: 10.1053/j.jrn.2019.09.002
29. Tsao YC, Chen JY, Yeh WC, Li WC. Gender- and age-specific associations between visceral obesity and renal function impairment. Obes Facts. (2019) 12:67–77. doi: 10.1159/000496626
30. Wang J, Jin X, Chen K, Yan W, Wang A, Zhu B, et al. Visceral adiposity index is closely associated with urinary albumin-creatinine ratio in the Chinese population with prediabetes. Diabetes Metab Res Rev. (2021) 37:e3424.
31. Moh MC, Sum CF, Tavintharan S, Ang K, Kwan PY, Lee SBM, et al. Gain in adiposity over 3 years is associated with progressive renal decline in multi-ethnic South-east Asians with type 2 diabetes. J Diabetes. (2019) 11:316–25. doi: 10.1111/1753-0407.12848
32. Wu IW, Liao PJ, Ting MK, Chen SW, Yang NI, Hsu KH. Combination of thigh circumference and indices of central obesity helps predict incident chronic kidney disease: a 14-year prospective cohort study using a three-dimensional body laser scanner. J Ren Nutr. (2021) 32:405–13. doi: 10.1053/j.jrn.2021.06.009
33. Sun K, Lin D, Li F, Qi Y, Feng W, Ren M, et al. Visceral adiposity index is associated with increased urinary albumin excretion: a population-based study. Clin Nutr. (2019) 38:1332–8. doi: 10.1016/j.clnu.2018.05.025
34. Borrud, L, Chiappa MM, Burt VL, Gahche J, Zipf G, Johnson CL, et al. National health and nutrition examination survey: national youth fitness survey plan, operations, and analysis, 2012. Vital Health Stat 2. (2014):1–24.
35. Levey AS, Stevens LA, Schmid CH, Zhang YP, Castro AF, Feldman HI, et al. A new equation to estimate glomerular filtration rate. Ann Intern Med. (2009) 150:604–12.
36. Definition and classification of CKD. Kidney Int Suppl. (2013) 3:19–62. doi: 10.1038/kisup.2012.64
37. Mousapour P, Barzin M, Valizadeh M, Mahdavi M, Azizi F, Hosseinpanah F. Predictive performance of lipid accumulation product and visceral adiposity index for renal function decline in non-diabetic adults, an 8.6-year follow-up. Clin Exp Nephrol. (2020) 24:225–34. doi: 10.1007/s10157-019-01813-7
38. Seong JM, Lee JH, Gi MY, Son YH, Moon AE, Park CE, et al. Gender difference in the association of chronic kidney disease with visceral adiposity index and lipid accumulation product index in Korean adults: Korean National Health and Nutrition Examination Survey. Int Urol Nephrol. (2021) 53:1417–25. doi: 10.1007/s11255-020-02735-0
39. Dai D, Chang Y, Chen Y, Chen S, Yu S, Guo X, et al. Visceral adiposity index and lipid accumulation product index: two alternate body indices to identify chronic kidney disease among the rural population in Northeast China. Int J Environ Res Public Health. (2016) 13:1231. doi: 10.3390/ijerph13121231
40. Chen IJ, Hsu LT, Lu MC, Chen YJ, Tsou MT, Chen JY. Gender differences in the association between obesity indices and chronic kidney disease among middle-aged and elderly taiwanese population: a community-based cross-sectional study. Front Endocrinol. (2021) 12:737586. doi: 10.3389/fendo.2021.737586
41. Huang J, Zhou C, Li Y, Zhu S, Liu A, Shao X, et al. Visceral adiposity index, hypertriglyceridemic waist phenotype and chronic kidney disease in a southern Chinese population: a cross-sectional study. Int Urol Nephrol. (2015) 47:1387–96. doi: 10.1007/s11255-015-1040-y
42. Bamba R, Okamura T, Hashimoto Y, Hamaguchi M, Obora A, Kojima T, et al. The visceral adiposity index is a predictor of incident chronic kidney disease: a population-based longitudinal study. Kidney Blood Press Res. (2020) 45:407–18. doi: 10.1159/000506461
43. Wen J, Yuan H. Independent association between the visceral adiposity index and microalbuminuria in patients with newly diagnosed type 2 diabetes. Diabetes Metab Res Rev. (2020) 36:e3198. doi: 10.1002/dmrr.3198
44. Li M, Hu L, Hu L, Huang X, Liu X, Zhou W, et al. Visceral Adiposity index is inversely associated with renal function in normal-weight adults with hypertension: the China H-type hypertension registry study. J Nutr. (2021) 151:1394–400. doi: 10.1093/jn/nxab022
45. Foster MC, Hwang SJ, Larson MG, Lichtman JH, Parikh NI, Vasan RS, et al. Overweight, obesity, and the development of stage 3 CKD: the framingham heart study. Am J Kidney Dis. (2008) 52:39–48. doi: 10.1053/j.ajkd.2008.03.003
46. Fox CS, Larson MG, Leip EP, Culleton B, Wilson PW, Levy D. Predictors of new-onset kidney disease in a community-based population. JAMA. (2004) 291:844–50. doi: 10.1001/jama.291.7.844
47. Vivante A, Golan E, Tzur D, Leiba A, Tirosh A, Skorecki K, et al. Body mass index in 1.2 million adolescents and risk for end-stage renal disease. Arch Intern Med. (2012) 172:1644–50. doi: 10.1001/2013.jamainternmed.85
48. Iseki K, Ikemiya Y, Kinjo K, Inoue T, Iseki C, Takishita S. Body mass index and the risk of development of end-stage renal disease in a screened cohort. Kidney Int. (2004) 65:1870–6. doi: 10.1111/j.1523-1755.2004.00582.x
49. Berrington de Gonzalez A, Hartge P, Cerhan JR, Flint AJ, Hannan L, MacInnis RJ, et al. Body-mass index and mortality among 1.46 million white adults. N Engl J Med. (2010) 363:2211–9. doi: 10.1056/NEJMoa1000367
50. Visscher TL, Seidell JC, Menotti A, Blackburn H, Nissinen A, Feskens EJ, et al. Underweight and overweight in relation to mortality among men aged 40-59 and 50-69 years: the Seven Countries Study. Am J Epidemiol. (2000) 151:660–6. doi: 10.1093/oxfordjournals.aje.a010260
51. Garofalo C, Borrelli S, Minutolo R, Chiodini P, De Nicola L, Conte G. A systematic review and meta-analysis suggests obesity predicts onset of chronic kidney disease in the general population. Kidney Int. (2017) 91:1224–35. doi: 10.1016/j.kint.2016.12.013
52. Rothman KJ. BMI-related errors in the measurement of obesity. Int J Obes. (2008) 32(Suppl. 3):S56–9.
53. Oh H, Quan SA, Jeong JY, Jang SN, Lee JE, Kim DH. Waist circumference, not body mass index, is associated with renal function decline in korean population: hallym aging study. PLoS One. (2013) 8:e59071. doi: 10.1371/journal.pone.0059071
54. Elsayed EF, Sarnak MJ, Tighiouart H, Griffith JL, Kurth T, Salem DN, et al. Waist-to-hip ratio, body mass index, and subsequent kidney disease and death. Am J Kidney Dis. (2008) 52:29–38. doi: 10.1053/j.ajkd.2008.02.363
55. Chen YC, Lai SH, Tsai YW, Chang SS. Visceral adiposity index as a predictor of chronic kidney disease in a relatively healthy population in Taiwan. J Ren Nutr. (2018) 28:91–100. doi: 10.1053/j.jrn.2017.07.006
56. Chen S, Liu H, Liu X, Li Y, Li M, Liang Y, et al. Central obesity, C-reactive protein and chronic kidney disease: a community-based cross-sectional study in southern China. Kidney Blood Press Res. (2013) 37:392–401. doi: 10.1159/000355718
57. Tchernof A, Després JP. Pathophysiology of human visceral obesity: an update. Physiol Rev. (2013) 93:359–404. doi: 10.1152/physrev.00033.2011
58. França AK, Dos Santos AM, Salgado JV, Hortegal EV, da Silva AA, Salgado Filho N. Estimated visceral adipose tissue, but not body mass index, is associated with reductions in glomerular filtration rate based on cystatin C in the early stages of chronic kidney disease. Int J Nephrol. (2014) 2014:574267.
59. Zhang XL, Topley N, Ito T, Phillips A. Interleukin-6 regulation of transforming growth factor (TGF)-beta receptor compartmentalization and turnover enhances TGF-beta1 signaling. J Biol Chem. (2005) 280:12239–45. doi: 10.1074/jbc.M413284200
60. Glass CK, Olefsky JM. Inflammation and lipid signaling in the etiology of insulin resistance. Cell Metab. (2012) 15:635–45.
61. Rüster C, Wolf G. The role of the renin-angiotensin-aldosterone system in obesity-related renal diseases. Semin Nephrol. (2013) 33:44–53.
62. Brands MW, Hall JE, Van Vliet BN, Alonso-Galicia M, Herrera GA, Zappe D. Obesity and hypertension: roles of hyperinsulinemia, sympathetic nervous system and intrarenal mechanisms. J Nutr. (1995) 125:1725s–31s.
63. Kwakernaak AJ, Toering TJ, Navis G. Body mass index and body fat distribution as renal risk factors: a focus on the role of renal haemodynamics. Nephrol Dial Transplant. (2013) 28(Suppl. 4):iv42–9. doi: 10.1093/ndt/gft331
64. Ciardullo S, Ballabeni C, Trevisan R, Perseghin G. Metabolic syndrome, and not obesity, is associated with chronic kidney disease. Am J Nephrol. (2021) 52: 666–72.
65. Jung CH, Lee MJ, Kang YM, Hwang JY, Kim EH, Park JY, et al. The risk of chronic kidney disease in a metabolically healthy obese population. Kidney Int. (2015) 88:843–50. doi: 10.1038/ki.2015.183
66. Chang Y, Ryu S, Choi Y, Zhang Y, Cho J, Kwon MJ, et al. Metabolically healthy obesity and development of chronic kidney disease: a cohort study. Ann Intern Med. (2016) 164:305–12.
67. Chang AR, Surapaneni A, Kirchner HL, Young A, Kramer HJ, Carey DJ, et al. Metabolically healthy obesity and risk of kidney function decline. Obesity. (2018) 26:762–8.
68. Yun HR, Kim H, Park JT, Chang TI, Yoo TH, Kang SW, et al. Obesity, metabolic abnormality, and progression of CKD. Am J Kidney Dis. (2018) 72:400–10.
69. Stefansson VTN, Schei J, Solbu MD, Jenssen TG, Melsom T, Eriksen BO. Metabolic syndrome but not obesity measures are risk factors for accelerated age-related glomerular filtration rate decline in the general population. Kidney Int. (2018) 93:1183–90.
70. Ciardullo S, Ballabeni C, Trevisan R, Perseghin G. Liver fibrosis assessed by transient elastography is independently associated with albuminuria in the general United States population. Dig Liver Dis. (2021) 53:866–72. doi: 10.1016/j.dld.2021.02.010
Keywords: visceral adiposity index, chronic kidney disease, albuminuria, estimated-glomerular filtration rate, cross-sectional study
Citation: Qin Z, Chen X, Sun J and Jiang L (2023) The association between visceral adiposity index and decreased renal function: A population-based study. Front. Nutr. 10:1076301. doi: 10.3389/fnut.2023.1076301
Received: 21 October 2022; Accepted: 27 February 2023;
Published: 10 March 2023.
Edited by:
Owen Kelly, Sam Houston State University, United StatesReviewed by:
Guillermina Barril, Hospital de la Princesa, SpainCopyright © 2023 Qin, Chen, Sun and Jiang. This is an open-access article distributed under the terms of the Creative Commons Attribution License (CC BY). The use, distribution or reproduction in other forums is permitted, provided the original author(s) and the copyright owner(s) are credited and that the original publication in this journal is cited, in accordance with accepted academic practice. No use, distribution or reproduction is permitted which does not comply with these terms.
*Correspondence: Luojia Jiang, SmlhbmdsdW9qaWEzNjkzQHNpbmEuY29t
Disclaimer: All claims expressed in this article are solely those of the authors and do not necessarily represent those of their affiliated organizations, or those of the publisher, the editors and the reviewers. Any product that may be evaluated in this article or claim that may be made by its manufacturer is not guaranteed or endorsed by the publisher.
Research integrity at Frontiers
Learn more about the work of our research integrity team to safeguard the quality of each article we publish.