 Pu Ge1†
 Xinpei Wang2†
 Siying Gao3
 Jiaxin Liu4
 Yuyao Niu5
 Mengyao Yan6
 Siyuan Fan7
 Qiyu Li8
 Jinzi Zhang9
 Xiaonan Sun9
 Fei Wang10Yike Sun11
 Wenli Yu12
 Xinying Sun13
 Lian Yu14*
 Yibo Wu13*
- 1Institute of Chinese Medical Sciences, University of Macau, Macao SAR, China
- 2Department of Medical Equipment, Peking University First Hospital, Beijing, China
- 3Faculty of Education, Beijing Normal University, Beijing, China
- 4Xiangya School of Nursing, Central South University, Changsha, China
- 5Faculty of Arts and Humanities, University of Macau, Macao SAR, China
- 6School of Health Policy and Management, Peking Union Medical College, Chinese Academy of Medical Sciences, Beijing, China
- 7Department of Preventive Medicine, Yanjing Medical College, Capital Medical University, Beijing, China
- 8School of Humanities and Health Management, Jinzhou Medical University, Jinzhou, China
- 9Department of Social Science and Humanities, Harbin Medical University, Harbin, Heilongjiang, China
- 10State Key Laboratory of Cognitive Neuroscience and Learning, Beijing Normal University, Beijing, China
- 11College of Integrated Traditional Chinese and Western Medicine, Jining Medical University, Jining, China
- 12School of Foreign Languages, Weifang University of Science and Technology, Weifang, China
- 13School of Public Health, Peking University, Beijing, China
- 14School of Public Health, Health Care System Reform and Development Institute, Xi'an Jiaotong University Health Science Center, Xi'an, China
Background: The obesity rate in the Chinese population is increasing and there is a lack of short and reliable scales for measuring obesity-related eating behavior in China. The EBS-SF (Sakata Eating Behavior Scale short form) has only 7 entries and has shown good reliability in studies such as those in Japan.
Objective: To translate the EBS-SF into Chinese, check its reliability, validity and explore the related factors.
Method: The EBS-SF was translated into Chinese. 3,440 residents were investigated and 34 respondents were retested. Item analysis and reliability and validity tests were carried out. Personality characteristics, family health status and depression were investigated using the BFI-10, FHS-SF and PHQ-9 to investigate the factors associated with EBS-SF. The t-test, ANOVA and Pearson correlation was used to explore the related factors of its scores.
Result: Among 3,440 residents, 1,748 (50.81%) were male and 1,692 (49.19%) were female; 1,373 (39.91%) were aged 36–50 years. All 7 items were qualified in the item analysis. As for reliability, the Cronbach's α was 0.870, the split-half reliability was 0.830, the test-retest correlation coefficient was 0.868. As for the structural validity, the standardized factor loadings were above 0.50, χ2 / df = 2.081,GFI = 0.999; NFI = 0.999; RFI = 0.996; RMSEA = 0.018, all qualified. The characteristics, personality, family health and depression were correlated with the score of the Chinese version of EBS short form.
Conclusion: The structural validity and reliability of the Chinese version of the EBS-SF are good and it can be used as a measurement tool to evaluate the eating behavior of Chinese. The scores of the EBS-SF may be related to the sociological characteristics, personality, family health, and depression status.
1. Introduction
Over the past four decades, the dietary patterns of Chinese residents have undergone significant changes, with a rapid increase in the consumption of high-sugar and high-calorie foods and a rapid increase in the rates of overweight and obesity in the population. Obesity is increasingly becoming an important public health issue in China. As of 2019 statistics, the national prevalence of obesity is estimated at 6.8%, with obesity rates of 16.4% in adults (1). The development of obesity is closely related to uncontrolled eating behavior (2). Meanwhile, obesity is associated with the onset and progression of various chronic diseases, such as hypertension (3) and diabetes (4), which is very worrying. The prevalence of these chronic diseases rises with the obesity rate, thus significantly increasing the burden on the medical and public health systems of China.
The World Health Organization defines cut-off values for obesity based on the physical assessment such as body mass index (BMI): weight/height squared (kg/m2) (5, 6). Internationally, assessment methods for the obesity also involved such as nutrition assessment, exercise assesssment (4) and also the use of obesity genes. Obviously, it is not realistic to use any of these single indexes to describe the cause of obesity. And the above tools are more appropriate as therapeutic aids to identify obesity rather than exploring the causes of obesity. A valid assessment in terms of food intake as well as eating behavior seems to contribute to a better understanding of obesity and to give an active life management program.
In studies of the eating behavior of Chinese adults, it has been found that certain specific eating habits may constitute risk factors to obesity, such as the absence of a particular meal in a day. However, this may not be the only eating behavior that has an impact on obesity. There are complex interactions between eating behaviors and psychological, social and other factors. Related research confirms that body fat levels are closely related to eating behavior and that obesity may be driven by diet-related behavioral factors as well as pre-existing environmental and genetic factors (7). Therefore, a comprehensive assessment of eating behaviors is needed to identify specific potential risks for obesity.
Many studies exploring eating behaviors have used validated and reliable questionnaires that provide data tested in populations. For example, the Adult Eating Behavior Questionnaire (AEBQ) has been used all over the world. AEBQ is currently validated in Saudi, Poland, Portugal and China (8–11). The AEBQ has 35 items, using a five-point Likert scale involving eight subscales, which can be further divided into two dimensions of food approach and food avoidance behavior. Although this tool has been widely used and validated, the 35-item scale is very costly in terms of effort and time for the subjects and experimenters.
The thirty-item Sakata Eating Behavior Scale widely used in Japan is divided into seven dimensions: concern cognition of constitution, motivation for eating, substitute eating and drinking, feeling of satiety, eating style, meal contents, and eating rhythm abnormalities (12). Higher scores indicate poorer eating behaviors, which exacerbate obesity. The scale is used in some hospitals in Japan to assess eating behaviors to help patients change their eating behaviors and carry out obesity treatment.
The EBS short form was simplified from the 30-item EBS based on item response theory (13). Among the instruments measuring eating behavior associated with obesity, this is a much shorter scale, containing only seven items from the seven original dimensions. This means that the scale can be used in practice with less time and effort on the part of the user. The total score of the short scale is strongly correlated with the original scale (r = 0.93, P = 0.001). The EBS short form was validated in 1,032 Japanese adults aged 20–59 years and confirmed its validity.
In China, there is a lack of short scales that can be used in large cross-sectional surveys and identify more potential obesity problems. The EBS short form could be a more useful tool to measure Chinese eating behaviors and help Chinese obese patients to control their eating behavior. Considering the interoperability of Asian food cultures, the use of a simplified Chinese version of the EBS short form in China would be more culturally advantageous than the original scale developed and validated in countries outside of Asia. The objective of this study was to translate the simplified Chinese version of the EBS short form, check its reliability and validity in China and explore the possible influences on its scores.
2. Methods
This study is derived from a large cross-sectional study that callled “2021 China Family Health Index Investigation” (14). The data used in this study are a subset of this national study. The survey is based on multi-stage sampling across the country. When selecting cities, all the provincial capital cities of provinces and autonomous regions, as well as municipalities in China were firstly included. Later, the random-number table was applied to randomly select the non-provincial capital cities of all provinces and autonomous regions in the country. Finally, 120 cities were selected within China. During the second phase of sampling, the population of each city was stratified according to gender, age, and urban-rural distribution, and the sample size of each stratum was 100 people, which was determined according to the demographic characteristics of the “Seventh National Census in 2021”. Convenience sampling was carried out on the premise of meeting quota requirements. After the completion of the sampling, with the favor of the investigator recruited in each city, the investigation was conducted from 10th July 2021 to 15th September 2021. In detail, investigators of each city used the online questionnaire star platform (https://www.wjx.cn/) to distribute questionnaires one-on-one and face-to-face with people in their cities. Then, after the investigator entered the questionnaire number, respondents would complete the questionnaire by clicking on the link. If the respondents held the ability to think but were not able to act to answer the questionnaire, the investigator would help finish the questionnaire based on the offered answers by the participants. After unified training, investigators recruited from various provinces and cities distributed questionnaires to respondents meeting the inclusion and exclusion criteria through field investigation. Prior to the investigation, the investigator would use consistent instructions to explain the research purpose to the respondents, emphasizing the anonymity of the research and obtaining the informed consent of the respondents. During the investigation, the respondents filled out the questionnaire by themselves and then handed it over to the investigator for inspection. If there were omissions or multiple elections, the investigator would communicate with the respondents on the spot whether a by-election or re-election is possible. After the questionnaires were collected, the questionnaires whose filling time was <2 min, incomplete filling and inconsistent filling content were excluded.
2.1. Instruments
2.1.1. The EBS short form
The EBS short form was developed in 2017 by Tayama and Ogawa et al., using item response theory (IRT) based on the Sakata Eating Behavior Scale (EBS) (13). The scale consists of 7 items, including eating rhythm abnormalities, feeling of satiety, eating habits, cognition of constitution, meal content, substitute eating and drinking, and motivation for eating, and each item is scored on a 4-point scale (1 = strongly disagree, 2 = somewhat disagree, 3 = somewhat agree, 4 = strongly agree). The scores of the 7 items were summed up as the total score of the scale, and the higher the respondent's score on this scale, the worse the eating behavior of the respondent.
2.1.2. Other scales
2.1.2.1. The 10-Item short version of the Big Five Inventory (BFI-10)
The 10-Item short version of the Big Five Inventory (BFI-10) was applied to measure the personality characteristics of the respondents. The scale consists of 5 dimensions with 10 items, and each dimension contains 2 items, including Extraversion, Agreeableness, Conscientiousness, Neuroticism, and Openness, on a 5-point Likert-type scale ranging from 1 (totally disagree) to 5 (totally agree). The full score of each dimension is 10 points, and the higher the score of a personality trait of the respondents, the more significant the personality trait of the respondents is. Several studies have shown that the BFI-10 has good reliability and validity (15–17).
2.1.2.2. The Short-Form of the Family Health Scale (FHS-SF)
The family health level of the respondents was measured by the Short-Form of the Family Health Scale (FHS-SF) (18). The scale was developed by Crandall and Weiss-Laxer et al., and the simplified Chinese version has been validated in the Chinese population by Wang et al. (19). The FHS-SF is derived from the Family Health Scale-Long Form (FHS-LF), and it includes 4 dimensions, which are family social and emotional health process, family healthy lifestyle, family health resources, and family external social support, with a total of 10 items. Each item is scored on a 5-point Likert-type scale, among which items 6, 9 and 10 were scored in reverse. The higher the respondents' score on this scale, the higher the family health of the respondents. In the study, the Cronbach's coefficient of the scale was 0.851.
2.1.2.3. The Patient Health Questionnaire-9 (PHQ-9)
The Patient Health Questionnaire-9 (PHQ-9) was used to measure the depression level of the respondents (20). There are 9 items on the scale, and each item is scored on a 4-point Likert-type scale ranging from 0 (never) to 3 (nearly every day). A total score between 0 and 4 indicates no depression; a total score between 5 and 9 indicates possible mild depression; a total score between 10 and 14 indicates likely moderate depression; a score between 15 and 19 indicates that there may be moderate to severe depression; a total score between 20 and 27 indicates that there may be severe depression. The higher the respondents' score on this scale, the higher the level of depression the respondents may have. In the study, the Cronbach's coefficient of the scale was 0.940.
2.2. Research process
Figure 1 shows the entire process of this study.
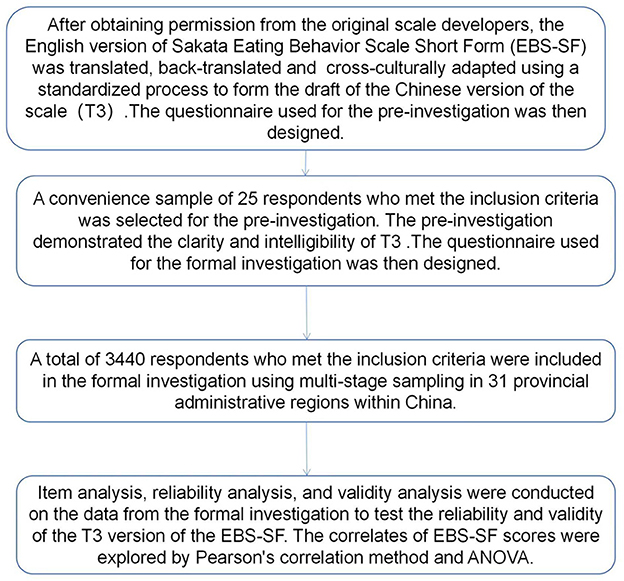
Figure 1. Research process of the study.
2.2.1. Scale translation
2.2.1.1. Translation and back-translation of the scale
Figure 2 shows the process of the scale translation stage.
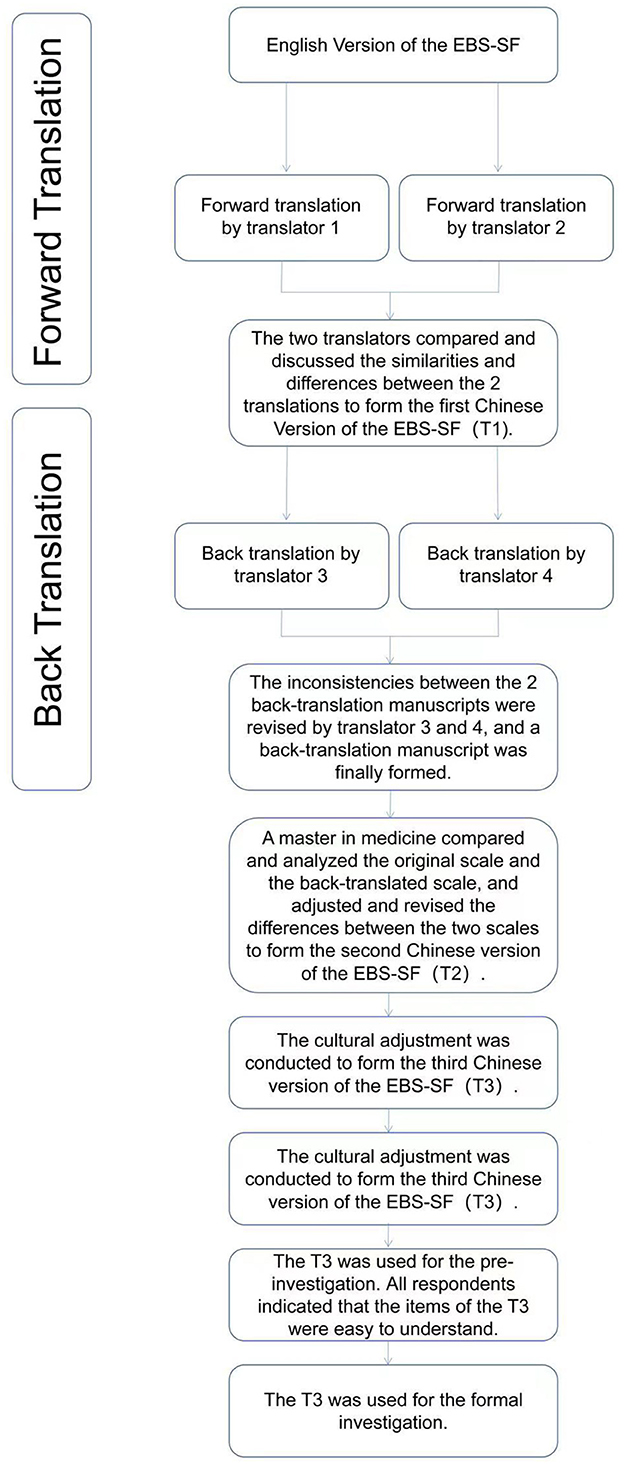
Figure 2. The process of the EBS-SF scale translation stage.
Translation stage. Expert consultation was used to qualitatively evaluate the content validity of the Chinese version of the scale (21).
Authorization for translation and use was obtained from the developers of the EBS short form, and the scale was translated independently by two masters (1 master in public health and 1 master in English-Chinese translation). Afterward, they compared and discussed the similarities and differences between the 2 translations to form the first draft (called: T1) of the Chinese version of the scale.
Back translation stage. The other 2 masters in English-Chinese translation were invited to back-translate the first draft T1 of the Chinese version of the scale separately without knowing the original English version of the EBS short form. The inconsistencies between the 2 back-translation manuscripts were revised, and a back-translation manuscript was finally formed.
Audit stage. A master in medicine compared and analyzed the original scale and the back-translated scale, and adjusted and revised the differences between the two scales to form the second draft (called: T2) of the Chinese version of the EBS short form.
2.2.1.2. Cultural adjustment of the scale
The cultural adjustment group was composed of 16 experts (two in each field) from eight fields of psychology, sociology, social medicine, humanistic medicine, nursing, health education, health service management and behavioral epidemiology. All the members of the group are familiar with the process and methods of scale localization. According to the Guidelines for the process of cross-cultural adaptation of self-report measures (22), experts made judgments on the cultural adaptability of each item in the second draft T2 of the Chinese Version of the EBS short form, and made certain modifications based on Chinese expression habits without changing the original meaning. According to the suggestions of experts, the third draft (called: T3) of the Chinese Version of the EBS short form used in the pre-investigation stage was formed.
2.2.2. Pre-investigation
The purpose of the pre-investigation was to finalize the wording of the Chinese version of the questionnaire. In May 2021, a convenient sampling of 25 respondents who met the inclusion criteria was used for a pre-investigation using the general data questionnaire and the third draft T3 of the Chinese version of the EBS short form. For the pre-investigation, we collected only general characteristics of the respondents and tested the respondents with the Chinese version of EBS-SF. Respondents were asked about the clarity and intelligibility of each item after completion and they all indicated that the items were easy to understand. Therefore, the third draft T3 of the Chinese Version of the EBS short form was used for the formal investigation.
2.2.3. Formal investigation
2.2.3.1. Participants of the formal investigation
2.2.3.1.1. Inclusion/exclusion criteria
The questionnaire selected for this research was selected from the questionnaires in “2021 China Family Health Index Investigation” which met the requirements of this research.
The inclusion criteria of the participants were as follows: (1) Based on the original scale population the age ranged from 20 to 59 (13); (2) Had the nationality of the People's Republic of China; (3) China's permanent resident population with an annual abroad time ≤ 1 month; (4) Participate in the study voluntarily and fill in the informed consent form; (5) Participants can complete the questionnaire by themselves or with the help of investigators; (6) Participants can understand the meaning of each item in the questionnaire;
The exclusion criteria were as follows: (1) Persons with unconsciousness, eating disorders, or mental disorders; (2) Those who are participating in other similar research projects.
2.2.3.1.2. Investigation method
The surveyors were recruited from online, and the surveyors conducted face-to-face interviews with the respondents and completed the online questionnaire on the spot for submission.
2.2.3.1.3. The characteristics of the respondents
The characteristics of the participants that researchers collected comprised gender, age, marital status, educational level, Per capita monthly household income, current residence (urban / rural), region, occupational status, smoking status, drinking status.
2.2.4. Quality control
The study conducted two rounds of pre-investigation before the formal investigation. Trained investigators distributed questionnaires to respondents and registered their codes one-on-one and face-to-face. Every Sunday evening during the investigation process, members of the research group communicated with the investigators to summarize, evaluate and give feedback on the questionnaires they collected. After the questionnaires were collected, two people conducted back-to-back logic checks and data screening. If singular values were found during data analysis, the original questionnaire must be found and checked with the investigator before proceeding to the next step of the analysis.
2.3. Statistical analysis
Data analysis was performed using SPSS 22.0 and AMOS 21.0. Statistical description of the sociological characteristics of the respondents was carried out using percentage, mean, etc. The correlation coefficient method, CITC method and extreme group method were used for item analysis The correlation coefficient method required those correlations of items with coefficients r < 0.35 or P > 0.50 associated with the total scale score be dropped; the extreme group method required that items with t-values obtained using independent sample t-tests in the high (highest 27%) and low (lowest 27%) subgroups be dropped if the differences were not significant (23). In addition, the CITC method requires that if the Cronbach's α of an item increases significantly after deletion, the item will be less internally relevant and should be deleted. Cronbach's α of internal consistency, split-half coefficient and test-retest reliability (intraclass correlation coefficient, ICC) were used for reliability analysis (24), and values ≥ 0.70 were considered to be good reliability.
In addition, confirmatory factor analysis was performed using AMOS 21.0 to test the structural validity of the scale. χ2 / DF < 3, GFI > 0.9, NFI > 0.9, RFI > 0.9 and RMSEA < 0.08 were used as the criteria for good structural validity of the model (25–27). The mean and standard deviation were used to describe the central tendency and dispersion degree of continuous variables. What's more, t-test or ANOVA was used for comparison between groups. After ANOVA, Bonferroni method was used for multiple comparisons. The pearson correlation method was used to analyze the correlation between the scores of other scales and the EBS short form. All data were tested with a two-sided test, and P < 0.05 was considered statistically significant unless otherwise stated.
3. Results
3.1. Characteristics of the participants and the score of the EBS short form
The 2021 “China Family Health Index Investigation” started from July 10, 2021 to September 9, 2021. A total of 11,688 questionnaires were distributed, 11,031 valid questionnaires were recovered, and a total of 3,440 cases were sampled based on the data from the 2021 “China Family Health Index Investigation”. Among 3,440 participants, 1,748 (50.81%) were male and 1,692 (49.19%) were female; 1,373 (39.91%) were people aged 36–50 years and the marital status of married people was the largest, with 2,278 (66.22%). There were 1,662 cases (48.31%) with a bachelor's degree or above and 1,667 cases (48.46%) with household per capita monthly income below 4,500 yuan. Nearly three-quarters of them live in urban areas, with 2,551 cases (74.16%). More than half of the cases were from the eastern part of the Chinese mainland, with 1,729 cases (50.26%) (Table 1).
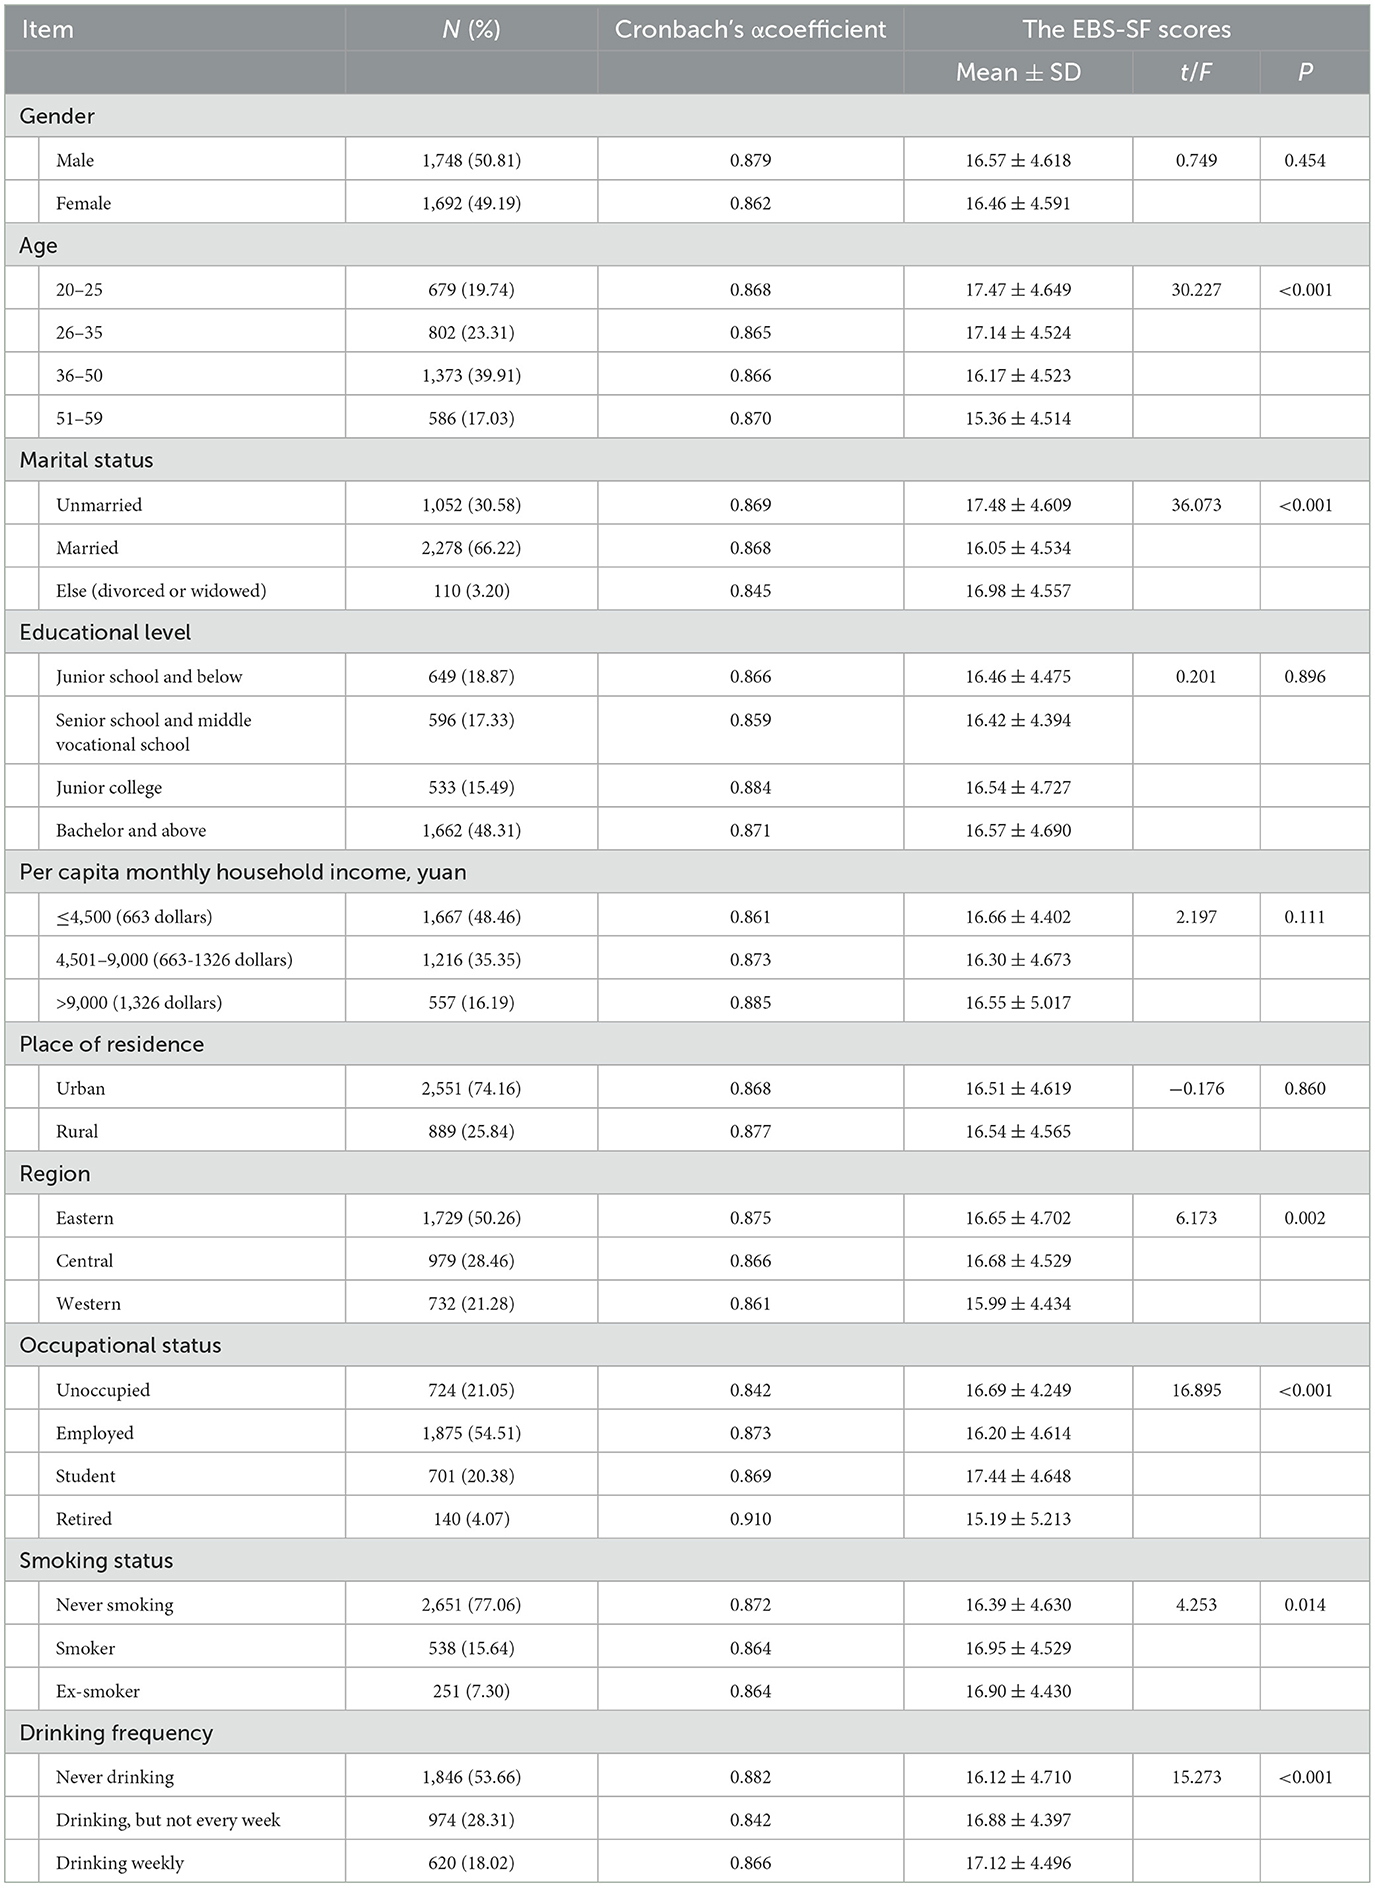
Table 1. Sociological characteristics of the participants, the score of the EBS short form and Cronbach's coefficients for each subgroup.
The Chinese and English versions of EBS-SF is shown in Supplementary Table 1. The t-test or ANOVA was used to test for differences in the EBS short form scores at each level of sociological variables. The results showed that there were significant differences in the scores of the EBS short form in participants of different ages, marital status, regions, occupational status, smoking status and drinking frequency (P < 0.05) (Table 1). The Bonferroni method was further used for the post hoc test of the results of ANOVA (see Supplementary Tables 2–7 for details). The scores of the older age group on this scale are significantly lower than that of the younger age group and the unmarried group were significantly higher than those of the married group; the scores of the western regions were significantly lower than those of the eastern and central regions and student's scores above other occupational status. As for smoking status and drinking frequency, never smoking scored lower than the smokers, and never drinking scored lower than drinking.
The mean score of the total score of the EBS short form was 16.52 ± 4.604 (Mean ± SD). See Table 2 for the score of each item in the EBS short form. The item with the highest mean score was “Item 3: eating fast” (2.52 ± 0.869), while the item with the lowest mean score was “item 7: when I buy food, I am satisfied when I buy more than I need” (2.21 ± 0.878). In each item, the choice with the largest number of people was “somewhat disagree” (items 2, 6, 7) or “somewhat agree” (items 1, 3, 4, 5), while the choice with the smallest number of people was “strongly agree”.

Table 2. Scores of each item in the EBS short form.
3.2. Item analysis and reliability and validity test of the EBS short form
3.2.1. Item analysis
3.2.1.1. Correlation coefficient method
The correlation analysis between each item and the total score of the questionnaire showed that each item score of the Chinese version of the EBS short form was significantly correlated with the total score of the scale, with correlation coefficients ranging from 0.694 to 0.794 (P < 0.001), above 0.35.
3.2.1.2. CITC method
The Corrected item-total correlation (CITC) of the Chinese version of the EBS short form was all above 0.571, and the combination of the deleted Cronbach's α coefficient showed that the internal consistency coefficients did not change much after the deletion of the items (Table 3).

Table 3. Corrected item -total correlation of the simplified Chinese version of the EBS short form.
3.2.1.3. Extreme group method
The participants were ranked according to the total score of the scale, with 27% of the participants at both ends of the scale falling into the two extreme groups. The CR values of the high score group (≥ 19 points) and the low score group (≤ 14 points) were all above 3.0 (P < 0.001).
3.2.2. Validity analysis
3.2.2.1. Content validity
The content validity of the EBS short form was qualitatively evaluated by the expert consultation method. Experts made a qualitative evaluation of the relevance of each item of the Chinese version of the EBS short form to its measured content. 16 experts (two experts in each field of psychology, sociology, social medicine, humanistic medicine, nursing, health education, health service management, and behavioral epidemiology, all with master's or doctoral degrees). All experts agreed that each item in the scale could reflect the content to be measured, indicating that the Chinese version of the EBS short form had good content validity.
3.2.2.2. Structural validity
The EBS short form consisted of only one dimension, so only validation factor analysis was used to test the structural validity of the scale, and the scale was validated according to the single factor structural model of the original scale, and the model was revised 8 times according to the Modified Index (MI). After the modification, the standardized factor loadings of the validation factor analysis were between 0.55 and 0.80, and the residuals were positive and significant.
The model fit indexes were χ2 / df = 2.081 < 3, GFI = 0.999 > 0.9, NFI = 0.999 > 0.9, RFI = 0.996 > 0.9, and RMSEA = 0.018 < 0.08, which is known from the fit indexes that the model structural validity is good and met the requirements. The results of the validation factor analysis are shown in Figure 3.
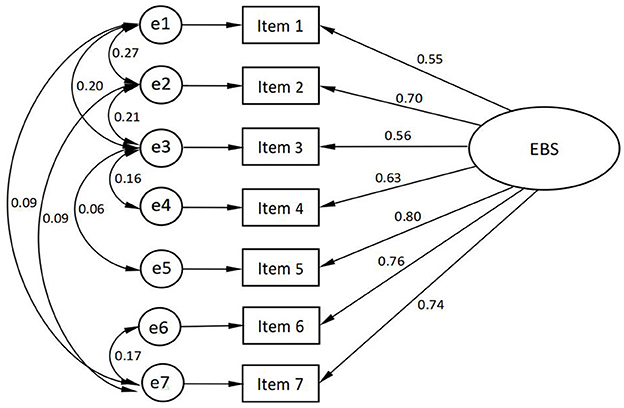
Figure 3. The validation factor analysis model for the Chinese version of the EBS short form.
3.2.2.3. Reliability analysis
The Cronbach's α coefficient of the Chinese version of the EBS short form was 0.870, and the split-half reliability was 0.830, which were all above 0.8. A total of 34 participants were selected by convenience sampling and retested at an interval of 2 weeks. We conducted a convenience sampling and retest reliability test based on respondents' willingness. The test-retest correlation coefficient (ICC) of the scale was 0.868, which was above 0.7.
3.3. The scores of the BFI-10, FHS-SF, and PHQ-9 and their correlation with the scores of the EBS short form
The specific scores of each dimension of BFI-10, FHS-SF and PHQ-9 scale of the participants are shown in Table 4. In BFI-10, the two dimensions with higher scores were agreeableness (7.02 ± 1.532) and conscientiousness (6.92 ± 1.621), and the two dimensions with lower scores were extraversion (6.27 ± 1.591) and neuroticism (5.77 ± 1.478). The overall family health status was good (37.99 ± 6.670). According to the assessment of the depression level of the participants according to their PHQ-9 scores, it was found that of the 3,440 participants, 1,572 had no depression (PHQ-9 score of 0 to 4), 1,171 had possible mild depression (PHQ-9 score of 5 to 9) There were 360 likely to have moderate depression (PHQ-9 score of 10–14), 250 likely to have moderate depression (PHQ-9 score of 15–19), and 87 likely to have severe depression (PHQ-9 score of 20–27).
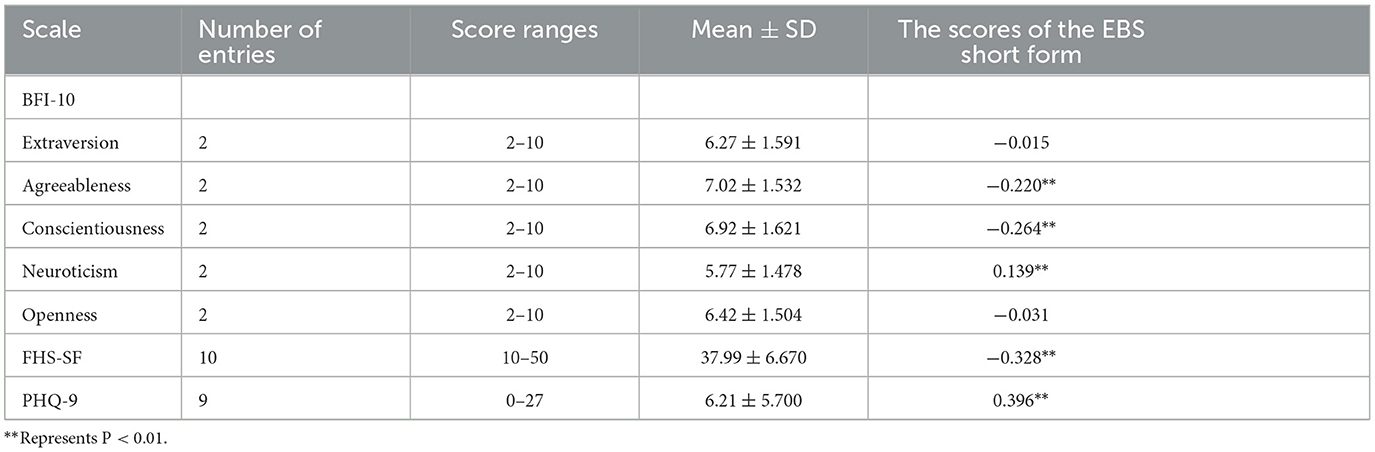
Table 4. The scores of the BFI-10, FHS-SF, and PHQ-9 Scale of the participants and their correlation with the scores of the EBS short form.
The scores of the EBS short form were significantly positively correlated with the scores of “neuroticism” (r = 0.139, P < 0.001) and the PHQ-9 (r = 0.396, P < 0.001). The scores of “agreeableness” (r = −0.220, P < 0.001), “conscientiousness” (r = −0.264, P < 0.001) and the FHS-SF(r = −0.328, P < 0.001) were significantly negatively correlated with the scores of the EBS short form, as shown in Table 4.
4. Discussion
4.1. The Chinese version of the simplified EBS short form has good reliability and validity
In the field of eating behavior research, this study obtained preliminary results in the context of providing a national sample of the Chinese population, and the psychometric characteristics and factor structure of the simplified Chinese version of the EBS short form. The equivalence between the Chinese version of the scale and the original scale was fully ensured through a rigorous scale introduction process, including translation, back translation, expert consultation, and prediction. The good results of item analysis and the good correlation among the items and the total score of the scale illustrate the good reliability of the Chinese version of the EBS short form, the good representation of the items of this scale and the ability to measure eating behavior effectively. After validation factor analysis, sufficient structural validity represented that the original single factor structural model agreed well with the Chinese version of the EBS short form data. The factor loadings of all items in each dimension of the English version of the EBS short form were above 0.6, and the standardized factor loadings of the Chinese version of the factor model were between 0.55 and 0.80, which are more consistent with the original scale. It is generally considered that the Cronbach's α of the total scale is above 0.80, and the test-retest reliability is above 0.7, which means that the reliability of the scale is good. Cronbach's α coefficient and test-retest reliability of the total scale met the measurement requirements, indicating that the Chinese version of the EBS short form has good internal consistency, high reliability, and temporal stability. EBS short form in English with Cronbach's α was 0.830, and Cronbach's α for this study was 0.870, which is close to that of the previous study (13).
4.2. Factors associated with the Chinese version of the EBS short form scores
The EBS short form looks at the differences in eating habits between obese and healthy individuals, with higher scores reflecting worse eating habits. Four aspects were analyzed: personal characteristics, interpersonal networks, personal behavior and social factors.
4.2.1. Personal characteristics
4.2.1.1. Personality traits
The Big Five Personality Inventory, a powerful model for measuring human personality traits, helps us to analyze differences in eating behavior in the population. Our study exploratively found that conscientiousness in the Big Five personality traits may have a significant negative impact on eating behavior, which is similar to the findings of Keller et al. (28). Conscientiousness can lead to more consumption of recommended foods and less consumption of non-recommended foods. In addition, agreeableness is negatively associated with poor eating behavior and relevant to, low emotional under-eating and low emotional overeating (29, 30). What's more, the present study showed a positive association between neuroticism and poor eating behavior, similar to previous studies (31). It could be that neuroticism is associated with emotional eating (32). Emotional instability, impulsiveness and poor self-control are not conducive to good eating habits.
4.2.1.2. Age
In this study, age was viewed as a categorical variable, the significantly higher scores on eating behavior among those under 35 years of age in this study compared to those over 35 years of age may be related to the fact that emotional eating is more prevalent in younger age groups (33). Younger populations have a stronger tendency to be more impulsive to attractive food stimuli, have lower self-regulation and seek higher pleasure, thus increasing the likelihood of undesirable eating behavior (30, 34).
4.2.2. Interpersonal networks
4.2.2.1. Marital status
The results showed that married residents scored lower on the EBS short form than unmarried, which is consistent with a previous study (35). This may be because people are encouraged and supervised by their spouses after entering marriage, which promotes healthy eating behavior (36).
4.2.2.2. Family Health
This study showed a significant negative correlation between the EBS short form scores and FHS-SF scores, which is consistent with previous studies (35). A good family health function not only provides sufficient family health resources to help families better meet their daily needs and perform their functions but also promotes emotional communication between family members, therefore, it is helpful to develop good eating habits (18, 37).
4.2.3. Personal behavior
4.2.3.1. Lifestyle
Lifestyles such as smoking and drinking were associated with high EBS short-form scores. This may be related to the fact that alcohol consumption stimulates appetite and even leads to binge eating (38, 39). Quitting smoking may lead to uncontrolled eating as a result of quitting and thus enhancing the stimulatory response to food. Nicotine, on the other hand, has a suppressive effect on one's appetite, which could explain the relationship between smoking and disordered eating habits, for example, adolescents may smoke in the hope of losing weight (40).
4.2.3.2. Emotional processing
We also explored whether depression was associated with eating behavior, with PHQ-9 scale scores showing a significant positive correlation with eating behavior scores. It may be because depression affects a person's motivation to make food choices, thus reducing the likelihood of choosing healthy meals (41). Although this result is consistent with the findings of a larger number of studies on eating behavior, more research is needed to confirm whether depression is associated with eating behavior in the broad sense (42–44).
4.2.4. Socio-demographic characteristics
4.2.4.1. Occupational status
Poor eating behavior was more pronounced in the student group in this study compared to other occupational states. This is similar to the conclusion of Stok (45) that eating behavior usually becomes unhealthy during the transition from adolescence to young adulthood. When students start college, they are faced with new pressures and a lack of time for activity and financial ability, which can have a strong impact on their eating habits and willingness to engage in healthy behaviors (46).
4.2.4.2. Region of residence
Those in the central and eastern regions of the country performed less well in terms of eating behavior than those in the western regions, and some studies have found that residents living in developed regions are more likely to have eating behavior disorders, which is consistent with the results of this study (47). The pace of life in economically developed areas is fast, and there are more diets available for people to choose. In addition, food-related takeaway and express delivery services are more convenient, and poorer eating behavior may be related to these factors.
4.3. Limitations
In this study, we did not set a scalar scale, so we could not give the scalar validity of this scale and other validated scales, which is one of the limitations of this study. The simplified scale has only seven items, and the answer format with fewer items allows us to complete the test on a larger population. Due to practical difficulties in secondary data collection, the retest reliability of this study was based on a convenience sampling method without using the original study sample, which may be a source of bias.
5. Conclusion
In conclusion, this study demonstrates that the simplified Chinese version of the EBS short form has good psychometric properties and is a valid and reliable tool for assessing eating behavior in Chinese adults. This tool is easy to use in population-based studies because of its self-reported nature and brevity. This study also explored the relationship between personal characteristics such as personality traits or depression status and eating behavior. Although there are some limitations, this study preliminary validated the reliability and validity of the simplified Chinese version of the EBS short form in a national Chinese sample. Future research should focus on the mechanism by which various related factors affect eating behavior, and should also focus on the relationship between the EBS short form score and obesity-related indicators such as BMI, also with the differences in eating behavior between obese and normal people.
Data availability statement
The raw data supporting the conclusions of this article will be made available by the authors, without undue reservation.
Ethics statement
The studies involving human participants were reviewed and approved by Institutional Review Committee of Jinan University, Guangzhou, China (JNUKY-2021-018). The patients/participants provided their written informed consent to participate in this study. Written informed consent was obtained from the individual(s) for the publication of any potentially identifiable images or data included in this article.
Author contributions
LY and YW: directed and supervised the project. PG, XW, LY, and YW: designed research and had primary responsibility for the final content. PG, XW, and JL: drafted the first manuscript. PG, SG, XiaS, FW, and YW: scale translation. PG, SG, WY, YS, and YW: collected the data. PG, WY, YS, and YW: performed the statistical analysis. PG and XW: interpreted the results and wrote the manuscript. PG, XW, XiaS, FW, YN, MY, JZ, SF, QL, XinS, LY, and YW: provided critical revision for important intellectual content of the manuscript. All authors read and approved the final manuscript.
Funding
This research was supported by Annual Project of Shaanxi Provincial Social Science Foundation in 2022 (Grant no: 2022M090) and the scheme was approved by the Institutional Review Committee of Jinan University, Guangzhou, China (JNUKY-2021-018). The funding sources had no role in the study design, data collection and analysis, preparation of the manuscript, or publication of the study.
Conflict of interest
The authors declare that the research was conducted in the absence of any commercial or financial relationships that could be construed as a potential conflict of interest.
Publisher's note
All claims expressed in this article are solely those of the authors and do not necessarily represent those of their affiliated organizations, or those of the publisher, the editors and the reviewers. Any product that may be evaluated in this article, or claim that may be made by its manufacturer, is not guaranteed or endorsed by the publisher.
Supplementary material
The Supplementary Material for this article can be found online at: https://www.frontiersin.org/articles/10.3389/fnut.2023.1076209/full#supplementary-material
References
1. GBD 2019 Risk Factors Collaborators. Global burden of 87 risk factors in 204 countries and territories, 1990-2019: a systematic analysis for the Global Burden of Disease Study 2019. Lancet (London, England). (2020) 396:1223–49.
2. Calvo D, Galioto R, Gunstad J, Spitznagel MB. Uncontrolled eating is associated with reduced executive functioning. Clin Obes. (2014) 4:172–9. doi: 10.1111/cob.12058
3. Leggio M, Lombardi M, Caldarone E, Severi P, D'Emidio S, Armeni M, et al. The relationship between obesity and hypertension: An updated comprehensive overview on Vicious Twins. Hypertens Res. (2017) 40:947–63. doi: 10.1038/hr.2017.75
4. Aras M, Tchang BG, Pape J. Obesity diabetes. Nurs Clin North Am. (2021) 56:527–41. doi: 10.1016/j.cnur.2021.07.008
5. Sisson SB, Campbell JE, May KB, Brittain DR, Monroe LA, Guss SH, et al. Assessment of food, nutrition, and physical activity practices in Oklahoma child-care centers. J Acad Nutr Diet. (2012) 112:1230–40. doi: 10.1016/j.jand.2012.05.009
6. WHO. Obesity Assessment Instruments, American Psychological Association. American Psychological Association. (2018). Available online at: https://www.apa.org/obesity-guideline/assessment (accessed January 31, 2023).
7. O'Neill BV, Bullmore ET, Miller S, McHugh S, Simons D, Dodds CM, et al. The relationship between Fat Mass, eating behaviour and obesity-related psychological traits in overweight and obese individuals. Appetite. (2012) 59:656–61. doi: 10.1016/j.appet.2012.07.017
8. Guzek D, Skolmowska D, Głąbska D. Appetitive traits in a population-based study of polish adolescents within the place-19 study: Validation of the adult eating behavior questionnaire. Nutrients. (2020) 12:3889. doi: 10.3390/nu12123889
9. Alruwaitaa MA, Alshathri A, Alajllan L, Alshahrani N, Alotaibi W, Elbarazi I, et al. The Arabic version of the Adult Eating Behavior Questionnaire among Saudi population: translation and validation. Nutrients. (2022) 14:4705. doi: 10.3390/nu14214705
10. He J, Sun S, Zickgraf HF, Ellis JM, Fan X. Assessing appetitive traits among Chinese young adults using the adult eating behavior questionnaire: factor structure, gender invariance and latent mean differences, and associations with BMI. Assessment. (2019) 28:877–89. doi: 10.1177/1073191119864642
11. Warkentin S, Costa A, Oliveira A. Validity of the adult eating behavior questionnaire and its relationship with parent-reported eating behaviors among adolescents in Portugal. Nutrients. (2022) 14:1301. doi: 10.3390/nu14061301
13. Tayama, J, Ogawa, S, Takeoka, A, Kobayashi, M, Shirabe S. Item response theory-based validation of a short form of the eating behavior scale for Japanese adults. Medicine. (2017) 96:42. doi: 10.1097/MD.0000000000008334
14. Wu Y, Sun X, Wang Y, Ge P, Huan X, Zhang H, et al. (2022). 2021 China Family Health Index Investigation, CFNEWS. Available online at: https://www.cfnews.org.cn/newsinfo/2685237.html (accessed November 18, 2022).
15. Johann D, Steinbrecher M, Thomas K. Channels of participation: political participant types and personality. PLOS ONE. (2020) 15:e0240671. doi: 10.1371/journal.pone.0240671
16. Eichenberg C, Schott M, Schroiff A. Problematic smartphone use—comparison of students with and without problematic smartphone use in light of personality. Front Psychiatry. (2021) 11. doi: 10.3389/fpsyt.2020.599241
17. Nikčević AV, Marino C, Kolubinski DC, Leach D, Spada MM. Modelling the contribution of the big five personality traits, health anxiety, and COVID-19 psychological distress to generalised anxiety and depressive symptoms during the COVID-19 pandemic. J Affect Disord. (2021) 279:578–84. doi: 10.1016/j.jad.2020.10.053
18. Crandall A, Weiss-Laxer NS, Broadbent E, Holmes EK, Magnusson BM, Okano L, et al. The family health scale: reliability and validity of a short- and long-form. Frontiers in Public Health. (2020) 8:587125. doi: 10.3389/fpubh.2020.587125
19. Wang F, Wu Y, Sun X, Wang D, Ming W-K, Sun X, et al. (2022). Reliability and validity of the Chinese version of a short form of the Family Health Scale. BMC Primary Care. 23:108. doi: 10.1186/s12875-022-01702-1
20. Levis B, Benedetti A, Thombs BD. Accuracy of patient health questionnaire-9 (PHQ-9) for screening to detect major depression: Individual participant data meta-analysis. BMJ. (2019) 365:1476. doi: 10.1136/bmj.l1476
21. Sousa VD, Rojjanasrirat W. Translation, adaptation and validation of instruments or scales for use in cross-cultural health care research: a clear and user-friendly guideline. J Eval Clin Pract. (2010) 17:268–74. doi: 10.1111/j.1365-2753.2010.01434.x
22. Beaton DE, Bombardier C, Guillemin F, Ferraz MB. Guidelines for the process of cross-cultural adaptation of self-report measures. Spine. (2000) 25:3186–91. doi: 10.1097/00007632-200012150-00014
23. Ferketich S. Focus on psychometrics aspects of item analysis. Res Nurs Health. (1991) 14:165–8. doi: 10.1002/nur.4770140211
24. Shrout PE, Fleiss JL. Intraclass correlations: uses in assessing rater reliability. Psychol Bull. (1979) 86:420–8. doi: 10.1037/0033-2909.86.2.420
25. MacCallum RC, Browne MW, Sugawara HM. Power analysis and determination of sample size for covariance structure modeling. Psychol Met. (1996) 1:130–49. doi: 10.1037/1082-989X.1.2.130
26. Sümer N. Written Association Models: Basic Conventions and Examples Applications]. Türk Psikoloji Yazilari. Ankara: Turkish Psychological Society. (2000).
27. Alavi M, Visentin D, Thapa D, Hunt G, Watson R, Cleary M. Chi-square for model fit in confirmatory factor analysis. J Adv Nurs. (2020) 76:2209–11. doi: 10.1111/jan.14399
28. Keller C, Siegrist M. Does personality influence eating styles and food choices? direct and indirect effects. Appetite. (2015) 84:128–38. doi: 10.1016/j.appet.2014.10.003
29. Sun T, Lin S, Kolodinsky J. Hierarchical trait predictors of healthy diet: a comparison between us and Chinese young consumers. Int J Consum Stud. (2014) 38:620–7. doi: 10.1111/ijcs.12133
30. Vollrath ME, Torgersen S, Torgersen L. Associations of children's big five personality with eating behaviors. BMC Research Notes. (2018) 11:654. doi: 10.1186/s13104-018-3768-9
31. Elfhag K, Morey LC. Personality traits and eating behavior in the obese: Poor self-control in emotional and external eating but personality assets in restrained eating. Eat Behav. (2008) 9:285–93. doi: 10.1016/j.eatbeh.2007.10.003
32. Bruch H. Psychological aspects of overeating and obesity. Psychosomatics. (1964) 5:269–74. doi: 10.1016/S0033-3182(64)72385-7
33. Shriver LH, Dollar JM, Calkins SD, Keane SP, Shanahan L, Wideman L. Emotional eating in adolescence: effects of emotion regulation, weight status and negative body image. Nutrients. (2020) 13:79. doi: 10.3390/nu13010079
34. Aoun C, Nassar L, Soumi S, Osta NE, Papazian T, Khabbaz LR. The cognitive, behavioral, and emotional aspects of eating habits and association with impulsivity, chronotype, anxiety, and depression: a cross-sectional study. Front Behav Neurosci. (2019) 13. doi: 10.3389/fnbeh.2019.00204
35. Mei D, Deng Y, Li Q, Lin Z, Jiang H, Zhang J, et al. Current status and influencing factors of eating behavior in residents at the age of 18~60: a cross-sectional study in China. Nutrients. (2022) 14:2585. doi: 10.3390/nu14132585
36. Birmingham WC, Cavallini AQ, Sgro J. Spousal influence: a study of women with eating and body image concerns. J Health Psychol. (2019) 26:1339–52. doi: 10.1177/1359105319873946
37. Min HW, Wu YB, Sun XY. Relation of eating behavior and family health and personality traits in adolescents. Zhong Guo Xue Xiao Wei Sheng. (2022) 43:1023–7. doi: 10.16835/j.cnki.1000-9817.2022.07.016
38. Fong M, Scott S, Albani V, Adamson A, Kaner E. Joining the dots: Individual, sociocultural and environmental links between alcohol consumption, dietary intake and body weight—a narrative review. Nutrients. (2021) 13:2927. doi: 10.3390/nu13092927
39. Caton SJ, Nolan LJ, Hetherington MM. Alcohol, appetite and loss of restraint. Curr Obes Rep. (2015) 4:99–105. doi: 10.1007/s13679-014-0130-y
40. Berro J, Akel M, Hallit S, Obeid S. Relationships between inappropriate eating habits and problematic alcohol use, cigarette and waterpipe dependence among male adolescents in Lebanon. BMC Public Health. (2021) 21:140. doi: 10.1186/s12889-021-10184-2
41. Ramón-Arbués E, Abad'ıa BM, Granada López JM, Ech'aniz Serrano E, Garcia BP, Vela RJ, et al. Eating behavior and relationships with stress, anxiety, depression and insomnia in university students. Nutr Hosp. (2019) 36:1339–45. doi: 10.20960/nh.02641
42. Lazarevich I, Irigoyen Camacho ME, Velázquez-Alva MDC, Zepeda Zepeda M. Relationship among obesity, depression, and emotional eating in young adults. Appetite. (2016) 107:639–44. doi: 10.1016/j.appet.2016.09.011
43. Song Y-M, Lee K, Sung J. Genetic environmental relationships between eating behavior and symptoms of anxiety and depression. Eat Weight Disord. (2017) 24:887–95. doi: 10.1007/s40519-017-0445-2
44. Eck KM, Byrd-Bredbenner C. Disordered eating concerns, behaviors, and severity in young adults clustered by anxiety and depression. Brain Behav. (2021) 11:12. doi: 10.1002/brb3.2367
45. Stok F, Renner B, Clarys P, Lien N, Lakereld J, Deliens T, et al. Understanding eating behavior during the transition from adolescence to young adulthood: a literature review and perspective on future research directions. Nutrients. (2018) 10:667. doi: 10.3390/nu10060667
46. Sogari G, Velez-Argumedo C, Gómez M, Mora C. College students and eating habits: a study using an ecological model for healthy behavior. Nutrients. (2018) 10:1823. doi: 10.3390/nu10121823
Keywords: eating behavior, validity, reliability, cross-cultural adjustment, BFI-10, family health
Citation: Ge P, Wang X, Gao S, Liu J, Niu Y, Yan M, Fan S, Li Q, Zhang J, Sun X, Wang F, Sun Y, Yu W, Sun X, Yu L and Wu Y (2023) Reliability and validity of the Chinese version of the Sakata Eating Behavior Scale short form and preliminary analysis of the factors related to the score of the scale. Front. Nutr. 10:1076209. doi: 10.3389/fnut.2023.1076209
Received: 21 October 2022; Accepted: 20 February 2023;
Published: 08 March 2023.
Edited by:
José Aparecido Da Silva, Universidade Católica de Petrópolis, BrazilReviewed by:
Ezequiel Pinto, University of Algarve, PortugalSaniye Bilici, Gazi University Faculty of Health Sciences, Türkiye
Ge Sheng, Shanghai Jiao Tong University, China
Copyright © 2023 Ge, Wang, Gao, Liu, Niu, Yan, Fan, Li, Zhang, Sun, Wang, Sun, Yu, Sun, Yu and Wu. This is an open-access article distributed under the terms of the Creative Commons Attribution License (CC BY). The use, distribution or reproduction in other forums is permitted, provided the original author(s) and the copyright owner(s) are credited and that the original publication in this journal is cited, in accordance with accepted academic practice. No use, distribution or reproduction is permitted which does not comply with these terms.
*Correspondence: Lian Yu, eXVsaWFuNzMxQHhqdHUuZWR1LmNu; Yibo Wu, YmptdXd1eWlib0BvdXRsb29rLmNvbQ==
†These authors share first authorship