
94% of researchers rate our articles as excellent or good
Learn more about the work of our research integrity team to safeguard the quality of each article we publish.
Find out more
ORIGINAL RESEARCH article
Front. Nutr. , 20 July 2023
Sec. Nutrition and Metabolism
Volume 10 - 2023 | https://doi.org/10.3389/fnut.2023.1065578
This article is part of the Research Topic Potential of Fatty Acids as Biomarkers and Therapeutic Agents for Cardio-Metabolic and Neurodegenerative Diseases View all 4 articles
 Ivana Šarac1*
 Jasmina Debeljak-Martačić1
 Marija Takić1
 Vuk Stevanović1
 Jelena Milešević1
 Milica Zeković1
 Tamara Popović1
 Jovica Jovanović2
 Nevena Kardum Vidović1
Introduction: Fatty acids (FAs) composition and desaturase activities can be altered in different metabolic conditions, but the adiposity-independent associations with clinical and biochemical indicators of cardiometabolic risk are still unclear. This study aimed to analyze the associations of FAs composition and estimated desaturase activities with anthropometric, clinical, and biochemical cardiometabolic risk indicators in non-diabetic Serbian women, and to investigate if these associations were independent of the level of adiposity and other confounders.
Methods: In 76 non-diabetic, otherwise healthy Serbian women, aged 24-68 years, with or without metabolic syndrome or obesity (BMI=23.6±5.6 kg/m2), FA composition in erythrocyte phospholipids was measured by gas-liquid chromatography. Desaturase activities were estimated from product/precursor FAs ratios (D9D:16:1n-7/16:0; D6D:20:3n-6/18:2n-6; D5D:20:4n-6/20:3n-6). Correlations were made with anthropometric, biochemical (serum glucose, triacylglycerols, LDL-C, HDL-C, ALT, AST, and their ratios) and clinical (blood pressure) indicators of cardiometabolic risk. Linear regression models were performed to test the independence of these associations.
Results: Estimated desaturase activities and certain FAs were associated with anthropometric, clinical and biochemical indicators of cardiometabolic risk: D9D, D6D, 16:1n-7 and 20:3n-6 were directly associated, while D5D and 18:0 were inversely associated. However, the associations with clinical and biochemical indicators were not independent of the associations with the level of adiposity, since they were lost after controlling for anthropometric indices. After controlling for multiple confounders (age, postmenopausal status, education, smoking, physical activity, dietary macronutrient intakes, use of supplements, alcohol consumption), the level of adiposity was the most significant predictor of desaturase activities and aforementioned FAs levels, and mediated their association with biochemical/clinical indicators. Vice versa, desaturase activities predicted the level of adiposity, but not other components of cardiometabolic risk (if the level of adiposity was accounted). While the associations of anthropometric indices with 16:1n-7, 20:3n-6, 18:0 and D9D and D6D activities were linear, the associations with D5D activity were the inverse U-shaped. The only adiposity-independent association of FAs profiles with the indicators of cardiometabolic risk was a positive association of 20:5n-3 with ALT/AST ratio, which requires further exploration.
Discussion: Additional studies are needed to explore the mechanisms of the observed associations.
Since 1975 the prevalence of obesity has nearly tripled worldwide (1), and it is estimated that up to 2030, 38% of the world adult population will be overweight, while 20% will be obese (2). The main culprit for the present obesity pandemic is the modern lifestyle, which includes the lack of physical activity and increased availability and consumption of energy-dense (high-fat/sugar), processed, “western-style” food (2). The increasing prevalence of overweight and obesity is an emerging public health concern not only in the western, industrialized, high-income countries, but also (and even more) in the low-income and middle-income countries (3). Particularly the countries in economic transition are on the increased burden, since their economic transition is also followed by corresponding lifestyle and dietary changes (so called “nutritional transition”) (4). Serbia is one of the European countries in transition, and during the last 50 years an increased trend in prevalence of overweight and obesity among adults, adolescents and children has been observed (5). According to the latest national survey in 2019, even 57.1% of citizens 15 years and more old in Serbia were with overweight or obesity (6), which is much higher than the average prevalence of overweight and obesity worldwide (1).
Even though the modern lifestyle is the main culprit for development of obesity and related co-morbidities, there are additional factors which can contribute to their development, including hereditary factors (7).
Overweight and obesity are among the main factors responsible for the development of the metabolic syndrome (MetS), which is the key element in development of their metabolic and cardiovascular co-morbidities. Metabolic syndrome is characterized by abdominal and visceral adiposity, insulin resistance, hyperinsulinemia, hyperglycemia, dyslipidemia [increased triacylglycerols (TAG) and decreased high-density lipoproteins - cholesterol (HDL-C) levels], hypertension, non-alcoholic fatty liver disease (NAFLD) and proinflammatory and prothrombotic state (8, 9). However, not all obesity phenotypes are connected with development of MetS, and there is also a metabolically healthy phenotype of obesity (MHO), which does not have the adverse cardiometabolic components of MetS, despite increased adiposity (10). Vice versa, MetS, associated with substantial insulin resistance and increased cardiometabolic risk, is also often observed in normal-weight or underweight subjects, despite normal (11) or even decreased adiposity (e.g., in lipodystrophic syndromes, where in particular peripheral adipose tissue is absent, while central and visceral adiposity can exist) (12, 13). Therefore, increased adiposity and components of metabolic syndrome do not have to be necessary connected (14, 15). Nevertheless, increased adiposity itself certainly worsens all the MetS components (16). In accordance, there is considerable evidence that even in the subjects with MHO, with time the MetS components and increased risk for cardiovascular disease and diabetes develop, and this is mostly determined by the increased visceral adiposity (17, 18). Vice versa, even moderate weight loss (5–10%) significantly reduces almost all of the MetS components in subjects with overweight or obesity, deepening on the initial body weight (BW), with the greater weight loss being associated with the greater MetS components reduction (19).
In the last several decades, there is substantial evidence that long chain fatty acids (FAs) compositions in various body compartments (e.g., the liver, muscle, adipose tissue, whole blood, plasma, erythrocytes, thrombocytes, cerebrospinal fluid, follicular fluid, seminal plasma, etc.) and activities of enzymes involved in their metabolism – desaturases and elongases, are connected with development of obesity (20–24), abdominal adiposity (25–27), insulin resistance and hyperglycemia (28–30), dyslipidemia (31), MetS (32–39), NAFLD (40), diabetes (41–46), and various cardiovascular diseases (hypertension, atherosclerosis, stroke, myocardial infarction, heart failure, etc.) (47–49).
The activities of enzymes involved in metabolism of FAs and profiles of FAs in erythrocytes, thrombocytes and various plasma lipids – phospholipids (PL), cholesterol-esters (CE), TAG and free fatty acids (FFA) are influenced by many factors, including genetics (50–52), gender (53–55), ethnicity (55–57), age (53, 58, 59), hormonal status (60–63), long-term and short-term dietary intakes of specific macronutrients (51, 64–67) and micronutrients (minerals: Fe, Zn; vitamins: D, B9, B12, B6, A, C; polyphenols, etc.) (64, 68–74), physical activity (53, 75), smoking (53, 74), but also (as mentioned above) by the presence of some metabolic conditions (including obesity, dyslipidemia, metabolic syndrome, NAFLD and diabetes), or by the use of certain drugs (e.g., statins) (76).
Delta-9 desaturase (D9D, also known as stearoyl-CoA desaturase 1, SCD-1), delta-6 desaturase (D6D) and delta-5 desaturase (D5D) are enzymes involved in desaturation process of, correspondingly, saturated (D9D) or polyunsaturated (D6D and D5D) long chain FAs. They are encoded by genes Scd1, Fads2 and Fads1, respectively. To directly measure the activities of desaturases in different body compartments (specific tissues, whole blood, plasma, erythrocytes, etc.) is difficult and demanding, requires biopsy of tissues (e.g., the liver, fat tissue, muscle) and complicated techniques for the microsomal activity and expression measurements, or includes very costly and laborious methods with stable isotope administration (D2O, 13C-acetate or 13C-labeled FAs), which are impractical for large samples (77–79). For all of these reasons, desaturase activities are the most often estimated through their product/precursor FAs ratios in the circulation.
The activity of D9D can be estimated through the ratios 16:1n-7/16:0 and 18:1n-9/18:0 (for D9D-16 and D9D-18 activities, respectively). Similarly, the ratios 18:3n-6/18:2n-6 and 18:4n-3/18:3n-3 can both be used as the estimations of D6D activity, while the ratios of 20:4n-6/20:3 n-6 and 20:5n-3/20:4n-3 as the estimations of D5D activity, as n-3 and n-6 FAs compete for the same enzymes. However, the levels of 16:1n-7, 18:3n-6 and 20:3n-6 are more often used for the estimation of enzymatic activity, since they are less dependent on FAs dietary intakes, given that they are scarce in habitual diets, and therefore more reflect the endogenous synthesis and metabolism (20, 77, 80). Additionally, because of very rapid conversion of 18:3n-6 by elongase 5 (Elov5) to 20:3n-6 (80), the ratio of 20:3n-6 to 18:2n-6 is more often used to estimate D6D activity (49).
Erythrocyte membrane PL FAs composition is determined by a combination of diet and endogenous metabolism (61). Even though each lipid pool has a distinctive pattern of FAs profiles, there is a significant correlation between erythrocyte PL and TAG FAs composition, and hepatic, adipose tissue, muscle and plasma lipids FAs composition, because there is an exchange of FAs between different lipid pools (21, 77, 81–89). It is commonly thought that the profiles of FAs in erythrocyte membranes are more steady long-term and less influenced by the temporary dietary changes in intakes of FAs and carbohydrates, compared with the FAs profiles in plasma lipids (90, 91), even though there are some studies which disagree with this (85, 87, 89). Moreover, they are less influenced by the plasma TAG levels, compared with the whole plasma FAs profiles (92). Therefore, they can be viewed as indicators of average macronutrient intakes during several proceeding weeks or months, as well as indicators of endogenous metabolism in other tissues, particularly in the liver (90, 93, 94). Besides, there are also membrane-bond desaturases in erythrocytes, and their activity can be stimulated by oxidative stress and inflammation, caused by exercise, smoking, aging or other pro-oxidative and pro-inflammatory conditions (including obesity), in order to improve erythrocyte-membrane flexibility and protect erythrocytes from the free radical–induced hemolysis (95, 96).
Even though there is enough evidence that FAs composition (as well as the activities of desaturases and elongases) in different lipid compartments are associated with development of obesity, MetS, dyslipidemia, NAFLD, diabetes, atherosclerosis and cardiovascular diseases, the majority of the studies usually did not distinguish the associations with biochemical and clinical cardiometabolic risk markers from the associations with the increased adiposity (i.e., overweight and obesity). It is well known that the level of adiposity is in a direct association with biochemical and clinical markers of cardiometabolic risk, including levels of glucose (GLU), lipids, liver enzymes and blood pressure (BP), so it is unclear if there are some additional, adiposity-independent associations of FAs profiles and desaturase activities with biochemical and clinical indicators of cardiometabolic risk. Just a few studies controlled these associations, and only for body mass index (BMI) as a measure of adiposity (32, 97–99), while the other indicators of adiposity (100) were not considered. Some of these studies included only subjects with obesity (98), while the associations in normal-weight and underweight subjects were rarely examined. Additionally, in some studies the influence of other possible confounding factors, including sex, ethnicity, age, diet, smoking, physical activity, and alcohol consumption was not controlled. Many studies included either a mixed sample of men and women (without a clear separation of the results by sex) (39, 101) or only men (even elderly men) (32, 99), while it is known that FAs profiles and activities of desaturases can be influenced by sex (53, 54, 98), and the studies in women are particularly lacking. There are also huge racial and ethnic differences in FAs profiles and estimated activities of desaturases, which are not necessarily related to different cultural and dietary influences (55–57, 102–105). Moreover, many studies were performed in subjects with present cardiometabolic conditions (diabetes, cardiovascular diseases), while subtle changes in healthy subjects were not often examined.
This study aims to analyze the associations of FAs profiles in erythrocyte membranes PL and the estimated desaturase activities with anthropometric, clinical, and biochemical indicators of cardiometabolic risk in a cohort of non-diabetic, otherwise healthy Serbian women, and to investigate if the associations with clinical and biochemical indicators are independent of the level of adiposity, macronutrient intake, and other possible confounders.
This cross-sectional study included 76 non-diabetic and otherwise healthy Serbian women (aged 22–68 years), with or without metabolic syndrome or obesity (BMI 16.2–43.2 kg/m2, average 23.6 ± 5.6 kg/m2). The study was conducted according to the principles of the Declaration of Helsinki, and was approved by the Institute of Occupational Health Niš Ethics Board. Participants were recruited through the advertisements posted in medical services, social networks and through personal contacts of researchers. All subjects signed written informed consent before participating in the study, and completed a general questionnaire, with data included on age, postmenopausal status, education level, presence of acute and chronic illnesses, the current use of medications and supplements, smoking habit, alcohol consumption and physical activity. The subjects who did not fulfill the inclusion criteria, or met the exclusion criteria, were not enrolled in the study. The inclusion criteria were: female sex, age 20–70 years, while the exclusion criteria were presence or history of diabetes and major cardiovascular diseases (coronary heart disease, stoke), presence of other chronic or acute diseases, pregnancy and breastfeeding, recent BW changes or dietary changes, current use of hypotensive, hypolipemic or hypoglycemic drugs or drugs to treat obesity, current use of hormonal replacement therapy (HRT), oral contraceptives or corticosteroid drugs, use of 18:3n-6 supplements, and heavy alcohol consumption. Obesity, MetS, dyslipidemia or hypertension, if they were not connected with diabetes or major cardiovascular events or pharmacological treatment with of hypotensive, hypolipemic or hypoglycemic drugs, were not considered as exclusion criteria. Postmenopausal status (defined as the absence of a menstrual period for 1 year or more, or surgical menopause) was not an exclusion criterion, since the post-menopausal status was not connected with significant changes in FA profiles and desaturase activities in one study (106). Nevertheless, in our analyses we controlled for the postmenopausal status and all the analyses were also repeated with exclusion of postmenopausal women (N = 14). Similarly, the irregular uses of n-3 FAs supplements or Zn supplements (107), or both were not exclusion criteria, since: (1) in the analyses of D6D and D5D activities we did not used the ratios of n-3 FAs; (2) all the analyses were later controlled for n-3 FAs and Zn supplements intake; and (3) all the analyses were also repeated with exclusion of these subjects (N = 13).
The required study sample for correlation analyses was calculated according to our pilot study in 40 non-diabetic women (aged 24–68 years, BMI = 25.5 ± 6.0 kg/m2). This pilot study revealed correlation coefficients r of erythrocytes PL FAs composition and estimated desaturase activities with examined anthropometric and biochemical indicators of cardiometabolic risk in the range of 0.324 ≤ r ≤ 0.693. Therefore, the required minimum sample size was 65, calculated according to formula N = [(Zα + Zβ)/C]2 + 3, where α = 0.05, β = 0.20, Zα = 1.9600, Zβ = 0.8416, C = 0.5*ln[(1 + r)/(1 − r)], and r = 0.324 (the minimal significant correlation coefficient observed in our pilot study) (108). To further increase the power of study and to allow for possible drop-out during analytical procedures, we increased the number of recruited participants to 80. Nevertheless, 4 subjects were later excluded from the statistical analyses due to low quality of samples for gas–liquid chromatography.
Before analyses, subjects fasted for at least 12 h and refrained from strenuous exercise and alcohol consumption for 24 h. They attended the research facility in 8:00 am for anthropometric and BP measurements, and blood collection.
Measurements of body height (BH), BW, fat mass (FM), fat mass percentage (FM%), fat-free mass (FFM), waist circumference (WC), and hip circumference (HC) were performed according to standardized procedures and techniques (109, 110). Body weight, FM, FM%, and FFM were measured on a portable semiprofessional 8-electrode bioimpedance analyzer Tanita Inner Scan V BC-545 N Segmental Body Composition Monitor (Tanita, Aerolit d.o.o., Belgrade, Serbia), according to the recommendations provided by the manufacturer. Visceral fat level (VFL) was calculated according to the Tanita algorithm (111). Body mass index (kg/m2) was calculated, and according to their BMI, the participants were classified into four categories: underweight (BMI <18.5 kg/m2), normal weight (BMI: 18.5–24.9 kg/m2), overweight (BMI: 25–29.9 kg/m2), and obese (BMI ≥30 kg/m2) (112). Abdominal obesity was defined by WC ≥88 cm (110). Waist to hip ratio (WHR) and waist to height ratio (WHtR) were also calculated, with WHR ≥0.86 and WHtR ≥0.50 being indicative of truncal fat distribution, i.e., centripetal obesity (110, 113).
Blood pressure measurements were performed according to standardized procedures, after resting for 10 min, with a calibrated mechanic sphygmomanometer and stethoscope (Becton Dickinson, Franklin Lakes, NJ, United States), and the average of two measurements was presented as the result. Hypertension was defined by systolic blood pressure (SBP) ≥140 mmHg and/or diastolic blood pressure (DBP) ≥90 mmHg, while pre-hypertension was defined by SBP between 130 and 140 mmHg and/or DBP between 85 and 90 mmHg (114).
After the anthropometric and BP measurements were performed, fasting blood samples were collected in specific Vacutest Kima® blood collection tubes, available from Vacutest Kima® S.R.L., Italy (Yunycom d.o.o., Belgrade, Serbia): Vacutest® Serum Separator Clot Activator 6 mL tubes, to assess the levels of serum GLU, TAG, low-density lipoproteins (LDL)-C, HDL-C, aspartate aminotransferase (AST), and alanine aminotransferase (ALT); and Vacutest® K3EDTA 6 mL tubes, to assess the FAs profiles in erythrocytes.
After allowing the serum coagulation tubes to clot for 30 min at room temperature, they were centrifuged at 3,000× g for 10 min. Following centrifugation, standard photometric assays were performed using an ARCHITECT c8000 Abbott clinical chemistry analyzer (Abbott Laboratories S.A., Belgrade, Serbia), and commercially available kits (Abbott Laboratories S.A., Belgrade, Serbia). Intra- and inter-assay coefficients of variation (CVs) for all measurements were < 5%.
The criteria for the existence of diabetes and impaired fasting glucose (IFG) were set according to the American Diabetes Association guidelines (i.e., fasting GLU ≥7.0 mmol/L and ≥ 5.6 mmol/L, respectively) (115). The existence of dyslipidemia was established based on the National Cholesterol Education Program—Adult Treatment Panel III criteria, which defined cut-off values for TAG (≥1.69 mmol/L), LDL-C (≥3.34 mmol/L), and HDL-C (<1.3 mmol/L) (116). The atherogenic risk was also calculated as the ratio of TAG/HDL-C, with cut-off ratio ≥ 1.18 (117). Metabolic syndrome was defined according to the American Heart Association/National Heart, Lung, and Blood Institute criteria (9).
After collecting blood into EDTA-containing vacutainer tubes, tubes were placed in the fridge at +4°C up to 1 h, until plasma and erythrocytes were separated by centrifugation at 3,000 × g for 10 min at +4°C, and erythrocytes were washed by the standard procedure (118). The aliquots of plasma and washed erythrocytes were kept frozen at −80°C until further analyses. Plasma and erythrocyte samples for FAs analysis are stable for up to 4 years when stored at −80°C (118), but analyses were performed within 6 months.
The total lipid extracts from erythrocytes were isolated by mixture of chloroform/isopropanol (7:11, v/v) by the method of Rose and Oklander (119), with addition of 2,6-di-tert-butyl-4-methylphenol (BHT, 10 mg/100 mL) as an antioxidant. The separation of PL from other lipid subclasses was done on a silica thin-layer chromatography plate using the solvent system of petroleum ether, diethyl ether and glacial acetic acid (87:12:1, v/v/v). The development time for plates was 45 min, after which they were air dried for 15 min at room temperature in a fume hood situated in a dark place. The appropriate areas of PL fraction in silica gel were rapidly scraped into screw-capped glass tubes for transmethylation. Fatty acid methyl esters (FAME) were prepared as described previously (72, 120): 1.5 mL of hexane (with added BHT, 5 mg/100 mL) and 0.2 mL of 2 M NaOH in methanol were added and tubes were heated at 85°C for 1 h, than 0.2 mL of 1 M H2SO4 in methanol was added and tubes were heated at 85°C for 2 h. After cooling to room temperature and centrifugation on 1860× g, for 15 min, the hexane layer was dried under a stream of N2. Prepared FAME were dissolved in 20 μL of heptane, and 1 μL of sample was injected into the gas–liquid chromatograph (Shimadzu GC-2014, Shimadzu Co. Ltd, Kyoto, Japan), equipped with a flame ionization detector and Rtx 2,330 column (60 m × 0.25 mm ID, film thickness of 0.2 μm, RESTEK, Bellefonte, PA, USA), with a split ratio 20:1. The chromatographic conditions were: the flow of air was 320 mL/min, the flow of H2 was 30 mL/min and the flow of He (carrier gas) was 1 mL/min. The temperature of the flame ionization detector was 260°C and the temperature of the injection port was 220°C. The column initial temperature was 140°C, held for 5 min, then increased at a rate of 3°C/min to 220°C, which was kept for 20 min. The quality control samples were run before the study samples and after every 20 study samples. The identification of FAME (from C:16 to C:22) was made by comparing the sample peak retention times with the certified calibration standards mixtures (PUFA-2, Supelco, Bellefonte, PA, USA, and Supelco 37 FAMEs mix + C22:5n3 FAME, Sigma Chemical Co., St. Louis, MO, USA). Finally, individual FAs were expressed as a percentage of total identified FAs. The typical FAME chromatogram of our samples was presented in Supplementary Figure S1.
The activities of D9D, D6D and D5D were estimated from the product/precursor FAs ratios (D9D:16:1n-7/16:0; D6D:20:3n-6/18:2n-6; and D5D:20:4n-6/20:3n-6). As explained in the Introduction, since 18:1n-9 and 18:0 levels and their ratio can be more influenced by dietary intakes, we chose 16:1n-7/16:0 ratio for the estimation of D9D activity (21). Total saturated FAs (SFA) were defined as a sum of 16:0 and 18:0. Total monounsaturated FAs (MUFA) were defined as sum of 16:1n-7, 18:1n-9 and 18:1n-7. Total n-6 polyunsaturated FAs (PUFA) were defined as a sum of 18:2n-6, 20:3n-6, 20:4n-6 and 22:4n-6, while total n-3 PUFA were defined as a sum of 18:3n-3, 20:5n-3, 22:5n-3, and 22:6n-6. Omega 3 index (n-3 index) was calculated as a sum of 20:5n-3 and 22:6n-3 (121). The unsatisfactory n-3 index was defined as ≤4 (very low) and 4–6 (low), while satisfactory as 6–8 (moderate) and > 8 (optimal) (83). The unsatisfactory n-6/n-3 PUFA ratio was defined as >4 (122).
In accordance with the European Food Safety Authority (EFSA) EU Menu methodology (109), dietary intake data were obtained by a trained medical doctor using a food propensity questionnaire (FPQ) and the twice repeated 24 h-recall method, applying the validated national Food Atlas for Portion Size Estimation (123). The average intakes of energy and macronutrients (protein, carbohydrates, total fat, cholesterol, SFA, MUFA, PUFA and trans FA- TFA) were calculated from the 24 h-recalls, by using the DIET ASSESS & PLAN (DAP) software (124) and the Serbian Food Composition Database, which was developed in compliance with EuroFIR standards (125). Since we did not have a validated food frequency questionnaire (FFQ) for total fat and specific dietary fats intakes, we used the EPQ to estimate frequency of consumption of specific sources of dietary fats (particularly intakes of dairy products, meat and poultry, fish, specific edible fats and oils, nuts and seeds).
Statistical analyses were performed using the SPSS 22.0 (SPSS Inc., Chicago, IL, United States) statistical software. The normality of data distribution was tested by the Kolmogorov–Smirnov test. Data were presented as number and % (for nominal data), the mean ± SD (for normally distributed continuous data), and median and 25th and 75th percentiles (for non-normally distributed continuous data). Since majority of data were not normally distributed, logarithmic transformations (log 10) before statistical tests were performed, so the log-transformed data followed a normal distribution and allowed for the application of parametric statistical tests (126). Correlation between log-transformed data of FAs levels and desaturase activities with anthropometric and biochemical indicators of cardiometabolic risk, as well as daily energy and macronutrient intakes and possible confounders was assessed by the Pearson’s r correlation coefficients (to assess the associations between two continuous variables) and Point-Biserial rpb correlation coefficients (to assess the associations between one continuous and one dichotomous categorical variable). Partial correlations were used when one or more controlling variables were included in the analyses of correlation of FAs levels and desaturase activities with anthropometric, clinical, and biochemical indicators. The following controlling variables were proposed as covariates/confounders: age (in years), physical activity (inactive, low-moderately active, moderately active, high-moderately active, highly active), educational level (under high-school, high school, upper-high school, university, university post-graduate), current smoking (no or yes), moderate alcohol consumption (no or yes), and n-3 FAs and/or Zn supplements consumption (no or yes). Linear stepwise regression models were made to explore the strength and independence of associations between FAs levels and desaturase activities with anthropometric, clinical, and biochemical indicators of cardiometabolic risk, independent of nutritional intakes and other above-mentioned confounders. One-way ANOVA was used to compare desaturase activities and FAs levels among different nutritional status categories (classified by BMI). The homogeneity of variances was tested by the Levene test, and the Tukey’s honestly significant difference (HSD) or the Games Howell (G-H) post hoc tests were accordingly used. Stratified regression analyses were performed across separate BMI- quartiles. Locally weighted regression with the Epanechnikov kernel was applied to estimate the smoothed, non-parametric curve fitting (127). For all analyses, statistical significance was assumed at a two-tailed p < 0.05, but also the Bonferroni correction for multiple testing was applied (128).
The anthropometric, clinical, and biochemical characteristics of the studied population, as well correlations between anthropometric, clinical, biochemical, and general parameters are presented in Table 1 and Supplementary Table S1, respectively.
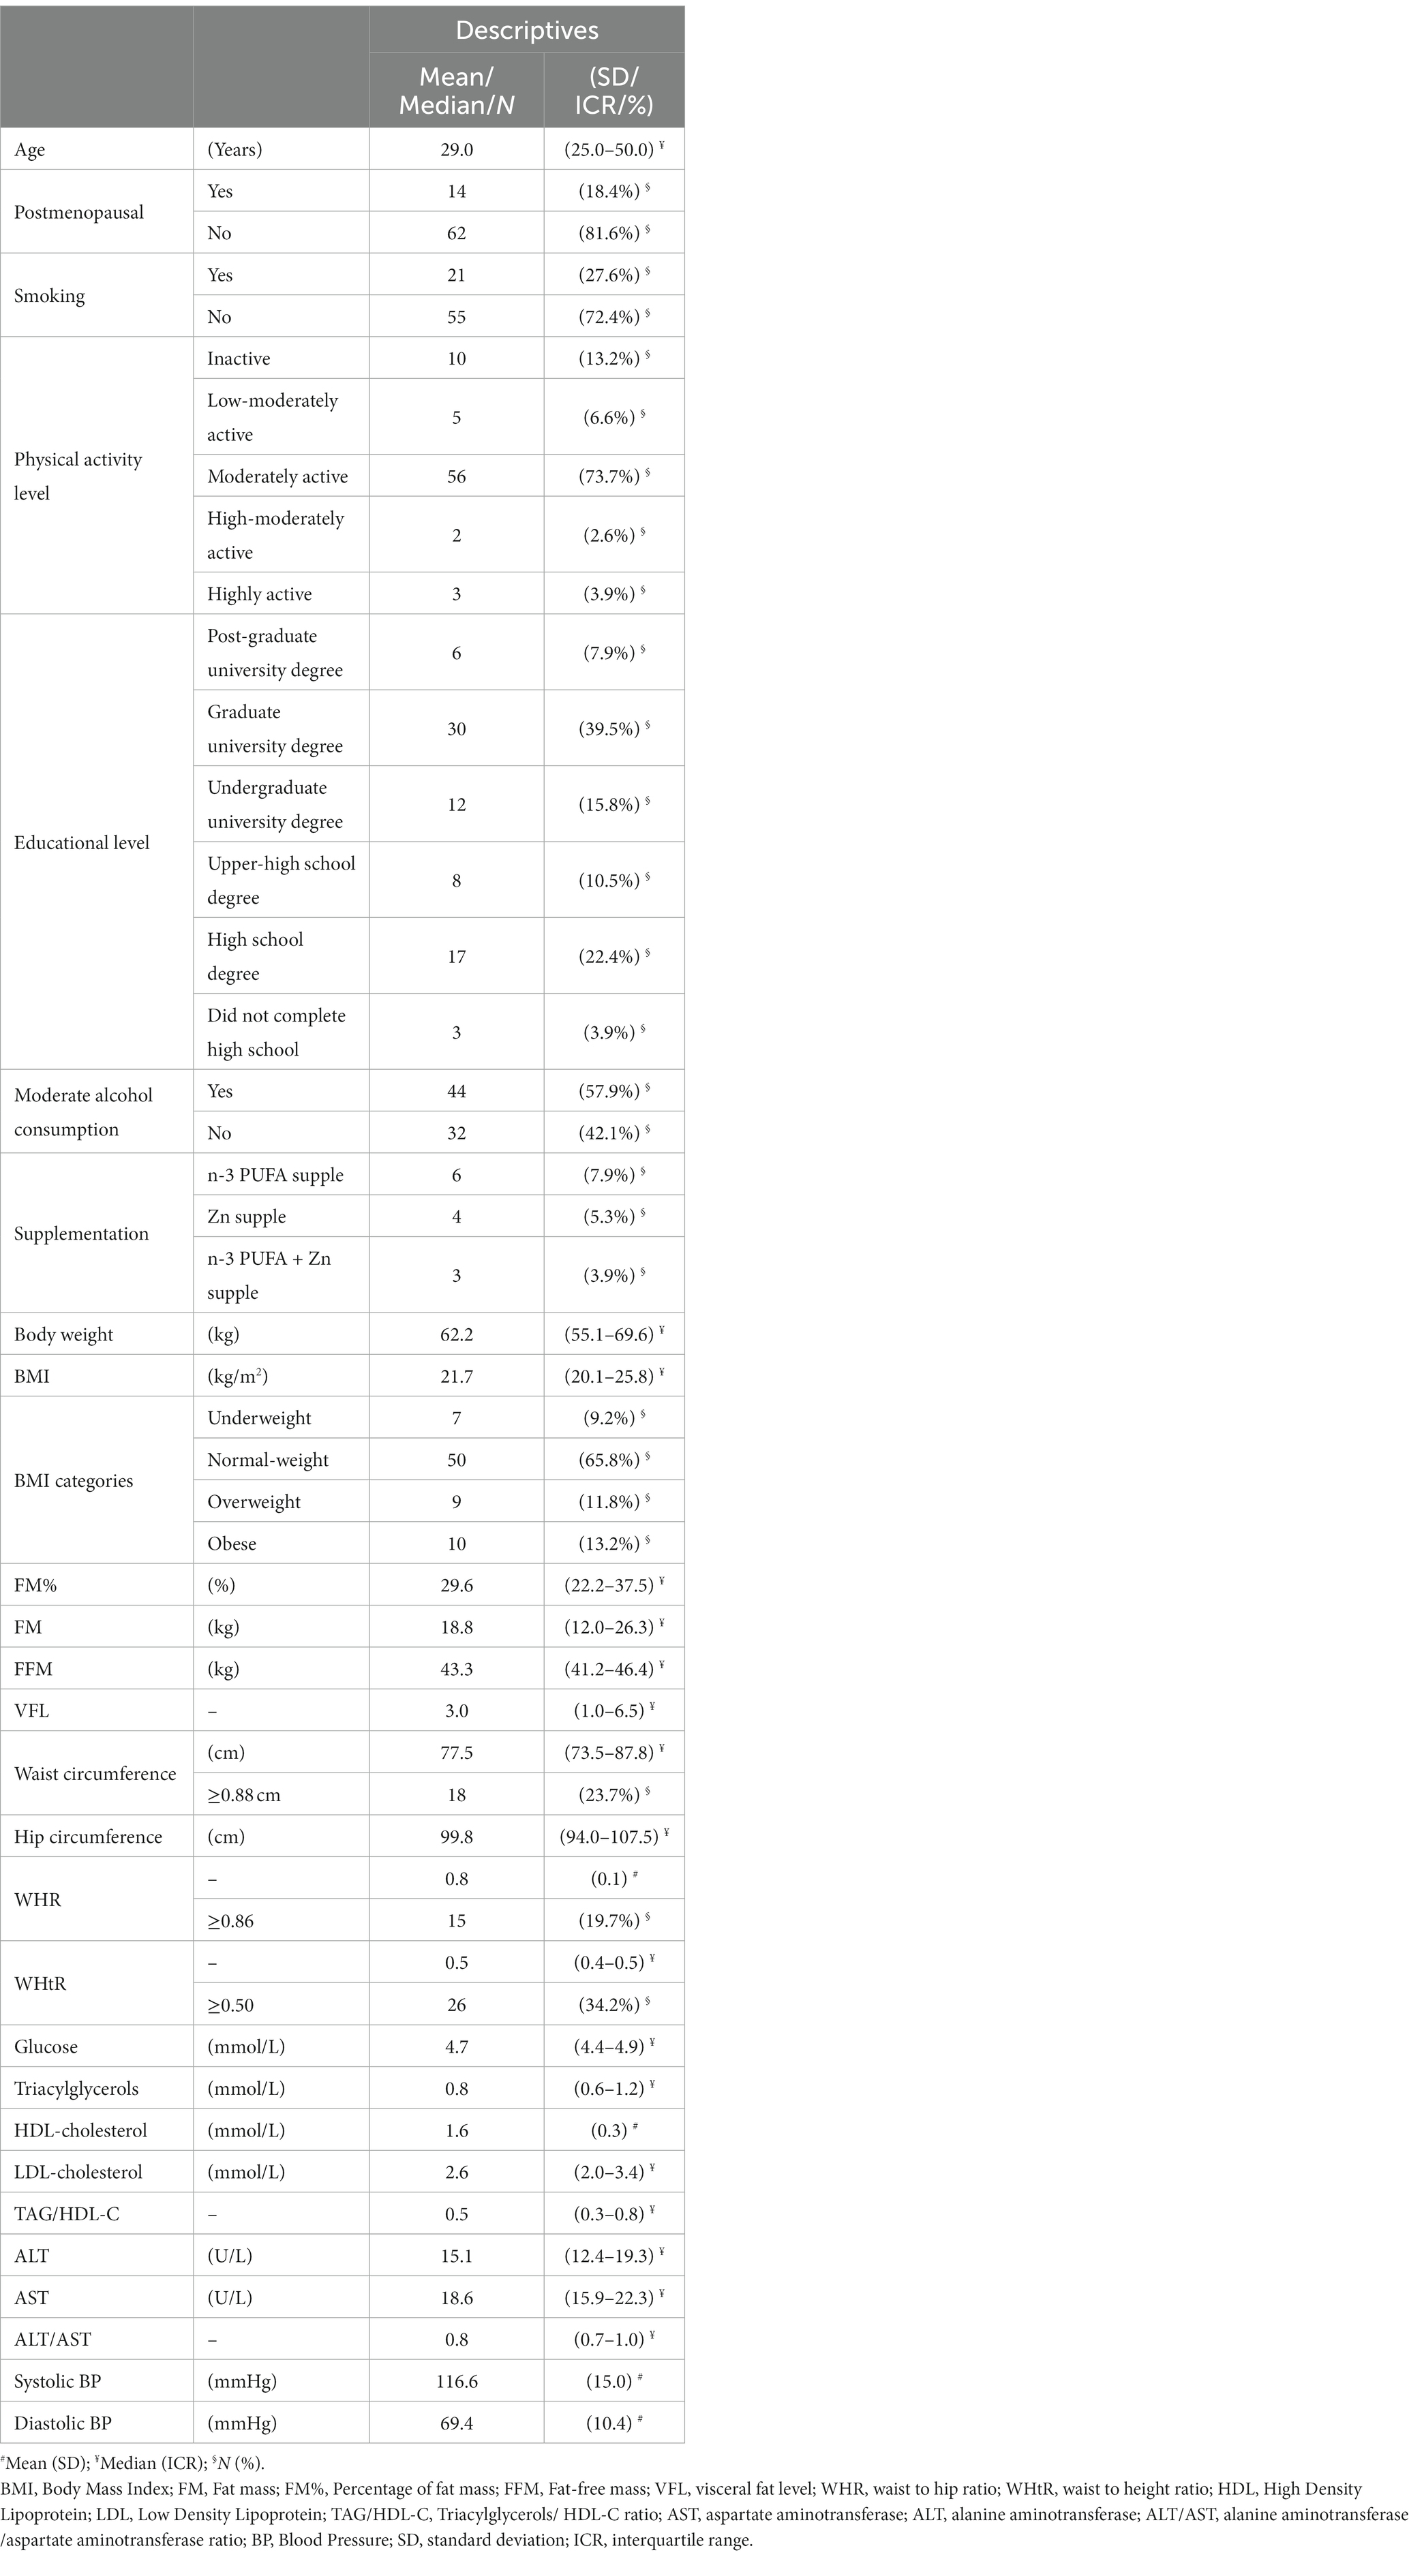
Table 1. Demographic, anthropometric, biochemical, and clinical (arterial BP) data of the studied women (N = 76).
The mean age in the cohort was 36.6 ± 13.5 years, but above half of the subjects (51.3%) were up to 30 years old. Postmenopausal women made less than 1/5 of the study sample, and none of them used HRT. The majority of the subjects had a graduate university or high school degree, and were classified as moderately active. Less than 1/3 of the subjects were current smokers, while moderate alcohol consumption was reported by 3/5 of the subjects, with all consuming maximum 1–2 times per week up to two units of alcoholic drinks (indicating low-moderate alcohol consumption in general). Omega-3, Zn or both supplements’ use was reported only by 13 subjects, and all of them only irregularly used these supplements (not every day), and in quite low doses (20:5n-3 + 22:6n-3 no more than 300 mg/day, and Zn no more than 15 mg/day) (Table 1).
Mean BMI was 23.6 ± 5.6 kg/m2, varying from 16.2 to 43.2 kg/m2. According to BMI, about 2/3 of the subjects were normal-weight, while 1/4 were overweight/obese, and less 1/10 than were underweight. According to WC and WHR, about 1/5 had centripetal obesity, but according to WHtR, about 1/3 were centripetally obese. Centripetal obesity was present in 1/5–1/3 of the subjects (depending on whether WC, WHR or WHtR were used as indicators). A relatively small percentage of the subjects had pre-hypertension/hypertension, IFG, decreased HDL-C and increased TAG levels, while MetS was observed in 1/5 of the subjects. The most prevalent among dyslipidemias was increased LDL levels (Table 1).
As expected, most biochemical and clinical cardiometabolic risk indicators were significantly positively correlated with anthropometric indices of general and centripetal adiposity, age, menopausal status and smoking, while were negatively correlated with education and physical activity (Supplementary Table S1). Since all anthropometric, biochemical, clinical, and general data were inter-correlated (Supplementary Table S1), they were included as possible confounders in further analyses.
In Table 2 are given descriptive data on FAs profiles (expressed as a percentage of total identified FAs in erythrocytes PL) and corresponding activities of desaturases. The presented laboratory data imply that the intake of n-3 FAs in the examined population was very low: only 4 (5.3%) of the subjects had satisfactory n-3 index (>6), while even 41 (53.9%) of the subjects had very low n-3 index (<4). Correspondingly, satisfactory n-6 /n-3 PUFA ratio was observed only in 2 (2.6%) of the subjects.
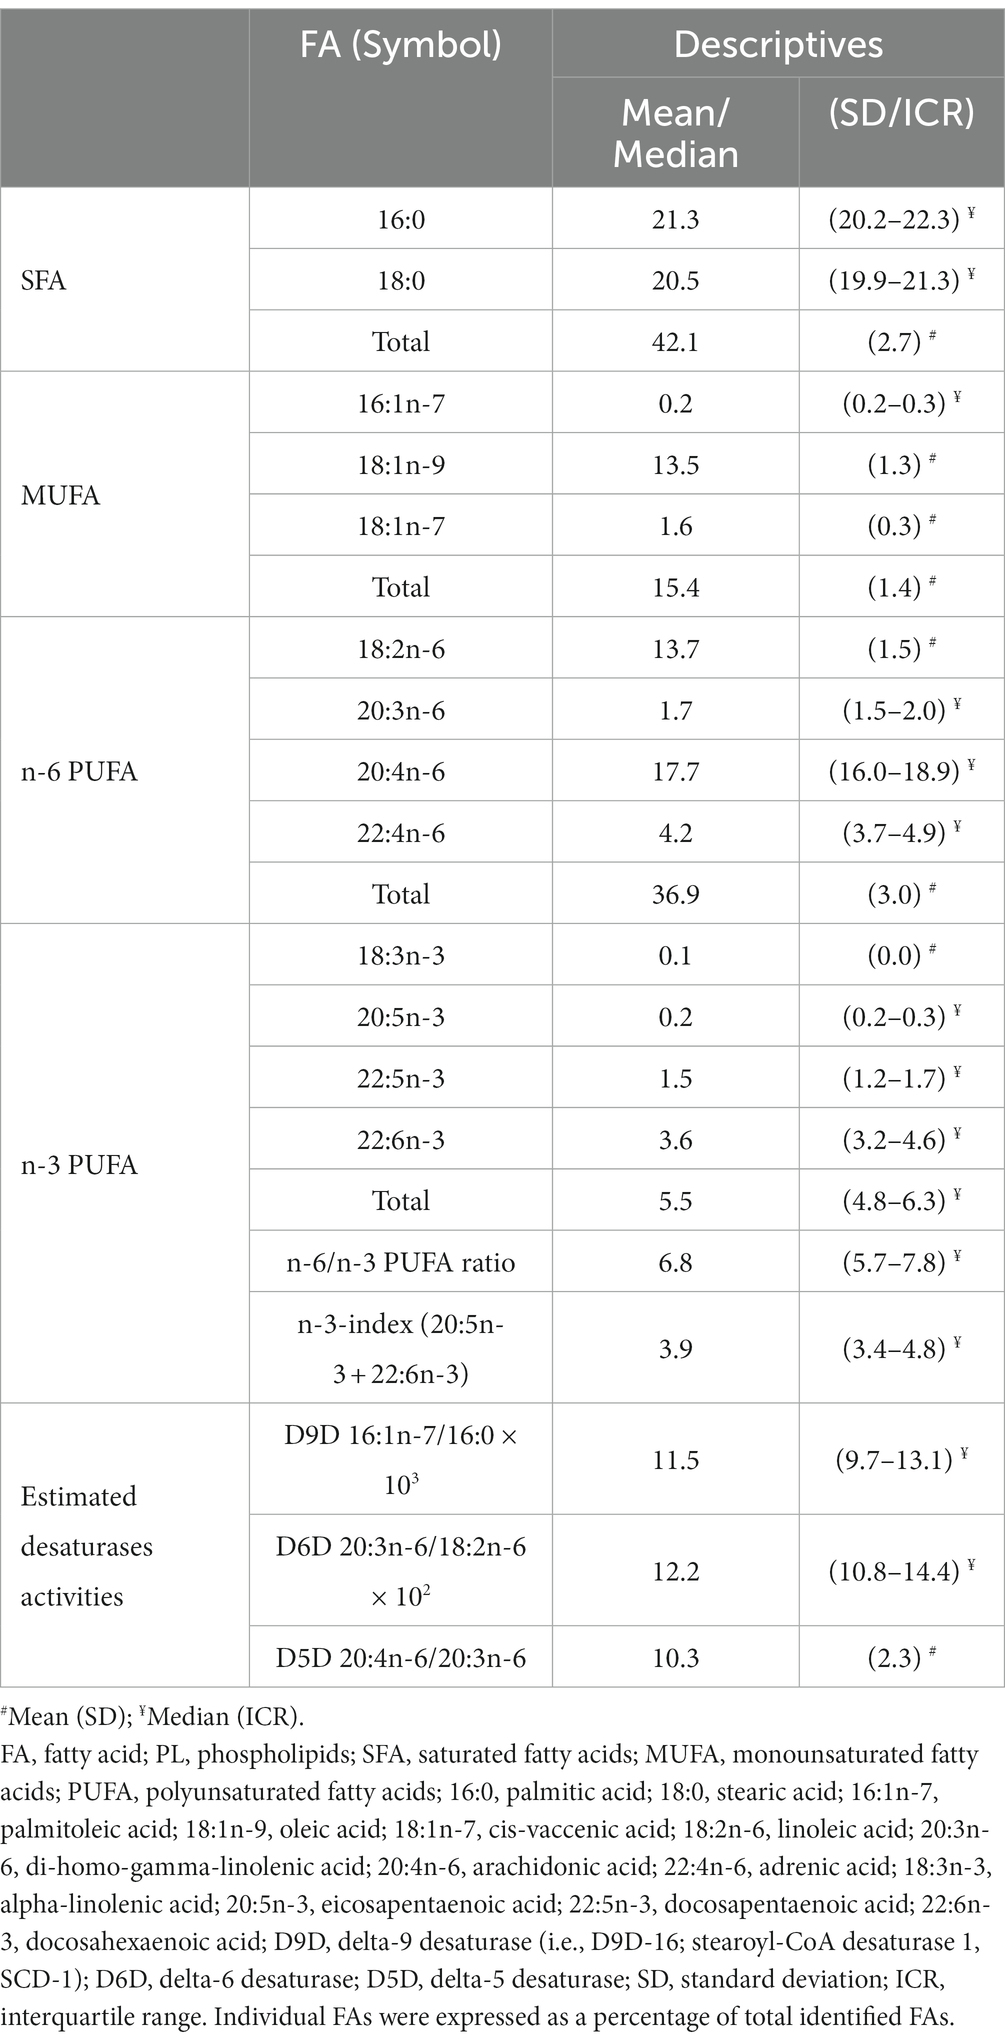
Table 2. Fatty acid profiles in erythrocytes PL analyzed by gas–liquid chromatography.
In Supplementary Table S2 are given inter-correlations of FAs profiles and activities of desaturases. Estimated activity of D5D was in significant negative inter-correlations with activities of D9D and D6D (r = −0.289, p < 0.05 and r = −0.626, p < 0.001, respectively), while activities of D9D and D6D were in a significant positive inter-correlation (r = 0.384, p < 0.001). The particularly strong negative inter-correlation between D6D and D5D activities remained significant even after multiple adjustments for BMI, age, smoking status, physical activity, educational level, moderate alcohol consumption and n-3 PUFA and Zn supplementation (r = −0.593, p < 0.001).
There was also a significant inter-correlation between different FAs (Supplementary Table S2). In general, both SFA (more) and MUFA (less) correlated negatively with proportions of n-6 (more) and n-3 PUFA (less). Pearson coefficients of SFA and MUFA correlations with n-6 PUFA were, respectively, r = −0.845 (p < 0.001) and r = −0.521 (p < 0.001), while with n-3PUFA were, respectively, r = −0.395 (p < 0.001) and r = −0.274 (p < 0.05). The adjustments for multiple confounders did not change these results. In fact, the correlation coefficients become even slightly higher: r = −0.857 (p < 0.001), r = −0.556 (p < 0.001), r = −0.397 (p < 0.001) and r = −0.282 (p < 0.05).
In Table 3 are presented correlations of FAs profiles and desaturase activities with general, anthropometric, clinical (BP) and biochemical parameters, before adjustment for confounders. In Table 4 are presented correlations of selected FAs (18:0, 16:1n-7, 20:3n-6 and 20:5n-3) and desaturase activities with clinical and biochemical parameters, after adjustment for confounders. As confounders were used: (1) Model 1 – only BMI; (2) Model 2 – BMI and age; (3) Model 3 – all confounders: BMI, age, educational level, smoking status, physical activity, moderate alcohol consumption, and n-3 PUFA and Zn supplementation (Note: due to high inter-correlation of postmenopausal status and age, postmenopausal status was not included in the Model 3 as a confounder, to avoid multicollinearity).
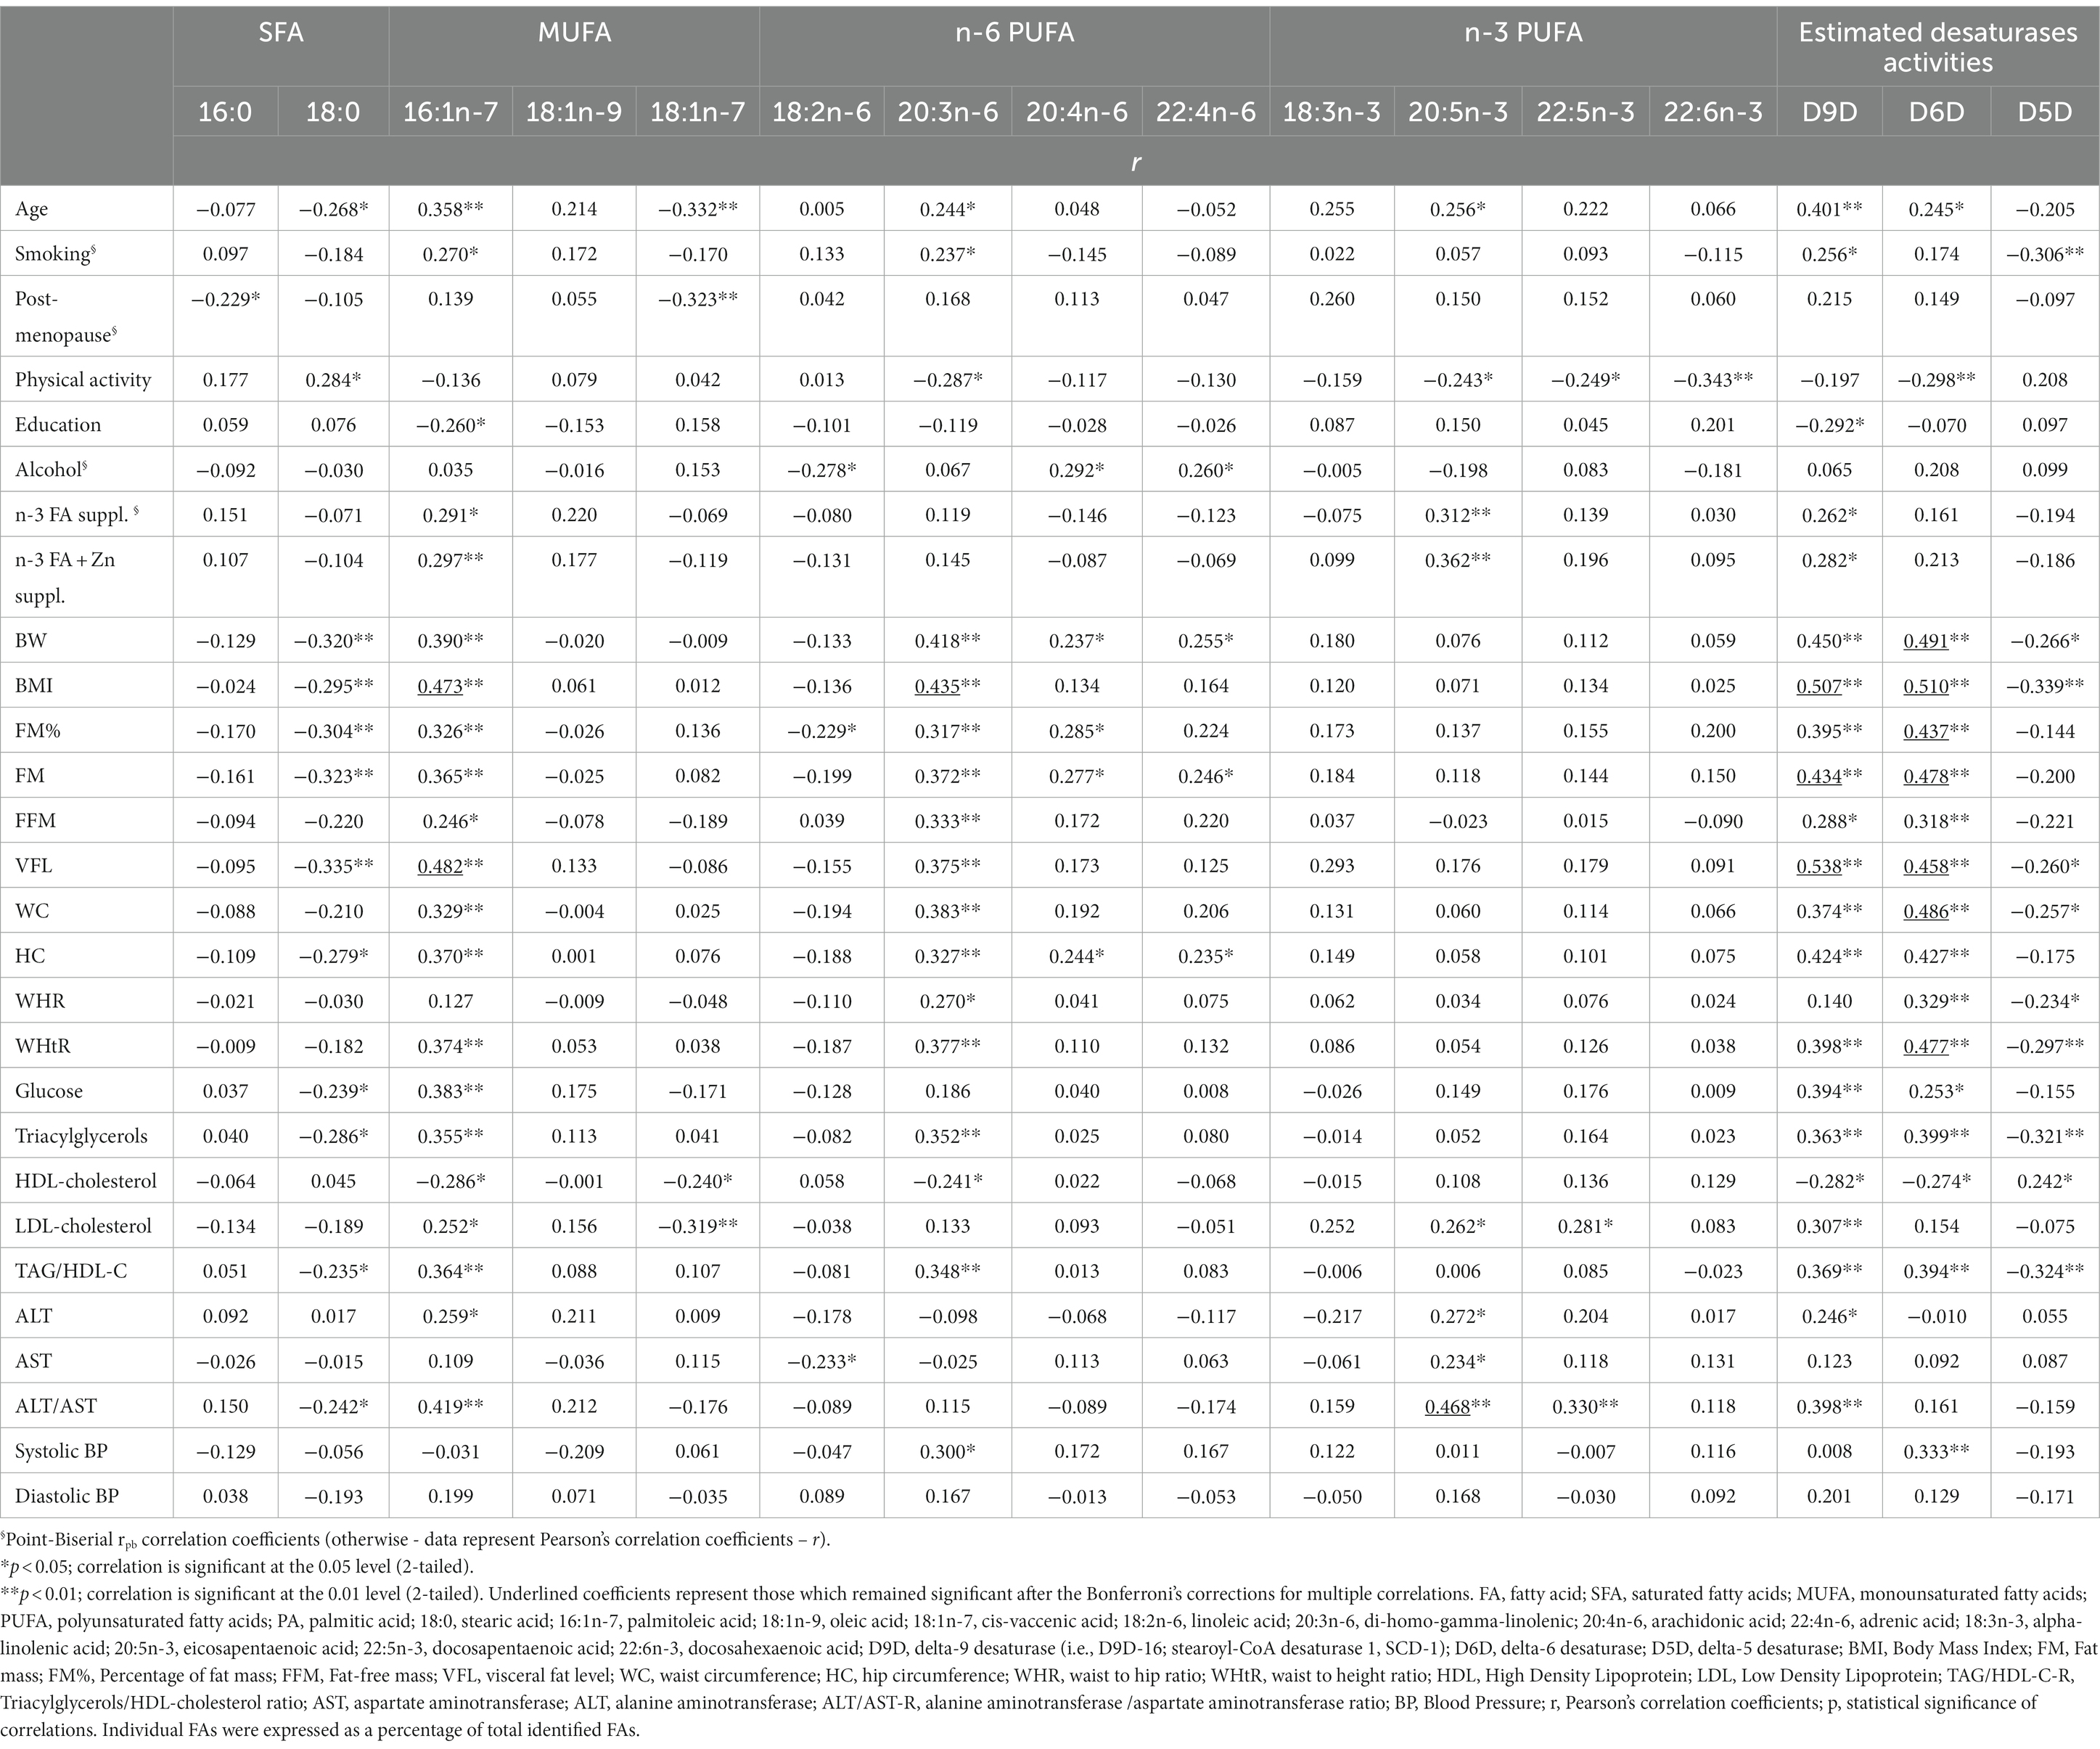
Table 3. Correlations of FAs profiles and desaturase activities with general, anthropometric, biochemical, and clinical (BP) parameters, without adjustment for confounders.
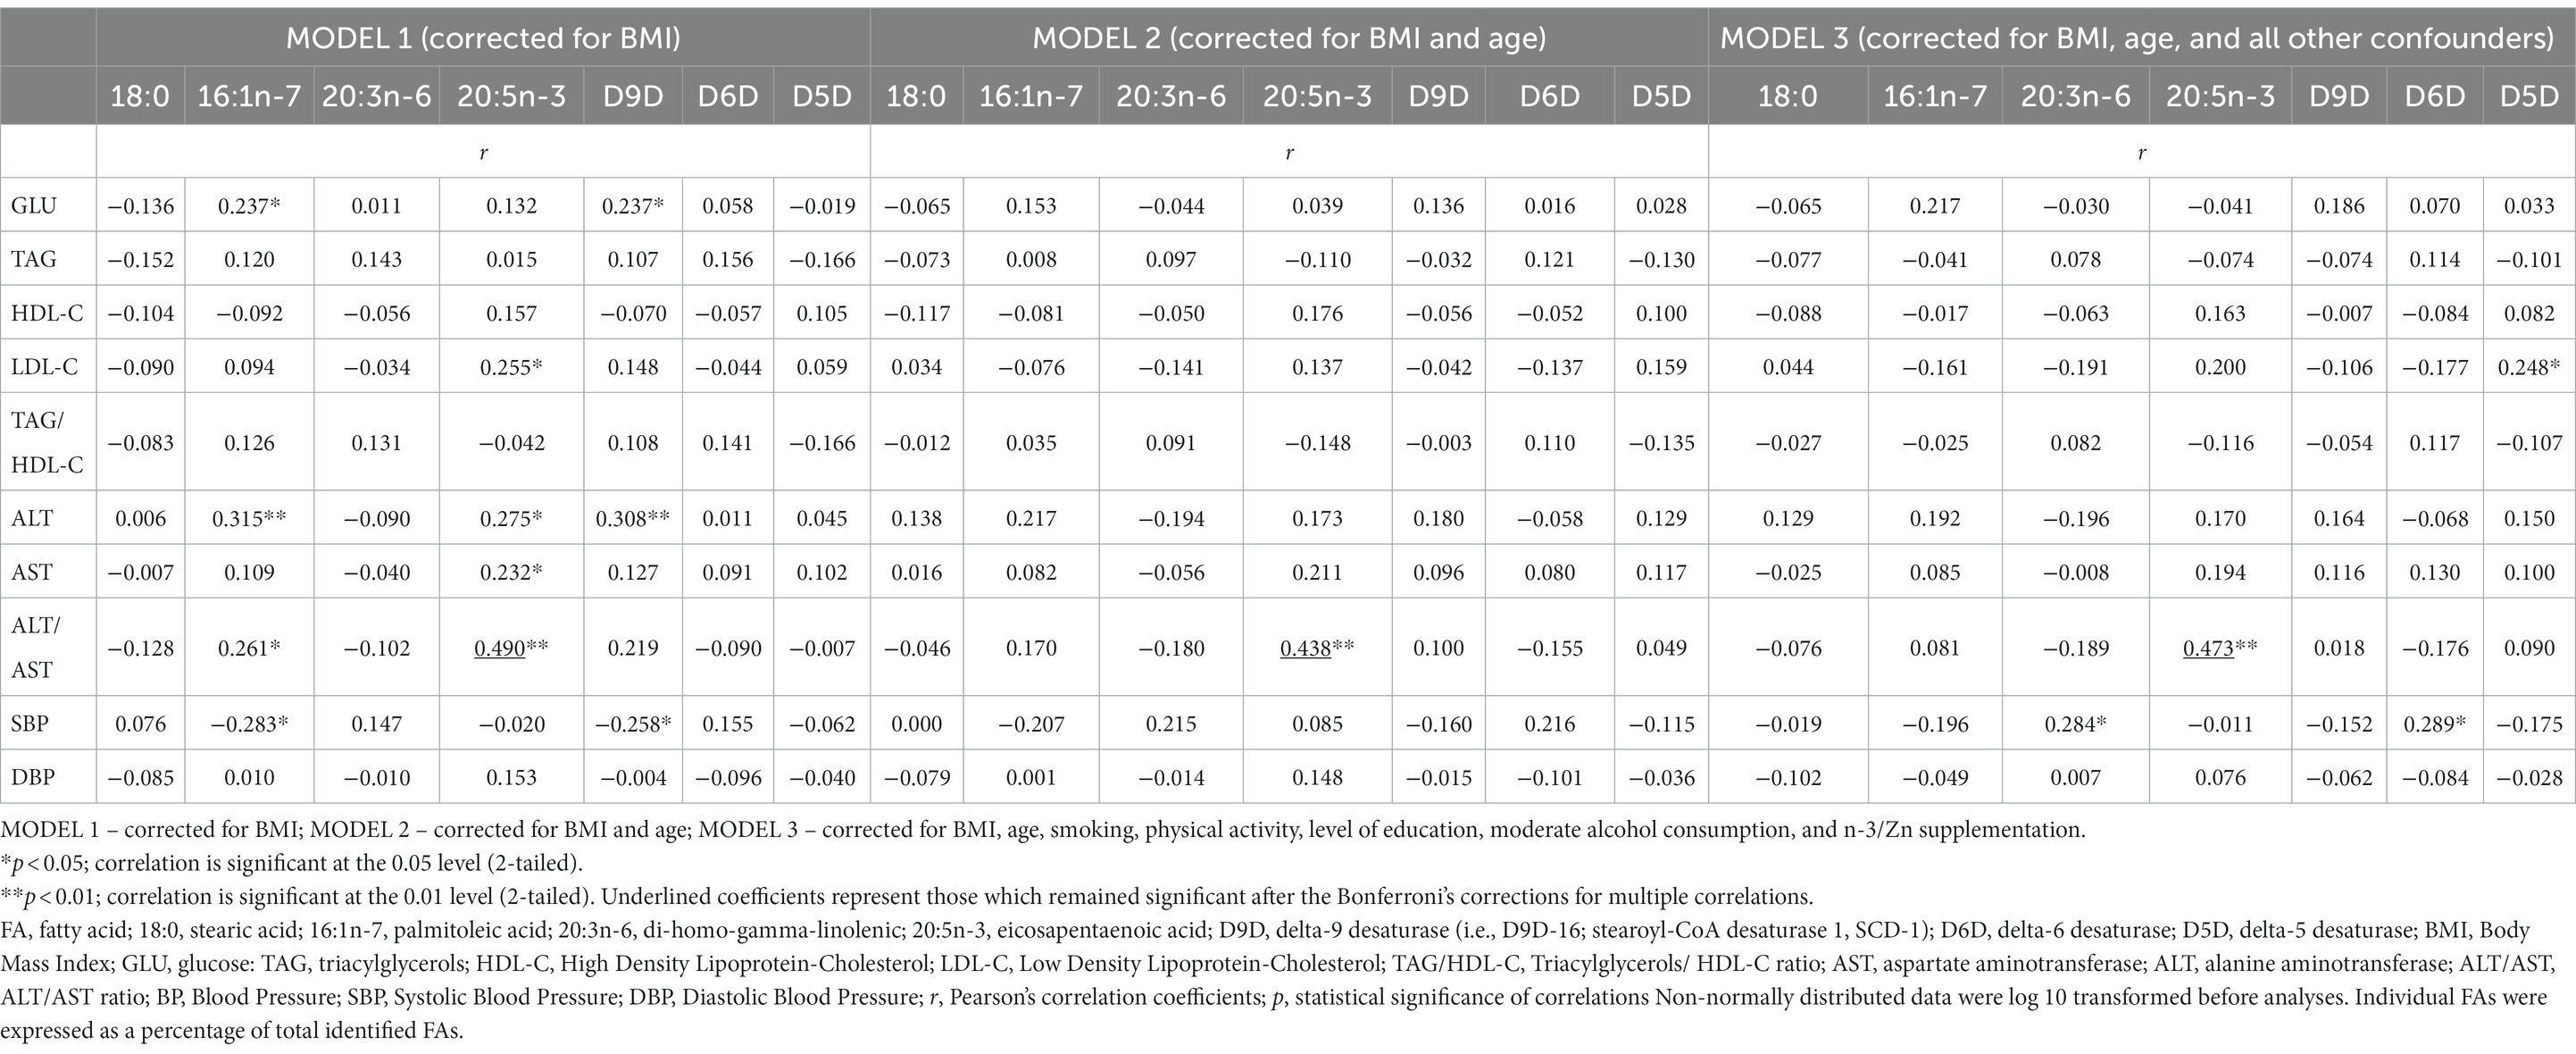
Table 4. Correlations of selected FAs (18:0, 16:1n-7, 20:3n-6 and 20:5n-3) and desaturase activities with biochemical and clinical (BP) parameters, after adjustment for BMI and all other confounders.
According to Table 3, the levels of 16:1n-7 were in positive correlations with age, smoking, n-3, and n-3/Zn supplementation, all measures of adiposity (BMI, FM, %FM, VFL, WC, HC and WHtR), levels of GLU, TAG, LDL-C, ALT and ratios of TAG/HDL-C and ALT/AST, and in negative correlation with HDL-C and level of education. Similarly, the levels of 20:3n-6 were in positive correlations with age, smoking, all measures of adiposity and centripetal fat distribution (BW, BMI, FM, %FM, VFL, WC, HC, WHR and WHtR), SBP, levels of TAG and ratio of TAG/HDL-C, and in negative correlation with HDL-C and physical activity level. In contrast, the levels of 18:0 were in negative correlations with age, all measures of adiposity (excluding measures of centripetal fat distribution: WC, WHR and WHtR), levels of GLU, TAG and ratios of TAG/HDL-C and ALT/AST, and positive correlation with the level of physical activity. Some anthropometric indices of adiposity were also in positive correlations with levels of 20:4n-6 and 22:4n-6 (BW, FM, FM%, HC, with 20:4n-6; BW, FM, HC, with 22:4n-6), while levels of 18:3n-3 were in negative correlation with FM%. Moderate alcohol consumption was in positive correlation with 20:4n-6 and 22:4n-6, and negative correlation with 18:3n-3. Proportions of 20:5n-3 were in significant positive correlation with age, n-3 PUFA and n-3 PUFA/Zn supplementation, LDL-C, ALT, AST and ALT/AST ratio, in negative correlation with physical activity level. Also, proportions of 22:5n-3 were in positive correlation with LDL-C and ALT/AST ratio, as well as in negative correlation with physical activity level. The proportions of 22:6n-3 were in negative correlation with physical activity level (no other correlations were found). Cis–vaccenic acid (18:1n-7) was in negative correlation with age, postmenopausal status, LDL-C and HDL-C, while 16:0 was only in negative correlation with postmenopausal status.
The estimated activities of D9D and D6D were in positive correlations with age, almost all measures of adiposity and centripetal fat distribution (except WHR with D9D), levels of GLU, TAG, ratio TAG/HDL-C, and in negative with HDL-C. In addition, D9D activity was also in positive correlation with ALT, ALT/AST ratio, and n-3 PUFA and n-3 PUFA/Zn supplementation and negative correlation with level of education, while D6D activity was in positive correlation with SBP and negative with physical activity. In contrast, the activity of D5D was in negative correlations with measures of adiposity and centripetal fat distribution (except FM, %FM, and HC), levels of TAG and ratio TAG/HDL-C, smoking, and in positive correlation with HDL-C.
After applying the Bonferroni’s corrections for multiple correlations (which established statistical significance at p < 0.00012), there remained significant only correlations of 16:1n-7 with BMI and VFL, correlations of 20:3n-6 with BMI, correlations of D9D with BMI, FM, VFL, correlations of D6D with BMI, FM, FM%, VFL, WC and WHtR, as well as correlations of 20:5n-3 with ALT/AST (Table 3).
The corrections for BMI (Model 1) and BMI and age (Model 2) annulled the significance for all of the above-mentioned correlations of FAs profiles and desaturase activities with clinical and biochemical markers of cardiometabolic risk (SBP, GLU, TAG, HDL-C, LDL-C, TAG/HDL-C, ALT, ALT/AST) except for correlations of 20:5n-3 with ALT/AST ratio (Table 4). Further adjustments for other significant confounders (Model 3) did not significantly change these results, even though D5D and 20:3n-6 started to positively correlate with SBP, and D5D started to positively correlate with LDL-C. However, the Bonferroni’s corrections for multiple correlations (which established statistical significance at p < 0.00036) annulled significance of these correlations, and only correlations of 20:5n-3 with ALT/AST ratio remained significant (r = 0.473, p = 0.00006). The positive association of 20:5n-3 levels with ALT/AST ratio remained significant even after additional controlling for n-3 PUFA dietary intakes and fish intake and all other above-mentioned confounders, including n-3 PUFA supplementation (r = 0.474, p = 0.00013), or when subjects with n-3 PUFA or n-3 PUFA/Zn supplements use were excluded from the analysis (r = 0.520, p = 0.00007, and r = 0.511, p = 0.00015, respectively).
Very similar results were obtained when corrections were performed with FM, FM% VFL (Supplementary Table S3), or WC, HC, WHtR (Supplementary Table S4) as measures of adiposity instead of BMI, only that after multiple adjustments, apart from correlations of 20:5n-3 with ALT/AST, there also remained significant positive correlations of 20:3n-6 and D6D with SBP, and positive correlations of 16:1n-7 with GLU (but the later not in case when we controlled for VFL or HC). However, the Bonferroni’s corrections for multiple correlations (which established statistical significance at p < 0.00036) again annulled significance of these correlations, except for 20:5n-3 with ALT/AST ratio (Supplementary Tables S3, S4).
The findings of unsatisfactory n-3 index and n-6/n-3 PUFA ratio in erythrocytes PL were in accordance with the data obtained by FPQ, indicating very low consumption of fish, nuts and oils rich in n-3 FAs. Fish was consumed less than once per week by 73.7% of the subjects, while 18.4% of the subjects consumed fish even less than once per month. The majority of the studied subjects (56.6%) did not consume frequently nuts and seeds (i.e., consumed less than once per week). Only two participants consumed food (soft-margarines) enriched with n-3 FAs. The majority of the participants consumed refined sunflower oil for cooking and salads (88.2%), while olive oil was regularly used (more than 5 times per week) by 43.4% of the subjects, mostly only for salads, rarely for cooking. Other oils were very rarely used (by 13.2% of the subjects): grape seed, corn, palm, and coconut oil, while only two participants used plant oils which are rich in n-3 FAs (flaxseed and rapeseed oil). Pork lard was at least sometimes used for cooking by 53.9% of the subjects, with 22.3% of the subjects reporting very frequent use (2–3 times per week or more). Interestingly, the level of education was in negative association with use of pork lard and sunflower oil, and in positive association with use of olive oil and other oils (data not shown). Very frequent use of full-fat dairy products (more than 5 times per week) was reported by all subjects, very frequent (more than 5 times per week) consumption of red meat and poultry (and related products) was reported by 88.2% of the subjects. Therefore, the main sources of FAs in the diet were dairy products, meat and poultry, sunflower oil, and in some cases olive oil and pork lard. This indicates one diet rich in SFA, MUFA and n-6 PUFA, and very poor in n-3 PUFA (i.e., typical “western diet”).
In line with that, according to data from 24 h-recalls, fat contributed the most to total energy intake. About 2/3 of participants (64.5%) consumed more than 40% of energy as fat in their diet, and more than 1/2 of participants (51.3%) consumed less than 40% of energy in the form of carbohydrates, indicating a high-fat/low-carbohydrate dietary pattern. Particularly SFA intakes dominated, while intakes of MUFA and PUFA were lower. Omega-3 FAs intakes were negligible (Table 5).
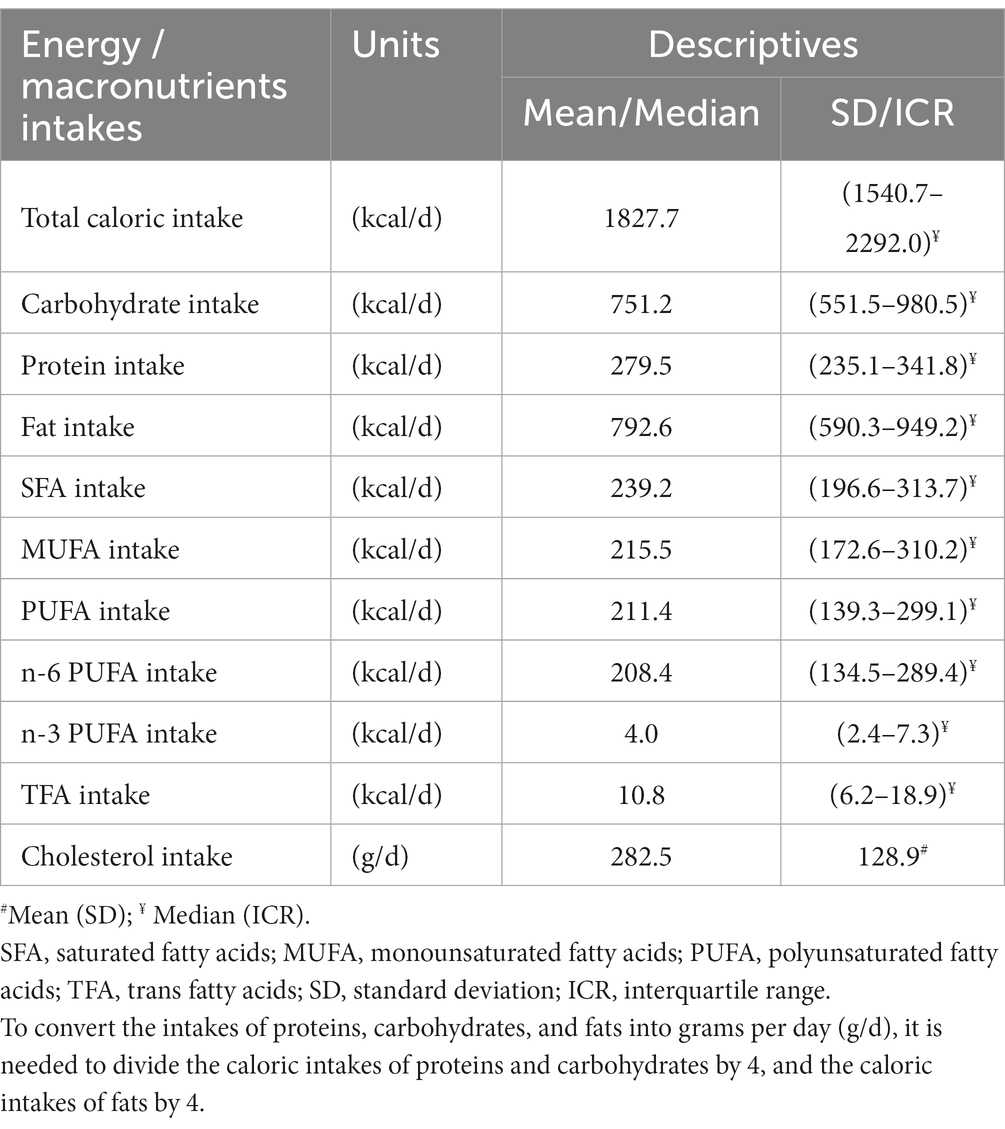
Table 5. Nutritional intakes of macronutrients, according to 24 h-recalls data.
Interestingly, after multiple adjustments for all possible confounders (BMI, age, smoking, physical activity, alcohol consumption, educational level and n-3 PUFA and Zn supplements use), activities of desaturases did not show significant correlations with macronutrient intakes, except for protein intake with D5D activity (r = 0.372, p < 0.01). Regarding examined FAs, protein intake was negatively associated with 20:3n-6 (r = −0.328, p < 0.05), 20:5n-3 was positively associated with MUFA, n-3 PUFA, total fat and protein intake (r = 0.398, r = 0.356, p < 0.01, and r = 0.280, r = 0.273, p < 0.05, respectively), while 16:0 was negatively associated with n-6 and positively associated with n-3 PUFA intakes (r = −0.289 and r = 0.265, respectively, p < 0.05). Nevertheless, the Bonferroni’s corrections for multiple correlations (which established statistical significance at p < 0.00018) annulled significance of all these correlations. No other significant associations were found.
The stepwise models for prediction of proportions of 16:1n-7, 18:0, 20:3n-6, 20:5n-3 and desaturase activities included as predictors: BMI, age, postmenopausal status, smoking, physical activity, moderate alcohol intake, educational level, n-3 PUFA and Zn supplementation, and dietary total energy intakes (in kcal/d), intakes of carbohydrates, proteins, total fats, SFA, MUFA, n-6 PUFA, n-3 PUFA, TFA and cholesterol (in g/d).
The stepwise regression models (Table 6) revealed that significant predictors for 18:0, 16:1n-7, 20:3n-6 and 20:5n-3 were (respectively): BMI (negative); BMI and age (positive); BMI (positive); dietary intakes of n-3 PUFA and n-3 PUFA and Zn supplementation. Significant predictors for D9D, D6D and D5D were (respectively): BMI and age (positive); BMI (positive); BMI and smoking (negative). However, the models explained only a small percentage of the depended variables variation, less than 30% (R2 adjusted), which indicates that some other factors (including genetics) significantly contribute (Table 6). In almost all of the mentioned regression analyses (except for 20:5n-3), BMI was the most significant predictor (Table 6). When only BMI was included in regression models (Supplementary Table S5), for all examined FAs and desaturases it was a significant predictor (again, except for 20:5n-3), and it explained up to 25% of their variance (the most significantly for D6D, D9D, 16:1n-7 and 20:3n-6).
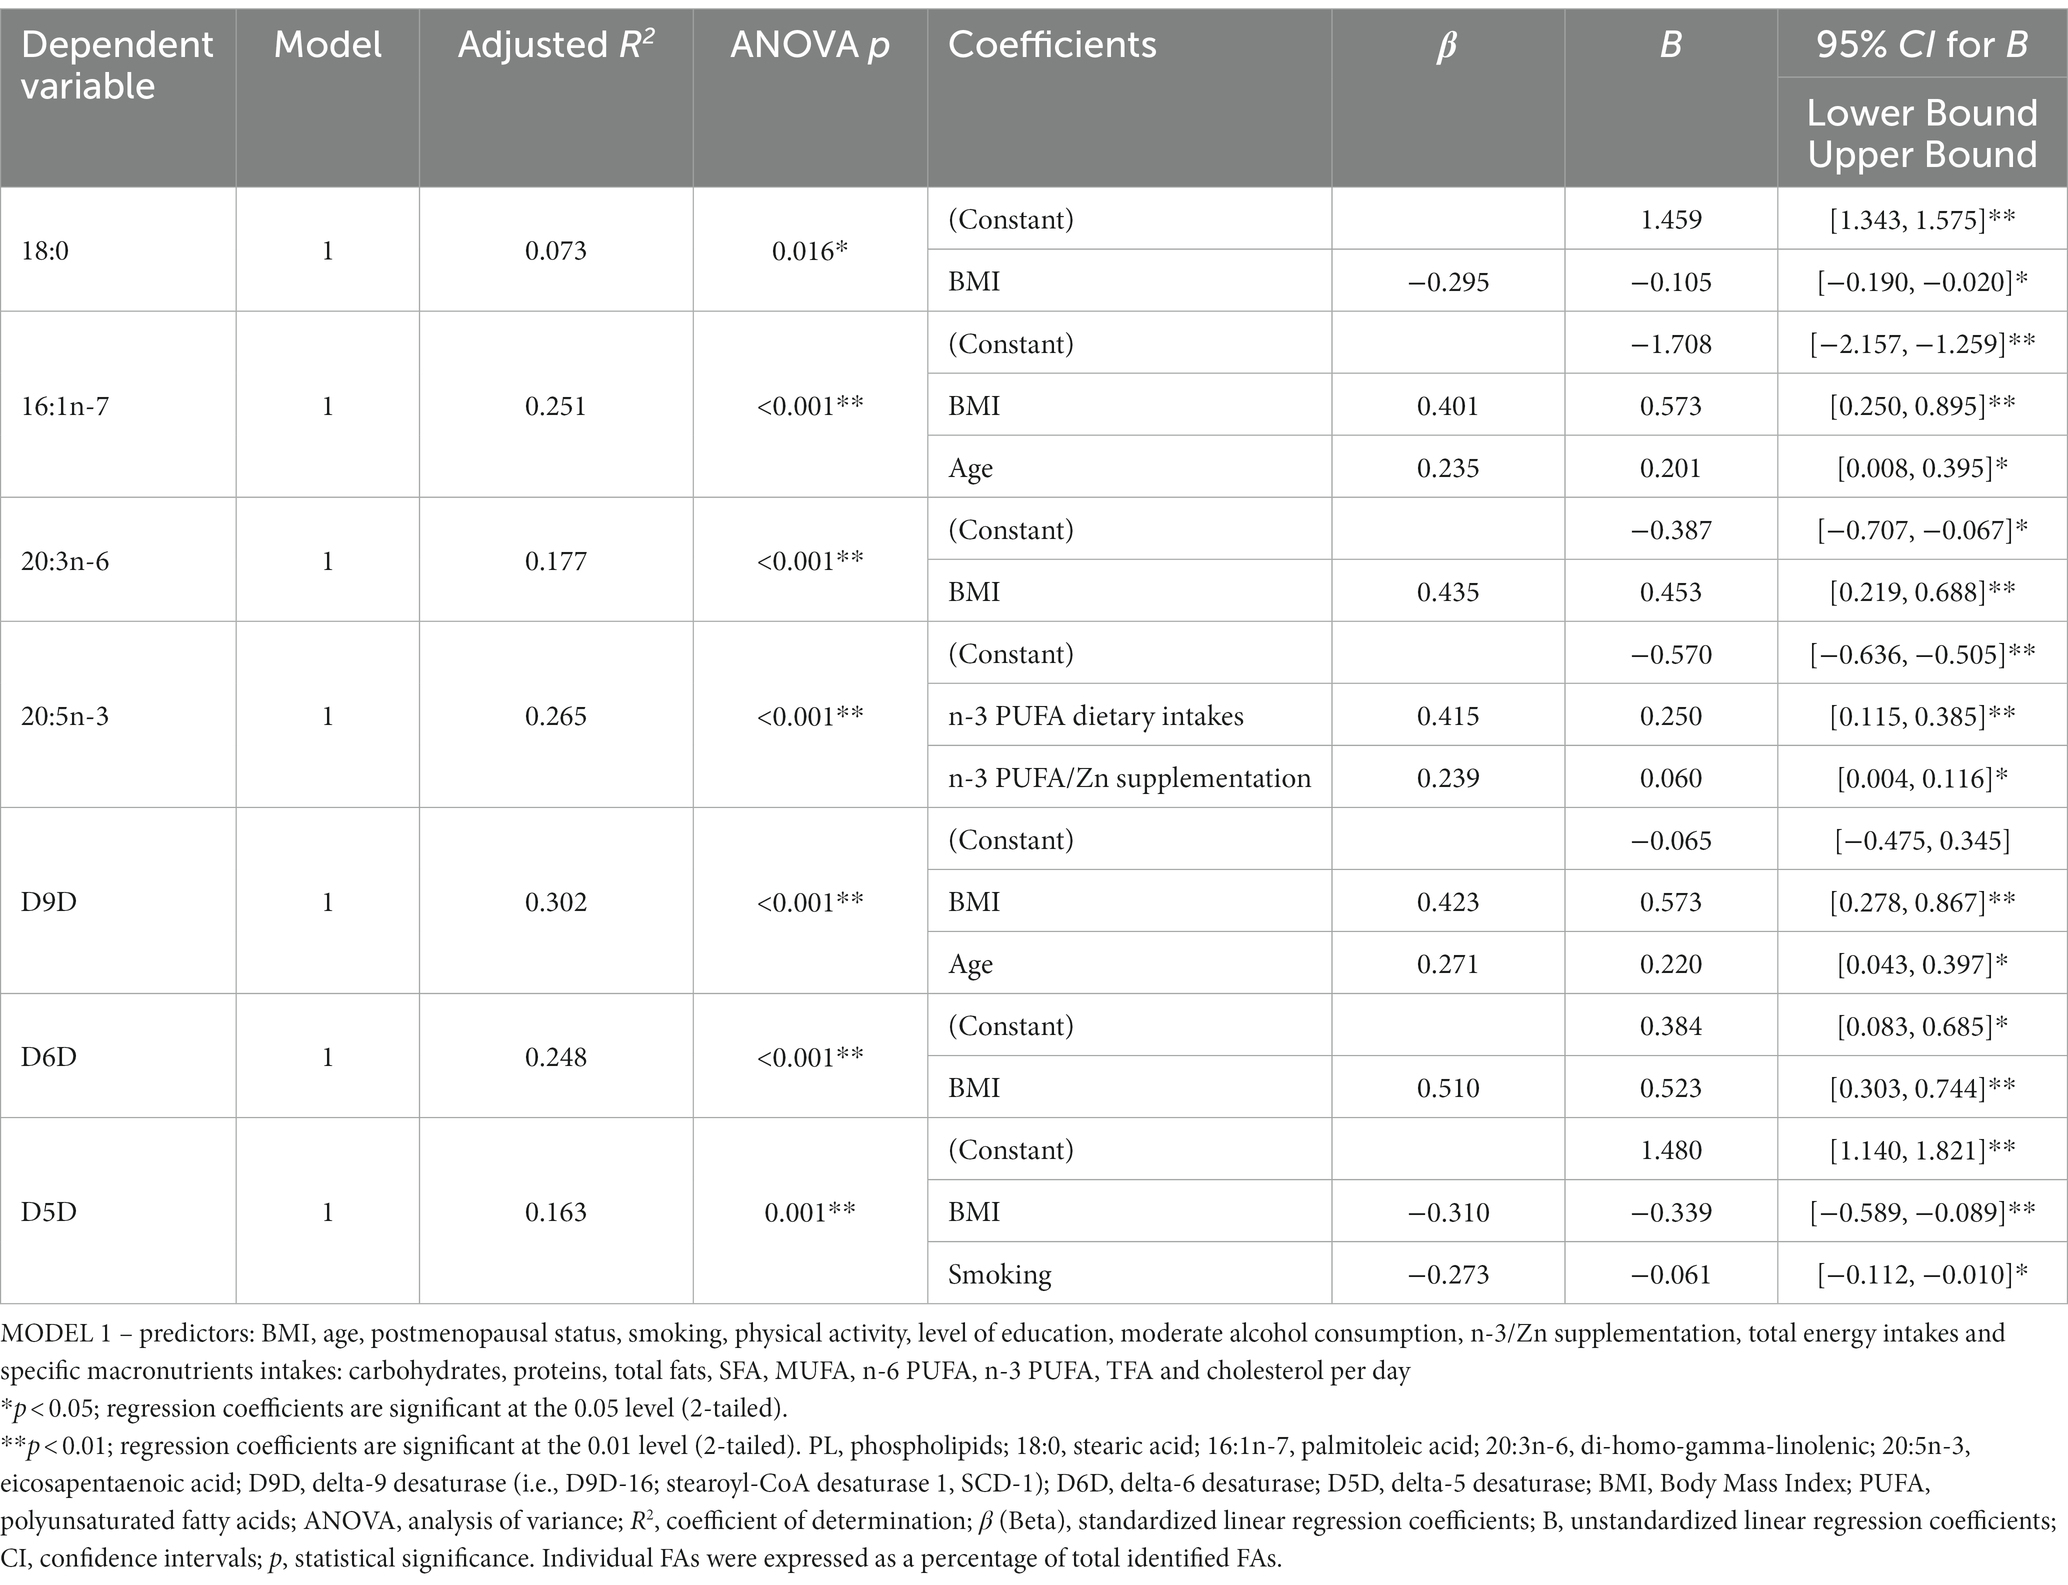
Table 6. Linear (stepwise) regression models for prediction of proportions of 18:0, 16:1n-7, 20:3n-6, 20:5n-3 and desaturase activities in erythrocytes PL.
The proportions of 20:4n-6 were not predicted by BMI (data not shown), but were significantly predicated by the model which included the 18:2n-6 content and estimated activities of D6D and D5D, R2 adjusted =1.000 (Supplementary Table S6).
In order to confirm the associations of FAs profiles and desaturase activities with indicators of cardiometabolic risk, we performed regression analyses in the opposite way: FAs profiles and desaturase activities were placed as predictors (with all other possible confounders, including age, postmenopausal status, smoking, physical activity, educational level, all dietary data and supplements use), while dependent variables were anthropometric, clinical and biochemical indicators of cardiometabolic risk. For biochemical indicators and BP, as predictors were included also anthropometric parameters.
Desaturase activities (particularly D9D and D6D) together with physical activity and age, significantly predicted anthropometric measures (BMI, FM, FM%, VFL, WC, HC, WHR and WHtR), while reported nutritional intakes, postmenopausal status, smoking and educational level did not have significant influence (Table 7). In contrast, the examined clinical and biochemical indicators of cardiometabolic risk were not predicted by desaturases activities, nor by selected FAs profiles, except for ALT (which was negatively predicted by 18:3n-3 and positively with age) and ratio ALT/AST (which was positively predicted by 20:5n-3, 16:1n-7 and VFL) (Supplementary Table S7). This remained significant also when subjects with n-3 PUFA supplementation were excluded from analyses (data not shown). All other biochemical data (as well as BP) were predicted mostly by anthropometric data (particularly measures of centripetal and visceral adiposity), less by age (Supplementary Table S7).
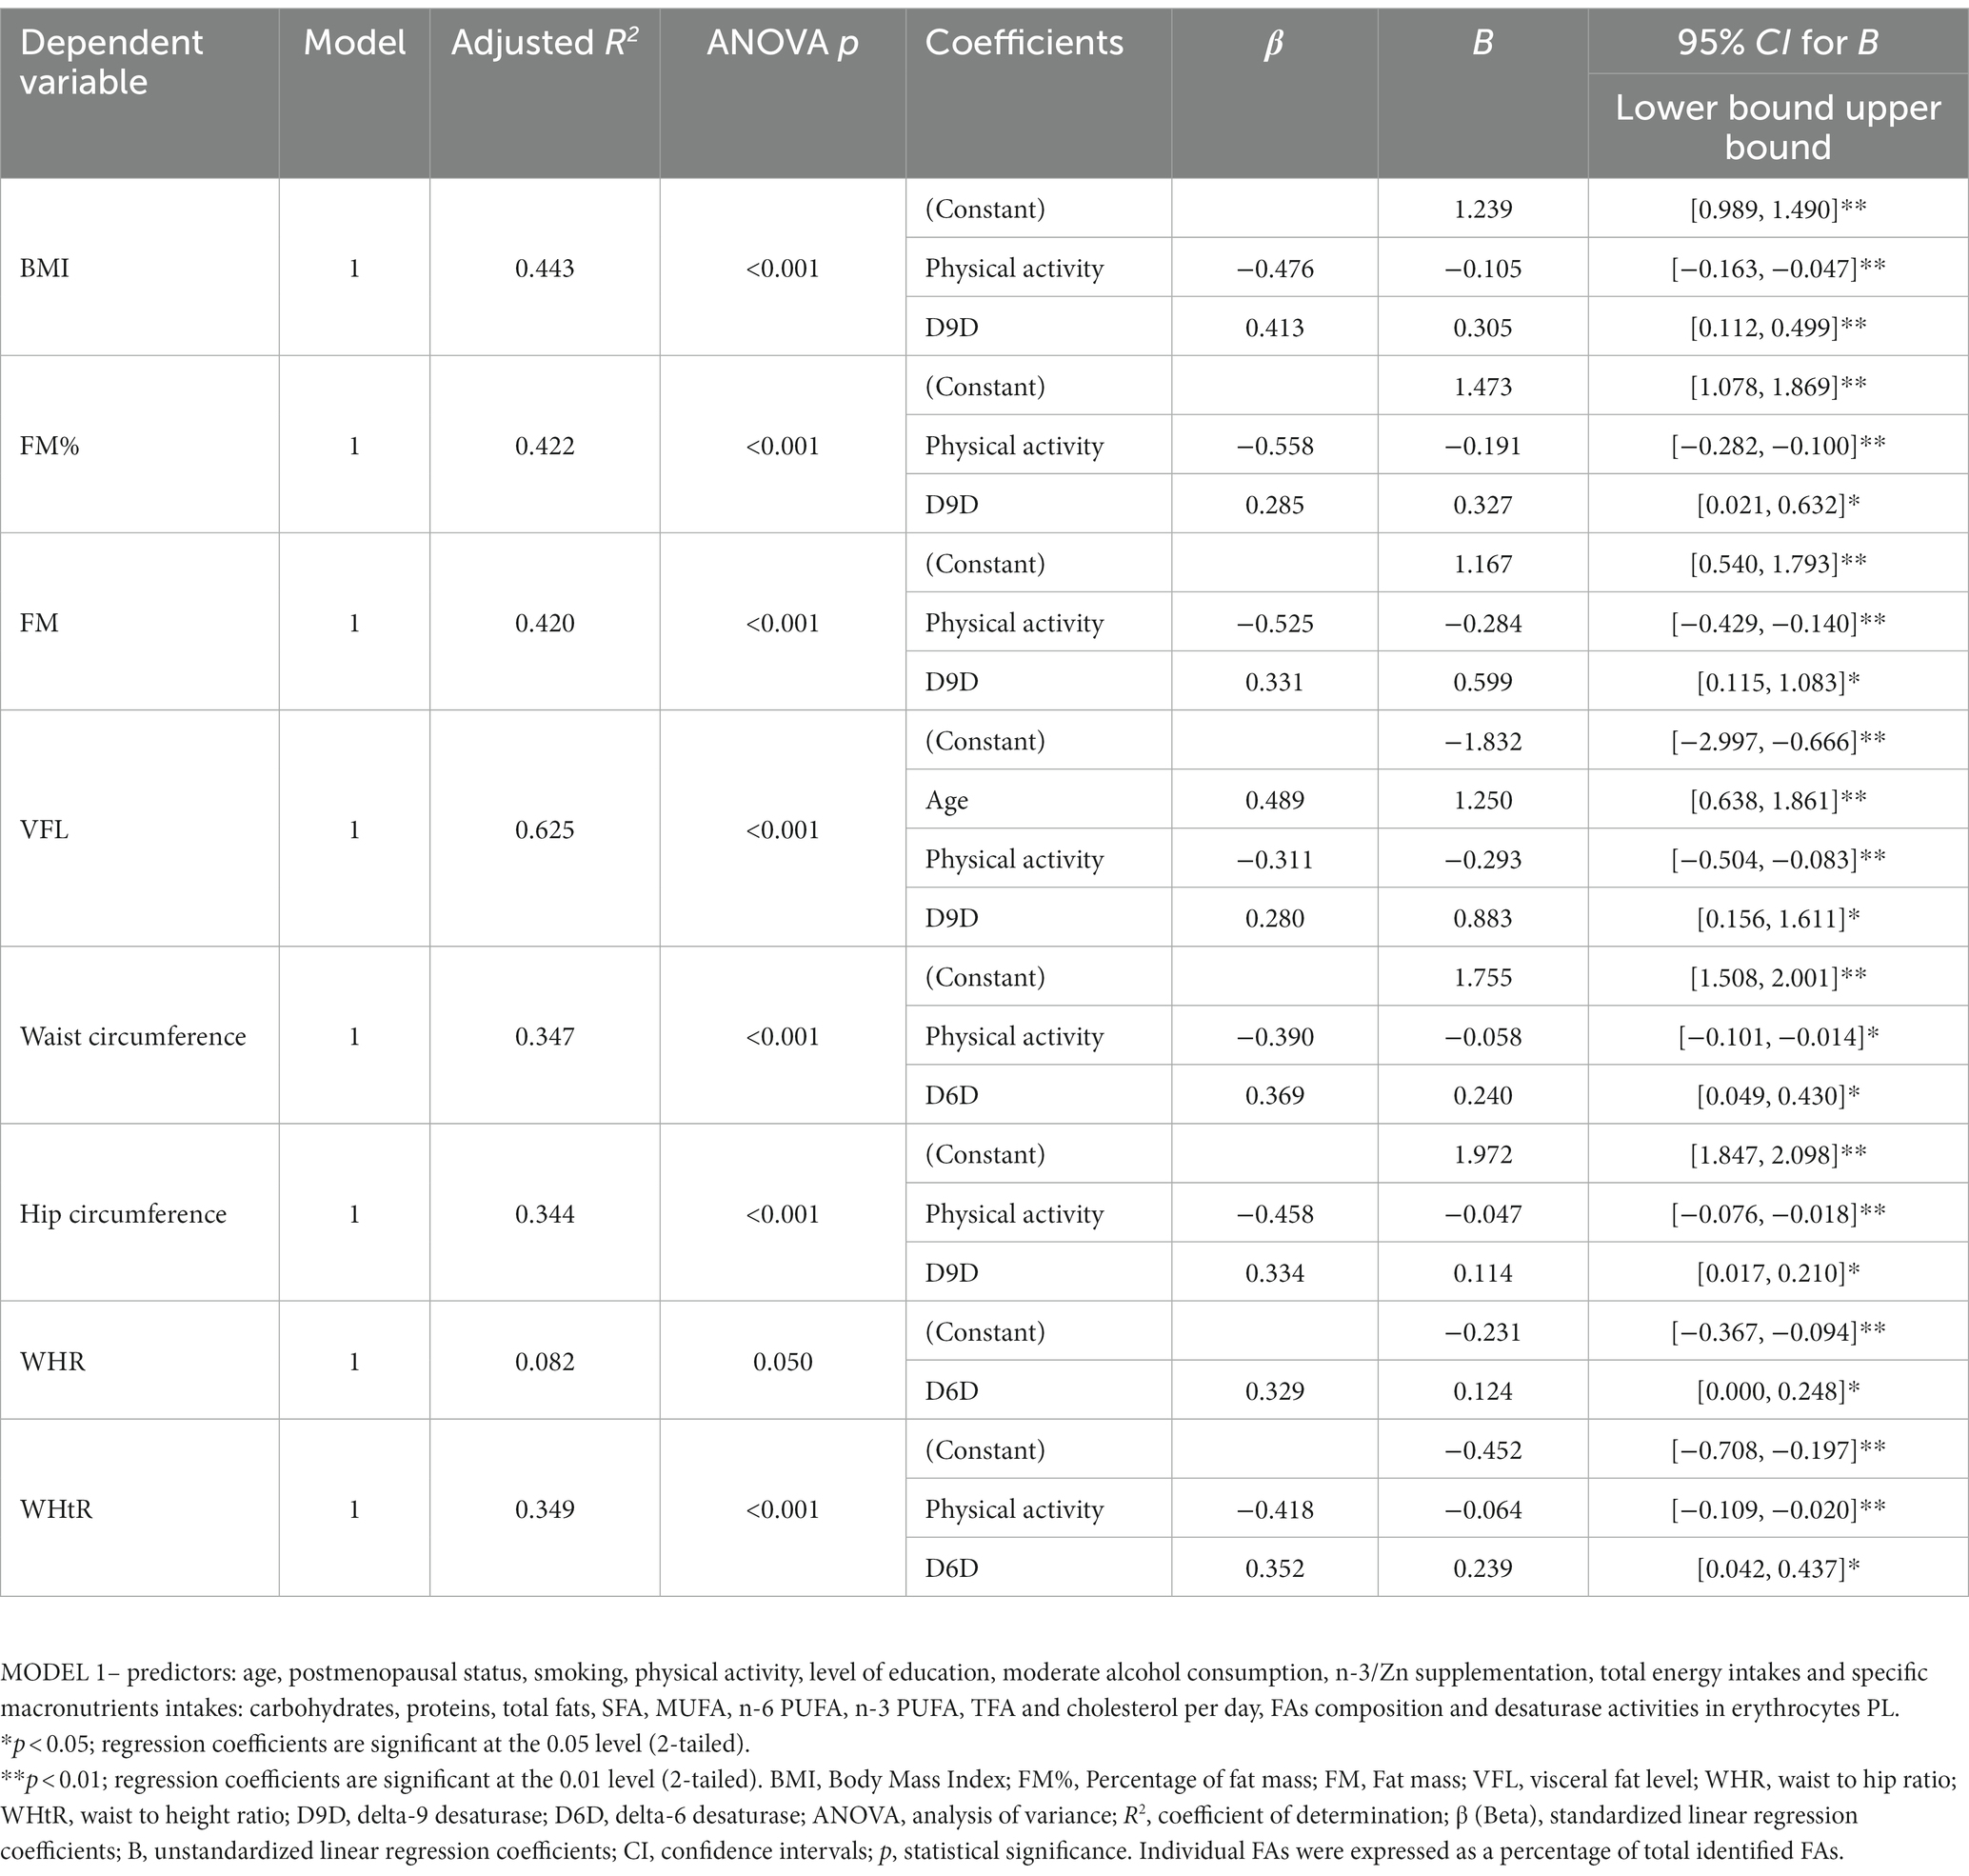
Table 7. Linear (stepwise) regression models for prediction of anthropometric indices by FAs and desaturase activities in erythrocytes PL.
Figure 1 and Supplementary Table S8 show the means of selected FAs (18:0, 16:1n-7, 18:2n-6, 20:3n-6, 20:4n-6 and 20:5n-3) and desaturase activities across different BMI-categories. There was the inverse U-shaped (or the inverse J-shaped) association between D5D activity and BMI-categories (Figure 1A). Both underweight and overweight subjects had lower estimated D5D activities, compared with normal weight subjects, while obese subjects had the lowest D5D activities compared to all others (Figure 1A). The inverse U-shaped pattern was shown also for 20:4n-6, while the direct U-shaped pattern was shown for 20:5n-3 (Figures 1B,C). In contrast, levels of 16:1n-7, 20:3n-6, 18:0, as well D6D and D9D activities showed quite linear (or even exponential) change across BMI-categories (an increase for all except for 18:0, for which there was a decrease), while no change is seen for 18:2n-6 (Figures 1A–C). In Supplementary Table S8 are given ANOVA tables for statistical difference between different BMI-categories. The small numbers of underweight, overweight, and obese subjects did not allow detecting significant differences between different BMI-groups, except for the most extreme ones. For 16:1n-7, 20:3n-6, D6D and D9D activities, the most significant differences were between underweight and obese subjects, while for D5D activity, the most significant differences were between normal weight and obese subjects. There was no significant difference between the different BMI-groups regarding 18:0, 18:2n-6, 20:4n-6, and 20:5n-3 levels.
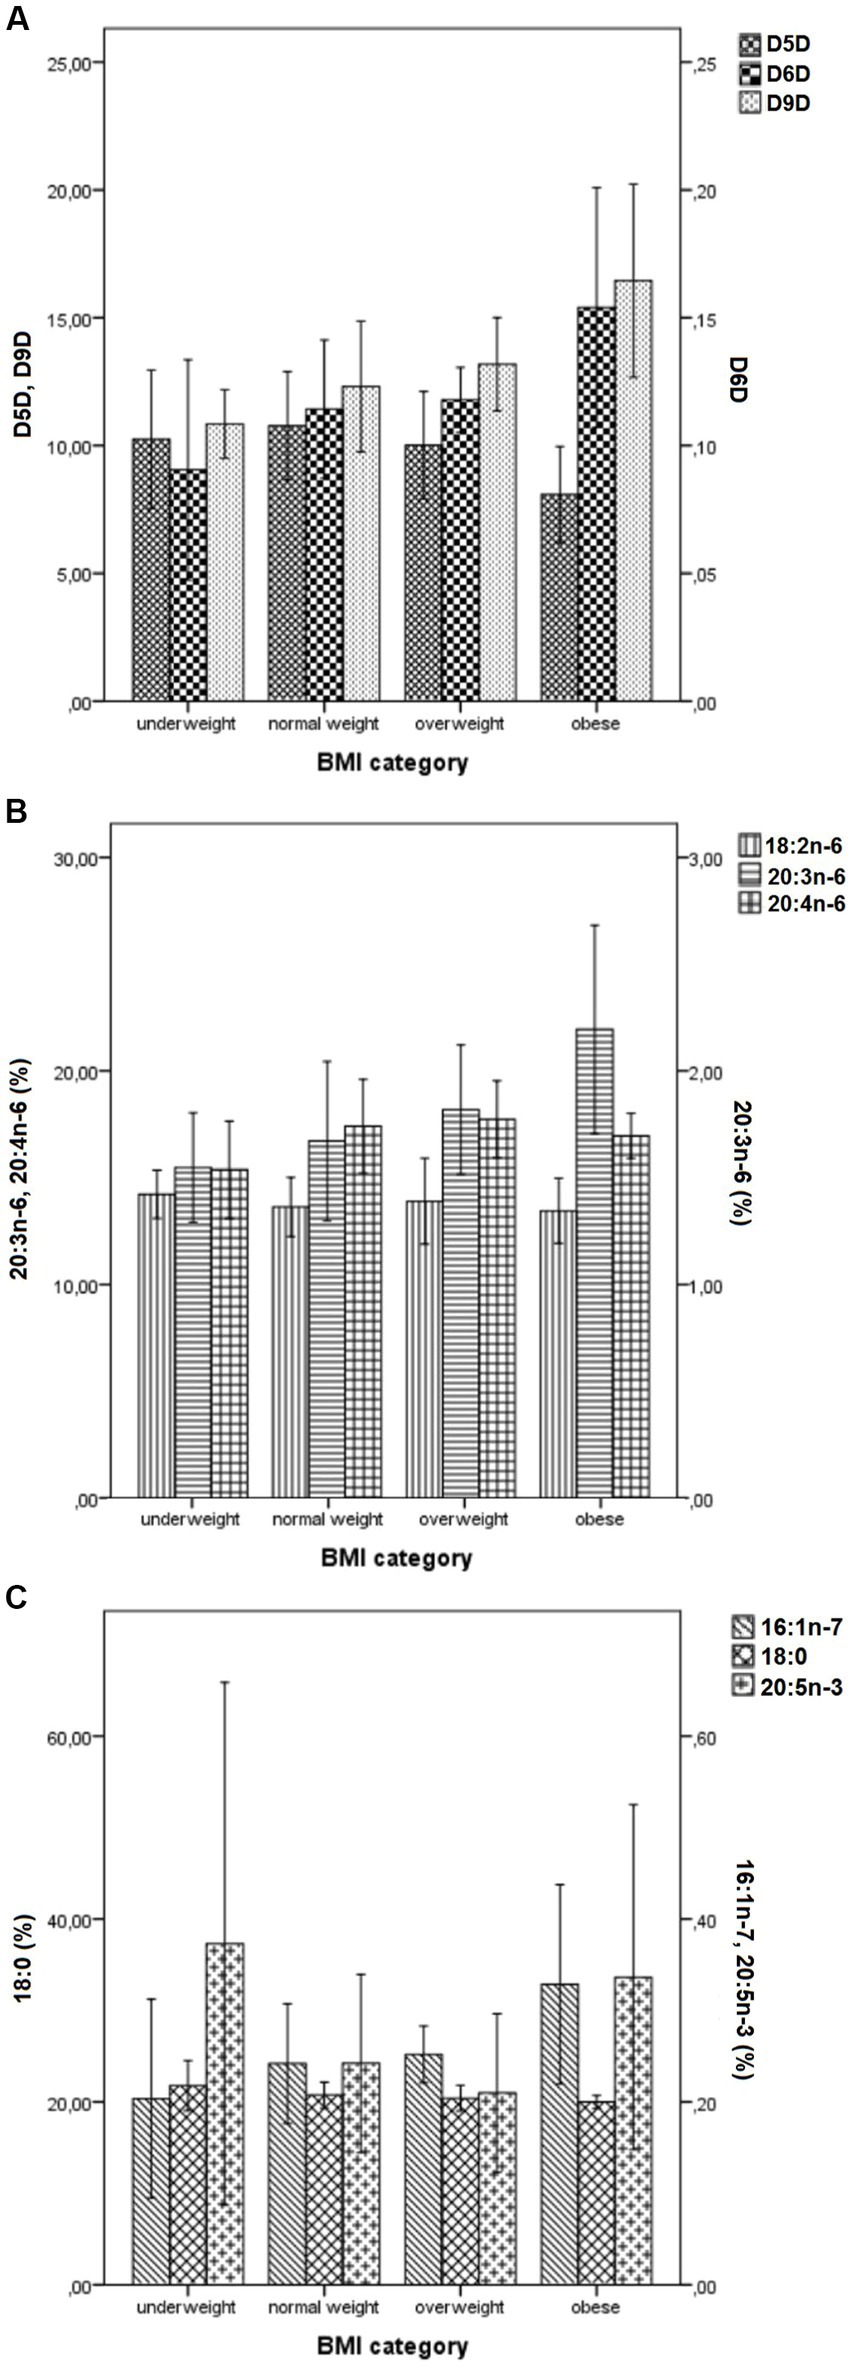
Figure 1. Mean values (± SD) of desaturase activities (A) and levels of selected FAs (18:0, 16:1n-7, 18:2n-6, 20:3n-6, 20:4n-6 and 20:5n-3) (B,C) across different BMI- categories. BMI, Body Mass Index; SD, standard deviation; Panel (A): D9D, delta-9 desaturase activity (multiplied by 1,000); D6D, delta-6 desaturase activity; D5D, delta-5 desaturase activity; Panel (B): 18:2n-6, linoleic acid; 20:3n-6, di-homo-gamma-linolenic; 20:4n-6, arachidonic acid; Panel (C): 18:0, stearic acid; 16:1n-7, palmitoleic acid; 20:5n-3, eicosapentaenoic acid. Values represent mean ± SD. Individual FAs were expressed as a percentage of total identified FAs.
To overcome the problem with small numbers in some BMI categories, we performed the same analyses across different BMI-quartiles. The results were quite the same, with linear/exponential increases in D9D and D6D activity, and the inverse U-shaped (or the inverse J-shaped) change in D5D activity across BMI-quartiles (Supplementary Figures S2, S3; Supplementary Table S9). Quite similar figures and patterns were obtained if FM, FM% or VFL quartiles were used (data not shown).
In order to further explore the inverse U-shaped change in D5D activity across BMI-categories/quartiles, we applied the non-parametric locally weighted regression and stratified linear regressions across BMI quartiles. The locally weighted smoothed regression line with the Epanechnikov kernel showed that there was an increasing trend for D5D activity up to BMI of about 23–24 kg/m2, and after there was a decreasing trend (Supplementary Figure S3A). Stratified linear regressions lines across BMI quartiles have given very similar results and have shown that up to 3rd quartile (BMI 22–25), the regression lines have shown positive association of with BMI, then in the 3rd quartile it plateaued (no association), and after, in the 4th quartile (BMI >25), the negative association with BMI was shown (Supplementary Figure S3B). However, only in the 4th quartile (which included only overweight and obese subjects), there was a significant negative association, R2 = 0.297 (Supplementary Figure S3B). The later was confirmed by stratified linear regression models: only in the 4th quartile there was a significant negative effect of BMI on D5D activity in both univariate (when only BMI was used as predictor) and multivariate (with all predictors included) stratified regression models (Supplementary Table S10).
This study showed that product/precursor estimated desaturase activities of D9D, D6D and D5D, and the FAs profiles of 18:0, 16:1n-7, 20:3n-6 and 20:5n-3 in erythrocyte membranes PL are significantly associated with the examined indicators of cardiometabolic risk among non-diabetic otherwise healthy Serbian women. The positive association of desaturase activities with adiposity was crucial and explained the association with other (biochemical and clinical) markers of cardiometabolic risk (together with age), since in our study we did not find age- and adiposity- independent associations of the mentioned FAs levels and desaturase activities with the levels of lipids, GLU, transaminases or BP (except for the associations of 20:5n-3 with ALT/AST ratio). Body mass index (together with age and smoking) was a significant predictor for almost all of the above-mentioned FAs (except 20:5n-3) and desaturases, and explained up to 25% of their variance. Vice versa, the activities of desaturases (particularly D9D and D6D) were significant predictors of anthropometric indices, together with age and physical activity, while (interestingly) dietary factors, postmenopausal status, smoking and educational level did not have significant influence in multiple regression models.
Our results on the associations of desaturase activities with the level of adiposity agree with almost all published data (20, 22, 27), even in children (25, 129, 130), but disagree with some studies concerning the adiposity-independent associations with clinical and biochemical biomarkers of cardiometabolic risk. For example, our results for adiposity-mediated D6D and D9D associations with metabolic profile are in agreement with a prospective study in elderly men (32), but disagree with D5D associations, since in that study the inverse association of D5D with adverse metabolic profile was independent from BMI. In a 10-year longitudinal study in Chinese women and men, higher serum D9D-18 activity, 16:1n-7, 18:1n-9, 20:3n-6 levels and lower D5D activity at baseline were predictors of development of metabolic abnormalities and transition of MHO to metabolically unhealthy obesity (MUO) phenotype, independently of sex, age, and BMI (97, 98). Nevertheless, in metabolically healthy normal-weight subjects who progressed to metabolically unhealthy normal-weight phenotype, these differences in desaturase activities were not observed (97). Similar results were obtained by the same authors in additional cross-sectional studies, where subjects with MUO had higher serum 16:1n-7, 18:1n-9, 20:3n-6 levels, higher D9D-16/D9D-18 activities and lower D5D activity, compared with subjects with MHO, despite similar BMI (97, 98). Similarly, serum ALT was independently positively associated with D9D activity in elderly men in one study (99). Risk for hypertension was associated with 16:0, 16:1n–7, 22:6n–3, 20:3n–6, D9D, D6D and D5D activity among Chinese cohort, independently of age, gender, BMI and other confounders (131). Possible reasons for discrepancy in these results with ours could be the differences in the studied populations and the analyzed FAs pools. In our study healthy women were studied, majority of them were of younger age, normal weight and only several of them had MetS. If the subjects with older age, higher level of adiposity and more adverse metabolic profile were included, or men (who are, e.g., more predisposed to NAFLD) (132), probably we would see also the adiposity-independent effects. Additionally, the ethnic differences may also contribute to the observed discrepancy in the results (57, 103). Apart from possible genetic differences between ethnic populations in Scd1, Fads2 and Fads1 polymorphisms (105, 133, 134), also dietary differences between ethnic populations may contribute (103). For example, in Caucasians on a high carbohydrate diet, 44% of variance in serum TAG was explained by D9D activity, while on high fat diet, only 11% of variance in serum TAG was explained by D9D activity (135). In our study, a high-fat/low-carbohydrate dietary pattern was identified, so the associations between desaturase activities and serum TAG levels may be less observable. Therefore, many differences between studied populations can contribute to contradictory results. Nevertheless, according to here presented data, in healthy, non-diabetic, predominantly younger and non-obese Serbian women, the connection of FAs profiles and desaturases activity with adverse metabolic profile was mostly conveyed by the effect of increased adiposity.
The association of adiposity and desaturase activities can be bidirectional: the increased adiposity produced by increased energy intake can change the expression and activities of desaturases in various tissues, and vice versa, the activities of desaturases may contribute to increased adiposity.
In support of the effect of adiposity on desaturases activities, weight loss in humans achieved by various dietary caloric reductions (with or without exercise) or metabolic surgery, significantly increased the D5D activity, while decreased the D6D and D9D activities and 16:1n-7, 20:3n-6, 18:3n-6 and 18:0 levels in erythrocyte membranes, whole plasma lipids, or separate plasma/serum lipid fractions (97, 98, 136–140). The reasons for the differences in the effect of weight loss on 18:0 in the cited studies compared with this study findings are unclear.
Likewise, animal studies with diet induced obesity (DIO) are in line with findings in humans, even though there can be some differences and discrepancies. For example, in the liver of mice on high-fat diets (HFD) or high sucrose diets (HSD), the increased, decreased or unchanged mRNA and protein expressions and estimated desaturases activities were shown (94, 141–146). The reasons for these discrepancies in animal results are not clear, and can be results of different experimental designs, animal strains, mode of expressing desaturase activity, type of diet or level of adiposity achieved.
The expression and activity of desaturases is controlled by many factors, including nuclear receptors: sterol regulatory element binding protein-1c (SREBP1c), liver X receptors (LXR), retionoid X receptor (rXR), carbohydrate regulatory element binding protein/ Max-like factor-X (ChREBP/MLX), PPAR-gamma peroxisome proliferator activated receptor (PPAR) alpha and gamma, and many others (64, 147, 148). In addition, epigenetic alterations (i.e., methylation of DNA), stability and degradation of the enzyme protein, as well as changes in the cytosolic NAD+/NADH ratio may contribute to changes in desaturases activities. In general, desaturases expressions and activities are stimulated by insulin, carbohydrates, and inhibited by PUFA, while the effects of leptin, SFA and MUFA can vary, depending on specific desaturase (64, 147–150).
Even though bio-mechanisms by which increased adiposity affects desaturase activities are still not well defined and can involve various pathways, it seems that the desaturase activity regulation by insulin and leptin can provide satisfying explanations.
Increased adiposity causes insulin resistance and leptin resistance. Insulin is one of the major stimulators of desaturase activities in many tissues, through induction of SREBP-1c, a nuclear factor which regulates lipogenesis and increases all three desaturases’ expressions and activities (151). Insulin increases the SREBP-1c gene transcription and mRNA stability, proteolytic maturation and nuclear transition of SREBP-1c protein, and inhibits its proteasomal degradation. Even though in obesity there is insulin resistance in many tissues for various actions of insulin, interestingly, there is no resistance of the effect of insulin on SREPB-1c induction in the liver (152, 153). Consequently, the compensatory increased insulin levels in insulin resistant states (including obesity) stimulate the SREPB-1c and increase expression and activity of all three desaturases, which was confirmed by studies in streptozocin induced diabetic animals (147, 154). However, it remains unclear which mechanism is responsible for different regulation of D5D by insulin in obesity, compared with D9D and D6D. Most studies show that D9D, D5D and D6D are regulated by the same factors (including insulin) in the same direction (64, 147). However, it seems that there is a differential effect of insulin on desaturases, depending on desaturase itself, the concentration of insulin and insulin sensitivity (155). Some studies suggested that regulation by insulin can be differential for D5D compared with D6D and D9D (156–158). For example, in streptozocin induced diabetes, the inhibition of D6D is much stronger than inhibition of D5D, indicating that D6D more strongly depends on insulin than D5D (156). Another study in animals showed no effect of insulin on the estimated D5D activity in hepatocytes or myocytes (159). Moreover, while in small, physiological doses insulin can have an increasing effect on the decreased D5D activity in insulin deficient diabetic rats or humans with type 1 diabetes (156, 160, 161), it was shown, in contrast, that in non-diabetic rats, insulin in higher doses inhibits the D5D activity in hepatocytes, measured by the labeled FAs incorporation (162). Unfortunately, we did not measure the insulin levels in our subjects, and there are no studies on the effect of insulin in non-diabetic subjects, to test the hypothesis of the biphasic effect of insulin on D5D activity (e.g., kinetic studies involving hyperinsulinemic-euglycemic-clamp and measuring desaturase activities in the blood by the use of stable isotopes).
With increased adiposity there is also leptin resistance. Leptin is known as potent inhibitor of D9D and D6D transcription and activation, mostly through its indirect central effects in the brain, but also some direct effects of leptin on the liver and adipose tissue can exist (163). In leptin deficient ob/ob animals, leptin administration centrally (i.e., intra-cerebroventricularly) decreased liver and adipose tissue Scd1 and Fads2 expression (unfortunately, Fads1 expression was not examined), through its effects on SREBP-1c, ChREBP, PPAR-gamma, PPAR-alpha, PGC-1alpha, AMP-activated protein kinase (AMPK), STAT3, and ERK1/2 MAPK pathway (163–166). Apart from influencing mRNA expression, leptin also decreased D9D half-life, which could additionally contribute to decreased D9D activity (147). Nevertheless, with increased adiposity, there is a central and peripheral resistance on leptin effects (caused by its diminished transport across the blood–brain barrier, decrease in the leptin receptor mRNA expression and density in the hypothalamus, hepatocytes, adipose tissue and muscles, as well as the deterioration of leptin-receptor function and signaling) (167), and therefore leptin cannot exert its inhibitory effect on Scd1 and Fads2 expression. On the other hand, to the best of our knowledge, no studies examined effect of leptin on Fads1 expression and D5D activity, even though in the mentioned study with central leptin infusion (163), also the increased liver 20:4n-6 values were shown, in parallel with increased 18:2n-6 values, which could indicate inhibited D6D activity, but stimulated D5D activity with leptin administration. All together, these data could suggest that in leptin resistant states (including simple obesity), there could be lack of both inhibitory effect of leptin on D6D and D9D activity and stimulatory effect of leptin on D5D activity.
Nevertheless, as already mentioned, the association of the increased adiposity and desaturase activities can be bidirectional. Vice versa, the increased activities of desaturases can predispose for adiposity development. For example, mice that lack the Scd1 gen activity are lean, resistant to DIO (despite increased food intake), have increased basal metabolism and fat oxidation, decreased de novo lipogenesis (DNL) and fat accumulation in the liver and adipose tissues, lower insulin resistance and more favorable metabolic profile (lower blood TG, GLU and insulin levels). On the other hand, they have increased oxidative and inflammatory liver damage and endoplasmic reticulum stress, due to increased SFA accumulation and oxidation in hepatocytes, as well as increased atherosclerosis (168–172). Liver-specific knock-out of Scd1 gen protects from the HSD induced adiposity in the same degree as the whole body Scd1 knock-out, but not from the HFD induced adiposity, indicating that in rodents, the liver D9D has a vital role for obesity development particularly in circumstances with high carbohydrate intakes, while in circumstances with high fat intakes, the adipose tissue D9D is more involved (171, 173). Especially liver D9D-18 activity (but not D9D-16 activity) contributes to DIO development, as shown in transgenic animals on HSD (174). Pharmacological inhibition of D9D showed similar effects as the genetic knock-out of Scd1 (169). The similar (but not identical) effects were also was shown with knock-out of Fads1 and Fads2 genes (175–181) or pharmacological inhibition of D5D and D6D in mice (94, 145, 182): protection from HFD- DIO, insulin resistance, unfavorable metabolic and pro-inflammatory profiles in the case of D5D deficiency, but only protection from DIO with partial protection from unfavorable metabolic profiles in case of D6D deficiency. In accordance, even in humans genetic polymorphisms of Scd1 (183–188), Fads2 and Fads1 (189–202) genes were related to increased predisposition to weight gain, increased adiposity, abdominal adiposity and related traits (insulin resistance, high GLU, TAG and LDL-C, low HDL-C, and pro-inflammatory adipokine/cytokine/chemokine profiles), with the effects varying depending on dietary, gender and ethnic interactions (102, 184, 185, 187, 188, 194, 197, 203–205) Therefore, the evidence supports both directions in the associations of increased adiposity with desaturases activities.
The more significant associations of D6D and D5D with increased adiposity compared with D5D found in this study can be causal (as explained above), but could also reflect the methodological issues in estimation of enzymatic activity. Desaturase indices, calculated as product/substrate ratios, are only an indirect measure of desaturase activity and do not have to represent the real activity of the enzyme (206). For example, there could be also a process of retro-conversion of 20:4n-6 to 20:3n-6 (207). Moreover, the product of D5D, 20:4n-6, is further metabolized to 22:4n-6 by Elov2, so the activity of this elongase could additionally affect the estimated D5D activity. In our study, 22:4n-6 values were about 25% of 20:4n-6 values, which indicates that significant proportion of 20:4n-6 is metabolized to 22:4n-6. However, in our study we did not find the associations of the estimated Elov2 activity (calculated as 22:4n-6/20:4n-6 or 22:5n-3/20:5n-3 ratios) with anthropometric indices, nor with D5D activity (data not shown), so the effect of Elov2 did not significantly influence results for D5D, which is in line with the literature data (97). Similarly, membrane bond 20:4n-6 in erythrocytes is known to be non-enzymatically oxidized/peroxidized or metabolized to eicosanoids and endocannabinoids by activity of phospholipases, cyclooxygenase, lipoxygenase, cytochrome P450-dependent enzymes, phosphatases and diacylglycerol-lipase, and their activity can be changed in obesity and MetS, which are considered as pro-inflammatory states (208, 209). Unfortunately, the eicosanoid and endocannabinoid levels in the blood were not assessed in this study. Furthermore, while the products of D6D and D9D (i.e., 20:3n-6 and 16:1n-7) are rarely found in the diet, and mostly reflect endogenous synthesis, 20:4n-6 is also provided by animal dietary sources (including meat, poultry, eggs, fish, and dairy products) (210). Therefore, its proportions in erythrocytes PL can be increased by dietary intakes and can erroneously inflate the estimated D5D activity with the increased dietary consumption of animal sources food. Nevertheless, it still seems that 20:4n-6 much more derives from endogenous conversion of 18:2n-6, 18:3n-6 and 20:3n-6 (211, 212), since large dietary intakes of 18:2n-6 much overcome low dietary intakes of 20:4n-6, and it is estimated that dietary 20:4n-6 contribution is less than 1% of total 20:4n-6 pool (213). In agreement, some studies showed only slightly lower 20:4n-6 levels in vegans compared with omnivores, while others even did not find the difference, despite huge differences in 20:4n-6 intakes (214, 215). In our study, we could not distinguish the intake of 20:4n-6 from different sources (animal vs. plant), and thus endogenous from exogenous 20:4n-6, due to methodological limitations, but 20:4n-6 levels were positively predicted by the levels of 18:2n-6, D6D and D5D, and that model completely explained the 20:4n-6 content, indicating that 20:4n-6 levels are principally determined by endogenous synthesis in our study. Interestingly, both D6D and D5D desaturases equally explained the variability in 20:4n-6 (together up to 71.6% of 20:4n-6 variability in our model). The addition of 18:2n-6 in the model explained 100% of variability of 20:4n-6. Finally, our data could also suggest that D5D activity could be more influenced by some intrinsic factors (e.g., genetic polymorphism) than by external factors (compared with D6D and D9D), which is in agreement with genetic polymorphism studies that underline genetic influence on D5D activity (216–219). For example, in a study which examined the FAs profiles in weight-discordant monozygotic twin pairs, the estimated activity of D5D was not different with obesity, while the estimated activities of D6D and D6D were increased in the obese twin (220). Nevertheless, the results of genetic studies on Fads1 polymorphisms and obesity are often contradictory, with more effects observed in children compared with adolescents and adults (192, 193, 198, 202), and it appears that other factors can still overcome the genetic influences.
Despite all these considerations, it seems that the most reasonable explanation for the less significant associations of increased adiposity with D5D activity is that relation of D5D activity with anthropometric indices was the inverse U-shaped. Both underweight and overweight subjects had lower estimated D5D activities, compared with normal weight subjects in our study, while obese subjects had the lowest D5D activities compared to all others. The non-parametric locally weighted regression showed an increasing trend for D5D activity up to BMI cut-off of about 23–24 kg/m2, and after which there was a decreasing trend. Nevertheless, in the stratified analyses across BMI quartiles, only in overweight/obese subjects there was a significant association of BMI with D5D activity. However, due to the small number of subjects in quartiles, we could not perform proper stratified regression analyses, and these results should be interpreted with caution. In contrast, D6D and D9D activities (as well as 16:1n-7 and 20:3n-6 levels) showed a more linear (exponential) increase from underweight to overweight subjects, while for the 18:0 content, a linear decrease was shown. These findings can be explained by stimulation of D6D and D5D by insulin (which directly correlates with anthropometric indices, i.e., level of adiposity), and the biphasic effect of insulin on D5D activity. While in the insulin sensitive subjects (with lower BMI) insulin can have positive effect on D5D, in the insulin resistant subjects (with higher BMI), there can be an inhibitory effect, as suggested by studies in rats (156, 160–162). Unfortunately, we did not asses the insulin levels in our subjects to estimate insulin sensitivity at least by HOMA-IR index (221). Additionally, measuring leptin levels could be of interest, to assess the effect of both low and high leptin levels on D5D activity. As mentioned above, there are not published studies on the effect of leptin on D5D activity (only on the effect on D6D and D9D activity) (163).
The inverse U-shaped association was un unexpected finding, and to the best of our knowledge, there are no studies which reported such association. In the majority of the published studies, only normal weight and obese subjects were compared, and rarely the subjects with lower BMI were involved in research of FAs profiles. Our unexpected finding raises the need for more studies in this group of subjects, but interestingly, there are no studies on that topic. Additionally, subjects with eating disorders or subjects with lipodystrophic syndromes can be studied. Of note, the later ones represent insulin resistant subjects (222), while in eating disorders – e.g., anorexia nervosa (AN), both increased and diminished insulin sensitivity can be seen, depending on the muscle mass atrophy and abdominal fat accumulation (223, 224). Lipodystrophic subjects have disturbed lipid cell metabolism and they could have genetically determined changes in desaturases activities (225, 226), while subjects with AN can have completely different nutrient intakes (particularly of essential FAs) and disturbed metabolism and endocrine function (227–232), thus they make specific groups of underweight subjects, not suitable for comparison with general population.
As mentioned above, in our study three FAs were linearly correlated with anthropometric indices of adiposity, and both centripetal and peripheral fat accumulation: 20:3n-6, 16:1n-7 and 18:0. However, 18:0 correlated less with adiposity indices than 20:3n-6 and 16:1n-7. Our findings for 20:3n-6 and 16:1n-7 are in accordance with all other findings in the literature, but our data for 18:0 can differ from other studies, where the levels of 18:0 in both erythrocytes PL and plasma (whole plasma, plasma FFA, CE and PL) were positively related to indices of adiposity (20, 26, 98, 101, 233–235). However, more obese subjects and both men and women were included in the mentioned studies, and there could be also some dietary influences.
With increased adiposity, the levels of 18:0 could be decreased because of the increased activity of D9D (which transforms 18:0 to 18:1n-9) and the decreased activity of Elov6 (which produces 18:0 from 16:0) (97, 220). In our study, we also observed a significant negative correlation of the estimated Elov6 activity (calculated as 16:1n-7/18:1n-9 and 16:1n-7/18:1n-7 ratios) with the indices of adiposity and visceral fat accumulation (data not shown). This is in accordance with the mentioned study in weight discordant twins (220) and study of Zhao and associates (97).
Another interesting question arises from our research: it is known that n-3 PUFA can ameliorate NAFLD, ALT and AST levels (236–239), but here we have found a positive correlation of 20:5n-3 with the ALT/AST ratio, as an indicator of liver steatosis, even after controlling for all possible confounders (including dietary n-3 PUFA intakes and n-3 PUFA supplements usage), or after excluding the subjects with n-3 PUFA supplementation. This is the opposite from what one would expect, considering that people with NAFLD have the lower n-3 PUFA content in their livers and that n-3 PUFA can ameliorate NAFLD, by increasing beta oxidation and decreasing DNL and liver TAG synthesis (146, 236, 240–243). One possible explanation is that in NAFLD there can be a lower conversion rate of 20:5n-3 to 22:6n-3. Indeed, we observed in this study a significant negative correlation of estimated “putative D4D” activity (calculated as ratio 22:6n-3/20:5n-3) with ALT/AST ratio (r = −0.536, p < 0.001) and ALT (r = −0.353, p = 0.002) (unpublished observations). The linear regression models also confirmed the negative association of “putative D4D” activity with ALT/AST ratio (data not shown). Even though instead of putative D4D enzyme there are actually several different steps during process of conversion of 20:5n-3 to 22:6n-3, which include Elov2/5, D6D and peroxisomal beta-oxidation by acyl-CoA oxidase and 17β-hydroxysteroid dehydrogenase 4 (64, 146), the ratio 22:6n-3/20:5n-3 can show the rate of this conversion, which in humans is quite low (240), and can be further reduced in states of hepatic steatosis and steatohepatitis (244–246), so there could be accumulation of 20:5n-3 and 22:5n-3 in such states. In agreement, also 22:5n-3, the intermediate Elov2/5 product during this conversion, positively correlated with ALT/AST ratio, although less than 20:5n-3. In addition, we also observed the positive correlation of 22:5n-3 with GGT (r = 0.469, p = 0.012). However, there could be other possible mechanisms to explain the positive association of 20:5n-3 with ALT/AST ratio. For example, there could be a possibility of increased desaturation and elongation of 18:3n-3, increased retroconversion of 22:6n-3 to 20:5n-3, reduced beta-oxidation of 20:5n-3 or reduced transformation by cyclooxygenase and lipoxygenase to eicosanoids in hepatic steatosis. However, quite the opposite was described in NAFLD (142, 239, 240, 243, 247), and both the retroconversion of 22:6n-3 to 20:5n-3 and conversion of 18:3n-3 to 20:5n-3 and 22:6n-3 in humans are relatively inefficient (207, 248–251). Furthermore, ALT is more a marker of liver steatosis and gluconeogenesis, while AST is more a marker of cellular damage, and it could be possible that the anti-inflammatory and anti-oxidative 20:5n-3 properties overcome its influence on hepatic lipid accumulation (243, 252, 253). In agreement, supplementation with n-3 FAs (fish oil) increased ALT/AST ratio in rats on a hypercholesterolemic HFD (254), and in some studies in humans, the more potent effect on AST than ALT reduction was observed, but not in all, and in some even more potent effect on ALT reduction was shown (236, 240, 243, 255, 256). Therefore, the observed positive association probably cannot be explained by the possible effect of 20:5n-3 on ALT/AST ratio. Moreover, none of our subjects had severe liver damage, and the association was present across different BMI-categories and BMI-quartiles, although the association was stronger in higher BMI quartiles (data not shown).
The positive associations of 16:1n-7 and VFL with ALT/AST ratio is not surprising, bearing in mind that 16:1n-7 is the one of the best indicators of the increased DNL, which is a hallmark of NAFLD (77, 240). Even though many other FAs are also the products of DNL, including SFA from C12:0 to C18:0 and other MUFA (18:1n-9 and 18:1n-7) (42, 48), 16:1n-7 is probably the best indicator of DNL, due to its low abundance in common dietary sources and high correlation of D9D activity with activity of other enzymes involved in DNL, since they are all regulated by the same regulatory elements, SREBP-1c and ChREBP (77, 257, 258). In accordance, D9D-16 is much better indicator of DNL compared with D9D-18 or ratio 16:0/18:2n-6 (also known as DNLIndex) (40, 77). Our data also confirm the association of D9D with ALT and ALT/AST ratio, and very strong association of D9D with VFL.
The found associations of indicators of cardiometabolic risk as well as desaturase activities and FAs profiles with age, postmenopausal status, smoking, moderate alcohol consumption, physical activity and educational level are more/less in accordance with previously published data (20, 53, 54, 59, 259). Smoking, age, and physical activity all increase oxidative stress, which can affect desaturase activities (74, 95, 96, 260, 261). Age was associated with 16:1n-7 and D9D, because of age-related increases in visceral fat mass (262–264). When VFL was also included in the model, VFL became the only significant predictor of 16:1n-7 and D9D (data not shown). Data on menopausal status are scarce, and one study did not find the differences in FAs profiles (106). However, some other studies have shown some differences (61), but the study pre- and post-menopausal groups were very different regarding age and BMI, so the effect of menopause could not be clearly distinguished from the effects of age and BMI. In one large-sample study (265), only the levels of 16:0 were negatively associated with menopause, which in accordance with our study results. In our study, after adjusting for multiple confounders (including age), only the negative association of 16:0 with menopause remained significant (rpb = 0.256, p = 0.033). According to literature data, smoking has negative associations with D5D (and much less D6D) activity, while has positive associations with D9D activity (20, 74, 76, 96, 266–268). In our study we also have found negative associations with D5D and positive associations with D9D activity, but after adjustments for multiple confounders only negative associations with D5D activity remained. In majority of the studies, physical activity was in positive association with D5D activity, and negative association with D9D and D6D activities (269–273), what is similar with our results, even though in linear regression models the physical activity level was not a significant predictor, indicating that other factors (e.g., BMI, smoking, age) confounded this association, which is in agreement with results of Warensjö and associates (20).
Surprisingly, in our study we did not obtain the significant associations of both desaturase activities and biochemical indices with dietary factors, except for negative associations of anthropometric indices with total energy and macronutrients intakes (except for n-3 PUFA), negative associations of PUFA intakes (particularly n-6 PUFA) with biochemical indices of cardiometabolic risk, and positive associations of 20:5n-3 with n-3 PUFA intake and with n-3 PUFA or n-3 PUFA/Zn supplementation. Nevertheless, only the associations of 20:5n-3 with n-3 PUFA intake and n-3 PUFA and Zn supplementation did remain significant in linear regression models. The associations of total n-3 PUFA dietary intakes (from both plant and animal sources) with 20:5n-3 levels, but not 22:6n-3 levels, can be explained by low conversion rates of 18:3n-3 to 22:6n-3 (much lower than 20:5n-3) (215, 250, 274). In contrast to what could be expected from the literature (51, 64, 65, 275), no other significant associations of desaturase activities or FAs levels were found with dietary data obtained from 24 h-recalls, related to total energy, carbohydrate, protein, total fat, and (particularly) SFA, MUFA and PUFA intakes. One of the reasons for that is that only two 24 h-recalls were used for dietary assessments, while usually much longer dietary surveys (up to 15 days), or validated FFQ were used to precisely estimate different dietary fats intakes (210, 276, 277). We did not have FFQ data (only FPQ) to estimate dietary intakes over a year, and 24 h-recalls can reflect recent dietary intakes, while erythrocytes FA profiles more represent the long-term dietary intakes compared with plasma FA profiles (67, 278, 279). Nevertheless, also other authors noted a week correlation between macronutrient nutritional intakes and desaturase activities in erythrocytes, except for n-3 PUFA (22:6n-3, 20:5n-3) and TFA (278). There is also the problem with self-reported data, including under-reporting, which is particularly common among obese subjects (109, 280). In line with that, the possible under-reporting could also explain the observed negative associations of total energy intake and intakes of almost all macronutrients with anthropometric indices indicative for obesity.
The strengths of this study are in a very thorough analysis and controlling for many possible confounders. Additionally, we analyzed FA composition in erythrocyte PL (separated by TLC), which more reflects the long-term dietary intakes and endogenous metabolism in the liver, compared with other sources, and is less susceptible to confounding in estimation in hyperlipidemic states (90, 92). The major study limitation is the relatively small sample size. We had made the study power calculation, and even though we here obtained bit lower correlation coefficients (the lowest r = 0.234), our study-power is above 80% for majority of the obtained correlations (all above r = 0.316). Nevertheless, the small number of participants did not allow adequate statistical power for multiple adjustments implemented (281). We performed the Bonferroni correction to avoid an increased risk of a type I error when making multiple statistical tests, but this probably underestimated the influence of possible confounding factors with lower correlation coefficients than r = 0.450, which can increase the risk of a type II error (281). Moreover, the number of involved subjects was not sufficient enough to make proper stratification analyses. Because of that, our exploratory findings need to be confirmed in a larger cohort, particularly for further stratification analyses. Another study limitation is that in our cohort, the number of underweight, overweight and obese subjects was significantly lower than the number of normal-weight subjects, and half of the subjects were younger than 30 years. Therefore, our results probably mostly relate to younger and normal-weight women. Our study included only Serbian women, and the results cannot be directly extrapolated to men (or women of different race/ethnicity). Hence, our findings need to be confirmed in other populations, with probably larger samples included, and more equally represented age and BMI-categories. Further limitation is that the product/predictor estimation of desaturase activities was used to assess enzymatic activity, which does not have to reflect the real enzymatic activity (78, 79). Moreover, we did not assess the absolute concentration of FAs in erythrocyte PL, which would be ideal. However, the vast majority of the studies cited here also expressed their results as percentage of the total FA content (relative %), and there is a good correlation with the absolute concentrations in erythrocyte PL (101). Also, our chromatographic conditions were not tested for the separation of positional isomers of unsaturated FAs (e.g., two cis positional isomers for 16:1, 16:1n-6c and 16:1n-9c), as well as of their geometrical trans isomers. Nevertheless, our peak retention times were defined by a certified calibration standard mixture of cis-isomers retention times, and in erythrocyte PL the total content of the trans isomers is relatively low (on average, less than 2%) (101, 278, 282, 283). Moreover, our chromatographic conditions were not tested for the separation of FAME from dimethylacetal (DMA) and alk-1-enyl methyl ether (AME) derivatives, which are formed after basic/acidic transesterification of plasmalogen fraction of PL, contacting alk-1-enyl (vinyl) ether bonds (284–286). Furthermore, to assess the level of adiposity, the gold standards are dual-energy X-ray absorptiometry (DXA) and magnetic resonance/computed tomography (MRI/CT), while we in our study used the more applicable surrogate measures, which have their own limitations (287, 288). Nonetheless, our results were consistent across different indicators of adiposity, suggesting that our results are robust. In addition, our study would be more complete if we had measured the levels of insulin, leptin, certain eicosanoids and endocannabinoids, which would give more insights into pathophysiologic mechanisms. Nevertheless, the cross-sectional study design still does not allow making conclusions on the causality. Finally, as we already mentioned in the paragraph above, there are certain limitations of the performed dietary surveys.
This study confirmed that the levels of certain FAs (16:1n-7, 20:3n-6, and 18:0) and estimated desaturase activities in erythrocytes PL were significantly associated with anthropometric, clinical and biochemical cardiometabolic risk indicators in healthy, non-diabetic Serbian women. However, the associations of clinical and biochemical indicators of cardiometabolic risk were not independent from the associations with the level of adiposity. After controlling for multiple confounding factors (including age, postmenopausal status, smoking, physical activity, educational level, alcohol consumption, use of supplements and dietary macronutrient intakes), the level of adiposity was the most significant predictor of the estimated desaturase activities and 16:1n-7, 20:3n-6, and 18:0 levels, and mediated their association with biochemical and clinical indicators. Vice versa, desaturase activities predicted the level of adiposity, but not other components of cardiometabolic risk (if the level of adiposity was also accounted). While the associations of 16:1n-7, 20:3n-6, 18:0, D9D and D6D activities with anthropometric indices were linear (positive with 16:1n-7, 20:3n-6, D9D and D6D, and negative with 18:0), the associations of D5D activity with anthropometric indices were the inverse U-shaped. The only adiposity-independent association of FAs profiles with indicators of cardiometabolic risk was the association of 20:5n-3 with ALT/AST ratio, which requires further exploration. More studies are needed to explore the mechanisms of the observed associations of FAs profiles and desaturase activities with anthropometric, clinical, and biochemical cardiometabolic risk indicators, including larger-scale confirmatory studies.
The raw data supporting the conclusions of this article will be made available by the authors, without undue reservation.
The studies involving human participants were reviewed and approved by Institute of Occupational Health Niš Ethics Board. The patients/participants provided their written informed consent to participate in this study.
IŠ wrote the manuscript and performed anthropometric measurements, nutritional interviews, software-exploration of nutritional data, and all statistical analyses. JDM, MT, NKV, TP, and JJ performed chromatographic and biochemical analyses. VS, JM, and MZ were involved in anthropometric and dietary assessment. All the authors contributed to the manuscript writing.
The authors acknowledge financial support from the Ministry of Education, Science and Technological Development of the Republic of Serbia (project number III41030 2011-2017 and contract number: 451-03-68/2022-14/200015) and Ministry of Science, Technological Development and Innovation of the Republic of Serbia (contract number: 451-03-47/2023-01/200015).
The authors are grateful to Dr. Agnes Kadvan for involvement in dietary assessments. This work has been supported by the Ministry of Education, Science and Technological Development of the Republic of Serbia, project number III41030 (2011–2017) and ongoing contract number: 451-03-68/2022-14/200015.
The authors declare that the research was conducted in the absence of any commercial or financial relationships that could be construed as a potential conflict of interest.
All claims expressed in this article are solely those of the authors and do not necessarily represent those of their affiliated organizations, or those of the publisher, the editors and the reviewers. Any product that may be evaluated in this article, or claim that may be made by its manufacturer, is not guaranteed or endorsed by the publisher.
The Supplementary material for this article can be found online at: https://www.frontiersin.org/articles/10.3389/fnut.2023.1065578/full#supplementary-material
1. World Health Organization . World health statistics 2022: monitoring health for the SDGs, sustainable development goals. Geneva: World Health Organization (2022).
2. Hruby, A , and Hu, FB . The epidemiology of obesity: a big picture. Pharmacoeconomics (2015) 33:673–89. doi: 10.1007/s40273-014-0243-x
3. Jaacks, LM , Vandevijvere, S , Pan, A , McGowan, CJ , Wallace, C , Imamura, F, et al. The obesity transition: stages of the global epidemic. Lancet Diabetes Endocrinol (2019) 7:231–40. doi: 10.1016/S2213-8587(19)30026-9
4. Popkin, BM , Adair, LS , and Ng, SW . Global nutrition transition and the pandemic of obesity in developing countries. Nutr Rev (2012) 70:3–21. doi: 10.1111/j.1753-4887.2011.00456.x
5. Sekulic, M , Vasiljevic, D , Radevic, S , and Djonovic, N . Socioeconomic inequalities in overweight and obesity in Serbia: data from 2013 National Health Survey. Front Pharmacol (2018) 8:967. doi: 10.3389/fphar.2017.00967
6. Statistical Office of the Republic of Serbia . The 2019 Serbian National Health Survey. Belgrade: Institute of Public Health of Serbia (2021). 1–137 p.
7. Cizza, G , and Rother, KI . Beyond fast food and slow motion: weighty contributors to the obesity epidemic. J Endocrinol Investig (2012) 35:236–42. doi: 10.3275/8182
8. Godoy-Matos, AF , Silva Júnior, WS , and Valerio, CM . NAFLD as a continuum: from obesity to metabolic syndrome and diabetes. Diabetol Metab Syndr (2020) 12:1–20. doi: 10.1186/s13098-020-00570-y
9. Grundy, SM , Cleeman, JI , Daniels, SR , Donato, KA , Eckel, RH , Franklin, BA, et al. Diagnosis and Management of the Metabolic Syndrome. Circulation (2005) 112:2735–52. doi: 10.1161/CIRCULATIONAHA.105.169404
10. Tsatsoulis, A , and Paschou, SA . Metabolically healthy obesity: criteria, epidemiology, controversies, and consequences. Curr Obes Rep (2020) 9:109–20. doi: 10.1007/s13679-020-00375-0
11. Jovanović, J , Šarac, I , Jovanović, S , Sokolović, D , Govedarović, N , and Jovanović, J . The relationship between occupational stress, health status, and temporary and permanent work disability among security guards in Serbia. Int J Occup Saf Ergon (2021) 27:425–41. doi: 10.1080/10803548.2019.1579458
12. Bindlish, S , Presswala, LS , and Schwartz, F . Lipodystrophy: syndrome of severe insulin resistance. Postgrad Med (2015) 127:511–6. doi: 10.1080/00325481.2015.1015927
13. Cortés, VA , and Fernández-Galilea, M . Lipodystrophies: adipose tissue disorders with severe metabolic implications. J Physiol Biochem (2015) 71:471–8. doi: 10.1007/s13105-015-0404-1
14. Cuthbertson, DJ , Steele, T , Wilding, JP , Halford, JC , Harrold, JA , Hamer, M, et al. What have human experimental overfeeding studies taught us about adipose tissue expansion and susceptibility to obesity and metabolic complications? Int J Obes (2017) 41:853–65. doi: 10.1038/ijo.2017.4
15. Wang, H , Xu, P-F , Li, J-Y , Liu, X-J , Wu, X-Y , Xu, F, et al. Adipose tissue transplantation ameliorates lipodystrophy-associated metabolic disorders in seipin-deficient mice. Am J Physiol Metab (2019) 316:E54–62. doi: 10.1152/ajpendo.00180.2018
16. El, HM , Buelna-Chontal, M , Sánchez-Muñoz, F , and Carbó, R . Adipogenesis: a necessary but harmful strategy. Int J Mol Sci (2019) 20:3657. doi: 10.3390/ijms20153657
17. Elías-López, D , Vargas-Vázquez, A , Mehta, R , Cruz Bautista, I , Del Razo, OF , Gómez-Velasco, D, et al. Natural course of metabolically healthy phenotype and risk of developing Cardiometabolic diseases: a three years follow-up study. BMC Endocr Disord (2021) 21:85. doi: 10.1186/s12902-021-00754-1
18. Eckel, N , Li, Y , Kuxhaus, O , Stefan, N , Hu, FB , and Schulze, MB . Transition from metabolic healthy to unhealthy phenotypes and association with cardiovascular disease risk across BMI categories in 90 257 women (the nurses’ health study): 30 year follow-up from a prospective cohort study. Lancet Diabetes Endocrinol (2018) 6:714–24. doi: 10.1016/S2213-8587(18)30137-2
19. Ryan, DH , and Yockey, SR . Weight loss and improvement in comorbidity: differences at 5, 10, 15%, and over. Curr Obes Rep (2017) 6:187–94. doi: 10.1007/s13679-017-0262-y
20. Warensjö, E , Öhrvall, M , and Vessby, B . Fatty acid composition and estimated desaturase activities are associated with obesity and lifestyle variables in men and women. Nutr Metab Cardiovasc Dis (2006) 16:128–36. doi: 10.1016/j.numecd.2005.06.001
21. Warensjö, E , Rosell, M , Hellenius, M-L , Vessby, B , De Faire, U , and Risérus, U . Associations between estimated fatty acid desaturase activities in serum lipids and adipose tissue in humans: links to obesity and insulin resistance. Lipids Health Dis (2009) 8:37. doi: 10.1186/1476-511X-8-37
22. Fekete, K , Györei, E , Lohner, S , Verduci, E , Agostoni, C , and Decsi, T . Long-chain polyunsaturated fatty acid status in obesity: a systematic review and meta-analysis. Obes Rev an Off J Int Assoc Study Obes (2015) 16:488–97. doi: 10.1111/obr.12280
23. Valckx, SDM , Arias-Alvarez, M , De Pauw, I , Fievez, V , Vlaeminck, B , Fransen, E, et al. Fatty acid composition of the follicular fluid of normal weight, overweight and obese women undergoing assisted reproductive treatment: a descriptive cross-sectional study. Reprod Biol Endocrinol (2014) 12:13. doi: 10.1186/1477-7827-12-13
24. Andersen, JM , Rønning, PO , Herning, H , Bekken, SD , Haugen, TB , and Witczak, O . Fatty acid composition of spermatozoa is associated with BMI and with semen quality. Andrology (2016) 4:857–65. doi: 10.1111/andr.12227
25. Okada, T , Furuhashi, N , Kuromori, Y , Miyashita, M , Iwata, F , and Harada, K . Plasma palmitoleic acid content and obesity in children. Am J Clin Nutr (2005) 82:747–50. doi: 10.1093/ajcn/82.4.747
26. Kang, M , Lee, A , Yoo, HJ , Kim, M , Kim, M , Shin, DY, et al. Association between increased visceral fat area and alterations in plasma fatty acid profile in overweight subjects: a cross-sectional study. Lipids Health Dis (2017) 16:248. doi: 10.1186/s12944-017-0642-z
27. Alsharari, ZD , Risérus, U , Leander, K , Sjögren, P , Carlsson, AC , Vikström, M, et al. Serum fatty acids, desaturase activities and abdominal obesity – a population-based study of 60-year old men and women. PLoS One (2017) 12:e0170684. doi: 10.1371/journal.pone.0170684
28. Jumpertz, R , Guijarro, A , Pratley, RE , Mason, CC , Piomelli, D , and Krakoff, J . Associations of fatty acids in cerebrospinal fluid with peripheral glucose concentrations and energy metabolism. PLoS One (2012) 7:1–8. doi: 10.1371/journal.pone.0041503
29. Rodríguez, Y , and Christophe, AB . Long-chain ω6 polyunsaturated fatty acids in erythrocyte phospholipids are associated with insulin resistance in non-obese type 2 diabetics. Clin Chim Acta (2005) 354:195–9. doi: 10.1016/j.cccn.2004.11.018
30. Cho, JS , Baek, SH , Kim, JY , Lee, JH , and Kim, OY . Serum phospholipid monounsaturated fatty acid composition and Δ-9-desaturase activity are associated with early alteration of fasting glycemic status. Nutr Res (2014) 34:733–41. doi: 10.1016/j.nutres.2014.08.005
31. Jacobs, S , Schiller, K , Jansen, E , Fritsche, A , Weikert, C , di Giuseppe, R, et al. Association between erythrocyte membrane fatty acids and biomarkers of dyslipidemia in the EPIC-Potsdam study. Eur J Clin Nutr (2014) 68:517–25. doi: 10.1038/ejcn.2014.18
32. Warensjö, E , Risérus, U , and Vessby, B . Fatty acid composition of serum lipids predicts the development of the metabolic syndrome in men. Diabetologia (2005) 48:1999–2005. doi: 10.1007/s00125-005-1897-x
33. Murakami, K , Sasaki, S , Takahashi, Y , Uenishi, K , Watanabe, T , Kohri, T, et al. Lower estimates of delta-5 desaturase and elongase activity are related to adverse profiles for several metabolic risk factors in young Japanese women. Nutr Res (2008) 28:816–24. doi: 10.1016/j.nutres.2008.08.009
34. Steffen, LM , Vessby, B , Jacobs, DRJ , Steinberger, J , Moran, A , Hong, C-P, et al. Serum phospholipid and cholesteryl ester fatty acids and estimated desaturase activities are related to overweight and cardiovascular risk factors in adolescents. Int J Obes (2008) 32:1297–304. doi: 10.1038/ijo.2008.89
35. Do, HJ , Chung, HK , Moon, J , and Shin, M-J . Relationship between the estimates of desaturase activities and cardiometabolic phenotypes in Koreans. J Clin Biochem Nutr (2011) 49:131–5. doi: 10.3164/jcbn.10-147
36. Zong, G , Zhu, J , Sun, L , Ye, X , Lu, L , Jin, Q, et al. Associations of erythrocyte fatty acids in the de novo lipogenesis pathway with risk of metabolic syndrome in a cohort study of middle-aged and older Chinese. Am J Clin Nutr (2013) 98:319–26. doi: 10.3945/ajcn.113.061218
37. Mayneris-Perxachs, J , Guerendiain, M , Castellote, AI , Estruch, R , Covas, MI , Fitó, M, et al. Plasma fatty acid composition, estimated desaturase activities, and their relation with the metabolic syndrome in a population at high risk of cardiovascular disease. Clin Nutr (2014) 33:90–7. doi: 10.1016/j.clnu.2013.03.001
38. Bermúdez-Cardona, J , and Velásquez-Rodríguez, C . Profile of free fatty acids and fractions of phospholipids, cholesterol esters and triglycerides in serum of obese youth with and without metabolic syndrome. Nutrients (2016) 8:54. doi: 10.3390/nu8020054
39. Svendsen, K , Olsen, T , Nordstrand Rusvik, TC , Ulven, SM , Holven, KB , Retterstøl, K, et al. Fatty acid profile and estimated desaturase activities in whole blood are associated with metabolic health. Lipids Health Dis (2020) 19:102. doi: 10.1186/s12944-020-01282-y
40. Jacobs, S , Jäger, S , Jansen, E , Peter, A , Stefan, N , Boeing, H, et al. Associations of erythrocyte fatty acids in the de novo lipogenesis pathway with proxies of liver fat accumulation in the EPIC-Potsdam Study. PLoS One (2015) 10:e0127368. doi: 10.1371/journal.pone.0127368
41. Alhazmi, A , Stojanovski, E , Garg, ML , and McEvoy, M . Fasting whole blood fatty acid profile and risk of type 2 diabetes in adults: a nested case control study. PLoS One (2014) 9:e97001. doi: 10.1371/journal.pone.0097001
42. Ma, W , Wu, JHY , Wang, Q , Lemaitre, RN , Mukamal, KJ , Djoussé, L, et al. Prospective association of fatty acids in the de novo lipogenesis pathway with risk of type 2 diabetes: the Cardiovascular Health Study. Am J Clin Nutr (2015) 101:153–63. doi: 10.3945/ajcn.114.092601
43. Akter, S , Kurotani, K , Sato, M , Hayashi, T , Kuwahara, K , Matsushita, Y, et al. High serum phospholipid dihomo-γ-linoleic acid concentration and low Δ5-desaturase activity are associated with increased risk of type 2 diabetes among Japanese adults in the hitachi health study. J Nutr (2017) 147:1558–66. doi: 10.3945/jn.117.248997
44. Sobczak, AIS , Blindauer, CA , and Stewart, AJ . Changes in plasma free fatty acids associated with type-2 diabetes. Nutrients (2019) 11:2022. doi: 10.3390/nu11092022
45. Chow, LS , Li, S , Eberly, LE , Seaquist, ER , Eckfeldt, JH , Hoogeveen, RC, et al. Estimated plasma stearoyl co-a desaturase-1 activity and risk of incident diabetes: the atherosclerosis risk in communities (ARIC) study. Metabolism (2013) 62:100–8. doi: 10.1016/j.metabol.2012.06.004
46. Tilvis, RS , and Miettinen, TA . Fatty acid compositions of serum lipids, erythrocytes, and platelets in insulin-dependent diabetic women. J Clin Endocrinol Metab (1985) 61:741–5. doi: 10.1210/jcem-61-4-741
47. Park, Y , Park, S , Yi, H , Kim, HY , Kang, S-J , Kim, J, et al. Low level of n-3 polyunsaturated fatty acids in erythrocytes is a risk factor for both acute ischemic and hemorrhagic stroke in Koreans. Nutr Res (2009) 29:825–30. doi: 10.1016/j.nutres.2009.10.018
48. Lee, Y , Lai, HTM , de Oliveira Otto, MC , Lemaitre, RN , McKnight, B , King, IB, et al. Serial biomarkers of de novo lipogenesis fatty acids and incident heart failure in older adults: the cardiovascular health study. J Am Heart Assoc (2020) 9:e014119. doi: 10.1161/JAHA.119.014119
49. Nilsen, DWT , Myhre, PL , Kalstad, A , Schmidt, EB , Arnesen, H , and Seljeflot, I . Serum levels of dihomo-gamma (γ)-linolenic acid (DGLA) are inversely associated with linoleic acid and total death in elderly patients with a recent myocardial infarction. Nutrients (2021) 13:3475. doi: 10.3390/nu13103475
50. Merino, DM , Ma, DWL , and Mutch, DM . Genetic variation in lipid desaturases and its impact on the development of human disease. Lipids Health Dis (2010) 9:63. doi: 10.1186/1476-511X-9-63
51. Lankinen, M , Uusitupa, M , and Schwab, U . Genes and dietary fatty acids in regulation of fatty acid composition of plasma and erythrocyte membranes. Nutrients (2018) 10:1785. doi: 10.3390/nu10111785
52. Kunesová, M , Hainer, V , Tvrzicka, E , Phinney, SD , Stich, V , Parízková, J, et al. Assessment of dietary and genetic factors influencing serum and adipose fatty acid composition in obese female identical twins. Lipids (2002) 37:27–32. doi: 10.1007/s11745-002-0860-z
53. de Groot, RHM , Emmett, R , and Meyer, BJ . Non-dietary factors associated with n-3 long-chain PUFA levels in humans - a systematic literature review. Br J Nutr (2019) 121:793–808. doi: 10.1017/S0007114519000138
54. Lohner, S , Fekete, K , Marosvölgyi, T , and Decsi, T . Gender differences in the long-chain polyunsaturated fatty acid status: systematic review of 51 publications. Ann Nutr Metab (2013) 62:98–112. doi: 10.1159/000345599
55. Abdelmagid, SA , Clarke, SE , Nielsen, DE , Badawi, A , El-Sohemy, A , Mutch, DM, et al. Comprehensive profiling of plasma fatty acid concentrations in young healthy Canadian adults. PLoS One (2015) 10:e0116195. doi: 10.1371/journal.pone.0116195
56. Xiang, M , Rahman, MA , Ai, H , Li, X , and Harbige, LS . Diet and gene expression: delta-5 and delta-6 desaturases in healthy Chinese and European subjects. Ann Nutr Metab (2006) 50:492–8. doi: 10.1159/000095829
57. Sergeant, S , Hugenschmidt, CE , Rudock, ME , Ziegler, JT , Ivester, P , Ainsworth, HC, et al. Differences in arachidonic acid levels and fatty acid desaturase (FADS) gene variants in African Americans and European Americans with diabetes or the metabolic syndrome. Br J Nutr (2012) 107:547–55. doi: 10.1017/S0007114511003230
58. Beyene, HB , Olshansky, G , T Smith, AA , Giles, C , Huynh, K , Cinel, M, et al. High-coverage plasma lipidomics reveals novel sex-specific lipidomic fingerprints of age and BMI: evidence from two large population cohort studies. PLoS Biol (2020) 18:e3000870. doi: 10.1371/journal.pbio.3000870
59. Harris, WS , Pottala, JV , Varvel, SA , Borowski, JJ , Ward, JN , and McConnell, JP . Erythrocyte omega-3 fatty acids increase and linoleic acid decreases with age: observations from 160,000 patients. Prostaglandins Leukot Essent Fatty Acids (2013) 88:257–63. doi: 10.1016/j.plefa.2012.12.004
60. Swenne, I , and Vessby, B . Relationship of Δ(6) -desaturase and Δ(5) -desaturase activities with thyroid hormone status in adolescents with eating disorders and weight loss. Acta Paediatr (2013) 102:416–8. doi: 10.1111/apa.12132
61. Fuhrman, BJ , Barba, M , Krogh, V , Micheli, A , Pala, V , Lauria, R, et al. Erythrocyte membrane phospholipid composition as a biomarker of dietary fat. Ann Nutr Metab (2006) 50:95–102. doi: 10.1159/000090496
62. Giltay, EJ , Gooren, LJG , Toorians, AWFT , Katan, MB , and Zock, PL . Docosahexaenoic acid concentrations are higher in women than in men because of estrogenic effects. Am J Clin Nutr (2004) 80:1167–74. doi: 10.1093/ajcn/80.5.1167
63. Giltay, EJ , Duschek, EJJ , Katan, MB , Zock, PL , Neele, SJ , and Netelenbos, JC . Raloxifene and hormone replacement therapy increase arachidonic acid and docosahexaenoic acid levels in postmenopausal women. J Endocrinol (2004) 182:399–408. doi: 10.1677/joe.0.1820399
64. Gonzalez-Soto, M , and Mutch, DM . Diet regulation of long-chain PUFA synthesis: role of macronutrients, micronutrients, and polyphenols on Δ-5/Δ-6 desaturases and elongases 2/5. Adv Nutr (2021) 12:980–94. doi: 10.1093/advances/nmaa142
65. Pavithra, N , Bannikoppa, PS , Uthappa, S , Kurpad, AV , and Mani, I . Plasma fatty acid composition and estimated desaturase activities reflect dietary patterns in subjects with metabolic syndrome. Indian J Clin Biochem (2018) 33:290–6. doi: 10.1007/s12291-017-0674-1
66. Wang, C , Woods, SE , Gonzalez-Soto, M , and Mutch, DM . Lipids | nutritional regulation of fatty acid desaturases In: J Jez , editor. Encyclopedia of biological chemistry III. 3rd ed. Oxford: Elsevier (2021). 707–18.
67. Poppitt, SD , Kilmartin, P , Butler, P , and Keogh, GF . Assessment of erythrocyte phospholipid fatty acid composition as a biomarker for dietary MUFA, PUFA or saturated fatty acid intake in a controlled cross-over intervention trial. Lipids Health Dis (2005) 4:30. doi: 10.1186/1476-511X-4-30
68. Nandi, A , Wadhwani, N , and Joshi, SR . Vitamin D deficiency influences fatty acid metabolism. Prostaglandins Leukot Essent Fatty Acids (2019) 140:57–63. doi: 10.1016/j.plefa.2018.11.014
69. Wu, Y , Baylin, A , and Colacino, JA . Iron, oxidative stress, and Δ9 Stearoyl-CoenzymeA desaturase index (C16:1/C16:0): an analysis applying the national health and nutrition examination survey 2003-04. Curr Dev Nutr (2018) 2:1–8. doi: 10.1093/cdn/nzx0001
70. Knez, M , Stangoulis, JCR , Zec, M , Debeljak-Martacic, J , Pavlovic, Z , Gurinovic, M, et al. An initial evaluation of newly proposed biomarker of zinc status in humans - linoleic acid: dihomo-γ-linolenic acid (LA:DGLA) ratio. Clin Nutr ESPEN (2016) 15:85–92. doi: 10.1016/j.clnesp.2016.06.013
71. Chimhashu, T , Malan, L , Baumgartner, J , van Jaarsveld, PJ , Galetti, V , Moretti, D, et al. Sensitivity of fatty acid desaturation and elongation to plasma zinc concentration: a randomised controlled trial in Beninese children. Br J Nutr (2018) 119:610–9. doi: 10.1017/S000711451700366X
72. Pokimica, B , García-Conesa, M-T , Zec, M , Debeljak-Martačić, J , Ranković, S , Vidović, N, et al. Chokeberry juice containing polyphenols does not affect cholesterol or blood pressure but modifies the composition of plasma phospholipids fatty acids in individuals at cardiovascular risk. Nutrients (2019) 11:850. doi: 10.3390/nu11040850
73. Hernández, MC , Rojas, P , Carrasco, F , Basfi-Fer, K , Valenzuela, R , Codoceo, J, et al. Fatty acid desaturation in red blood cell membranes of patients with type 2 diabetes is improved by zinc supplementation. J Trace Elem Med Biol organ Soc Miner Trace Elem (2020) 62:126571. doi: 10.1016/j.jtemb.2020.126571
74. Skeie, E , Strand, E , Pedersen, ER , Bjørndal, B , Bohov, P , Berge, RK, et al. Circulating B-vitamins and smoking habits are associated with serum polyunsaturated fatty acids in patients with suspected coronary heart disease: a cross-sectional study. PLoS One (2015) 10:e0129049. doi: 10.1371/journal.pone.0129049
75. Mika, A , Macaluso, F , Barone, R , Di Felice, V , and Sledzinski, T . Effect of exercise on fatty acid metabolism and adipokine secretion in adipose tissue. Front Physiol (2019) 10:26. doi: 10.3389/fphys.2019.00026
76. Risé, P , Ghezzi, S , Manzoni, C , Colombo, C , and Galli, C . The in vitro effects of cigarette smoke on fatty acid metabolism are partially counteracted by simvastatin. Prostaglandins Leukot Essent Fatty Acids (2009) 80:71–5. doi: 10.1016/j.plefa.2008.11.005
77. Lee, JJ , Lambert, JE , Hovhannisyan, Y , Ramos-Roman, MA , Trombold, JR , Wagner, DA, et al. Palmitoleic acid is elevated in fatty liver disease and reflects hepatic lipogenesis. Am J Clin Nutr (2015) 101:34–43. doi: 10.3945/ajcn.114.092262
78. Peter, A , Cegan, A , Wagner, S , Lehmann, R , Stefan, N , Königsrainer, A, et al. Hepatic lipid composition and stearoyl-coenzyme A desaturase 1 mRNA expression can be estimated from plasma VLDL fatty acid ratios. Clin Chem (2009) 55:2113–20. doi: 10.1373/clinchem.2009.127274
79. Su, HM , and Brenna, JT . Simultaneous measurement of desaturase activities using stable isotope tracers or a nontracer method. Anal Biochem (1998) 261:43–50. doi: 10.1006/abio.1998.2706
80. Sergeant, S , Rahbar, E , and Chilton, FH . Gamma-linolenic acid, Dihommo-gamma linolenic, eicosanoids and inflammatory processes. Eur J Pharmacol (2016) 785:77–86. doi: 10.1016/j.ejphar.2016.04.020
81. Furtado, JD , Beqari, J , and Campos, H . Comparison of the utility of total plasma fatty acids versus those in cholesteryl ester, phospholipid, and triglyceride as biomarkers of fatty acid intake. Nutrients (2019) 11:2081. doi: 10.3390/nu11092081
82. Risé, P , Eligini, S , Ghezzi, S , Colli, S , and Galli, C . Fatty acid composition of plasma, blood cells and whole blood: relevance for the assessment of the fatty acid status in humans. Prostaglandins Leukot Essent Fatty Acids (2007) 76:363–9. doi: 10.1016/j.plefa.2007.05.003
83. Stark, KD , Aristizabal Henao, JJ , Metherel, AH , and Pilote, L . Translating plasma and whole blood fatty acid compositional data into the sum of eicosapentaenoic and docosahexaenoic acid in erythrocytes. Prostaglandins Leukot Essent Fatty Acids (2016) 104:1–10. doi: 10.1016/j.plefa.2015.11.002
84. Vessby, B , Gustafsson, I-B , Tengblad, S , and Berglund, L . Indices of fatty acid desaturase activity in healthy human subjects: effects of different types of dietary fat. Br J Nutr (2013) 110:871–9. doi: 10.1017/S0007114512005934
85. Sparkes, C , Sinclair, AJ , Gibson, RA , Else, PL , and Meyer, BJ . High variability in erythrocyte, plasma and whole blood EPA and DHA levels in response to supplementation. Nutrients (2020) 12:1017. doi: 10.3390/nu12041017
86. Song, Y , and Jensen, MD . Red blood cell triglycerides-a unique pool that incorporates plasma-free fatty acids and relates to metabolic health. J Lipid Res (2021) 62:100131. doi: 10.1016/j.jlr.2021.100131
87. Hodson, L , Eyles, HC , McLachlan, KJ , Bell, ML , Green, TJ , and Skeaff, CM . Plasma and erythrocyte fatty acids reflect intakes of saturated and n-6 PUFA within a similar time frame. J Nutr (2014) 144:33–41. doi: 10.3945/jn.113.183749
88. Martorell, M , Pons, V , Domingo, JC , Capó, X , Sureda, A , Drobnic, F, et al. Erythrocytes and skeletal muscle unsaturated and omega-6 fatty acids are positively correlated after caloric restriction and exercise. Ann Nutr Metab (2018) 72:126–33. doi: 10.1159/000486553
89. Hodson, L , Skeaff, CM , and Fielding, BA . Fatty acid composition of adipose tissue and blood in humans and its use as a biomarker of dietary intake. Prog Lipid Res (2008) 47:348–80. doi: 10.1016/j.plipres.2008.03.003
90. Bystrická, Z , and Ďuračková, Z . Gas chromatography determination of fatty acids in the human erythrocyte membranes – a review. Prostaglandins Leukot Essent Fat Acids (2016) 115:35–40. doi: 10.1016/j.plefa.2016.09.007
91. Brenna, JT , Plourde, M , Stark, KD , Jones, PJ , and Lin, Y-H . Best practices for the design, laboratory analysis, and reporting of trials involving fatty acids. Am J Clin Nutr (2018) 108:211–27. doi: 10.1093/ajcn/nqy089
92. Karpe, F , and Hodson, L . Caution on the interpretation of plasma fatty acid composition as a proxy marker for SCD1 activity: particular implications for using the 16:1/16:0 ratio in QTL studies involving hyperlipidemic patients. Arterioscler Thromb Vasc Biol (2008) 28:e152; author reply e153. doi: 10.1161/ATVBAHA.108.167718
93. Sjögren, P , Sierra-Johnson, J , Gertow, K , Rosell, M , Vessby, B , de Faire, U, et al. Fatty acid desaturases in human adipose tissue: relationships between gene expression, desaturation indexes and insulin resistance. Diabetologia (2008) 51:328–35. doi: 10.1007/s00125-007-0876-9
94. Yashiro, H , Takagahara, S , Tamura, YO , Miyahisa, I , Matsui, J , Suzuki, H, et al. A novel selective inhibitor of Delta-5 desaturase lowers insulin resistance and reduces body weight in diet-induced obese C57BL/6J mice. PLoS One (2016) 11:1–18. doi: 10.1371/journal.pone.0166198
95. Thomas, T , Cendali, F , Fu, X , Gamboni, F , Morrison, EJ , Beirne, J, et al. Fatty acid desaturase activity in mature red blood cells and implications for blood storage quality. Transfusion (2021) 61:1867–83. doi: 10.1111/trf.16402
96. Stefanoni, D , Fu, X , Reisz, JA , Kanias, T , Nemkov, T , Page, GP, et al. Nicotine exposure increases markers of oxidant stress in stored red blood cells from healthy donor volunteers. Transfusion (2020) 60:1160–74. doi: 10.1111/trf.15812
97. Zhao, L , Ni, Y , Ma, X , Zhao, A , Bao, Y , Liu, J, et al. A panel of free fatty acid ratios to predict the development of metabolic abnormalities in healthy obese individuals. Sci Rep (2016) 6:28418. doi: 10.1038/srep28418
98. Ni, Y , Zhao, L , Yu, H , Ma, X , Bao, Y , Rajani, C, et al. Circulating unsaturated fatty acids delineate the metabolic status of obese individuals. EBioMedicine (2015) 2:1513–22. doi: 10.1016/j.ebiom.2015.09.004
99. Petersson, H , Arnlöv, J , Zethelius, B , and Risérus, U . Serum fatty acid composition and insulin resistance are independently associated with liver fat markers in elderly men. Diabetes Res Clin Pract (2010) 87:379–84. doi: 10.1016/j.diabres.2009.11.019
100. Radetti, G , Fanolla, A , Grugni, G , Lupi, F , Tamini, S , Cicolini, S, et al. The role of different indexes of adiposity and body composition for the identification of metabolic syndrome in women with obesity. J Clin Med (2021) 10:1975. doi: 10.3390/jcm10091975
101. Sansone, A , Tolika, E , Louka, M , Sunda, V , Deplano, S , Melchiorre, M, et al. Hexadecenoic fatty acid isomers in human blood lipids and their relevance for the interpretation of lipidomic profiles. PLoS One (2016) 11:1–14. doi: 10.1371/journal.pone.0152378
102. Nakayama, K , Bayasgalan, T , Tazoe, F , Yanagisawa, Y , Gotoh, T , Yamanaka, K, et al. A single nucleotide polymorphism in the FADS1/FADS2 gene is associated with plasma lipid profiles in two genetically similar Asian ethnic groups with distinctive differences in lifestyle. Hum Genet (2010) 127:685–90. doi: 10.1007/s00439-010-0815-6
103. Shiwaku, K , Hashimoto, M , Kitajima, K , Nogi, A , Anuurad, E , Enkhmaa, B, et al. Triglyceride levels are ethnic-specifically associated with an index of stearoyl-CoA desaturase activity and n-3 PUFA levels in Asians. J Lipid Res (2004) 45:914–22. doi: 10.1194/jlr.M300483-JLR200
104. Chung, ST , Cravalho, CKL , Meyers, AG , Courville, AB , Yang, S , Matthan, NR, et al. Triglyceride paradox is related to lipoprotein size, visceral adiposity and Stearoyl-CoA desaturase activity in Black versus white women. Circ Res (2020) 126:94–108. doi: 10.1161/CIRCRESAHA.119.315701
105. Weir, NL , Nomura, SO , Steffen, BT , Guan, W , Karger, AB , Klein, R, et al. Associations between omega-6 polyunsaturated fatty acids, hyperinsulinemia and incident diabetes by race/ethnicity: the multi-ethnic study of atherosclerosis. Clin Nutr (2020) 39:3031–41. doi: 10.1016/j.clnu.2020.01.003
106. Liu, YW , Medeiros, LC , Revesz, E , and O’Dorisio, TM . Desaturation function does not decline after menopause in human females. Horm Metab Res Suppl (2000) 32:26–32. doi: 10.1055/s-2007-978581
107. Knez, M , Stangoulis, JCR , Glibetic, M , and Tako, E . The linoleic acid: dihomo-γ-linolenic acid ratio (LA:DGLA)-an emerging biomarker of Zn status. Nutrients (2017) 9:825. doi: 10.3390/nu9080825
108. Negida, A . Sample size calculation guide - part 7: how to calculate the sample size based on a correlation. Adv J Emerg Med (2020) 4:e34. doi: 10.22114/ajem.v0i0.344
109. European Food Safety Authority . Guidance on the EU menu methodology. EFSA J (2014) 12:3944. doi: 10.2903/j.efsa.2014.3944
110. World Health Organisation . WHO | waist circumference and waist–hip ratio. Report of a WHO Expert Consultation. Geneva, (2008) 8–11.
111. Pietrobelli, A , Rubiano, F , St-Onge, M-P , and Heymsfield, SB . New bioimpedance analysis system: improved phenotyping with whole-body analysis. Eur J Clin Nutr (2004) 58:1479–84. doi: 10.1038/sj.ejcn.1601993
112. World Health Organization . Obesity: Preventing and managing the global epidemic: Report of a WHO consultation on obesity. Geneva: WHO/NUT/NCD/98.1 (1998).
113. Yoo, E-G . Waist-to-height ratio as a screening tool for obesity and cardiometabolic risk. Korean J Pediatr (2016) 59:425–31. doi: 10.3345/kjp.2016.59.11.425
114. Chobanian, AV , Bakris, GL , Black, HR , Cushman, WC , Green, LA , Izzo, JL, et al. Seventh report of the joint national committee on prevention, detection, evaluation, and treatment of high blood pressure. Hypertension (2003) 42:1206–52. doi: 10.1161/01.HYP.0000107251.49515.c2
115. American Diabetes Association . 2. Classification and diagnosis of diabetes. Diabetes Care (2016) 39:S13–22. doi: 10.2337/dc16-S005
116. National Cholesterol Education Program’s . Expert panel on detection, evaluation, and treatment of high blood cholesterol in adults. Executive summary of the third report of the national cholesterol education program (NCEP) expert panel on detection, evaluation, and treatment of high blood Cholest. JAMA (2001) 285:2486–97. doi: 10.1001/jama.285.19.2486
117. Gasevic, D , Frohlich, J , Mancini, GJ , and Lear, SA . Clinical usefulness of lipid ratios to identify men and women with metabolic syndrome: a cross-sectional study. Lipids Health Dis (2014) 13:159. doi: 10.1186/1476-511X-13-159
118. Hodson, L , Skeaff, CM , Wallace, AJ , and Arribas, GLB . Stability of plasma and erythrocyte fatty acid composition during cold storage. Clin Chim Acta (2002) 321:63–7. doi: 10.1016/s0009-8981(02)00100-6
119. Rose, HG , and Oklander, M . Improved procedure for the extraction of lipids from human erythrocytes. J Lipid Res (1965) 6:428–31. doi: 10.1016/S0022-2275(20)39314-7
120. Rasic-Milutinovic, Z , Popovic, T , Perunicic-Pekovic, G , Arsic, A , Borozan, S , and Glibetic, M . Lower serum paraoxonase-1 activity is related to linoleic and docosahexanoic fatty acids in type 2 diabetic patients. Arch Med Res (2012) 43:75–82. doi: 10.1016/j.arcmed.2011.12.008
121. Harris, WS , and Von Schacky, C . The Omega-3 index: a new risk factor for death from coronary heart disease? Prev Med (Baltim) (2004) 39:212–20. doi: 10.1016/j.ypmed.2004.02.030
122. Gómez Candela, C , Bermejo López, LM , and Loria, KV . Importance of a balanced omega 6/omega 3 ratio for the maintenance of health: nutritional recommendations. Nutr Hosp (2011) 26:323–9. doi: 10.1590/S0212-16112011000200013
123. Nikolić, M , Milešević, J , Zeković, M , Gurinović, M , and Glibetić, M . The development and validation of food atlas for portion size estimation in the Balkan region. Front Nutr (2018) 5:78. doi: 10.3389/fnut.2018.00078
124. Gurinović, M , Milešević, J , Kadvan, A , Nikolić, M , Zeković, M , Djekić-Ivanković, M, et al. Development, features and application of DIET ASSESS & PLAN (DAP) software in supporting public health nutrition research in Central Eastern European Countries (CEEC). Food Chem (2018) 238:186–94. doi: 10.1016/j.foodchem.2016.09.114
125. Gurinović, M , Milešević, J , Kadvan, A , Djekić-Ivanković, M , Debeljak-Martačić, J , Takić, M, et al. Establishment and advances in the online Serbian food and recipe data base harmonized with EuroFIR™ standards. Food Chem (2016) 193:30–8. doi: 10.1016/j.foodchem.2015.01.107
126. Feng, C , Wang, H , Lu, N , Chen, T , He, H , Lu, Y, et al. Log-transformation and its implications for data analysis. Shanghai Arch Psychiatry (2014) 26:105–9. doi: 10.3969/j.issn.1002-0829.2014.02.009
127. Muller, H-G . Weighted local regression and kernel methods for nonparametric curve fitting. J Am Stat Assoc (1987) 82:231–8. doi: 10.2307/2289159
128. Jafari, M , and Ansari-Pour, N . Why, when and how to adjust your P values? Cell J (2019) 20:604–7. doi: 10.22074/cellj.2019.5992
129. Wolters, M , Schlenz, H , Börnhorst, C , Risé, P , Galli, C , Moreno, LA, et al. Desaturase activity is associated with weight status and metabolic risk markers in young children. J Clin Endocrinol Metab (2015) 100:3760–9. doi: 10.1210/jc.2015-2693
130. Bonafini, S , Giontella, A , Tagetti, A , Bresadola, I , Gaudino, R , Cavarzere, P, et al. Fatty acid profile and desaturase activities in 7–10-year-old children attending primary School in Verona South District: association between palmitoleic acid, SCD-16, indices of adiposity, and blood pressure. Int J Mol Sci (2020) 21:3899. doi: 10.3390/ijms21113899
131. Yang, B , Ding, F , Wang, F-L , Yan, J , Ye, X-W , Yu, W, et al. Association of serum fatty acid and estimated desaturase activity with hypertension in middle-aged and elderly Chinese population. Sci Rep (2016) 6:23446. doi: 10.1038/srep23446
132. Ballestri, S , Nascimbeni, F , Baldelli, E , Marrazzo, A , Romagnoli, D , and Lonardo, A . NAFLD as a sexual dimorphic disease: role of gender and reproductive status in the development and progression of nonalcoholic fatty liver disease and inherent cardiovascular risk. Adv Ther (2017) 34:1291–326. doi: 10.1007/s12325-017-0556-1
133. Mathias, RA , Sergeant, S , Ruczinski, I , Torgerson, DG , Hugenschmidt, CE , Kubala, M, et al. The impact of FADS genetic variants on ω6 polyunsaturated fatty acid metabolism in African Americans. BMC Genet (2011) 12:50. doi: 10.1186/1471-2156-12-50
134. Merino, DM , Johnston, H , Clarke, S , Roke, K , Nielsen, D , Badawi, A, et al. Polymorphisms in FADS1 and FADS2 alter desaturase activity in young Caucasian and Asian adults. Mol Genet Metab (2011) 103:171–8. doi: 10.1016/j.ymgme.2011.02.012
135. Attie, AD , Krauss, RM , Gray-Keller, MP , Brownlie, A , Miyazaki, M , Kastelein, JJ, et al. Relationship between stearoyl-CoA desaturase activity and plasma triglycerides in human and mouse hypertriglyceridemia. J Lipid Res (2002) 43:1899–907. doi: 10.1194/jlr.m200189-jlr200
136. Rondanelli, M , Klersy, C , Perna, S , Faliva, MA , Montorfano, G , Roderi, P, et al. Effects of two-months balanced diet in metabolically healthy obesity: lipid correlations with gender and BMI-related differences. Lipids Health Dis (2015) 14:139. doi: 10.1186/s12944-015-0131-1
137. Lee, YJ , Lee, A , Yoo, HJ , Kim, M , Kim, M , Jee, SH, et al. Effect of weight loss on circulating fatty acid profiles in overweight subjects with high visceral fat area: a 12-week randomized controlled trial. Nutr J (2018) 17:28. doi: 10.1186/s12937-018-0323-4
138. Xu, L , Zou, X , Gao, Z , Mao, C , Su, H , Li, C, et al. Improved fatty acid profile reduces body fat and arterial stiffness in obese adolescents upon combinatorial intervention with exercise and dietary restriction. J Exerc Sci Fit (2021) 19:234–40. doi: 10.1016/j.jesf.2021.08.003
139. Kunesová, M , Phinney, S , Hainer, V , Tvrzická, E , Stich, V , Parízková, J, et al. The responses of serum and adipose fatty acids to a one-year weight reduction regimen in female obese monozygotic twins. Ann N Y Acad Sci (2002) 967:311–23. doi: 10.1111/j.1749-6632.2002.tb04286.x
140. Maciejewska, D , Marlicz, W , Ryterska, K , Banaszczak, M , Jamioł-Milc, D , and Stachowska, E . Changes of the fatty acid profile in erythrocyte membranes of patients following 6-month dietary intervention aimed at the regression of nonalcoholic fatty liver disease (NAFLD). Can J Gastroenterol Hepatol (2018) 2018:5856201. doi: 10.1155/2018/5856201
141. Valenzuela, R , Echeverria, F , Ortiz, M , Rincón-Cervera, MÁ , Espinosa, A , Hernandez-Rodas, MC, et al. Hydroxytyrosol prevents reduction in liver activity of Δ-5 and Δ-6 desaturases, oxidative stress, and depletion in long chain polyunsaturated fatty acid content in different tissues of high-fat diet fed mice. Lipids Health Dis (2017) 16:64. doi: 10.1186/s12944-017-0450-5
142. Valenzuela, R , Barrera, C , Espinosa, A , Llanos, P , Orellana, P , and Videla, LA . Reduction in the desaturation capacity of the liver in mice subjected to high fat diet: relation to LCPUFA depletion in liver and extrahepatic tissues. Prostaglandins Leukot Essent Fatty Acids (2015) 98:7–14. doi: 10.1016/j.plefa.2015.04.002
143. Hein, GJ , Bernasconi, AM , Montanaro, MA , Pellon-Maison, M , Finarelli, G , Chicco, A, et al. Nuclear receptors and hepatic lipidogenic enzyme response to a dyslipidemic sucrose-rich diet and its reversal by fish oil n-3 polyunsaturated fatty acids. Am J Physiol Endocrinol Metab (2010) 298:E429–39. doi: 10.1152/ajpendo.00513.2009
144. Mašek, T , Filipović, N , Vuica, A , and Starčević, K . Effects of treatment with sucrose in drinking water on liver histology, lipogenesis and lipogenic gene expression in rats fed high-fiber diet. Prostaglandins Leukot Essent Fat Acids (2017) 116:1–8. doi: 10.1016/j.plefa.2016.11.001
145. Takagahara, S , Shinohara, H , Itokawa, S , Satomi, Y , Ando, A , Yamamoto, T, et al. A novel orally available delta-5 desaturase inhibitor prevents atherosclerotic lesions accompanied by changes in fatty acid composition and eicosanoid production in ApoE knockout mice. J Pharmacol Exp Ther (2019) 371:290–8. doi: 10.1124/jpet.119.259846
146. López-Vicario, C , González-Périz, A , Rius, B , Morán-Salvador, E , García-Alonso, V , Lozano, JJ, et al. Molecular interplay between Δ5/Δ6 desaturases and long-chain fatty acids in the pathogenesis of non-alcoholic steatohepatitis. Gut (2014) 63:344–55. doi: 10.1136/gutjnl-2012-303179
147. Mauvoisin, D , and Mounier, C . Hormonal and nutritional regulation of SCD1 gene expression. Biochimie (2011) 93:78–86. doi: 10.1016/j.biochi.2010.08.001
148. O’Neill, LM , Miyazaki, M , Bond, LM , Lewis, SA , Ding, F , Liu, Z, et al. Chapter 6 - fatty acid desaturation and elongation in mammals In: ND Ridgway and RS McLeod, editors. Biochemistry of lipids, lipoproteins and membranes. 7th ed: Elsevier (2021). 201–26.
149. Wang, Y , Tang, Y , Ji, Y , Xu, W , Ullah, N , Yu, H, et al. Association between FADS1 rs174547 and levels of long-chain PUFA: a meta-analysis. Br J Nutr (2021) 126:1121–9. doi: 10.1017/S0007114520005103
150. Nakamura, MT , and Nara, TY . Structure, function, and dietary regulation of delta6, delta5, and delta9 desaturases. Annu Rev Nutr (2004) 24:345–76. doi: 10.1146/annurev.nutr.24.121803.063211
151. Matsuzaka, T , Shimano, H , Yahagi, N , Amemiya-Kudo, M , Yoshikawa, T , Hasty, AH, et al. Dual regulation of mouse Delta(5)- and Delta(6)-desaturase gene expression by SREBP-1 and PPARalpha. J Lipid Res (2002) 43:107–14. doi: 10.1016/S0022-2275(20)30193-0
152. Czech, MP , Tencerova, M , Pedersen, DJ , and Aouadi, M . Insulin signalling mechanisms for triacylglycerol storage. Diabetologia (2013) 56:949–64. doi: 10.1007/s00125-013-2869-1
153. Brown, MS , and Goldstein, JL . Selective versus total insulin resistance: a pathogenic paradox. Cell Metab (2008) 7:95–6. doi: 10.1016/J.CMET.2007.12.009
154. Brenner, RR . Hormonal modulation of delta6 and delta5 desaturases: case of diabetes. Prostaglandins Leukot Essent Fat Acids (2003) 68:151–62. doi: 10.1016/S0952-3278(02)00265-X
155. Brenner, R . Antagonism between type 1 and type 2 diabetes in unsaturated fatty acid biosynthesis. Fut Lipidol (2006) 1:631–40. doi: 10.2217/17460875.1.5.631
156. Poisson, JP . Comparative in vivo and in vitro study of the influence of experimental diabetes on rat liver linoleic acid delta 6- and delta 5-desaturation. Enzyme (1985) 34:1–14. doi: 10.1159/000469353
157. Arbo, I , Halle, C , Malik, D , Brattbakk, H-R , and Johansen, B . Insulin induces fatty acid desaturase expression in human monocytes. Scand J Clin Lab Invest (2011) 71:330–9. doi: 10.3109/00365513.2011.566350
158. Poisson, J-PG , and Cunnane, SC . Long-chain fatty acid metabolism in fasting and diabetes: relation between altered desaturase activity and fatty acid composition. J Nutr Biochem (1991) 2:60–70. doi: 10.1016/0955-2863(91)90030-9
159. Loizou, CL , Ozanne, SE , and Hales, CN . The effect of insulin on delta5 desaturation in hepG2 human hepatoma cells and L6 rat muscle myoblasts. Prostaglandins Leukot Essent Fatty Acids (1999) 61:89–95. doi: 10.1054/plef.1999.0076
160. Dang, AQ , Kemp, K , Faas, FH , and Carter, WJ . Effects of dietary fats on fatty acid composition and delta 5 desaturase in normal and diabetic rats. Lipids (1989) 24:882–9. doi: 10.1007/BF02535763
161. El Boustani, S , Causse, JE , Descomps, B , Monnier, L , Mendy, F , and de Paulet, A . Direct in vivo characterization of delta 5 desaturase activity in humans by deuterium labeling: effect of insulin. Metabolism (1989) 38:315–21. doi: 10.1016/0026-0495(89)90117-0
162. de Gómez Dumm, IN , de Alaniz, MJ , and Brenner, RR . Effect of insulin on the oxidative desaturation of fatty acids in non-diabetic rats and in isolated liver cells. Acta Physiol Pharmacol Latinoam (1985) 35:327–35.
163. Gallardo, N , Bonzón-Kulichenko, E , Fernández-Agulló, T , Moltó, E , Gómez-Alonso, S , Blanco, P, et al. Tissue-specific effects of central leptin on the expression of genes involved in lipid metabolism in liver and white adipose tissue. Endocrinology (2007) 148:5604–10. doi: 10.1210/en.2007-0933
164. Bonzón-Kulichenko, E , Schwudke, D , Gallardo, N , Moltó, E , Fernández-Agulló, T , Shevchenko, A, et al. Central leptin regulates total ceramide content and sterol regulatory element binding protein-1C proteolytic maturation in rat white adipose tissue. Endocrinology (2009) 150:169–78. doi: 10.1210/en.2008-0505
165. Cohen, P , and Friedman, JM . Leptin and the control of metabolism: role for Stearoyl-CoA Desaturase-1 (SCD-1). J Nutr (2004) 134:2455S–63S. doi: 10.1093/jn/134.9.2455S
166. Biddinger, SB , Miyazaki, M , Boucher, J , Ntambi, JM , and Kahn, CR . Leptin suppresses stearoyl-CoA desaturase 1 by mechanisms independent of insulin and sterol regulatory element-binding protein-1c. Diabetes (2006) 55:2032–41. doi: 10.2337/db05-0742
167. Gruzdeva, O , Borodkina, D , Uchasova, E , Dyleva, Y , and Barbarash, O . Leptin resistance: underlying mechanisms and diagnosis. Diabetes Metab Syndr Obes (2019) 12:191–8. doi: 10.2147/DMSO.S182406
168. Miyazaki, M , Dobrzyn, A , Sampath, H , Lee, S-H , Man, WC , Chu, K, et al. Reduced adiposity and liver steatosis by stearoyl-CoA desaturase deficiency are independent of peroxisome proliferator-activated receptor-alpha. J Biol Chem (2004) 279:35017–24. doi: 10.1074/jbc.M405327200
169. Brown, JM , and Rudel, LL . Stearoyl-coenzyme a desaturase 1 inhibition and the metabolic syndrome: considerations for future drug discovery. Curr Opin Lipidol (2010) 21:192–7. doi: 10.1097/MOL.0b013e32833854ac
170. Brown, JM , Chung, S , Sawyer, JK , Degirolamo, C , Alger, HM , Nguyen, T, et al. Inhibition of stearoyl-coenzyme A desaturase 1 dissociates insulin resistance and obesity from atherosclerosis. Circulation (2008) 118:1467–75. doi: 10.1161/CIRCULATIONAHA.108.793182
171. Miyazaki, M , Flowers, MT , Sampath, H , Chu, K , Otzelberger, C , Liu, X, et al. Hepatic stearoyl-CoA desaturase-1 deficiency protects mice from carbohydrate-induced adiposity and hepatic steatosis. Cell Metab (2007) 6:484–96. doi: 10.1016/j.cmet.2007.10.014
172. Aljohani, A , Khan, MI , Syed, DN , Abram, B , Lewis, S , Neill, LO, et al. Hepatic Stearoyl-CoA desaturase-1 deficiency-mediated activation of mTORC1- PGC-1α axis regulates ER stress during high-carbohydrate feeding. Sci Rep (2019) 9:15761. doi: 10.1038/s41598-019-52339-7
173. Sampath, H , and Ntambi, JM . The role of stearoyl-CoA desaturase in obesity, insulin resistance, and inflammation. Ann N Y Acad Sci (2011) 1243:47–53. doi: 10.1111/j.1749-6632.2011.06303.x
174. Burhans, MS , Flowers, MT , Harrington, KR , Bond, LM , Guo, C-A , Anderson, RM, et al. Hepatic oleate regulates adipose tissue lipogenesis and fatty acid oxidation. J Lipid Res (2015) 56:304–18. doi: 10.1194/jlr.M054429
175. Stoffel, W , Hammels, I , Jenke, B , Binczek, E , Schmidt-Soltau, I , Brodesser, S, et al. Obesity resistance and deregulation of lipogenesis in Δ6-fatty acid desaturase (FADS2) deficiency. EMBO Rep (2014) 15:110–20. doi: 10.1002/embr.201338041
176. Athinarayanan, S , Fan, Y-Y , Wang, X , Callaway, E , Cai, D , Chalasani, N, et al. Fatty acid desaturase 1 influences hepatic lipid homeostasis by modulating the PPARα-FGF21 Axis. Hepatol Commun (2021) 5:461–77. doi: 10.1002/hep4.1629
177. Suitor, K , Payne, GW , Sarr, O , Abdelmagid, S , Nakamura, MT , Ma, DW, et al. Neither linoleic acid nor arachidonic acid promote white adipose tissue inflammation in Fads2−/− mice fed low fat diets. Prostaglandins Leukot Essent Fatty Acids (2017) 126:84–91. doi: 10.1016/j.plefa.2017.09.008
178. Hayashi, Y , Lee-Okada, H-C , Nakamura, E , Tada, N , Yokomizo, T , Fujiwara, Y, et al. Ablation of fatty acid desaturase 2 (FADS2) exacerbates hepatic triacylglycerol and cholesterol accumulation in polyunsaturated fatty acid-depleted mice. FEBS Lett (2021) 595:1920–32. doi: 10.1002/1873-3468.14134
179. Stoffel, W , Binczek, E , Schmidt-Soltau, I , Brodesser, S , and Wegner, I . High fat / high cholesterol diet does not provoke atherosclerosis in the ω3-and ω6-polyunsaturated fatty acid synthesis-inactivated Δ6-fatty acid desaturase-deficient mouse. Mol Metab (2021) 54:101335. doi: 10.1016/j.molmet.2021.101335
180. Stoffel, W , Holz, B , Jenke, B , Binczek, E , Günter, RH , Kiss, C, et al. Delta6-desaturase (FADS2) deficiency unveils the role of omega3- and omega6-polyunsaturated fatty acids. EMBO J (2008) 27:2281–92. doi: 10.1038/emboj.2008.156
181. Fan, Y-Y , Monk, JM , Hou, TY , Callway, E , Vincent, L , Weeks, B, et al. Characterization of an arachidonic acid-deficient (Fads1 knockout) mouse model. J Lipid Res (2012) 53:1287–95. doi: 10.1194/jlr.M024216
182. Nakamura, MT , Cho, HP , and Clarke, SD . Regulation of hepatic Δ-6 desaturase expression and its role in the polyunsaturated fatty acid inhibition of fatty acid synthase gene expression in mice. J Nutr (2000) 130:1561–5. doi: 10.1093/jn/130.6.1561
183. Warensjö, E , Ingelsson, E , Lundmark, P , Lannfelt, L , Syvänen, A-C , Vessby, B, et al. Polymorphisms in the SCD1 gene: associations with body fat distribution and insulin sensitivity. Obesity (Silver Spring) (2007) 15:1732–40. doi: 10.1038/oby.2007.206
184. Martín-Núñez, GM , Cabrera-Mulero, R , Rojo-Martínez, G , Gómez-Zumaquero, JM , Chaves, FJ , de Marco, G, et al. Polymorphisms in the SCD1 gene are associated with indices of stearoyl CoA desaturase activity and obesity: a prospective study. Mol Nutr Food Res (2013) 57:2177–84. doi: 10.1002/mnfr.201300208
185. Gong, J , Campos, H , McGarvey, S , Wu, Z , Goldberg, R , and Baylin, A . Genetic variation in stearoyl-CoA desaturase 1 is associated with metabolic syndrome prevalence in Costa Rican adults. J Nutr (2011) 141:2211–8. doi: 10.3945/jn.111.143503
186. Staňková, B , Macášek, J , Zeman, M , Vecka, M , Tvrzická, E , Jáchymová, M, et al. Polymorphisms rs2167444 and rs508384 in the SCD1 gene are linked with high ApoB-48 levels and adverse profile of cardiometabolic risk factors. Folia Biol (Praha) (2019) 65:159–69.
187. Rudkowska, I , Julien, P , Couture, P , Lemieux, S , Tchernof, A , Barbier, O, et al. Cardiometabolic risk factors are influenced by Stearoyl-CoA Desaturase (SCD) -1 gene polymorphisms and n-3 polyunsaturated fatty acid supplementation. Mol Nutr Food Res (2014) 58:1079–86. doi: 10.1002/mnfr.201300426
188. Stryjecki, C , Roke, K , Clarke, S , Nielsen, D , Badawi, A , El-Sohemy, A, et al. Enzymatic activity and genetic variation in SCD1 modulate the relationship between fatty acids and inflammation. Mol Genet Metab (2012) 105:421–7. doi: 10.1016/j.ymgme.2011.12.003
189. Wang, L , Athinarayanan, S , Jiang, G , Chalasani, N , Zhang, M , and Liu, W . Fatty acid desaturase 1 gene polymorphisms control human hepatic lipid composition. Hepatology (2015) 61:119–28. doi: 10.1002/hep.27373
190. Tanaka, T , Shen, J , Abecasis, GR , Kisialiou, A , Ordovas, JM , Guralnik, JM, et al. Genome-wide association study of plasma polyunsaturated fatty acids in the InCHIANTI Study. PLoS Genet (2009) 5:e1000338. doi: 10.1371/journal.pgen.1000338
191. Martinelli, N , Girelli, D , Malerba, G , Guarini, P , Illig, T , Trabetti, E, et al. FADS genotypes and desaturase activity estimated by the ratio of arachidonic acid to linoleic acid are associated with inflammation and coronary artery disease. Am J Clin Nutr (2008) 88:941–9. doi: 10.1093/ajcn/88.4.941
192. de la Garza, PA , Montes Goyanes, R , Chisaguano Tonato, AM , Torres-Espínola, FJ , Arias García, M , de Almeida, L, et al. Association of maternal weight with FADS and ELOVL genetic variants and fatty acid levels – the PREOBE follow-up. PLoS One (2017) 12:e0179135. doi: 10.1371/journal.pone.0179135
193. Bokor, S , Dumont, J , Spinneker, A , Gonzalez-Gross, M , Nova, E , Widhalm, K, et al. Single nucleotide polymorphisms in the FADS gene cluster are associated with delta-5 and delta-6 desaturase activities estimated by serum fatty acid ratios. J Lipid Res (2010) 51:2325–33. doi: 10.1194/jlr.M006205
194. Guo, H , Zhang, L , Zhu, C , Yang, F , Wang, S , Zhu, S, et al. A single nucleotide polymorphism in the FADS1 gene is associated with plasma fatty acid and lipid profiles and might explain gender difference in body fat distribution. Lipids Health Dis (2017) 16:67. doi: 10.1186/s12944-017-0459-9
195. Yuan, S , and Larsson, SC . Association of genetic variants related to plasma fatty acids with type 2 diabetes mellitus and glycaemic traits: a Mendelian randomisation study. Diabetologia (2020) 63:116–23. doi: 10.1007/s00125-019-05019-0
196. Plaisier, CL , Horvath, S , Huertas-Vazquez, A , Cruz-Bautista, I , Herrera, MF , Tusie-Luna, T, et al. A systems genetics approach implicates USF1, FADS3, and other causal candidate genes for familial combined hyperlipidemia. PLoS Genet (2009) 5:1–10. doi: 10.1371/journal.pgen.1000642
197. Fumagalli, M , Moltke, I , Grarup, N , Racimo, F , Bjerregaard, P , Jørgensen, ME, et al. Greenlandic Inuit show genetic signatures of diet and climate adaptation. Science (2015) 349:1343–7. doi: 10.1126/science.aab2319
198. Wolters, M , Dering, C , Siani, A , Russo, P , Kaprio, J , Risé, P, et al. The role of a FADS1 polymorphism in the association of fatty acid blood levels, BMI and blood pressure in young children—analyses based on path models. PLoS One (2017) 12:1–17. doi: 10.1371/journal.pone.0181485
199. Kim, OY , Lim, HH , Yang, LI , Chae, JS , and Lee, JH . Fatty acid desaturase (FADS) gene polymorphisms and insulin resistance in association with serum phospholipid polyunsaturated fatty acid composition in healthy Korean men: cross-sectional study. Nutr Metab (Lond) (2011) 8:24. doi: 10.1186/1743-7075-8-24
200. Maguolo, A , Zusi, C , Giontella, A , Miraglia Del Giudice, E , Tagetti, A , Fava, C, et al. Influence of genetic variants in FADS2 and ELOVL2 genes on BMI and PUFAs homeostasis in children and adolescents with obesity. Int J Obes (2021) 45:56–65. doi: 10.1038/s41366-020-00662-9
201. Kwong, RY , Heydari, B , Ge, Y , Abdullah, S , Fujikura, K , Kaneko, K, et al. Genetic profiling of fatty acid desaturase polymorphisms identifies patients who may benefit from high-dose omega-3 fatty acids in cardiac remodeling after acute myocardial infarction-post-hoc analysis from the OMEGA-REMODEL randomized controlled trial. PLoS One (2019) 14:e0222061. doi: 10.1371/journal.pone.0222061
202. Dumont, J , Goumidi, L , Grenier-Boley, B , Cottel, D , Marécaux, N , Montaye, M, et al. Dietary linoleic acid interacts with FADS1 genetic variability to modulate HDL-cholesterol and obesity-related traits. Clin Nutr (2018) 37:1683–9. doi: 10.1016/j.clnu.2017.07.012
203. Huang, T , Wang, T , Heianza, Y , Wiggs, J , Sun, D , Choi, H-K, et al. Fish and marine fatty acids intakes, the FADS genotypes and long-term weight gain: a prospective cohort study. BMJ Open (2019) 9:e022877. doi: 10.1136/bmjopen-2018-022877
204. Liu, S , Zhi, H , Chen, P , Chen, W , Lu, F , Ma, G, et al. Fatty acid desaturase 1 polymorphisms are associated with coronary heart disease in a Chinese population. Chin Med J (2012) 125:801–6. doi: 10.3760/cma.j.issn.0366-6999.2012.05.014
205. Lankinen, MA , Fauland, A , Shimizu, B-I , Ågren, J , Wheelock, CE , Laakso, M, et al. Inflammatory response to dietary linoleic acid depends on FADS1 genotype. Am J Clin Nutr (2019) 109:165–75. doi: 10.1093/ajcn/nqy287
206. de Antueno, RJ , Elliot, M , and Horrobin, DF . Liver delta 5 and delta 6 desaturase activity differs among laboratory rat strains. Lipids (1994) 29:327–31. doi: 10.1007/BF02537185
207. Léveillé, P , Chouinard-Watkins, R , Windust, A , Lawrence, P , Cunnane, SC , Brenna, JT, et al. Metabolism of uniformly labeled (13)C-eicosapentaenoic acid and (13)C-arachidonic acid in young and old men. Am J Clin Nutr (2017) 106:467–74. doi: 10.3945/ajcn.117.154708
208. Turcotte, C , Chouinard, F , Lefebvre, JS , and Flamand, N . Regulation of inflammation by cannabinoids, the endocannabinoids 2-arachidonoyl-glycerol and arachidonoyl-ethanolamide, and their metabolites. J Leukoc Biol (2015) 97:1049–70. doi: 10.1189/jlb.3RU0115-021R
209. Hardwick, JP , Eckman, K , Lee, YK , Abdelmegeed, MA , Esterle, A , Chilian, WM, et al. Eicosanoids in metabolic syndrome. Adv Pharmacol (2013) 66:157–266. doi: 10.1016/B978-0-12-404717-4.00005-6
210. Kawashima, H . Intake of arachidonic acid-containing lipids in adult humans: dietary surveys and clinical trials. Lipids Health Dis (2019) 18:101. doi: 10.1186/s12944-019-1039-y
211. Tallima, H , and El Ridi, R . Arachidonic acid: physiological roles and potential health benefits - a review. J Adv Res (2018) 11:33–41. doi: 10.1016/j.jare.2017.11.004
212. Murff, HJ , and Edwards, TL . Endogenous production of long-chain polyunsaturated fatty acids and metabolic disease risk. Curr Cardiovasc Risk Rep (2014) 8:418. doi: 10.1007/s12170-014-0418-1
213. Zhou, L , and Nilsson, Å . Sources of eicosanoid precursor fatty acid pools in tissues. J Lipid Res (2001) 42:1521–42. doi: 10.1016/S0022-2275(20)32206-9
214. Rosell, MS , Lloyd-Wright, Z , Appleby, PN , Sanders, TAB , Allen, NE , and Key, TJ . Long-chain n–3 polyunsaturated fatty acids in plasma in British meat-eating, vegetarian, and vegan men. Am J Clin Nutr (2005) 82:327–34. doi: 10.1093/ajcn/82.2.327
215. Burns-Whitmore, B , Froyen, E , Heskey, C , Parker, T , and San, PG . Alpha-linolenic and linoleic fatty acids in the vegan diet: do they require dietary reference intake/adequate intake special consideration? Nutrients (2019) 11:2365. doi: 10.3390/nu11102365
216. Juan, J , Huang, H , Jiang, X , Ardisson Korat, AV , Song, M , Sun, Q, et al. Joint effects of fatty acid desaturase 1 polymorphisms and dietary polyunsaturated fatty acid intake on circulating fatty acid proportions. Am J Clin Nutr (2018) 107:826–33. doi: 10.1093/ajcn/nqy025
217. Takkunen, MJ , de Mello, VD , Schwab, US , Kuusisto, J , Vaittinen, M , Ågren, JJ, et al. Gene-diet interaction of a common FADS1 variant with marine polyunsaturated fatty acids for fatty acid composition in plasma and erythrocytes among men. Mol Nutr Food Res (2016) 60:381–9. doi: 10.1002/mnfr.201500594
218. Metelcová, T , Vaňková, M , Zamrazilová, H , Hovhannisyan, M , Staňková, B , Tvrzická, E, et al. FADS1 gene polymorphism(s) and fatty acid composition of serum lipids in adolescents. Lipids (2021) 56:499–508. doi: 10.1002/lipd.12317
219. Muzsik, A , Bajerska, J , Jeleń, HH , Gaca, A , and Chmurzynska, A . Associations between fatty acid intake and status, desaturase activities, and FADS gene polymorphism in centrally obese postmenopausal polish women. Nutrients (2018) 10:1068. doi: 10.3390/nu10081068
220. Pietiläinen, KH , Róg, T , Seppänen-Laakso, T , Virtue, S , Gopalacharyulu, P , Tang, J, et al. Association of lipidome remodeling in the adipocyte membrane with acquired obesity in humans. PLoS Biol (2011) 9:e1000623. doi: 10.1371/journal.pbio.1000623
221. Antuna-Puente, B , Disse, E , Rabasa-Lhoret, R , Laville, M , Capeau, J , and Bastard, J-P . How can we measure insulin sensitivity/resistance? Diabetes Metab (2011) 37:179–88. doi: 10.1016/j.diabet.2011.01.002
222. Baykal, AP , Parks, EJ , Shamburek, R , Syed-Abdul, MM , Chacko, S , Cochran, E, et al. Leptin decreases de novo lipogenesis in patients with lipodystrophy. JCI Insight (2020) 5:e137180. doi: 10.1172/jci.insight.137180
223. Prioletta, A , Muscogiuri, G , Sorice, GP , Lassandro, AP , Mezza, T , Policola, C, et al. In anorexia nervosa, even a small increase in abdominal fat is responsible for the appearance of insulin resistance. Clin Endocrinol (2011) 75:202–6. doi: 10.1111/j.1365-2265.2011.04046.x
224. Støving, RK . MECHANISMS IN ENDOCRINOLOGY: anorexia nervosa and endocrinology: a clinical update. Eur J Endocrinol (2019) 180:R9–R27. doi: 10.1530/EJE-18-0596
225. Chen, W , Zhou, H , Liu, S , Fhaner, CJ , Gross, BC , Lydic, TA, et al. Altered lipid metabolism in residual white adipose tissues of Bscl2 deficient mice. PLoS One (2013) 8:1–9. doi: 10.1371/journal.pone.0082526
226. Xu, P , Wang, H , Kayoumu, A , Wang, M , Huang, W , and Liu, G . Diet rich in docosahexaenoic acid/Eicosapentaenoic acid robustly ameliorates hepatic steatosis and insulin resistance in seipin deficient lipodystrophy mice. Nutr Metab (Lond) (2015) 12:58. doi: 10.1186/s12986-015-0054-x
227. Shimizu, M , Kawai, K , Yamashita, M , Shoji, M , Takakura, S , Hata, T, et al. Very long chain fatty acids are an important marker of nutritional status in patients with anorexia nervosa: a case control study. Biopsychosoc Med (2020) 14:14. doi: 10.1186/s13030-020-00186-8
228. Nguyen, N , Dow, M , Woodside, B , German, JB , Quehenberger, O , and Shih, P-AB . Food-intake normalization of dysregulated fatty acids in women with anorexia nervosa. Nutrients (2019) 11:2208. doi: 10.3390/nu11092208
229. Shih, PB , Morisseau, C , Le, T , Woodside, B , and German, JB . Personalized polyunsaturated fatty acids as a potential adjunctive treatment for anorexia nervosa. Prostaglandins Other Lipid Mediat (2017) 133:11–9. doi: 10.1016/j.prostaglandins.2017.08.010
230. Swenne, I , and Rosling, A . Omega-3 essential fatty acid status is improved during nutritional rehabilitation of adolescent girls with eating disorders and weight loss. Acta Paediatr (2012) 101:858–61. doi: 10.1111/j.1651-2227.2012.02684.x
231. Ayton, AK . Dietary polyunsaturated fatty acids and anorexia nervosa: is there a link? Nutr Neurosci (2004) 7:1–12. doi: 10.1080/1028415042000194621
232. Holman, RT , Adams, CE , Nelson, RA , Grater, SJ , Jaskiewicz, JA , Johnson, SB, et al. Patients with anorexia nervosa demonstrate deficiencies of selected essential fatty acids, compensatory changes in nonessential fatty acids and decreased fluidity of plasma lipids. J Nutr (1995) 125:901–7. doi: 10.1093/jn/125.4.901
233. Yammine, SG , Naja, F , Tamim, H , Nasrallah, M , Biessy, C , Aglago, EK, et al. Association between serum phospholipid fatty acid levels and adiposity among Lebanese adults: a cross-sectional study. Nutrients (2018) 10. doi: 10.3390/nu10101371
234. Jauregibeitia, I , Portune, K , Rica, I , Tueros, I , Velasco, O , Grau, G, et al. Fatty acid profile of mature red blood cell membranes and dietary intake as a new approach to characterize children with overweight and obesity. Nutrients (2020) 12:3446. doi: 10.3390/nu12113446
235. Jauregibeitia, I , Portune, K , Rica, I , Tueros, I , Velasco, O , Grau, G, et al. Potential of erythrocyte membrane lipid profile as a novel inflammatory biomarker to distinguish metabolically healthy obesity in children. J Pers Med (2021) 11:337. doi: 10.3390/jpm11050337
236. Parker, HM , Johnson, NA , Burdon, CA , Cohn, JS , O’Connor, HT , and George, J . Omega-3 supplementation and non-alcoholic fatty liver disease: a systematic review and meta-analysis. J Hepatol (2012) 56:944–51. doi: 10.1016/j.jhep.2011.08.018
237. Guo, X-F , Yang, B , Tang, J , and Li, D . Fatty acid and non-alcoholic fatty liver disease: meta-analyses of case-control and randomized controlled trials. Clin Nutr (2018) 37:113–22. doi: 10.1016/j.clnu.2017.01.003
238. Lu, W , Li, S , Li, J , Wang, J , Zhang, R , Zhou, Y, et al. Effects of Omega-3 fatty acid in nonalcoholic fatty liver disease: a meta-analysis. Gastroenterol Res Pract (2016) 2016:1459790. doi: 10.1155/2016/1459790
239. Spooner, MH , and Jump, DB . Omega-3 fatty acids and nonalcoholic fatty liver disease in adults and children: where do we stand? Curr Opin Clin Nutr Metab Care (2019) 22:103–10. doi: 10.1097/MCO.0000000000000539
240. Jump, DB , Lytle, KA , Depner, CM , and Tripathy, S . Omega-3 polyunsaturated fatty acids as a treatment strategy for nonalcoholic fatty liver disease. Pharmacol Ther (2018) 181:108–25. doi: 10.1016/j.pharmthera.2017.07.007
241. Puri, P , Baillie, RA , Wiest, MM , Mirshahi, F , Choudhury, J , Cheung, O, et al. A lipidomic analysis of nonalcoholic fatty liver disease. Hepatology (2007) 46:1081–90. doi: 10.1002/hep.21763
242. Calder, PC . Omega-3 fatty acids and metabolic partitioning of fatty acids within the liver in the context of nonalcoholic fatty liver disease. Curr Opin Clin Nutr Metab Care (2022) 25:248–55. doi: 10.1097/MCO.0000000000000845
243. Valenzuela, R , Ortiz, M , Hernández-Rodas, MC , Echeverría, F , and Videla, LA . Targeting n-3 polyunsaturated fatty acids in non-alcoholic fatty liver disease. Curr Med Chem (2020) 27:5250–72. doi: 10.2174/0929867326666190410121716
244. Araya, J , Rodrigo, R , Videla, LA , Thielemann, L , Orellana, M , Pettinelli, P, et al. Increase in long-chain polyunsaturated fatty acid n - 6/n - 3 ratio in relation to hepatic steatosis in patients with non-alcoholic fatty liver disease. Clin Sci (Lond) (2004) 106:635–43. doi: 10.1042/CS20030326
245. Elizondo, A , Araya, J , Rodrigo, R , Poniachik, J , Csendes, A , Maluenda, F, et al. Polyunsaturated fatty acid pattern in liver and erythrocyte phospholipids from obese patients. Obesity (Silver Spring) (2007) 15:24–31. doi: 10.1038/oby.2007.518
246. Elizondo, A , Araya, J , Rodrigo, R , Signorini, C , Sgherri, C , Comporti, M, et al. Effects of weight loss on liver and erythrocyte polyunsaturated fatty acid pattern and oxidative stress status in obese patients with non-alcoholic fatty liver disease. Biol Res (2008) 41:59–68. doi: 10.4067/S0716-97602008000100008
247. Das, UN . A defect in the activities of Δ and Δ desaturases and pro-resolution bioactive lipids in the pathobiology of non-alcoholic fatty liver disease. World J Diabetes (2011) 2:176–88. doi: 10.4239/wjd.v2.i11.176
248. Burdge, GC , and Wootton, SA . Conversion of alpha-linolenic acid to eicosapentaenoic, docosapentaenoic and docosahexaenoic acids in young women. Br J Nutr (2002) 88:411–20. doi: 10.1079/BJN2002689
249. Burdge, GC , and Calder, PC . Conversion of alpha-linolenic acid to longer-chain polyunsaturated fatty acids in human adults. Reprod Nutr Dev (2005) 45:581–97. doi: 10.1051/rnd:2005047
250. Metherel, AH , Irfan, M , Klingel, SL , Mutch, DM , and Bazinet, RP . Compound-specific isotope analysis reveals no retroconversion of DHA to EPA but substantial conversion of EPA to DHA following supplementation: a randomized control trial. Am J Clin Nutr (2019) 110:823–31. doi: 10.1093/ajcn/nqz097
251. Plourde, M , Chouinard-Watkins, R , Vandal, M , Zhang, Y , Lawrence, P , Brenna, JT, et al. Plasma incorporation, apparent retroconversion and β-oxidation of 13C-docosahexaenoic acid in the elderly. Nutr Metab (Lond) (2011) 8:5. doi: 10.1186/1743-7075-8-5
252. Botros, M , and Sikaris, KA . The de ritis ratio: the test of time. Clin Biochem Rev (2013) 34:117–30.
253. Neuschwander-Tetri, BA , Clark, JM , Bass, NM , Van Natta, ML , Unalp-Arida, A , Tonascia, J, et al. Clinical, laboratory and histological associations in adults with nonalcoholic fatty liver disease. Hepatology (2010) 52:913–24. doi: 10.1002/hep.23784
254. Lima Rocha, JÉ , Mendes Furtado, M , Mello Neto, RS , da Silva Mendes, AV , Brito, AKS , Sena de Almeida, JOC, et al. Effects of fish oil supplementation on oxidative stress biomarkers and liver damage in hypercholesterolemic rats. Nutrients (2022) 14:426. doi: 10.3390/nu14030426
255. Yang, J , Fernández-Galilea, M , Martínez-Fernández, L , González-Muniesa, P , Pérez-Chávez, A , Martínez, JA, et al. Oxidative stress and non-alcoholic fatty liver disease: effects of Omega-3 fatty acid supplementation. Nutrients (2019) 11:872. doi: 10.3390/nu11040872
256. He, X-X , Wu, X-L , Chen, R-P , Chen, C , Liu, X-G , Wu, B-J, et al. Effectiveness of omega-3 polyunsaturated fatty acids in non-alcoholic fatty liver disease: a meta-analysis of randomized controlled trials. PLoS One (2016) 11:1–22. doi: 10.1371/journal.pone.0162368
257. Eissing, L , Scherer, T , Tödter, K , Knippschild, U , Greve, JW , Buurman, WA, et al. De novo lipogenesis in human fat and liver is linked to ChREBP-β and metabolic health. Nat Commun (2013) 4:1528. doi: 10.1038/ncomms2537
258. Volk, BM , Kunces, LJ , Freidenreich, DJ , Kupchak, BR , Saenz, C , Artistizabal, JC, et al. Effects of step-wise increases in dietary carbohydrate on circulating saturated fatty acids and palmitoleic acid in adults with metabolic syndrome. PLoS One (2014) 9:e113605. doi: 10.1371/journal.pone.0113605
259. Pawlosky, RJ , and Salem, NJ . Perspectives on alcohol consumption: liver polyunsaturated fatty acids and essential fatty acid metabolism. Alcohol (2004) 34:27–33. doi: 10.1016/j.alcohol.2004.07.009
260. Mazzucco, S , Agostini, F , and Biolo, G . Inactivity-mediated insulin resistance is associated with upregulated pro-inflammatory fatty acids in human cell membranes. Clin Nutr (2010) 29:386–90. doi: 10.1016/j.clnu.2009.09.006
261. Muñoz, D , Iglesias, P , Francisco, L , Grijota Pérez, F , Bartolomé, I , and Maynar, M . Long-term adaptations to aerobic-anaerobic physical training in the erythrocyte membrane fatty acids profile. Int J Sport Exerc Med (2017) 3:1–7. doi: 10.23937/2469-5718/1510063
262. Hunter, GR , Gower, BA , and Kane, BL . Age related shift in visceral fat. Int J Body Compos Res (2010) 8:103–8.
263. Huffman, DM , and Barzilai, N . Role of visceral adipose tissue in aging. Biochim Biophys Acta (2009) 1790:1117–23. doi: 10.1016/j.bbagen.2009.01.008
264. Mancuso, P , and Bouchard, B . The impact of aging on adipose function and adipokine synthesis. Front Endocrinol (Lausanne) (2019) 10:137. doi: 10.3389/fendo.2019.00137
265. Bolton-Smith, C , Woodward, M , and Tavendale, R . Evidence for age-related differences in the fatty acid composition of human adipose tissue, independent of diet. Eur J Clin Nutr (1997) 51:619–24. doi: 10.1038/sj.ejcn.1600455
266. Ghezzi, S , Risé, P , Ceruti, S , and Galli, C . Effects of cigarette smoke on cell viability, linoleic acid metabolism and cholesterol synthesis, in THP-1 cells. Lipids (2007) 42:629–36. doi: 10.1007/s11745-007-3070-4
267. Marangoni, F , Colombo, C , De Angelis, L , Gambaro, V , Agostoni, C , Giovannini, M, et al. Cigarette smoke negatively and dose-dependently affects the biosynthetic pathway of the n-3 polyunsaturated fatty acid series in human mammary epithelial cells. Lipids (2004) 39:633–7. doi: 10.1007/s11745-004-1276-5
268. Wiest, EF , Warneke, A , Walsh, MT , Langsfeld, M , Anderson, J , and Walker, MK . Association of serum aryl hydrocarbon receptor activity and RBC omega-3 polyunsaturated fatty acids with flow-mediated dilation in healthy, young Hispanic cigarette smokers. Toxicol Lett (2015) 232:422–8. doi: 10.1016/j.toxlet.2014.12.002
269. Gopalan, V , Michael, N , Ishino, S , Lee, SS , Yang, AY , Bhanu Prakash, KN, et al. Effect of exercise and calorie restriction on tissue acylcarnitines, tissue desaturase indices, and fat accumulation in diet-induced obese rats. Sci Rep (2016) 6:26445. doi: 10.1038/srep26445
270. Nono Nankam, PA , Mendham, AE , van Jaarsveld, PJ , Adams, K , Fortuin-de Smidt, MC , Clamp, L, et al. Exercise training alters red blood cell fatty acid desaturase indices and adipose tissue fatty acid profile in African women with obesity. Obesity (2020) 28:1456–66. doi: 10.1002/oby.22862
271. Venäläinen, TM , Viitasalo, AM , Schwab, US , Eloranta, A-M , Haapala, EA , Jalkanen, HP, et al. Effect of a 2-y dietary and physical activity intervention on plasma fatty acid composition and estimated desaturase and elongase activities in children: the Physical Activity and Nutrition in Children Study. Am J Clin Nutr (2016) 104:964–72. doi: 10.3945/ajcn.116.136580
272. Chen, L , Zhu, Y , Fei, Z , Hinkle, SN , Xia, T , Liu, X, et al. Plasma phospholipid n-3/n-6 polyunsaturated fatty acids and desaturase activities in relation to moderate-to-vigorous physical activity through pregnancy: a longitudinal study within the NICHD fetal growth studies. Nutrients (2020) 12:3544. doi: 10.3390/nu12113544
273. Nikolaidis, MG , and Mougios, V . Effects of exercise on the fatty-acid composition of blood and tissue lipids. Sports Med (2004) 34:1051–76. doi: 10.2165/00007256-200434150-00004
274. Baker, EJ , Miles, EA , Burdge, GC , Yaqoob, P , and Calder, PC . Metabolism and functional effects of plant-derived omega-3 fatty acids in humans. Prog Lipid Res (2016) 64:30–56. doi: 10.1016/j.plipres.2016.07.002
275. Syrén, M-L , Turolo, S , de Marco, EA , De Cosmi, V , Risé, P , Marangoni, F, et al. Whole blood fatty acid profile of young subjects and adherence to the Mediterranean diet: an observational cohort study. Lipids Health Dis (2022) 21:23. doi: 10.1186/s12944-022-01633-x
276. Lepsch, J , Vaz, JS , Moreira, JD , Pinto, TJP , Soares-Mota, M , and Kac, G . Food frequency questionnaire as an indicator of the serum composition of essential n-3 and n-6 polyunsaturated fatty acids in early pregnancy, according to body mass index. J Hum Nutr Diet Off J Br Diet Assoc (2015) 28:85–94. doi: 10.1111/jhn.12225
277. Warensjö Lemming, E , Nälsén, C , Becker, W , Ridefelt, P , Mattisson, I , and Lindroos, AK . Relative validation of the dietary intake of fatty acids among adults in the Swedish National Dietary Survey using plasma phospholipid fatty acid composition. J Nutr Sci (2015) 4:e25. doi: 10.1017/jns.2015.1
278. Sun, Q , Ma, J , Campos, H , Hankinson, SE , Manson, JE , Stampfer, MJ, et al. A prospective study of trans fatty acids in erythrocytes and risk of coronary heart disease. Circulation (2007) 115:1858–65. doi: 10.1161/CIRCULATIONAHA.106.679985
279. Patel, PS , Sharp, SJ , Jansen, E , Luben, RN , Khaw, K-T , Wareham, NJ, et al. Fatty acids measured in plasma and erythrocyte-membrane phospholipids and derived by food-frequency questionnaire and the risk of new-onset type 2 diabetes: a pilot study in the European Prospective Investigation into Cancer and Nutrition (EPIC)-Norfolk. Am J Clin Nutr (2010) 92:1214–22. doi: 10.3945/ajcn.2010.29182
280. Wehling, H , and Lusher, J . People with a body mass index ⩾30 under-report their dietary intake: a systematic review. J Health Psychol (2019) 24:2042–59. doi: 10.1177/1359105317714318
281. Gatsonis, C , and Sampson, AR . Multiple correlation: exact power and sample size calculations. Psychol Bull (1989) 106:516–24. doi: 10.1037/0033-2909.106.3.516
282. Delmonte, P , Milani, A , and Kramer, JKG . Tutorial for the characterization of fatty acid methyl esters by gas chromatography with highly polar capillary columns. J AOAC Int (2021) 104:288–99. doi: 10.1093/jaoacint/qsaa147
283. Sun, Q , Ma, J , Campos, H , Hankinson, SE , and Hu, FB . Comparison between plasma and erythrocyte fatty acid content as biomarkers of fatty acid intake in US women. Am J Clin Nutr (2007) 86:74–81. doi: 10.1093/ajcn/86.1.74
284. Gómez-Cortés, P , Rodríguez-Pino, V , Marín, ALM , and de la Fuente, MA . Identification and quantification of dimethyl acetals from plasmalogenic lipids in lamb intramuscular fat under different derivatization procedures. J Chromatogr B Analyt Technol Biomed Life Sci (2019) 1120:24–8. doi: 10.1016/j.jchromb.2019.04.049
285. Delmonte, P , Belaunzaran, X , Ridge, CD , Aldai, N , and Kramer, JKG . Separation and characterization of products from acidic methanolysis of plasmalogenic lipids by two-dimensional gas chromatography with online reduction. J Chromatogr A (2020) 1619:460955. doi: 10.1016/j.chroma.2020.460955
286. Alves, SP , Santos-Silva, J , Cabrita, ARJ , Fonseca, AJM , and Bessa, RJB . Detailed dimethylacetal and fatty acid composition of rumen content from lambs fed lucerne or concentrate supplemented with soybean oil. PLoS One (2013) 8:e58386. doi: 10.1371/journal.pone.0058386
287. Freedman, DS , Thornton, JC , Pi-Sunyer, FX , Heymsfield, SB , Wang, J , Pierson, RNJ, et al. The body adiposity index (hip circumference ÷ height(1.5)) is not a more accurate measure of adiposity than is BMI, waist circumference, or hip circumference. Obesity (Silver Spring) (2012) 20:2438–44. doi: 10.1038/oby.2012.81
288. Wang, J-G , Zhang, Y , Chen, H-E , Li, Y , Cheng, X-G , Xu, L, et al. Comparison of two bioelectrical impedance analysis devices with dual energy X-ray absorptiometry and magnetic resonance imaging in the estimation of body composition. J Strength Cond Res (2013) 27:236–43. doi: 10.1519/JSC.0b013e31824f2040
Keywords: desaturase, fatty acids, cardiometabolic risk, obesity, metabolic syndrome, adiposity, lipid, women
Citation: Šarac I, Debeljak-Martačić J, Takić M, Stevanović V, Milešević J, Zeković M, Popović T, Jovanović J and Vidović NK (2023) Associations of fatty acids composition and estimated desaturase activities in erythrocyte phospholipids with biochemical and clinical indicators of cardiometabolic risk in non-diabetic Serbian women: the role of level of adiposity. Front. Nutr. 10:1065578. doi: 10.3389/fnut.2023.1065578
Edited by:
Manohar Garg, The University of Newcastle, AustraliaReviewed by:
Marek Vecka, Charles University, CzechiaCopyright © 2023 Šarac, Debeljak-Martačić, Takić, Stevanović, Milešević, Zeković, Popović, Jovanović and Vidović. This is an open-access article distributed under the terms of the Creative Commons Attribution License (CC BY). The use, distribution or reproduction in other forums is permitted, provided the original author(s) and the copyright owner(s) are credited and that the original publication in this journal is cited, in accordance with accepted academic practice. No use, distribution or reproduction is permitted which does not comply with these terms.
*Correspondence: Ivana Šarac, aXZhbmFzYXJhY0B5YWhvby5jb20=
Disclaimer: All claims expressed in this article are solely those of the authors and do not necessarily represent those of their affiliated organizations, or those of the publisher, the editors and the reviewers. Any product that may be evaluated in this article or claim that may be made by its manufacturer is not guaranteed or endorsed by the publisher.
Research integrity at Frontiers
Learn more about the work of our research integrity team to safeguard the quality of each article we publish.