 YuTing Pu
 Cheng Wang
 YongWen Jiang3
 XiaoJing Wang
 YuJie Ai
 WeiBing Zhuang
94% of researchers rate our articles as excellent or good
Learn more about the work of our research integrity team to safeguard the quality of each article we publish.
Find out more
ORIGINAL RESEARCH article
Front. Nutr. , 27 February 2023
Sec. Food Chemistry
Volume 10 - 2023 | https://doi.org/10.3389/fnut.2023.1029745
This article is part of the Research Topic Rising Stars in Food Chemistry: Insights on Plant Polyphenols and Their Polymers View all 8 articles
Chayote (Sechium edulel) fruits are rich in flavonoids, folate, and low-calorie food. However, studies about the flavonoids and the corresponding regulatory mechanism of flavonoid synthesis in chayote fruits was still unclear. In present study, an integrated transcriptome and metabolite analysis of chayote fruits at three different storage stages were conducted to explore the flavonoid compositions and gene expression associated with flavonoid synthesis. Through the UPLC-MS/MS analysis, a total of 57 flavonoid compounds were detected. Of these, 42 flavonoid glycosides were significantly differential accumulation in chayote fruits at three different storage stages. Many genes associated with flavonoid synthesis were differentially expressed in chayote fruits at three different storage stages through RNA-seq analysis, including structural genes and some TFs. There was a high correlation between RNA-seq analysis and metabolite profiling, and the expression level of candidate genes in the flavonoid synthesis pathway were consistent with the dynamic changes of flavonoids. In addition, one R2R3-MYB transcription factor, FSG0057100, was defined as the critical regulatory gene of flavonoid synthesis. Furthermore, exogenous application of phenylalanine increased the total content of flavonoids and promoted some flavonoid biosynthesis-related gene expression in chayote fruits. The above results not only make us better understand the molecular mechanism of flavonoid synthesis in chayote fruits, but also contribute to the promotion and application of chayote products.
Sechium edulel (Jacq.) Swartz (chayote), an herbaceous perennial climbing plant, is cultivated in most tropical and subtropical areas (1–4). The chayote fruits are not only rich in nutrients, such as amino acids, vitamins, α-aminobutyric acid, and dietary fiber, but also contain a lot of flavonoids (5–9). Flavonoids are the low molecular weight polyphenolic secondary metabolic compounds produced by plants, which play important roles in human health benefits (10, 11). Thus, research on flavonoid synthesis in chayote fruits has won attracted considerable attention.
Flavonoids, synthesized by the phenylpropanoid pathway, played important roles in extending the shelf life of fruits and vegetables (12). Structure genes encoding key enzymes associated with the flavonoid synthesis, including phenylalanine ammonia lyase (PAL), 4-coumarate-CoA ligase (4CL), cinnamate 4-hydroxylase (C4H), chalcone isomerase (CHI), chalcone synthase (CHS), flavonoid 3′-hydroxylase (F3′H), isoflavone synthase (IFS), flavanone 3-hydroxylase (F3H), dihydroflavonol 4-reductase (DFR), flavonol synthase (FLS), anthocyanidinreductase (ANR), anthocyanidin synthase (ANS), and leucoanthocyanidin reductase (LAR). The functions of corresponding structure genes have been well characterized in various kinds of plants, such as Arabidopsis (13), maize (Zea mays) (14), rice (Oryza sativa) (15), Melon (Cucumis melo) (16), cucumber (Cucumis sativus) (17). Although previous studies reported that flavonoids were widely distributed in all parts of S. edulel plant, such as leaves, stems, roots and chayote fruits (7), the detailed composition of flavonoids and the corresponding molecular regulatory mechanism in chayote fruits during storage were still unclear.
Flavonoids have garnered considerable attention because of numerous nutritional and biological benefits, which were often applied in food processing to help prolong the shelf-life of food items due to their antioxidant property (18). Previous studies revealed that the total phenolic contents of rowanberry (Sorbus aucuparia) fruits and banana (Musa nana) significantly reduced during the 20-or 2-day storage at 22°C, respectively (19, 20). Aziz et al. (21) investigated the contents changes of flavonoids in Cerasus Humilis fruits during storage revealed that the total content of flavonoids was reduced during storage. Robles-Sánchez et al. (22) researched the contents changes of flavonoids in mangoes during Low-Temperature storage revealed that the total content of flavonoids was reduced during the 15-day storage. Chayote has a short shelf life, which can sprout in 4–6 weeks if the storage conditions allowed (23). However, the dynamic changes of flavonoids contents and corresponding molecular mechanism during shelf life was still unclear.
Combination transcriptomic and metabolomic analyses may be a good approach to to explore the functions of genes associated with metabolism (24). Maoz’s teams explored the response of table grapes under storage at anaerobic and cold stresses with an integrated transcriptomic and metabolomic analysis (25), and found that genes associated with phenylpropanoid pathway and pyruvate metabolism were differentially expressed under storage at anaerobic and cold stresses. A transcriptome and metabolome profiling were performed to explore the bluing response of radish roots under storage, and found that low reduction system: ascorbic acid (ASA), glutathione (GSH), ascorbate peroxidase (APX), glutathione peroxidase (GPX), glutathione-S-transferase (GST), or high content of glucosinolates, oxidation system: reactive oxygen species (ROS), catalase (CAT), peroxidase (POD) could promote the blue discoloration of radish roots (26). LTC condition is the prestorage at 8°C for 5 days before storage at 0°C, and Wang’s teams conducted the integrated analysis of transcript and metabolite profiling of ‘Hujingmilu’ peach stored at 0°C conditions and LTC conditions. The results indicated that LTC can relieve chilling injury in peach fruit (27). Although the chayote fruit quality deteriorates with storage, the dynamic changes of the flavonoids in chayote fruits at room temperature for a fairly long time was still unclear. Thus, in present study, the chayote fruits placed in plastic containers at room temperature was used to perform the transcriptome and metabolome analysis.
In this study, we here performed metabolome and transcriptome profiling of chayote fruits during storage at room temperature to examine the dynamic changes of flavonoid compounds and the corresponding regulatory mechanism of flavonoid synthesis. A total of 57 flavonoid derivatives were detected in this study. Among them, 42 flavonoid glycosides were differentially accumulated in different storage stages. Moreover, the DEGs, including structural genes and transcriptional factors (TFs) for flavonoid synthesis were also identified, and the expression pattern of some DEGs were further verified using qRT-PCR. Correlation analysis between RNA-seq analysis and metabolite profiling had revealed that the identified structural genes and TFs displayed better correlation with the quantitative changes of flavonoids. This study not only makes us better understand the molecular mechanism of flavonoid synthesis in chayote fruits, but also contributes to the promotion and application of chayote products.
The Chayote was purchased from a local supplier (Walmart, Huaxi District, Guiyang City, Guizhou Province, China) at their commercial maturity stage, and then planted in the experimental field of Guizhou university. The mature chayote fruits with the same size were collected from the experimental field of Guizhou University in late October 2021. To avoid excessive dehydration, all chayote fruit samples were collected and placed in plastic containers at optimum storage temperature (10°C) for 1 month (28). Three storage stages (S1, optimal harvest stage; S2, 15 days after storage; S3, 30 days after storage) were collected to perform RNA-seq analysis and metabolome profiling, respectively. Three independent biological replicates were performed.
The mature chayote fruits with the same age and size were collected on October 10, 2021 and used for phenylalanine treatment. The phenylalanine concentration was determined based on Watanabe’s research (29), and the operation steps are as follows: the cottons containing phenylalanine solution with different concentrations (0.5-and 1 mM) were wrapped on the surface of fruits. The cotton was changed every 3 days. The cotton-wrapped chayote fruits were is placed in plastic containers at optimum storage temperature (10°C) for 10 days. After 10 days of treatments, the chayote fruits were sampled and immediately placed into liquid nitroge.
Determination of total flavonoid contents in chayote at three different stages (S1 ~ S3) was conducted using the Plant Flavonoids Content Assay Kit (Beijing Boxbio Science & Technology Co., Ltd.). The frozen chayote were crushed to fine powder using grinding bead (6 mm diameter, 6 min, 50 Hz, MM400, Retsch). Fifty milligrams of fine-powdered samples were extracted from the ultrasonic and cryogenic instrumentation at 5°C (40 KHz) using 400 μL of 70% aqueous methanol. The supernatants were collected by centrifugation (13,000 g, 15 min) and then passed through a hydrophilic nylon membrane filter (Pore size: 0.22 μM). Pipette 20 μL of supernatant for each sample and mix them as the quality control samples (QC).
Metabolite profiling analysis of the extracted samples was conducted using UPLC-MS/MS method (30). Chromatographic separation of flavonoid metabolites was conducted on an ACQUITY UPLC HSS T3 column (100 mm × 2.1 mm, 1.8 μM) using mobile phases A (5% acetonitrile in water contained 0.1% formic acid) and mobile phases B (47.5% acetonitrile in 47% isopropanol solution contained 0.1% formic acid). The elution profile was set as follows: 0–2.5 min, 95:5 phase A/phase B to 75:25 phase A/phase B; 2.5–9 min, 75:25 phase A/phase B to 5:95 phase A/phase B; 9–13 min, 5:95 phase A/phase B to 5:95 phase A/phase B; 13–13.1 min, 5:95 phase A/phase B to 95:5 phase A/phase B, 13.1–16 min, 95:5 phase A/phase B to 95:5 phase A/phase B. The flow rate was 0.4 ml/min. The column temperature was maintained at 40°C. The injection volume was 10 μL.
The quadrupole-time-of-flight mass spectrometer (MS) was used to profile the metabolites of fruit samples (31). The analytical MS parameters were as follows: source temperature, 550°C; ion sources GS1, GS2, and curtain gas were set as 50, 50 and 30 psi, respectively; collision energy (CE), declustering potential (DP), ion-spray voltage floating in negative mode, and in positive mode were set as 20 ~ 60 V, 80 V, 4 kV, and 5 kV. MS acquisition was performed in a data-dependent acquisition (DDA) mode.
Data preprocessing were performed by Progenesis QI software to obtain the m/z values, retention time (RT), and peak intensity. Metabolites were found by searching and comparing the m/z values, RT, and fragmentation patterns to standards in Human metabolome database (HMDB)1 and Metlin database.2 The variable importance of the projection (VIP) score of OPLS-DA model was performed to detect global metabolic changes among comparable groups. Metabolites with t test p-value <0.05 and VIP ≥ 1 were defined as differential metabolites (32). The R package from Bioconductor on Majorbio Cloud Platform3 was used to perform multivariate statistical analysis. An unsupervised method was used to perform principal component analysis (PCA) (33).
Extraction of the total RNA from chayote fruits at three different storage stages (S1 ~ S3) was performed using the EAZY spin Plus Plant RNA Kit. The mRNA purification, library construction, and RNA-seq was conducted by Majorbio Technology Co., Ltd (Shanghai, China). The heatmap was drawn with the log2-RPKM of individual DEGs. The RNA-seq data set is available in the Gene Expression Omnibus (accession no. GSE214641).
The total RNA was extracted from chayote fruits at S1, S2, and S3 stages and phenylalanine-treated seedlings using with TaKaRa MiniBEST Plant RNA Extraction Kit (TaKaRa) and the corresponding cDNA was obtained with cDNA Reverse Transcription Kit (TaKaRa). qRT-PCR was conducted with SYBR Premix Ex Tag on a DNA Engine Opticon™ 2 system (Bio-Rad Laboratories Inc.). AUG gene was used to normalize gene expression of candidate genes. A list of primers used in this study were presented in Table S1. The expression levels were evaluated by the 2−ΔΔCt method with three biological replicates.
Significant analysis between two sample groups were calculated using T-test analysis (34). All of expression analysis were conducted for three biological replicates. The average data of three biological replicates was displayed with plus or minus the standard deviation (average ± SD).
To explore the dynamic changes of flavonoids in chayote fruits during 1 month storage, the total content of flavonoids in chayote fruits at three different storage periods (S1, S2, and S3) was detected. The total content of flavonoids in S1 stage (11.31 mg. g−1, DW) was higher than those in S2 stage (6.68 mg. g−1, DW) and S3 stage (4.88 mg. g−1, DW), and the total content of flavonoids in S2 stage (6.68 mg. g−1, DW) was higher than that in S3 stages, indicating that the total content flavonoids was decreased in chayote during 1 month of storage (Figure 1).
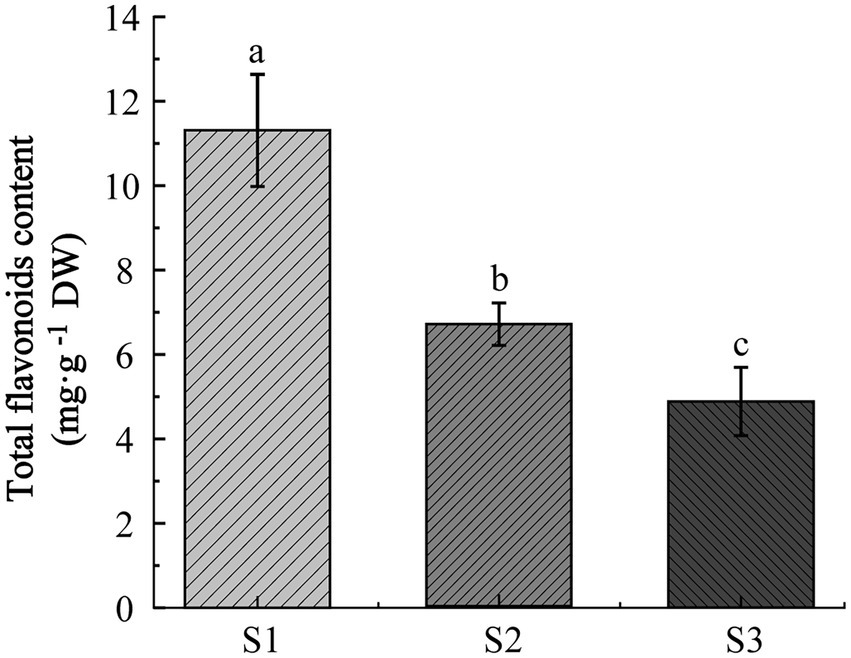
Figure 1. Determined the total content of flavonoids in chayote fruits at three storage stages (S1 ~ S3). Error bars represented ±SD. Different lower-case letters indicate a significant difference between group means (p < 0.05). S1, optimal harvest stage; S2, 15 days after storage; S3, 30 days after storage.
To further examine the dynamic changes of flavonoid compounds in chayote fruits during storage, untarget metabolite profiling was conducted through the UPLC-MS/MS system. A total of 57 flavonoid compounds, including 42 flavonoid glycosides, 3 O-methylated flavonoids, 2 flavans, 2 flavones, 1 isoflavonoid, 1 isoflavan, 3 isoflavonoid O-glycosides, 1 O-methylated isoflavonoid, 1 prenylated neoflavonoid, and 1 pyranoisoflavonoid, were identified in chayote fruits at three different storage periods (Figure 2; Table 1). Moreover, the principal component analyses (PCA) of metabolite accumulation levels in chayote fruits. Two principal components, PC1 (28.84%) and PC2 (54%), explained 82.84% of the variation in the metabolic profile (Figure 2A). The 18 samples were divided into three groups along PC1, indicating that the model was suitable. A weak correlation among the biological repetitions of the S3 stage and a clear separation among S1, S2, and S3 were observed based on PCA (Figure 2A). Visualization of the flavonoid profile was performed by hierarchical cluster analysis (HCA; Figure 2B). As shown in Figure 2B, the metabolite profiles were clustered into three clusters: clusters I, II, and III, and the results showed that the flavonoid compounds in chayote fruits were differentially accumulated distributed in the three periods (S1, S2, and S3) of chayote storage (Figure 2B). In cluster I, the flavonoid compounds in S2 stage of chayote storage was higher than that in S3 stage, and the flavonoids in S1 stage of chayote storage was not detected (Figure 2B). In cluster II, the flavonoid compounds in S1 stage was higher than that in S2 stage, and the content of flavonoids in S3 stage was relatively low (Figure 2B). In cluster III, the flavonoid compounds in S1 stage was significantly higher than that in S3 stage, and the content of flavonoids in S2 stage was relatively low (Figure 2B). In addition, the number of flavonoid compounds in S1 stage was higher than that in S2 stage, and the number of flavonoid compounds in S2 stage was higher than that in S3 stage (Figure 2B).
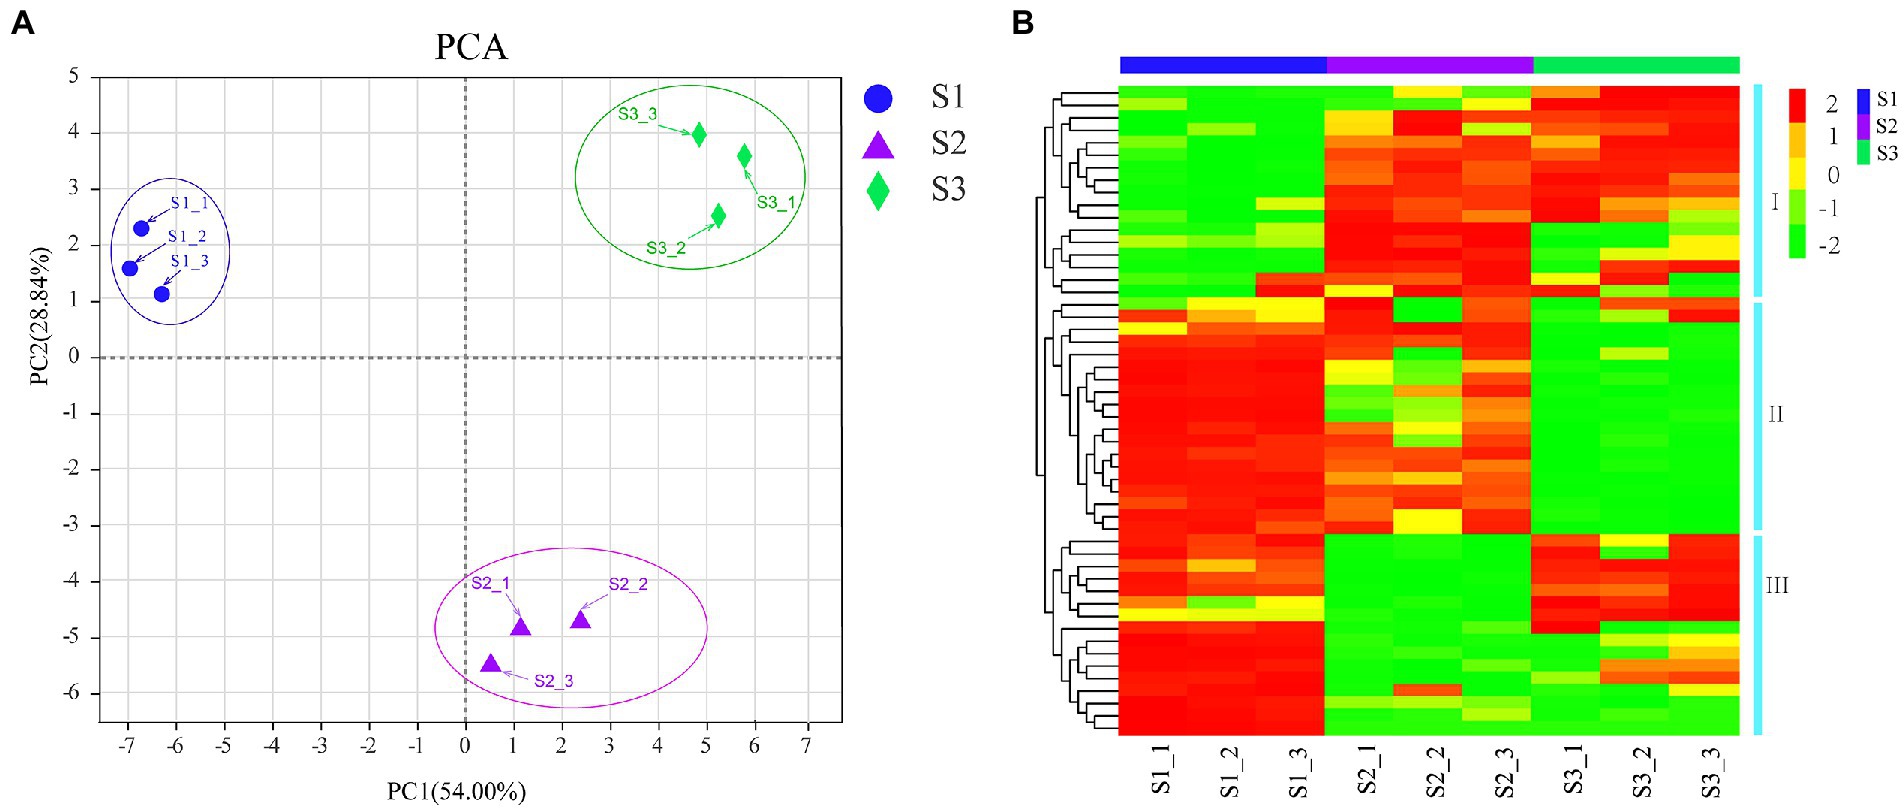
Figure 2. PCA and clustering heat map of flavonoid compounds. (A) PCA score plots; (B) Clustering heatmap were drawn with the relative contents of flavonoid compounds. Red and green colors represent the higher or lower content of flavonoid metabolites, respectively.
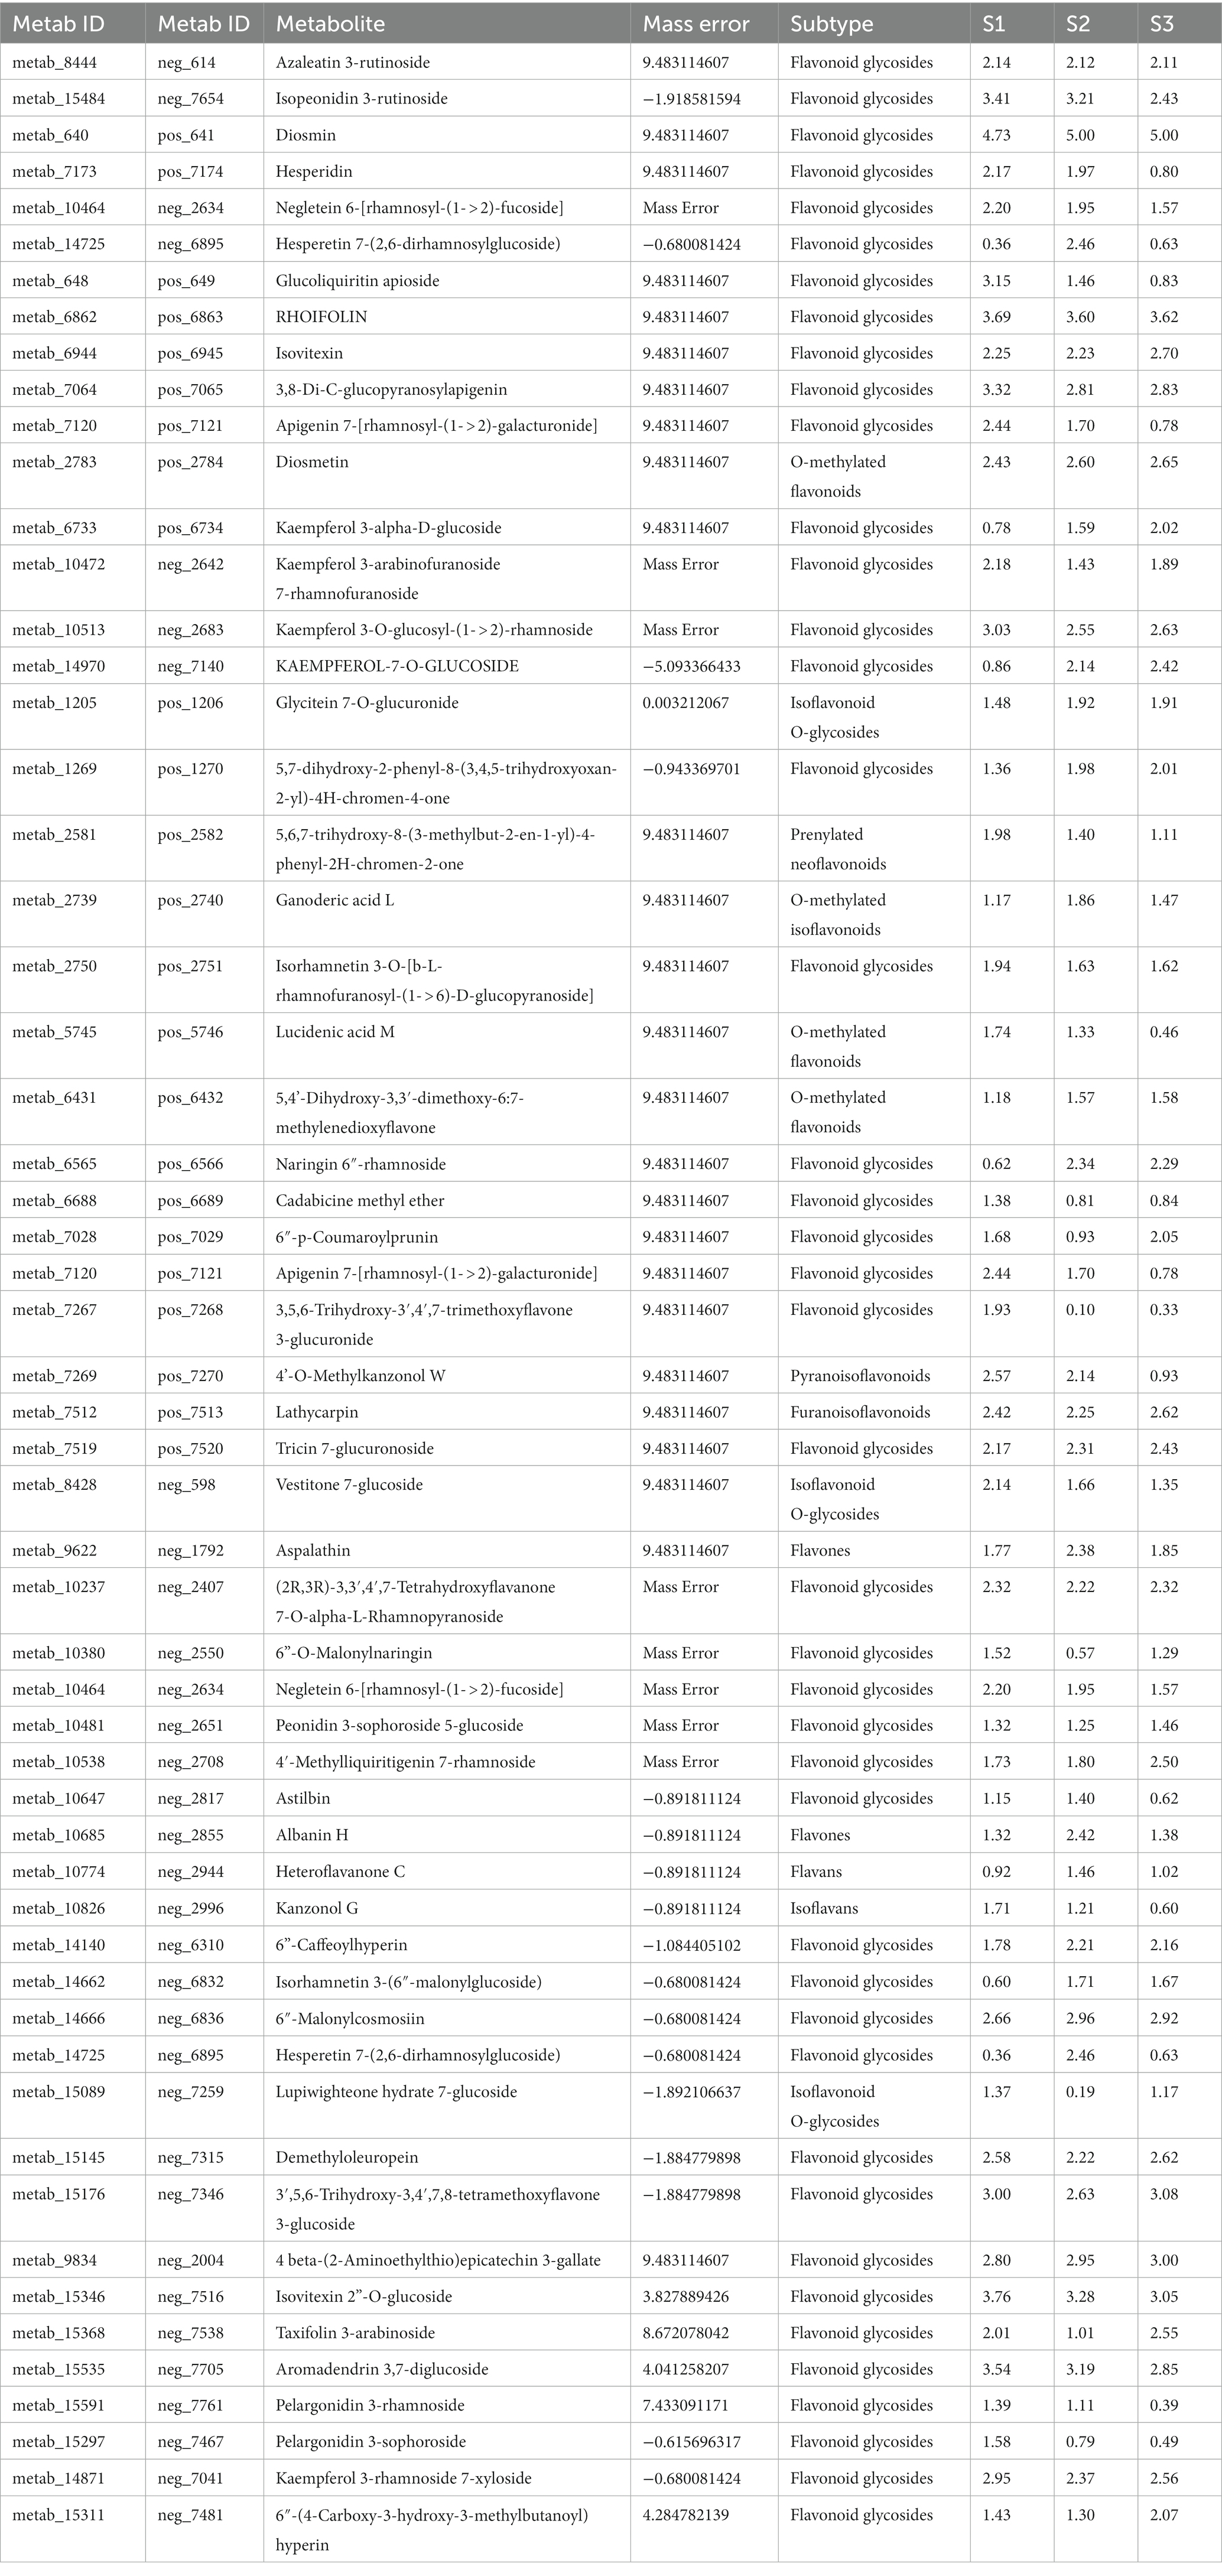
Table 1. Checklist of flavoniods and molecular features analyzed in this study.
To further compare the differential accumulation of flavonoids in chayote fruits at three different storage stages, the pairwise comparison analysis of flavonoids in S1, S2, and S3 stages of chayote storage (Figure 3). The comparative analysis between S1 and S2 showed that 24 and 11 flavonoid compounds were increased and decreased in S1 vs. S2, respectively (Figure 3A). The increased flavonoid compounds contained 20 flavonoid glycosides, 1 prenylated neoflavonoids, 1 pyranoisoflavonoids, 1 isoflavonoid O-glycosides and 1 furanoisoflavonoids, and the decreased flavonoid compounds included 9 flavonoid glycosides, 1 Isoflavonoid O-glycosides, 1 O-methylated flavonoids, 1 O-methylated isoflavonoids and 1 flavones (Supplementary Table S2). The differential flavonoid compounds between S1 and S3 showed that 25 flavonoid compounds (20 flavonoid glycosides, 1 isoflavans, 1 isoflavonoid O-glycoside, 1 O-methylated flavonoid, 1 prenylated neoflavonoid, and 1 pyranoisoflavonoid) and 15 flavonoid compounds (11 flavonoid glycosides, 1 furanoisoflavonoids, 1 isoflavonoid O-glycosides, 1 O-methylated flavonoids, and 1 O-methylated isoflavonoids) were upregualted and downregulated in S1 vs. S3, respectively (Figure 3B; Supplementary Table S3). The pairwise comparison analysis between S2 and S3 showed that 20 flavonoid compounds (15 flavonoid glycosides, 1 flavone, 1 isoflavans, 1 isoflavonoid O-glycoside, 1 O-methylated flavonoid, and 1 pyranoisoflavonoid) and 8 flavonoid compounds (7 flavonoid glycosides, 1 furanoisoflavonoids) were increased and decreased in S2 vs. S3, respectively (Figure 3C; Supplementary Table S4). Notably, 20, 23, and 29 differential flavonoid metabolites were both present in S1 vs. S2 and S2 vs. S3, S2 vs. S3 and S1 vs. S3, and S1 vs. S2 and S1 vs. S3, respectively. Moreover, 15 flavonoid compounds, including 12 flavonoid glycosides, 1 furanoisoflavonoids, 1 isoflavonoid O-glycosides, and 1 pyranoisoflavonoid, were present in all three comparison groups (Figure 3D; Supplementary Table S5). In addition, 69.2% (27), 79.5% (31), and 53.8% (21) of 42 flavonoid glycosides were differentially accumulated in S1 vs. S2, S1 vs.S3, and S2 vs.S3, respectively, suggesting that the reduction of flavonoid glycosides resulted in a decrease in flavonoid content during chayote fruit storage at room temperature.
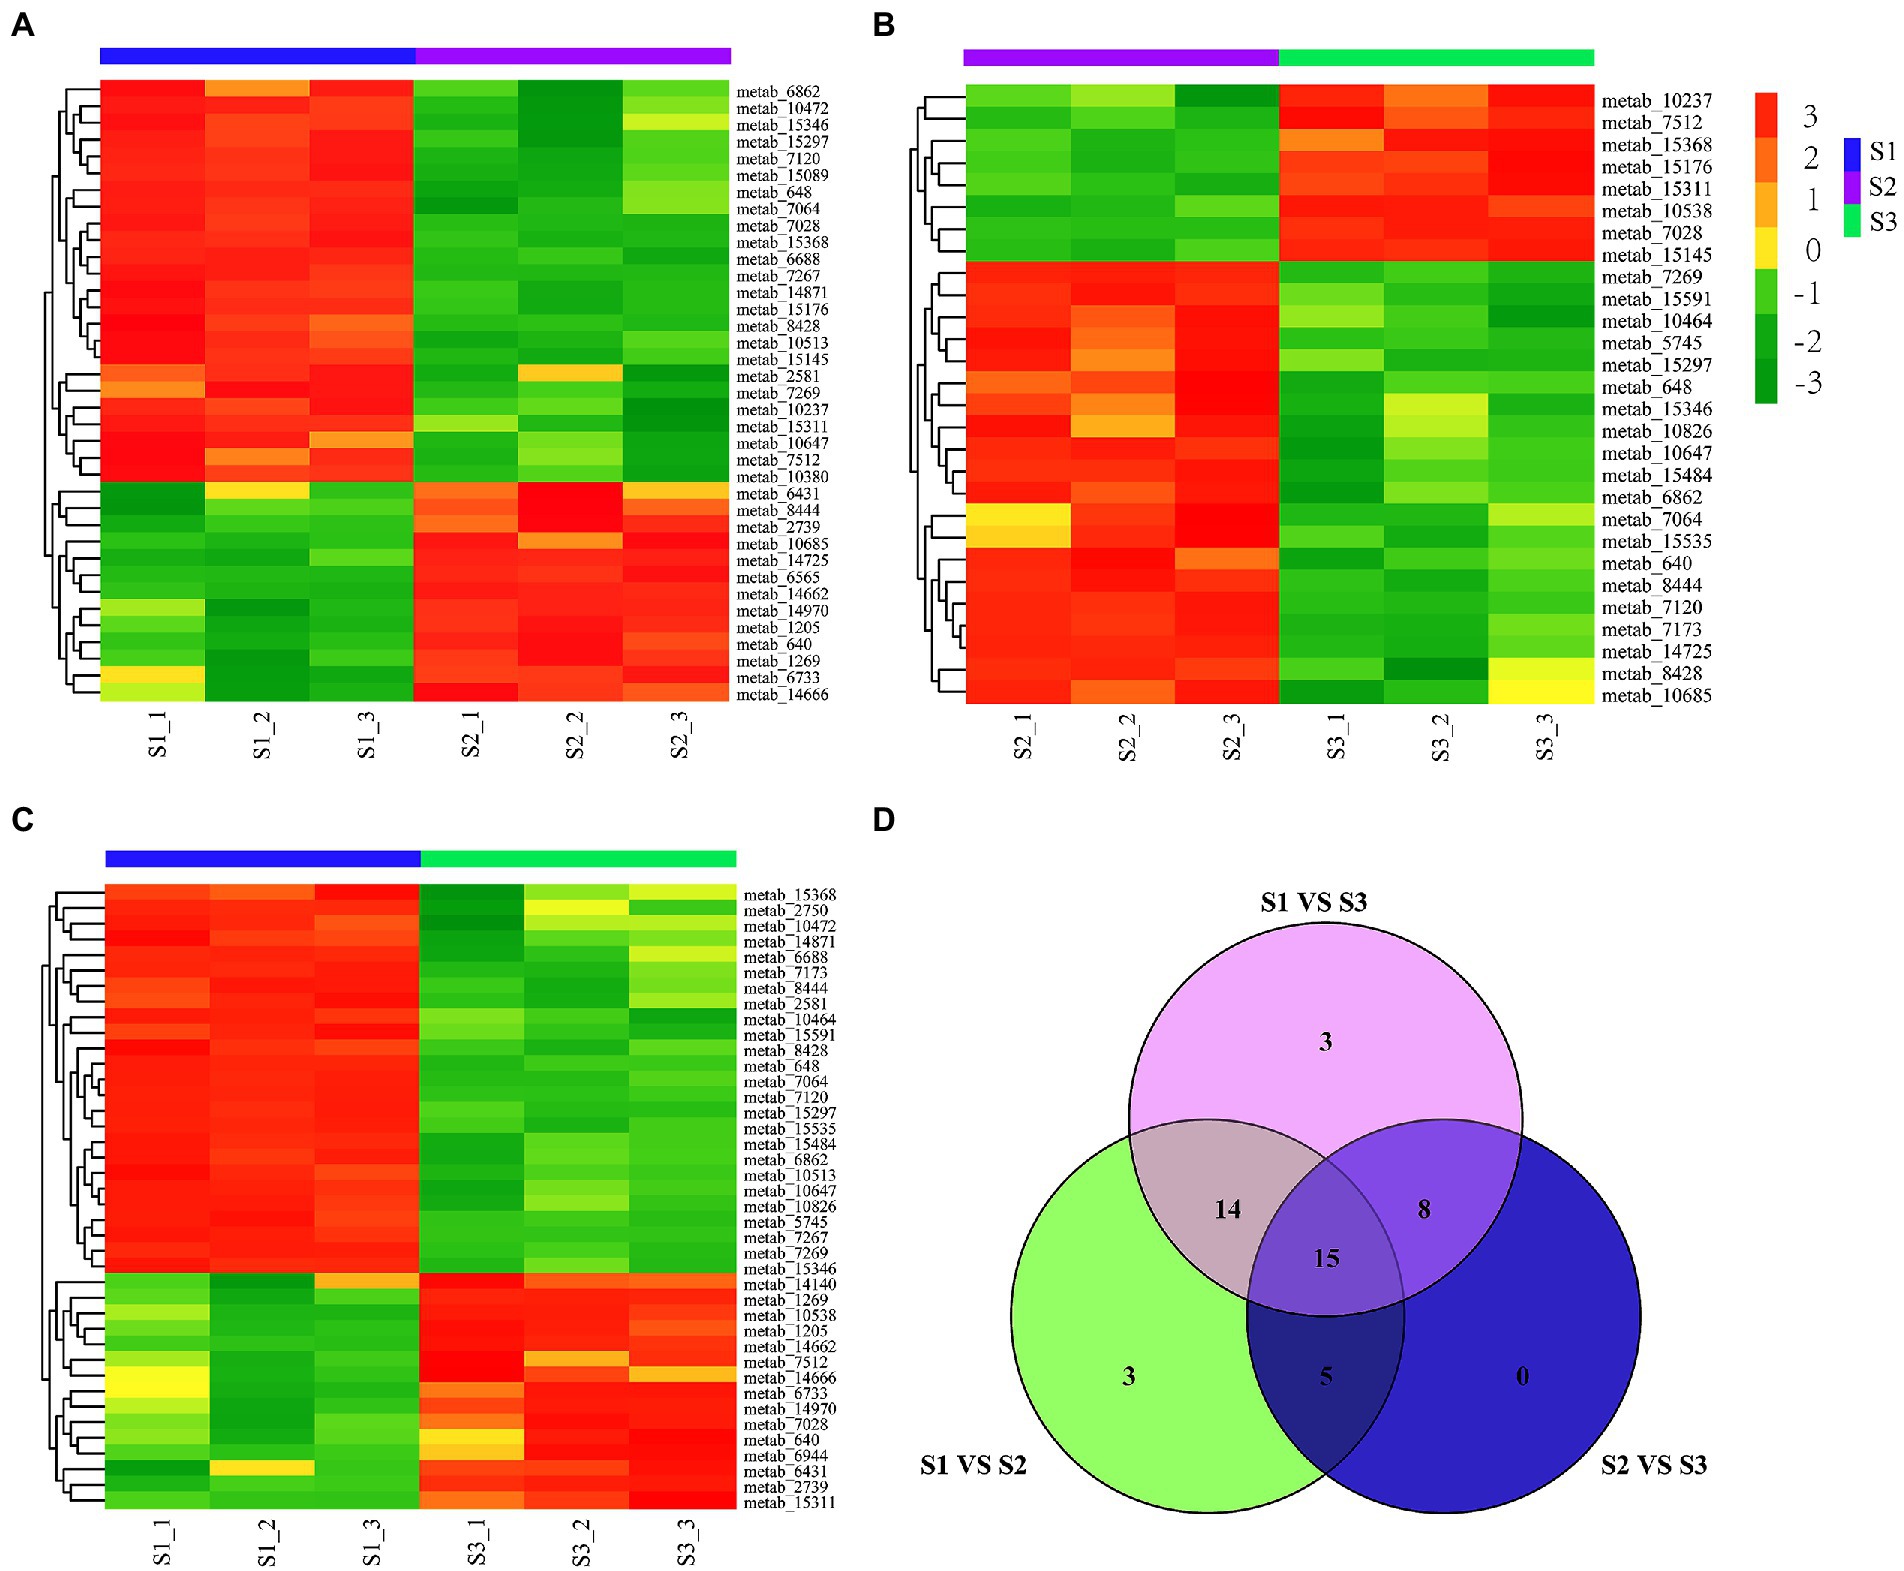
Figure 3. Differential flavonoid metabolites in chayote fruits during storage. (A) Differential in S1 vs. S2. (B) Differential flavonoid metabolites in S2 vs. S3. (C) Differential flavonoid metabolites in S1 vs. S3. (D) Venn diagram of differential flavonoid metabolites in different comparison groups. The red and green color in the plot represents higher and lower metabolite contents, respectively. S1, optimal harvest stage; S2, 15 days after storage; S3, 30 days after storage.
To clarify the molecular mechanisms involved in flavonoid synthesis in chayote fruits during storage, we constructed nine cDNA libraries from the same samples used for metabolic analysis and performed RNA-seq analysis. In this study, we totally achieved 470,430,862 raw reads and 465,666,530 clean reads. The Q30 percentage and average GC content were above over 93 and 46% for all libraries, respectively. Moreover, 84.62 to 86.76% of clean reads in each library were assembled to the reference genome for each library. A total of 57,814 unigenes were identified, with 26,742, 27,925, 27,534, 28,559, 29,222, 28,172, 27,956, 28,826, and 28,201 unigenes in each library (Table 2). This result indicated that the high quality of RNA-seq data can be suitable for subsequent analyses.
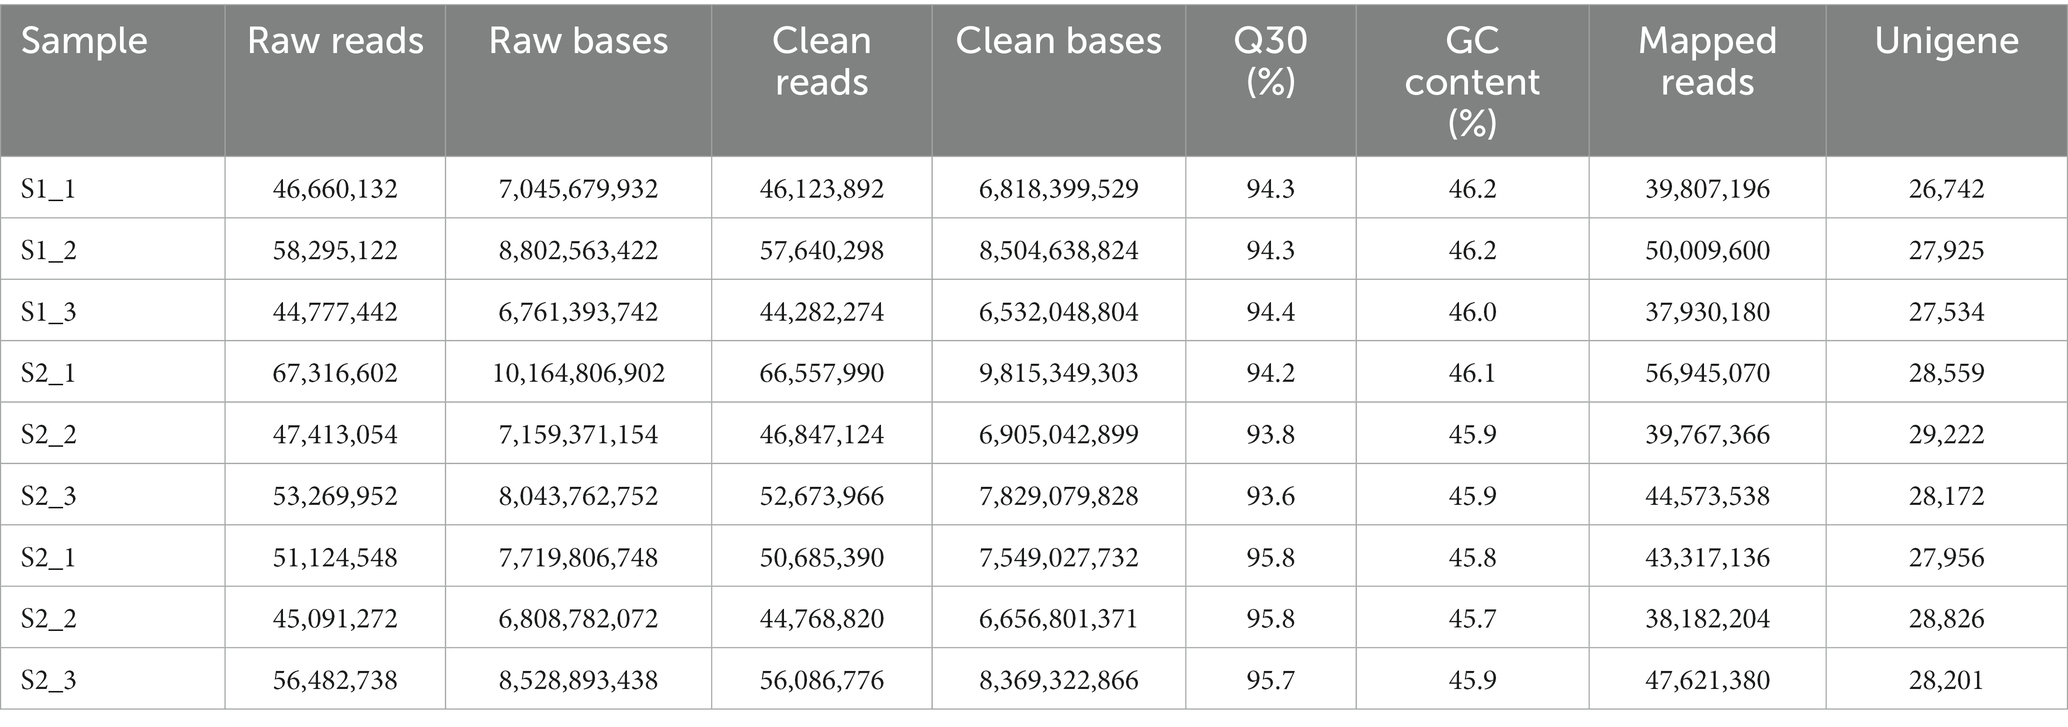
Table 2. Summary statistics of RNA-seq results in chayote fruits at three different storage stages.
In order to explore the DEGs in chayote fruits during storage, we performed the correlation coefficients and gene expression clustering among the samples from different biological replicates. The k-means method was used to group 57,814 unigenes into eight different clusters, suggesting that the DEGs were differentially expressed in chayote fruit samples at different storage stages (Figure 4). Gene expression correlations among different biological replicates were higher than 0.85 (Figure 5B), implying that biological replicates were completely distinguishable, and identification of DEGs has been performed based on the RNA-seq data. Thus, 4,326 (1,761 up-and 2,565 down-regulated), 10,707 (4,647 up-and 6,060 down-regulated), and 10,666 (4,748 up-and 5,918 down-regulated) DEGs were found in S1 vs. S2, S2 vs. S3, and S1 vs. S3, respectively (Figure 5A).
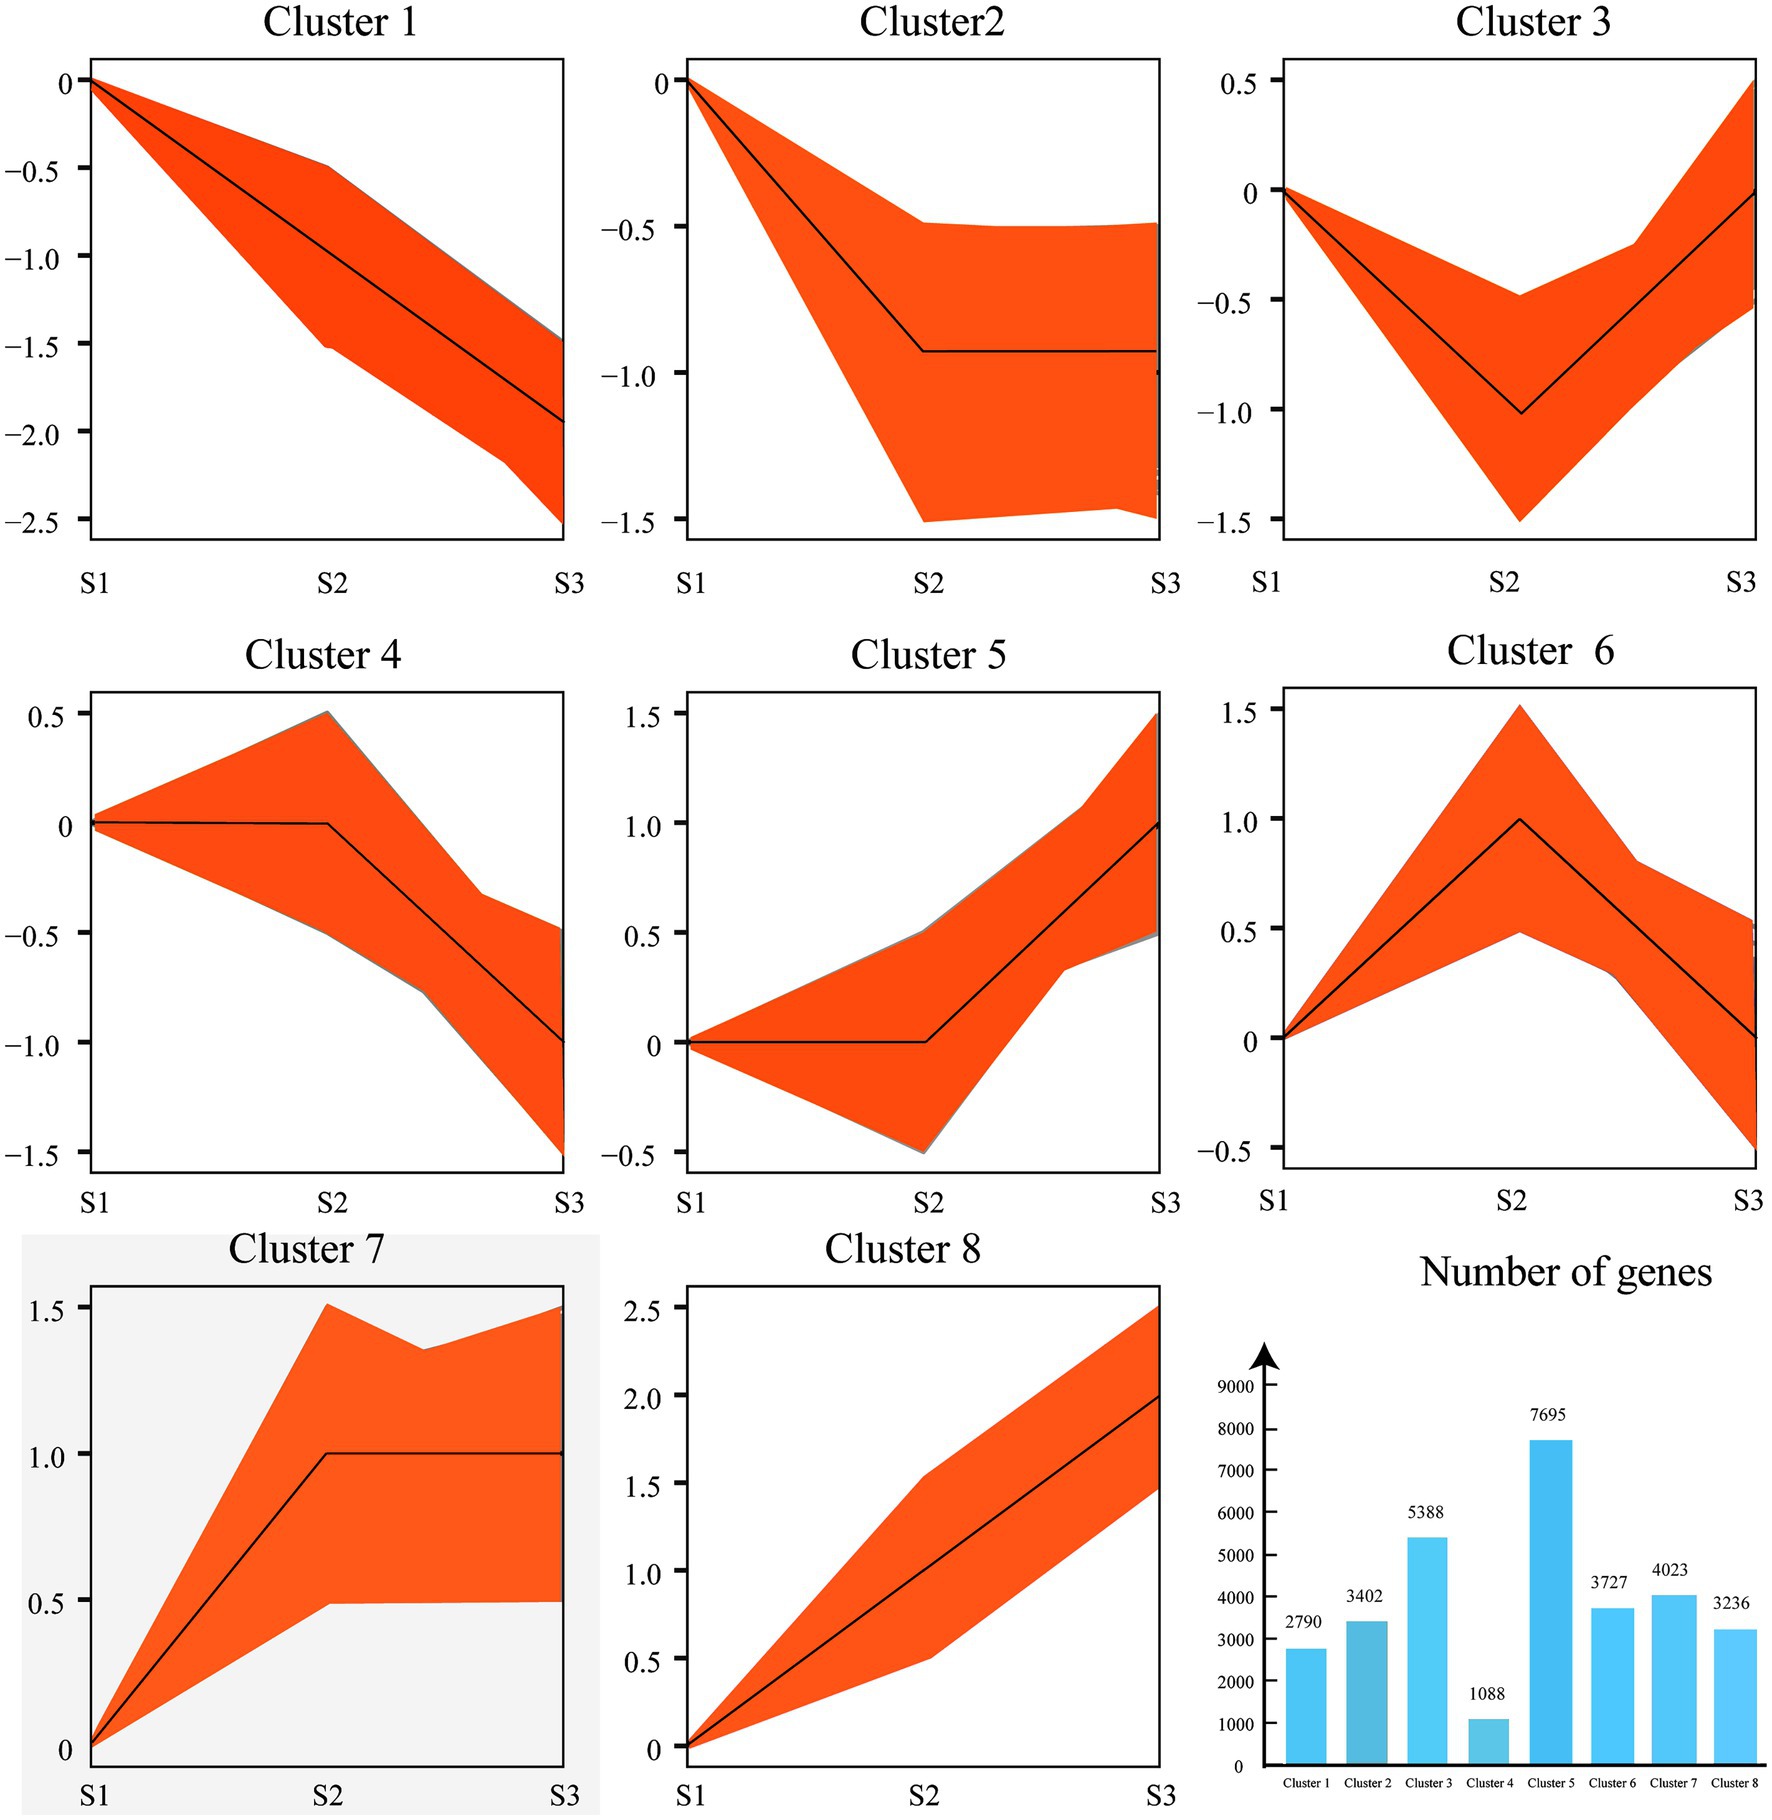
Figure 4. Clustering of gene expression profiles from chayote fruits during storage. The k-means method was used to perform the cluster analysis of gene expression profiles. The number of DEGs in each cluster. The X-axis and Y-axis represent the different samples and normalized FPKM of DEGs.
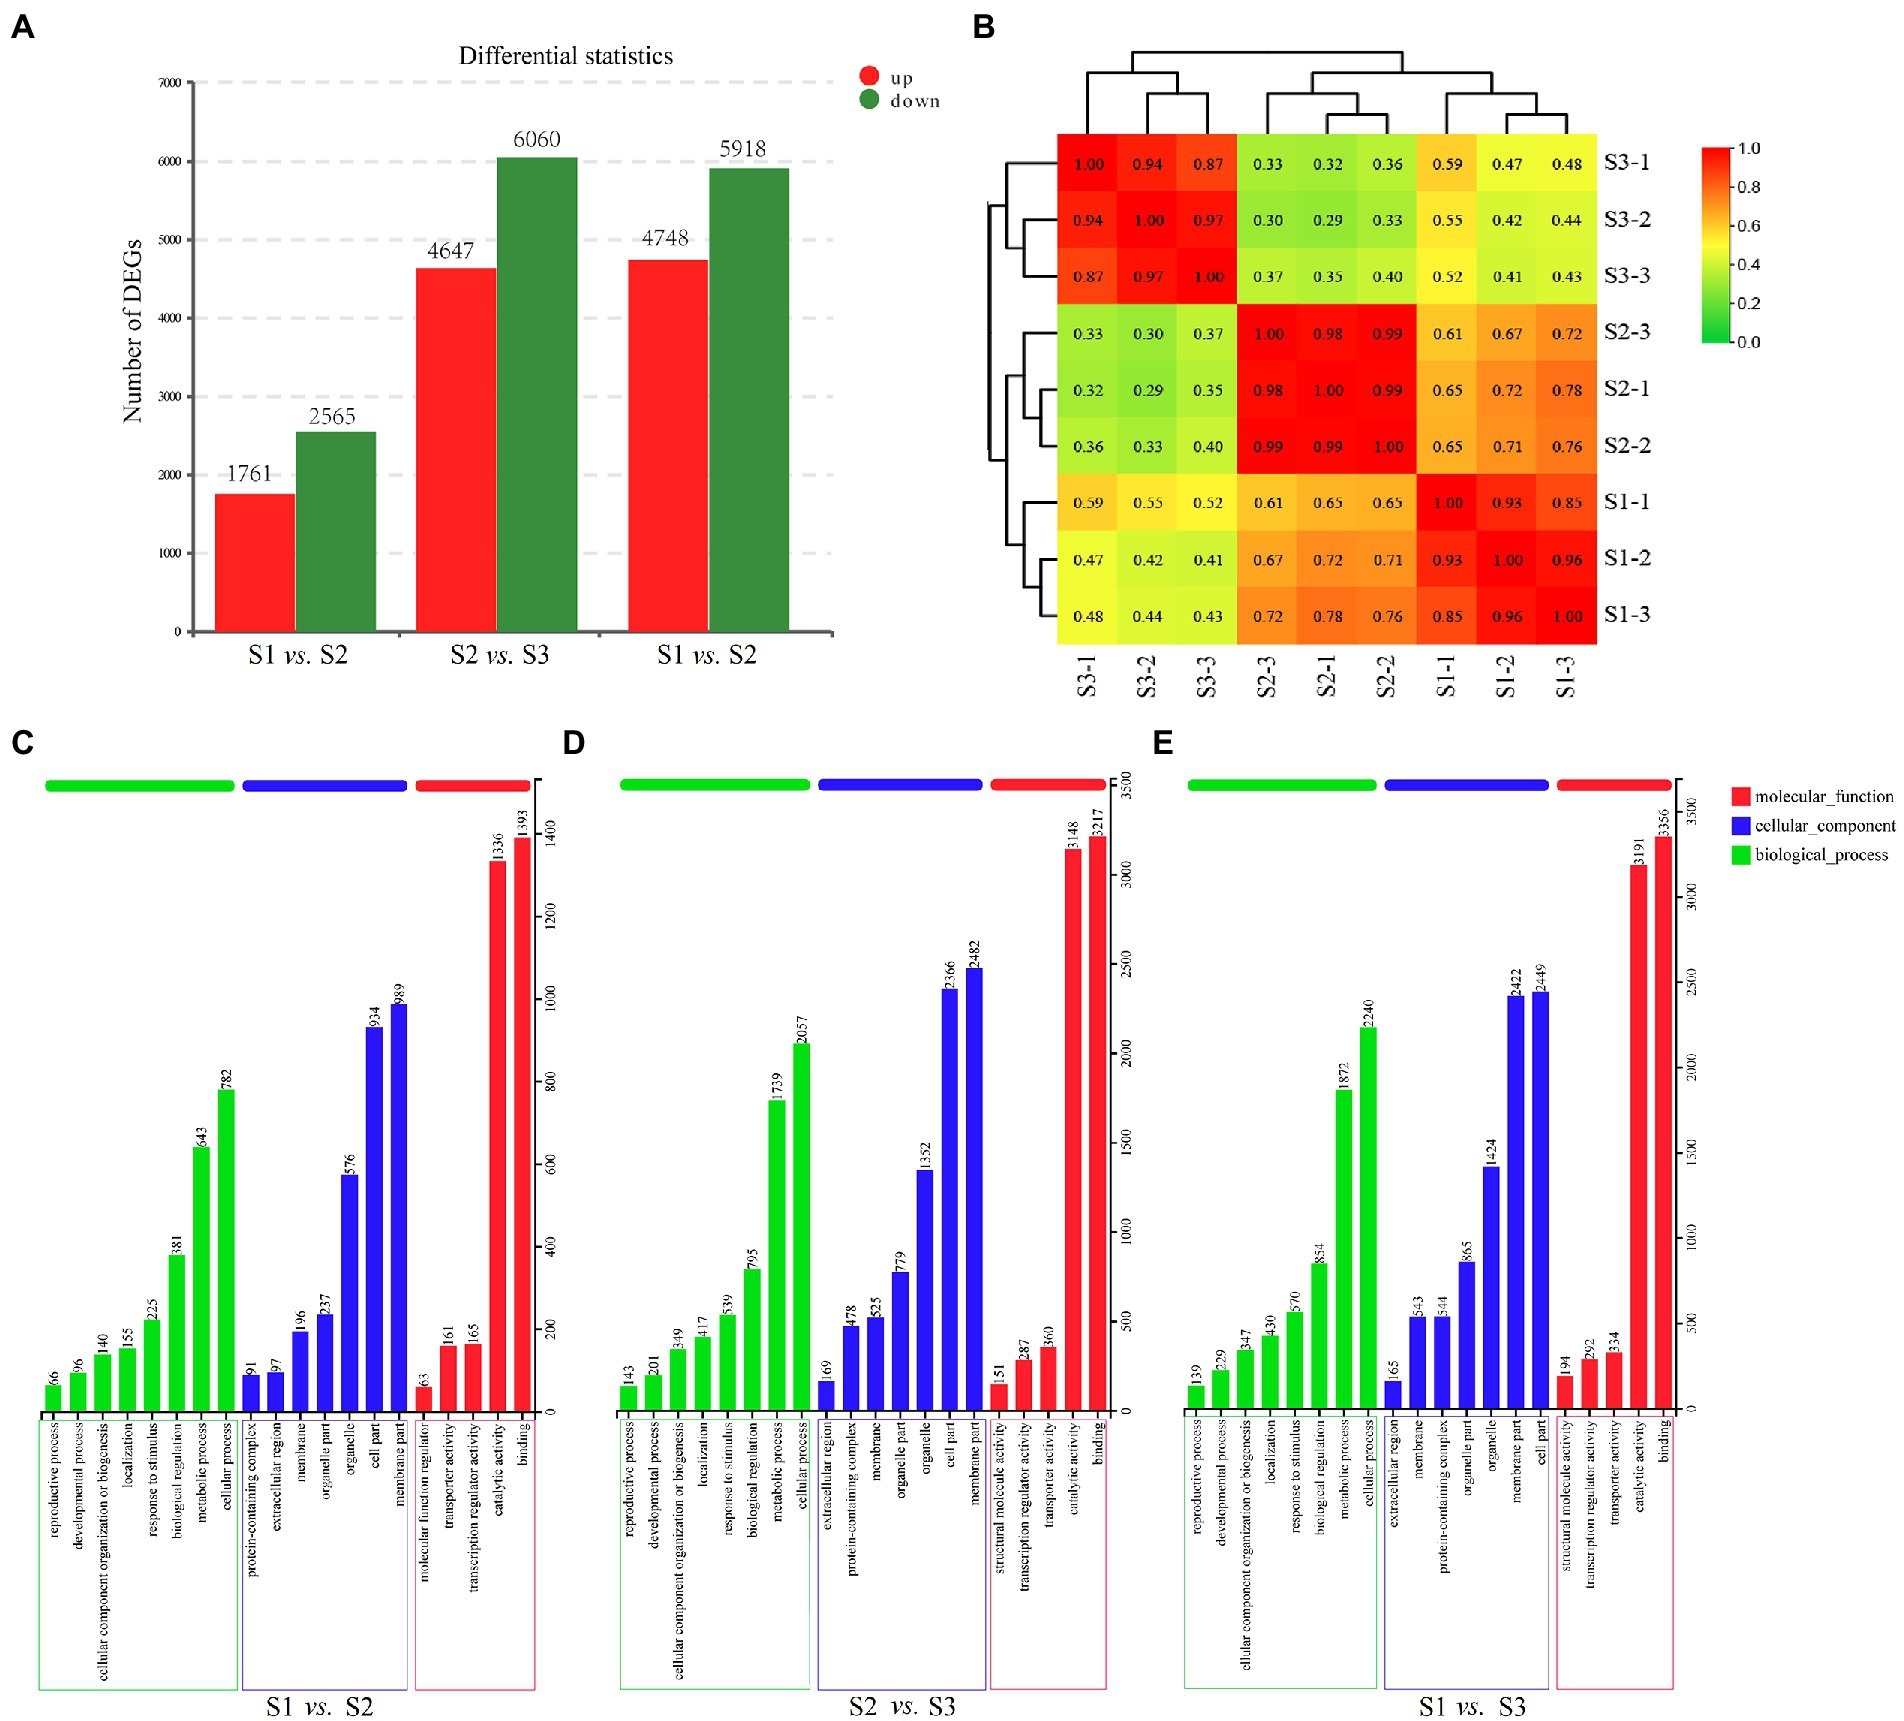
Figure 5. Transcriptome analysis for the fruits at the different developmental stages. (A) The number of DEGs in different comparison groups. (B) Relationship of RNA-seq. (C) GO enrichment analysis of DEGs in S1 vs. S2. (D) GO enrichment analysis of DEGs in S2 vs. S3. (E) GO enrichment analysis of DEGs in S1 vs. S3.
To investigate the function of the DEGs, Blast-GO was used to perform GO-term enrichment analysis. 8,726 DEGs (S1 vs. S2), 21,554 DEGs (S2 vs. S3), and 22,460 DEGs (S1 vs. S3), were classified into 20 function categories including 8 biological process (BP), 7 cellular component (CC), and 5 molecular function (MF; Figures 5C–E). In biological processes, the most abundant term is the cellular process, followed by the metabolic process. For the cellular component categories, the greatest abundant terms are the cell part and the membrane part. Under the molecular component categories, binding and catalytic activity were the most representative terms.
The metabolic pathways of the DEGs were identified using the KEGG enrichment analysis. In present study, 1,091 (S1 vs. S2), 2,877 (S2 vs. S3), and 2,863 (S1 vs. S3) DEGs were assigned to 126, 140, and 140 KEGG pathways, respectively (Figure 6). Among them, 16, 11, and 5 significantly enriched pathways were identified with a p value of <0.05 (Figure 6). Notablely, the most highly enriched pathways in S1 vs. S2 and S1 vs. S3 were phytohormones signal transduction (ko04075) and phenylpropanoid synthesis (ko00940; Figures 6A, B). In addition, the significantly enriched pathways from S1 vs. S2, S2 vs. S3, and S1 vs. S3 were further grouped into 5 categories: cellular processes, environmental information processing, genetic information processing, metabolism and organismal systems (Figures 6A–C). Among these categories, the metabolism category contained the most abundant pathways. The top three most abundant KEGG pathways of DEGs from S1 vs. S2 in the metabolism category were involved in phytohormones signal transduction pathway (ko04075, 87 genes), phenylpropanoid synthesis pathway (ko00940, 52 genes), and MAPK signaling pathway (ko04016, 36 genes; Figure 6A; Supplementary Table S6). In S2 vs. S3, DEGs were most highly enriched in phytohormones signal transduction pathway (ko04075, 156 genes), phenylpropanoid synthesis pathway (ko00940, 80 genes), and amino sugar and nucleotide sugar metabolism pathway (ko00520, 74 genes; Figure 6B; Supplementary Table S6). In pairwise comparison of S1 vs. S3, phytohormones signal transduction (ko04075, 146 genes) and phenylpropanoid synthesis (ko00940, 88 genes) were the most highly enriched pathways (Figure 6C; Supplementary Table S6).

Figure 6. Significantly enriched KEGG pathway of all DEGs. (A) Pathway enrichment analysis of DEGs in S1 vs. S2 using the KEGG repository. (B) Pathway enrichment analysis of DEGs in S2 vs. S3 using the KEGG repository. (C) Pathway enrichment analysis of DEGs in S1 vs. S3 using the KEGG repository (p < 0.05).
DEGs encoding key enzymes involved in flavonoid synthesis were detected based on the gene functional annotation and KEGG enrichment analysis. In present study, a total of 95 DEGs, including 16 PAL genes, two C4H genes, 16 4CL genes, two CHS gene, one DFR gene, one F3H gene, two FNSI genes, three FLS genes, five IFR genes and 47 UGTs were found in S1 vs. S2 and S2 vs. S3 (Figure 7A; Supplementary Table S7). Among them, 4 PAL, 1 C4H, 3 4CL, 1 CHS, 1 DFR, 1 F3H, 1 FNSI, 1 FLS, 2 IFR, and 4 UGT were significantly increased in S1 vs. S2 and S2 vs. S3 (Figure 7B; Supplementary Table S8). In addition, a total of 47 differentially expressed UGT genes were found in S1 vs. S2 and S2 vs. S3 (Figure 7A; Supplementary Table S7). Among them, four UGT genes were significantly increased in S1 vs. S2 and S2 vs. S3, respectively (Figure 7B).

Figure 7. Identification of DEGs encoding the key enzymes associated with flavonoids synthesis. (A) Heatmap showing the expression of DEGs in chayote fruits at three different storage stages. (B) Expression profiles of DEGs involved in the flavonoid synthesis pathway. Upregulated (red) and downregulated (green) genes are indicated.
Previous studies demonstrated that MYB and bHLH TFs played important roles in regulating flavonoid synthesis (35, 36). In addition, the WRKY, bZIP, and Dof TFs had been reported to be involved in the regulation of flavonoid synthesis and metabolism (37–39). Thus, these five class TFs, including 45 MYB, 33 bHLH, 25 WRKY, 20 bZIP, and 22 Dof TFs, were identified and differentially expressed in at least one comparison group (Supplementary Table S9). Among them, 12 MYB, 8 bHLH, 1WRKY, 6 bZIP, and 2 Dof TFs were significantly increased in S1 vs. S2 and S2 vs. S3, which were consistent with the expression patterns of structural genes involved in flavonoid synthesis (Supplementary Table S10). In contrast, the expression pattern of 12 MYB, 6 bHLH, 9 WRKY, 5 bZIP, and 6 Dof TFs was opposite to that of structural genes involved in flavonoid synthesis, which were down-regulated in S1 vs. S2 and S2 vs. S3 (Supplementary Table S8).
To further verify the accuracy of RNA-seq data, a total of 18 DEGs, including 13 structural genes (1 PAL, 1 C4H, 1 4CL, 1 CHS, 1 F3H, 2 FNSI, 1 FLS, 1 IFR, 2 UGT, 1 DFR, 1 IFR) and 5 TFs (3 MYB and 2 bHLH) were used to explore the expression patterms in chayote fruits at three different storage stages (S1, S2, and S3) using qRT-PCR. As shown in Figure 8, the expression pattern of most selected DEGs was consistent with the results of RNA-seq data (Supplementary Table S10).
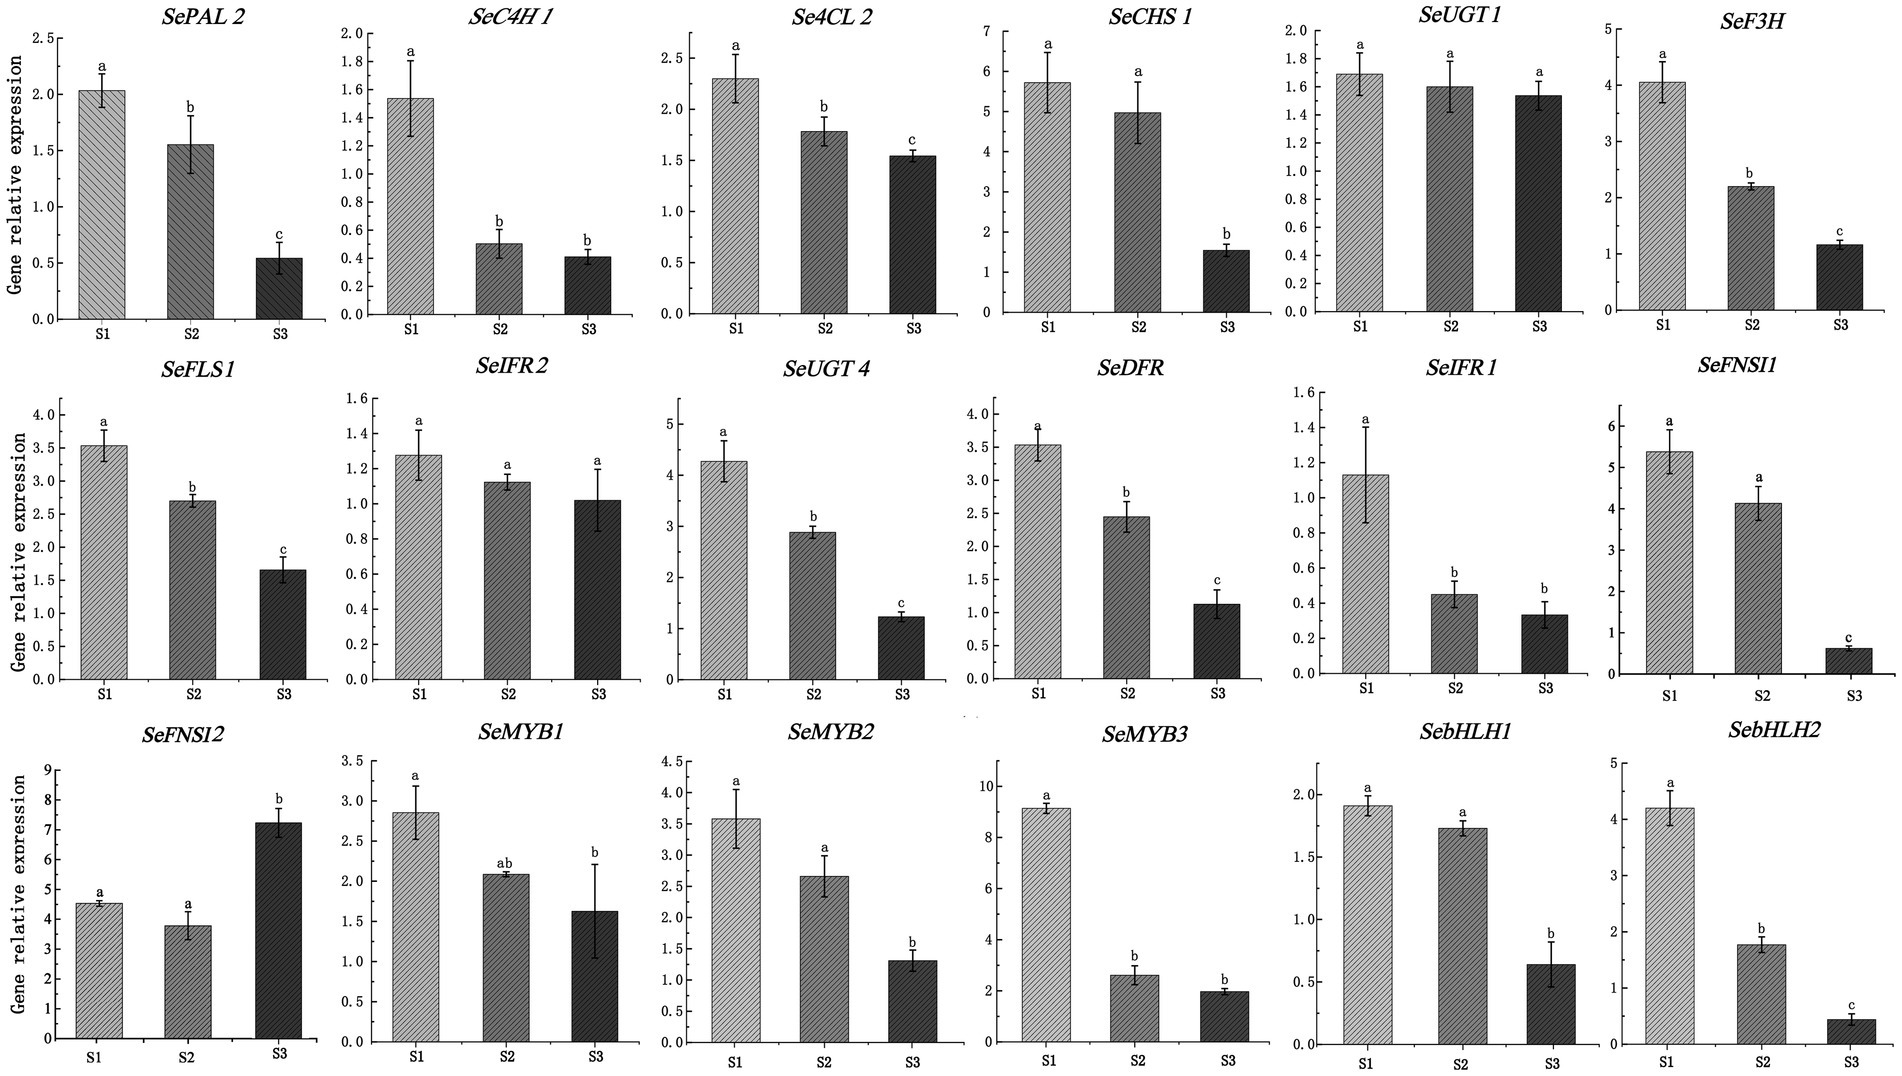
Figure 8. Validation of expression pattern of 18 DEGs associated with flavonoid synthesis using qRT-PCR. Relative expression levels of qRT-PCR were calculated using actin 7 as a standard. Three biological replicates and three technical replicates were obtained for each data point. Different lower-case letters indicate a significant difference among the different stages (p < 0.05). PAL, phenylalanine ammonia-lyase; C4H, cinnamate-4-hydroxylase; 4CL, 4-coumarate-CoA ligase; F3H, flavanone 3-hydroxylase; FLS, flavonol synthase; IFR, isoflavone reductase; DFR, dihydroflavonol 4-reductase; FNSI, flavone synthase I; UGT, UDP-glycosyltransferase.
To explore the complexity of regulatory networks that control flavonoid synthesis in chayote fruits during storage, the correlation analysis between quantitative changes of flavonoid-synthesis-related DEGs and DEMs in chayote fruits at three different storage stages were performed (Figure 9). In this study, 17 structural genes were highly correlated with 13 flavonoid compounds (r > 0.8, Figure 9A; Supplementary Table S11). Eighteen structural genes, including 3 PAL, 1 C4H, 3 4CL, 1 CHS, 1 DFR, 1 F3H, 1 FNSI, 1 FLS, 2 IFR and 4 UGT, were identified as key structural genes involved in the flavonoid synthesis. The 13 flavonoids including 8 flavonoid glycosides, 1 isoflavans, 1 isoflavonoid O-glycosides, 1 O-methylated flavonoids,1 prenylated neoflavonoids, and 1 pyranoisoflavonoids. Moreover, a specific correlation analysis between the identified MYB and bHLH and DEMs was also conducted (Figures 9B, C). Our results showed that 21 MYB and 12 bHLH TFs were extremely correlated with 8 flavonoid compounds (r > 0.8; Figures 9B, C; Supplementary Table S12), respectively. Among them, one R2R3-MYB transcription factor, FSG0057100, the orthologous gene of Arabidopsis AtMYB12, belong to the R2R3-MYB TFs, which was involved in accumulating of plant flavonol glycoside (40).
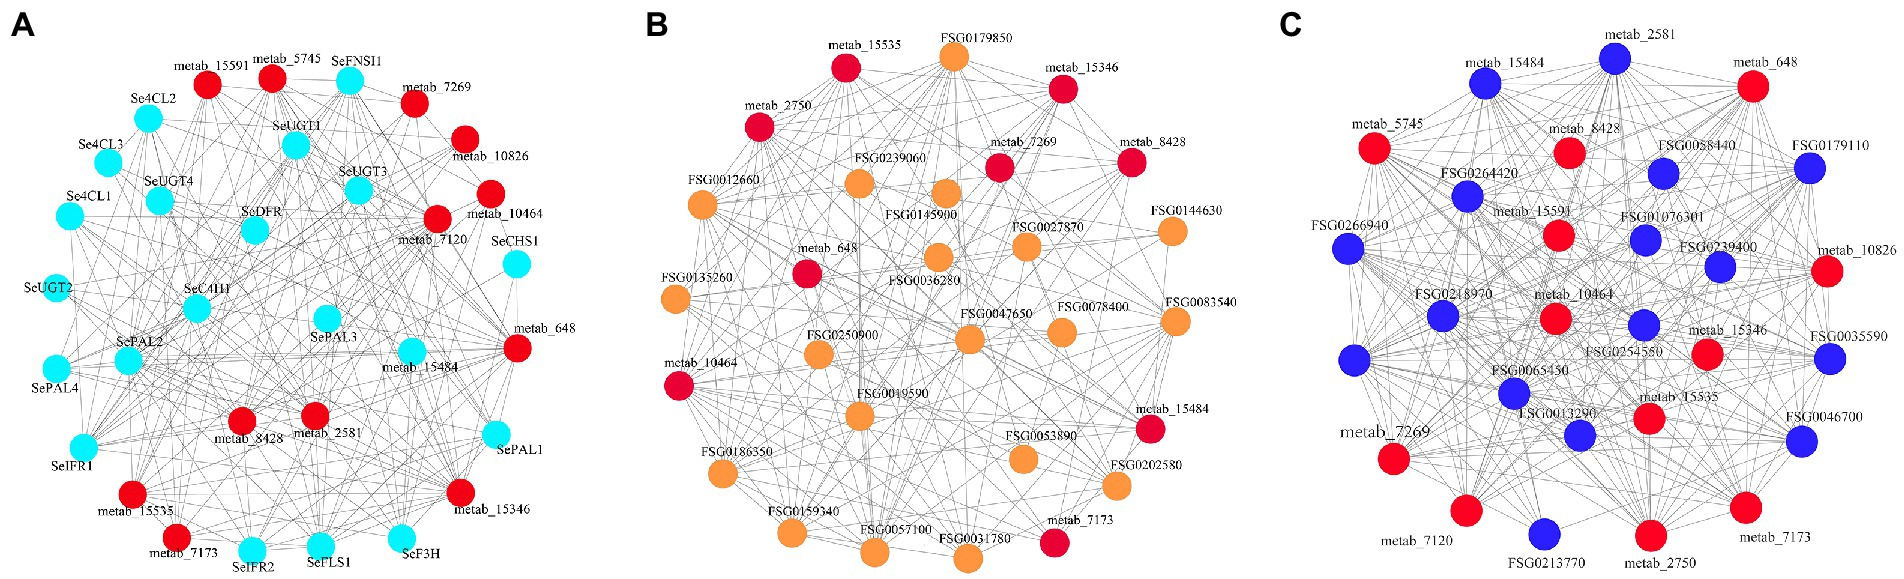
Figure 9. Connection network between DEGs and TFs associated with flavonoid synthesis and DEMs in chayote fruits during storage. (A) Correlation analysis between structural genes of flavonoid synthesis and flavonoids; (B) Correlation analysis between MYB TFs and flavonoids; (C) Correlation analysis between bHLH TFs and flavonoids. The red ellipsoid represents the DEMs. The light blue, yellow, blue, pink and green ellipsoid represent structure genes, MYB, and bHLH TFs, respectively.
Phenylalanine is an aromatic amino acid that enters the phenylpropane pathway as the initial substrate, which is the precursor of flavonoids that improve the quality of crops (41). In this study, we treated the chayote fruits with different concentrations of phenylalanine, and the effect of phenylalanine on the flavonoid contents were explored. Our results showed that the total content of flavonoids in chayote fruits treated with 0.5 mM and 1 mM of phenylalanine were 1.27 times and 1.61 times that of the control group, respectively (Supplementary Figure S1). Moreover, the expression patterns of 18 DEGs in chayote fruits treated with phenylalanine were investigated using qRT-PCR. The expression level of all genes was significantly increased after treatment with different concentrations of phenylalanine compared to control group (Figure 10; Supplementary Table S13). The expression level of most structural genes in chayote fruits treated with 0.5 and 1 mM of phenylalanine were increased by 1.17 ~ 6.98 times and 1.25 ~ 9.92 times in comparison with control group. Moreover, the expression level of MYB TFs in chayote fruits treated with 0.5 and 1 mM of phenylalanine were increased by 1.38 ~ 5.35 times and 5.44 ~ 10.12 times in comparison with control group, respectively. In addition, the expression level of SebHLH1 and SebHLH2 in chayote fruits treated with 0.5 mM of phenylalanine was increased by 1.61 and 1.54 times in comparsion with control group, respectively, which were also increased by 3.75 and 7.52 times in chayote fruits treated with 1 mM of phenylalanine. These results suggested that exogenous phenylalanine applications could promote the accumulation of flavonoids by increasing key genes involved in flavonoid biosynthesis.
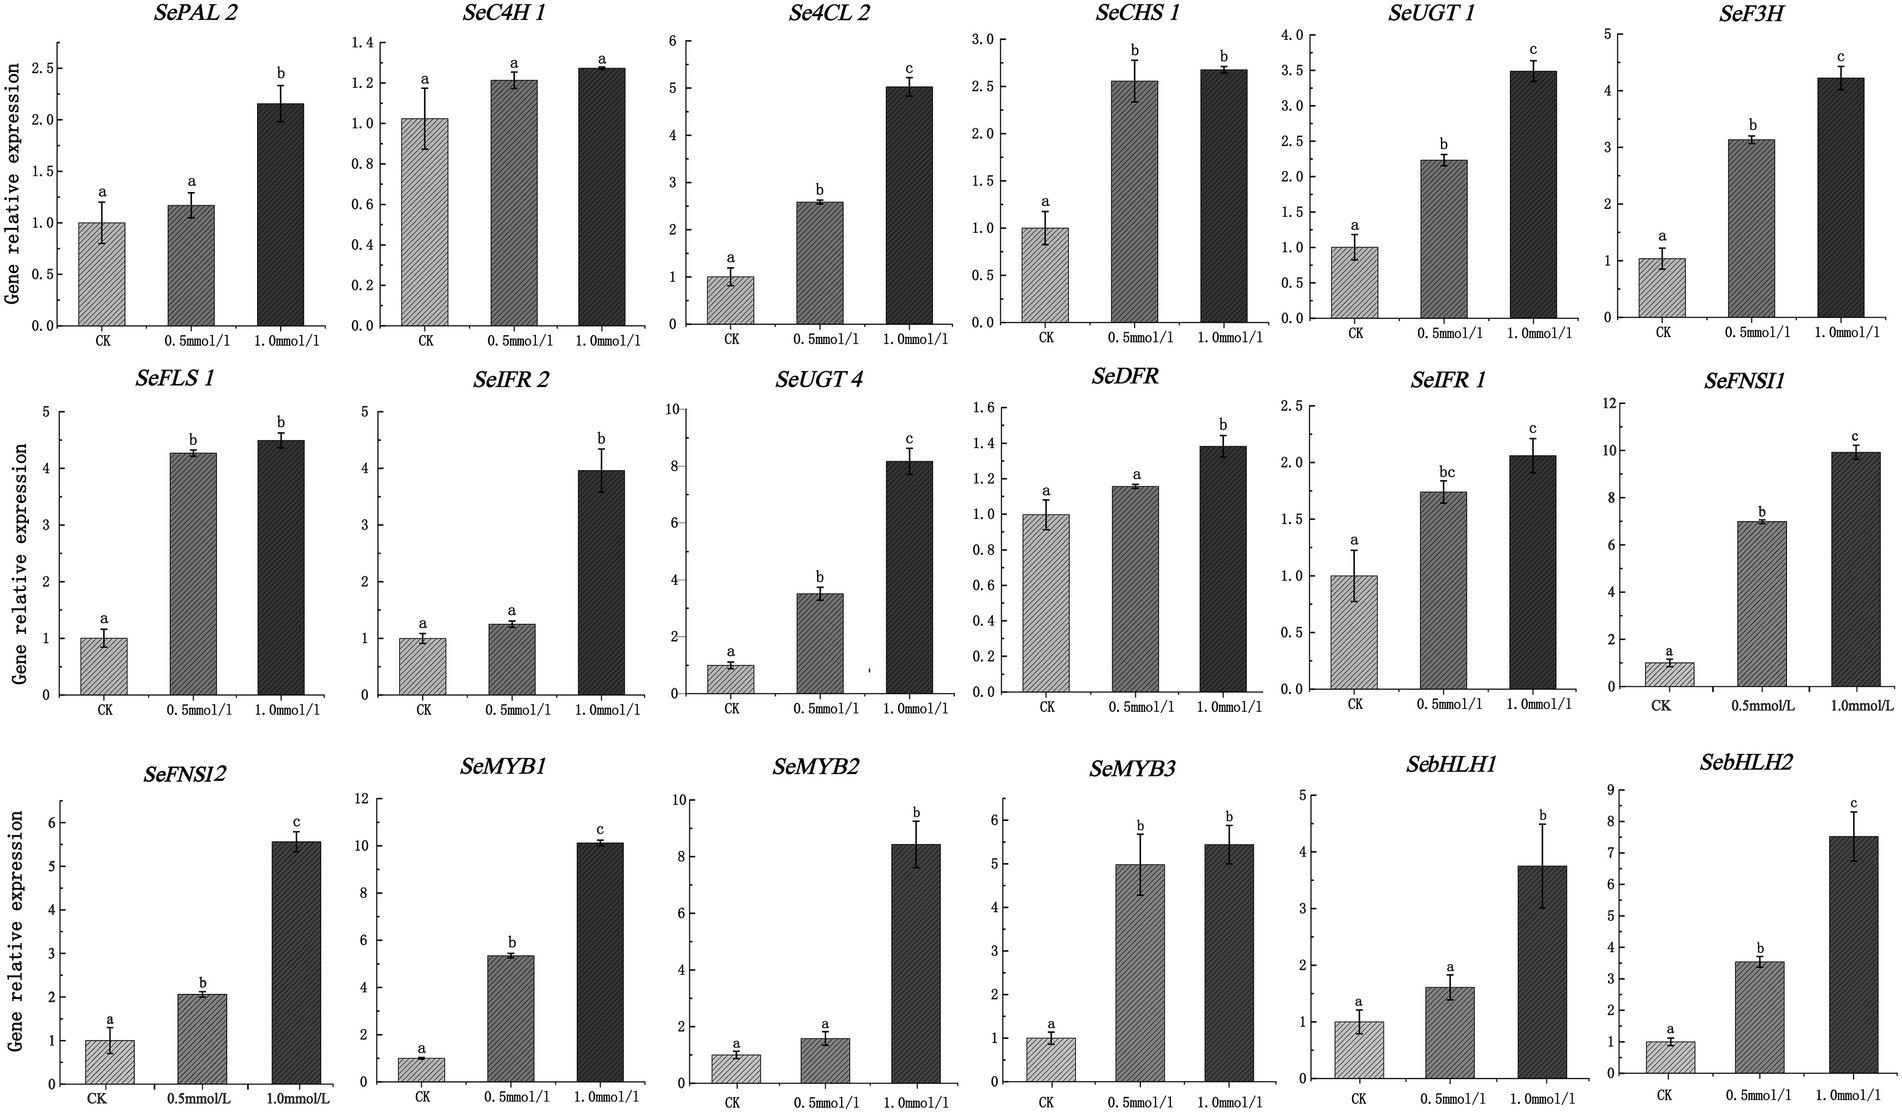
Figure 10. Expression profiles of 18 DEGs involved in flavonoid biosynthesis after phenylalanine treatment. The expression levels of DEGs relative to actin7, measured by qRT-PCR. Three biological replicates and three technical replicates were obtained for each data point. Lower case letters (a, b, c) above the error bars represent significant difference between the treated and untreated (0 g/l) samples (p < 0.05).
All organs of chayote plant are edible such as roots, shoots, leaves, and fruits, which was commonly used for medicinal and culinary purposes due to the rich minerals, dietary fibers, proteins, vitamins, polysaccharides, and flavonoids (42). Flavonoids are one of the major plant metabolites found throughout the plant kingdom, especially in fruits and vegetables. Fruits of chayote is rich in a variety of nutrients and bioactive compounds, such as polyphenols and flavonoids (43). The total phenolic contents of rowanberry fruits and banana fruits stored at room temperature for 20 day and 2 days were significantly decreased (19, 20). Aung et al. (44) reported that the quality of chayote (fresh weight) was affected by postharvest storage temperature and film wrap. Wang et al. (20) found that the total content of flavonoids in fruits of Cerasus Humilis kept decreasing with storage time. However, the effect of storage time on the total content and the changes in the components of flavonoids in chayote fruits was still unclear. Thus, the dynamic change of total flavonoid content in chayote fruits during storage was investigated, and found that the total flavonoid content was decreased in chayote fruits during 1 month storage (Figure 1), which was consistent with the previous studies (19–21).
Phenylalanine is an aromatic amino acid that enters the phenylpropane pathway as the initial substrate, which is the precursor of flavonoids that improve the quality of crops (41). Previous studies have revealed that exogenous application of phenylalanine can increase the expression level of flavonoid biosynthesis-related genes. Md-Mustafa et al. (45) showed that exogenous phenylalanine increased the expression of 2 PAL, 3 4CL, and 1 CHS, and the addition of phenylalanine (1 mM) increased the folate content up to 2.0-fold. Our results showed that the total content of flavonoids in chayote fruits treated with phenylalanine solutions (0.5 and 1 mM) was 1.27–1.61 times that of the control, and some flavonoid biosynthesis-related genes were significantly increased in chayote fruits treated with phenylalanine. These results suggested that phenylalanine increased the total flavonoid content in chayote fruits during storage by upregulated the expression of flavonoid biosynthesis-related genes. Phenylalanine can be used in fruit or vegetable storage, promote flavonoid biosynthesis, improve plant resistance to biotic and abiotic stresses, and increase plant quality.
Combined transcriptome analysis and metabolic profiling were widely used to explore the flavonoid metabolites and the corresponding molecular mechanism of flavonoid synthesis in many plants, such as tea, peach, Physalis angulata, and Mulberry (46–49). In this study, the flavonoid metabolites and corresponding molecular mechanism of flavonoid biosynthesis in chayote fruits during storage were explored using the combined transcriptome and metabolome profiling. A total of 57 flavonoid compounds were identified in chayote fruits during storage using UPLC-MS/MS. The number of flavonoid compounds in chayote fruits was higher than that in fruit peel of melon (40 differential flavonoids) (16), and less than that in cucumber yellow peel (165 differential flavonoids) (50) and in citrus fruit (117 differential flavonoids) (51). Moreover, 42 (72%) of the 57 flavonoid compounds belong to flavonoid glycosides, which was the main reason for the decrease of the total content of flavonoids (21, 52). Previous study showed that flavonoid glycosides are the main form of flavonoids in plants (53). In addition, flavonoid glycosides played important roles in response to abiotic stress (drought, cold, UV) (50, 54). Our results showed that the content of flavonoid glycosides in chayote fruits was decreased with storage time due to the loss of water (19, 20), which was consistent with previous study (53). Isoflavonoids were predominantly synthesized in leguminous plants, which played important roles in reducing osteoporosis and cardiovascular diseases, preventing cancer, and treating menopause symptoms (55–59). Moreover, six isoflavonoids and their derivatives were detected in chayote fruits for the first time, suggesting that the chayote fruit is new sources of isoflavonoids for human health.
The phenylpropanoid pathway is responsible for the biosynthesis of numerous secondary metabolites such as phenylpropenes, anthocyanins, stilbenoids, and flavonoids, which regulated the plant growth and environmental response (60–62). The complex molecular mechanism of flavonoid synthesis was extensively studied in many plants (63–65). However, the molecular regulatory mechanism of flavonoid biosynthesis has not been systematically investigated in chayote fruits during storage. In this study, 95 significant DEGs involved in flavonoid biosynthesis (e.g., PAL, C4H, 4CL, CHS, CHI, F3'H, F3'5'H, FLS, FNSI, and UGT) were identified based on the functional annotation and enrichment analysis. Among them, 19 significant DEGs, including 4 PAL, 1 C4H, 3 4CL, 1 CHS, 1 DFR, 1 F3H, 1 FNSI, 1 FLS, 2 IFR, and 4 UGT, were significantly up-regulated in S1 vs. S2 and S2 vs. S3 (Figure 7B), which further confirmed the results of metabolic profiling in chayote fruits during storage. Moreover, UDP-glycosyltransferases (UGTs) were involved in the synthesis of flavonoid glycosides in many plants (66, 67). In our study, a total of 47 UGTs were differentially expressed in S1, S2, and S3. Of these, four UGT genes were remarkably upregulated in S1 vs. S2 and S2 vs. S3, which was consistent with the results of metabolite profiling in chayote fruits during storage, indicating that these four UGT genes could catalyze the formation of flavonoid glycosides. Numerous studies have reported that UGT genes were involved in the biosynthesis of flavonoid glycosides (68–70), which was consistent with our results. Moreover, Yu et al. (69) reported that low temperature can induce the expression of UGT gene in mulberry leaves, and result in the accumulation of flavonoid glycosides. Xie et al. (68) showed that two UGT genes, MdUGT75B1 and MdUGT71B1, are involved in flavonol biosynthesis and may have important roles in regulating accumulation of these health-promoting bioactive compounds in apple.
Previous studies had revealed that MYB, WRKY, bHLH, bZIP, and DOF TFs were involved in regulating the flavonoid synthesis (35–39). In present study, 45 MYB, 33 bHLH, 25 WRKY, 20 bZIP, and 22 Dof TFs with the differential expression patterns in chayote fruits at three differential storage stages (Supplementary Table S9). Among them, the expression patterns of 24 MYB, 14 bHLH, 10 WRKY, 11 bZIP, and 8 Dof TFs displayed a good linear relationship with structural genes in flavonoid synthesis pathway, which were increased or decreased in S1 vs. S2 and S2 vs. S3, suggesting that these TFs played important roles in regulating the flavonoid synthesis of chayote fruits. Of these 24 MYB, seven MYB TFs, including 4 positive regulatory TFs (FSG0019590, FSG0221650, FSG0057100, and FSG0036280) and 3 negative regulatory TFs (FSG0159340, FSG0079980, and FSG0179850), belong to R2R3-MYB subfamily, which have been reported to be involved in flavonoid biosynthesis. Moreover, the homologous genes of seven MYB TFs in Arabidopsis were MYB86, MYB73, MYB12, MYB78, MYB36, MYB78, MYB62, and MYB116, respectively. Previous studies revealed that seven R2R3-MYB TFs (MYB86, MYB73, MYB12, MYB78, MYB36, MYB78, MYB62, and MYB116) were involved in the positive/negative regulation of flavonoid biosynthesis (71–75). For example, Li et al. (76) reported that overexpression of SmMYB86 in eggplant reduced the accumulation of anthocyanins by decreasing the expression of SmCHS, SmF3H, and SmANS. Mehrtens et al. (77) revealed that MYB12, as a transcriptional regulator of CHS and FLS, acted as the flavonol-specific activator of flavonoid biosynthesis. With the development and improvement of gene knockout and transgenic technologies, overexpression and knockout of the selected candidate genes can change the flavonoid content by regulating the gene expression, which can improve the quality, enhance the tolerance to biotic and abiotic stress and extend shelf-life.
Correlation analysis between RNA-seq analysis and metabolite profiling indicated that the expression patterns of 18 DEGs (3 PAL, 1 C4H, 3 4CL, 1 CHS, 1 DFR, 1 F3H, 1 FNSI, 1 FLS, 2 IFR and 4 UGT) are closely correlated with the dynamic changes of 13 flavonoids, suggesting that these DEGs may be involved in regulating the flavonoid synthesis in chayote fruits during storage (Supplementary Table S11). Correlation analysis also revealed that 21 MYB and 12 bHLH TFs are closely correlated with eight flavonoid derivatives (r > 0.8; Figures 9B, C; Supplementary Table S12). In addition, correlation analysis between transcriptome and metabolite profiling also revealed that one R2R3-MYB TF (SeMYB1, FSG0057100) displayed a better correlation with five flavonoid glycosides, and the homologous gene of FSG0057100 in Arabidopsis was AtMYB12. Previous studies had revealed that MYB12 have the potential to activate UGT genes known to play a role in the formation of specific flavonol glycosides (39). This result indicated that FSG0057100 is the key regulators of the flavonoid synthesis in chayote fruits based on the expression pattern and correlation analysis.
In this study, the characterization and kinetic pattern of flavonoid constituents and differential flavonoid metabolites were identified in chayote fruits during storage. The DEGs involved in the flavonoid biosynthetic pathway were also detected using RNA-deq data. The expression pattern of some DEGs were further investigated using qRT-PCR. Moreover, correlation analysis between RNA-seq and metabolite revealed the structure genes and some TFs influencing flavonoid accumulation in chayote fruits during storage. Our results enable a comprehensive and systematic understanding of flavonoid compositions and dynamic changes as well as the corresponding molecular regulation mechanisms of flavonoid synthesis in chayote fruits.
The original contributions presented in the study are publicly available. This data can be found at: NCBI GEO, GSE214641.
XW, YA, and WZ conceived and designed the experiments. YP and CW performed the experiment. XW, YP, WZ, and YJ analyzed the data. XW and YP wrote the manuscript. All authors read and approved the manuscript.
This work was supported by the Science and Technology Project of Guizhou Province (Qiankehe Foundation-ZK [2022]), National Natural Science Foundation of China (32102306). This work was also supported by Talent Introduction Scientific Research Start-Up Project of Guizhou University (703/702735193301).
We thank the lab members of the Tea Germplasm Resources Laboratory of Guizhou University for their valuable advice on experimental design and manuscript review.
The authors declare that the research was conducted in the absence of any commercial or financial relationships that could be construed as a potential conflict of interest.
All claims expressed in this article are solely those of the authors and do not necessarily represent those of their affiliated organizations, or those of the publisher, the editors and the reviewers. Any product that may be evaluated in this article, or claim that may be made by its manufacturer, is not guaranteed or endorsed by the publisher.
The Supplementary material for this article can be found online at: https://www.frontiersin.org/articles/10.3389/fnut.2023.1029745/full#supplementary-material
1.Newstrom, LE. Evidence for the origin of chayote, Sechium edulel (Cucurbitaceae). Econ Bot. (1991) 45:410–28. doi: 10.1007/BF02887082
2.Aung, LH, Ball, A, and Kushad, M. Developmental and nutritional aspects of chayote (Sechium edulel, Cucurbitaceae). Econ Bot. (1990) 44:157–64. doi: 10.1007/BF02860483
3.Premkumar, G. Preliminary phytochemical and nutritional profiles of an underutilized vegetable Sechium edulel (Jacq.) Swartz. South Indian. J Biol Sci. (2016) 2:207–12. doi: 10.22205/sijbs/2016/v2/i1/100399
4.Chelli, VR, Bag, SS, and Golder, AK. A synthesis route to nearly spherical AgNPs using chayote fruit extract. Environ Prog. (2017) 36:192–9. doi: 10.1002/ep.12440
5.Guevara, HF, Rodríguez, LL, Gómez, H, Pinto, RR, Rodríguez, GG, and Perezgrovas, GR. Local criteria for chayote (Sechium edulel Jacq. Sw.) seed selection in rural areas of Chiapas, Mexico. Acta Agronomica. (2015) 64:178–85. doi: 10.15446/acag.v64n2.39776
6.Del Ángel-Coronel, OA, León-García, E, Vela-Gutiérrez, G, Rojas-Reyes, JO, Gómez-Lim, MÁ, and García, HS. Lipoxygenase activity associated to fruit ripening and senescence in chayote Sechium edulel Jacq Sw cv“virens levis”. J Food Biochem. (2018) 42:e12438. doi: 10.1111/jfbc.12438
7.Vieira, EF, Pinho, O, Ferreira, IM, and Delerue-Matos, C. Chayote (Sechium edulel): a review of nutritional composition, bioactivities and potential applications. Food Chem. (2019) 275:557–68. doi: 10.1016/j.foodchem.2018.09.146
8.Lombardo-Earl, G, Roman-Ramos, R, Zamilpa, A, Herrera-Ruiz, M, Rosas-Salgado, G, and Tortoriello, J. Extracts and fractions from edible roots of Sechium edulel (Jacq.) Sw. with antihypertensive activity. Evid-Based Compl Alt. (2014) 2014:e594326. doi: 10.1155/2014/594326
9.Fu, A, Wang, Q, Mu, J, Ma, L, and Zuo, J. Combined genomic, transcriptomic, and metabolomic analyses provide insights into chayote (Sechium edulel) evolution and fruit development. Hortic Res-England. (2021) 8:35. doi: 10.1038/s41438-021-00487-1
10.Wang, TY, Li, Q, and Bi, KS. Bioactive flavonoids in medicinal plants: structure, activity and biological fate. Asian J pharm Sci. (2018) 13:12–23. doi: 10.1016/j.ajps.2017.08.004
11.Shen, N, Wang, T, Gan, Q, Liu, S, Wang, L, and Jin, B. Plant flavonoids: classification, distribution, synthesis, and antioxidant activity. Food Chem. (2022) 383:132531. doi: 10.1016/j.foodchem.2022.132531
12.Lattanzio, V. Bioactive polyphenols: their role in quality and storability of fruit and vegetables. J Appl Bot-Angew Bot. (2003) 77:128–46. doi: 10.1023/A:1025994513043
13.Qi, X, Fang, H, Chen, Z, Li, Z, Yu, X, and Liang, C. Ectopic expression of a R2R3-MYB transcription factor gene Lja MYB12 from Lonicera japonica increases flavonoid accumulation in Arabidopsis thaliana. Int J Mol Sci. (2019) 20:4494. doi: 10.3390/ijms20184494
14.Ming, H, Wang, Q, Wu, Y, Liu, H, Zheng, L, and Zhang, G. Transcriptome analysis reveals the mechanism of anthocyanidins synthesis during grains development in purple corn (Zea mays L.). J Plant Physiol. (2021) 257:153328. doi: 10.1016/j.jplph.2020.153328
15.Yu, X, Yang, T, Qi, Q, Du, Y, Shi, J, Liu, X, et al. Comparison of the contents of phenolic compounds including flavonoids and antioxidant activity of rice (Oryza sativa) and Chinese wild rice (Zizania latifolia). Food Chem. (2021) 344:128600. doi: 10.1016/j.foodchem.2020.128600
16.Zhang, A, Zheng, J, Chen, X, Shi, X, Wang, H, and Fu, Q. Comprehensive analysis of transcriptome and metabolome reveals the flavonoid metabolic pathway is associated with fruit peel coloration of melon. Molecules. (2021) 26:2830. doi: 10.3390/molecules26092830
17.Wang, M, Chen, L, Liang, Z, He, X, Liu, W, Jiang, B, et al. Metabolome and transcriptome analyses reveal chlorophyll and anthocyanin metabolism pathway associated with cucumber fruit skin color. BMC Plant Biol. (2020) 20:386. doi: 10.1186/s12870-020-02597-9
18.Hu, Y, Li, Y, Zhang, W, Kou, G, and Zhou, Z. Physical stability and antioxidant activity of citrus flavonoids in arabic gum-stabilized microcapsules: modulation of whey protein concentrate. Food Hydrocoll. (2018) 77:588–97. doi: 10.1016/j.foodhyd.2017.10.037
19.Baltacioğlu, CEM, Velioğlu, S, and Karacabey, E. Changes in total phenolic and flavonoid contents of rowanberry fruit during postharvest storage. Food Quality. (2011) 34:278–83. doi: 10.1111/j.1745-4557.2011.00389.x
20.Aziz, A, Abdel-Wahab, FK, and El-Ghandour, MA. Effect of different storage temperatures on phenolic compounds in banana and mango fruits. Sci Hortic-Amsterdam. (1976) 4:309–15. doi: 10.1016/0304-4238(76)90098-4
21.Wang, B, He, J, Zhang, S, and Li, L. Nondestructive prediction and visualization of total flavonoids content in Cerasus Humilis fruit during storage periods based on hyperspectral imaging technique. J Food Process Eng. (2021) 44:e13807. doi: 10.1111/jfpe.13807
22.Robles-Sánchez, RM, Islas-Osuna, MA, Astiazarán-García, H, Vazquez-Ortiz, FA, Martín-Belloso, O, Gorinstein, S, et al. Quality index, consumer acceptability, bioactive compounds, and antioxidant activity of fresh-cut “Ataulfo” mangoes (Mangifera indica L.) as affected by low-temperature storage. J Food Sci. (2009) 74:S126–34. doi: 10.1111/j.1750-3841.2009.01104.x
23.Ramírez-Rodas, Y, Arévalo-Galarza, L, Cadena-Iñiguez, J, Delgado-Alvarado, A, Ruiz-Posadas, L, and Soto-Hernández, M. Postharvest storage of three chayote (Sechium edulel (Jacq.) Sw.) varieties. Scientia Agropecuaria. (2021) 12:239–47. doi: 10.17268/sci.agropecu.2021.027
24.Cavill, R, Jennen, D, Kleinjans, J, and Briedé, JJ. Transcriptomic and metabolomic data integration. Brief Bioinform. (2016) 17:891–901. doi: 10.1093/bib/bbv090
25.Maoz, I, De Rosso, M, Kaplunov, T, Vedova, AD, Sela, N, Flamini, R, et al. Metabolomic and transcriptomic changes underlying cold and anaerobic stresses after storage of table grapes. Sci Rep. (2019) 9:2917. doi: 10.1038/s41598-019-39253-8
26.Zhang, Y, Zhao, X, Ma, Y, Zhang, L, Jiang, Y, Liang, H, et al. Transcriptome and metabolome profiling to elucidate mechanisms underlying the blue discoloration of radish roots during storage. Food Chem. (2021) 362:130076. doi: 10.1016/j.foodchem.2021.130076
27.Wang, K, Yin, XR, Zhang, B, Grierson, D, Xu, C, and Chen, KS. Transcriptomic and metabolic analyses provide new insights into chilling injury in peach fruit. Plant Cell Environ. (2017) 40:1531–51. doi: 10.1111/pce.12951
28.Ying, Z, Liu, XH, Yuan, DB, Zheng, HJ, and Ying, Z. Effect of temperature on respiration and protective enzymes in chayote fruit. Acta Agr Boreali-Occidentalis Sinica. (2007) 23:885–90. doi: 10.1016/S1872-2075(07)60055-7
29.Watanabe, S, Ohtani, Y, Tatsukami, Y, Aoki, W, Amemiya, T, Sukekiyo, Y, et al. Folate biofortification in hydroponically cultivated spinach by the addition of phenylalanine. J Agric Food Chem. (2017) 65:4605–10. doi: 10.1021/acs.jafc.7b01375
30.Birkler, RID, Støttrup, NB, Hermannson, S, Nielsen, TT, Gregersen, N, Bøtker, H, et al. A UPLC–MS/MS application for profiling of intermediary energy metabolites in microdialysis samples-a method for high-throughput. J Pharmaceut Biomed. (2010) 53:983–90. doi: 10.1016/j.jpba.2010.06.005
31.Lee, YH, Kim, B, Kim, S, Kim, MS, Kim, H, Hwang, SR, et al. Characterization of metabolite profiles from the leaves of green perilla (Perilla frutescens) by ultra-high performance liquid chromatography coupled with electrospray ionization quadrupole time-of-flight mass spectrometry and screening for their antioxidant properties. J Food Drug Anal. (2017) 25:776–88. doi: 10.1016/j.jfda.2016.09.003
32.Wang, PJ, Chen, S, Gu, MY, Chen, XM, Chen, XJ, Yang, JF, et al. Exploration of the effects of different blue LED light intensities on flavonoid and lipid metabolism in tea plants via transcriptomics and metabolomics. Int J Mol Sci. (2020) 21:4606. doi: 10.3390/ijms21134606
33.Kellogg, JJ, Kvalheim, OM, and Cech, NB. Composite score analysis for unsupervised comparison and network visualization of metabolomics data. Anal Chim Acta. (2020) 1095:38–47. doi: 10.1016/j.aca.2019.10.029
34.Kim, TK. T test as a parametric statistic. Korean J Anesthesiol. (2015) 68:540–6. doi: 10.4097/kjae.2015.68.6.540
35.Xu, W, Dubos, C, and Lepiniec, L. Transcriptional control of flavonoid synthesis by MYB-bHLH-WDR complexes. Trends in Plant Sci. (2015) 20:176–85. doi: 10.1016/j.tplants.2014.12.001
36.Yuan, Y, Shi, Y, and Tang, D. Isolation and characterization of R2R3-MYB and basic helix-loop-helix (bHLH) transcription factors involved in anthocyanin synthesis in tulip tepals. Acta Physiol Plant. (2020) 42:32. doi: 10.1007/s11738-020-3026-3
37.Amato, A, Cavallini, E, Zenoni, S, Finezzo, L, Begheldo, M, Ruperti, B, et al. A grapevine TTG2-like WRKY transcription factor is involved in regulating vacuolar transport and flavonoid synthesis. Front Plant Sci. (2017) 7:1979. doi: 10.3389/fpls.2016.01979
38.Han, H, Xu, F, Li, Y, Yu, L, Fu, M, Liao, Y, et al. Genome-wide characterization of bZIP gene family identifies potential members involved in flavonoids synthesis in Ginkgo biloba L. Sci Rep. (2021) 11:23420. doi: 10.1038/s41598-021-02839-2
39.Yang, Y, He, Z, Bing, Q, Duan, X, Chen, S, Zeng, M, et al. Two Dof transcription factors promote flavonoid synthesis in kumquat fruit by activating C-glucosyltransferase. Plant Sci. (2022) 318:111234. doi: 10.1016/j.plantsci.2022
40.Stracke, R, Jahns, O, Keck, M, Tohge, T, Niehaus, K, Fernie, AR, et al. Analysis of production of flavonol glycosides-dependent flavonol glycoside accumulation in Arabidopsis thaliana plants reveals MYB11-, MYB12-and MYB111-independent flavonol glycoside accumulation. New Phytol. (2010) 188:985–1000. doi: 10.1111/j.1469-8137.2010.03421.x
41.Koeduka, T. The phenylpropene synthase pathway and its applications in the engineering of volatile phenylpropanoids in plants. Plant Biotechnol-Nar. (2014) 31:401–7. doi: 10.5511/plantbiotechnology.14.0801a
42.Pu, YT, Luo, Q, Wen, LH, Li, YR, Meng, PH, Wang, XJ, et al. Origin, evolution, breeding, and omics of chayote, an important Cucurbitaceae vegetable crop. Front Plant Sci. (2021) 12:739091. doi: 10.3389/fpls.2021.739091
43.Martínez, C, Valenzuela, JL, and Jamilena, M. Genetic and pre-and postharvest factors influencing the content of antioxidants in cucurbit crops. Antioxidants. (2021) 10:894. doi: 10.3390/antiox10060894
44.Aung, LH, Harris, CM, Rij, R, and Brown, JW. Postharvest storage temperature and film wrap effects on quality of chayote Sechium edulel. Sw J Hortic Sci. (1996) 71:297–304. doi: 10.1080/14620316.1996.11515408
45.Md-Mustafa, ND, Khalid, N, Gao, H, Peng, Z, Alimin, MF, Bujang, N, et al. Transcriptome profiling shows gene regulation patterns in a flavonoid pathway in response to exogenous phenylalanine in Boesenbergia rotunda cell culture. BMC Genomics. (2014) 15:1–25. doi: 10.1186/1471-2164-15-984
46.Chen, X, Wang, P, Zheng, Y, Gu, M, Lin, X, Wang, S, et al. Comparison of metabolome and transcriptome of flavonoid synthesis pathway in a purple-leaf tea germplasm Jinmingzao and a green-leaf tea germplasm Huangdan reveals their relationship with genetic mechanisms of color formation. Int J Mol Sci. (2020) 21:4167. doi: 10.3390/ijms21114167
47.Cao, K, Wang, B, Fang, W, Zhu, G, Chen, C, Wang, X, et al. Combined nature and human selections reshaped peach fruit metabolome. Genome Biol. (2022) 23:146–54. doi: 10.1186/s13059-022-02719-6
48.Zhan, X, Luo, X, He, J, Zhang, C, Liao, X, Xu, X, et al. Bioactive compounds induced in Physalis angulata L. by methyl-jasmonate: an investigation of compound accumulation patterns and synthesis-related candidate genes. Plant Mol Biol. (2020) 103:341–54. doi: 10.1007/s11103-020-00996-y
49.Li, D, Chen, G, Ma, B, Zhong, C, and He, N. Metabolic profiling and transcriptome analysis of mulberry leaves provide insights into flavonoid synthesis. J Agr Food Chem. (2020) 68:1494–504. doi: 10.1021/acs.jafc.9b06931
50.Chen, C, Zhou, G, Chen, J, Liu, J, Lu, X, and Chen, H. Integrated metabolome and transcriptome analysis unveils novel pathway involved in the formation of yellow peel in cucumber. Int J Mol Sci. (2021) 22:e1494. doi: 10.3390/ijms22031494
51.Zhu, X, Jiang, J, Yin, C, Li, G, Jiang, Y, and Shan, Y. Effect of ozone treatment on flavonoid accumulation of Satsuma mandarin (Citrus unshiu Marc.) during ambient storage. Biomol Ther. (2019) 9:e821. doi: 10.3390/biom9120821
52.Lister, CE, Lancaster, JE, Sutton, KH, and Walker, JR. Developmental changes in the concentration and composition of flavonoids in skin of a red and a green apple cultivar. J Sci Food Agri. (1994) 64:155–61. doi: 10.1002/jsfa.2740640204
53.Yang, B, Liu, H, Yang, J, Gupta, VK, and Jiang, Y. New insights on bioactivities and biosynthesis of flavonoid glycosides. Trends Food Sci. Tech. (2018) 79:116–24. doi: 10.1016/j.tifs.2018.07.006
54.Kumar, S, and Pandey, AK. Chemistry and biological activities of flavonoids: an overview. The Scientific World J. (2013) 2013:e162750. doi: 10.1155/2013/162750
55.Shah, A, and Smith, DL. Flavonoids in agriculture: chemistry and roles in, biotic and abiotic stress responses, and microbial associations. Agronomy. (2020) 10:1209. doi: 10.3390/agronomy10081209
56.Du, H, Huang, Y, and Tang, Y. Genetic and metabolic engineering of isoflavonoid synthesis. Appl. Microbiol. Biot. (2010) 86:1293–312. doi: 10.1007/s00253-010-2512-8
57.Veitch, NC. Isoflavonoids of the leguminosae. Nat Prod Rep. (2013) 30:988–1027. doi: 10.1039/b511238a
58.Li, X, and Chen, S. Dhaubhadel, 14-3-3 proteins regulate the intracellular localization of the transcriptional activator GmMYB176 and affect isoflavonoid synthesis in soybean. Plant J. (2012) 71:239–50. doi: 10.1111/j.1365-313X.2012.04986.x
59.Mazur, WM, Duke, JA, Wähälä, K, Rasku, S, and Adlercreutz, H. Isoflavonoids and lignans in legumes: nutritional and health aspects in humans. J Nutr Biochem. (1998) 9:193–200. doi: 10.1016/S0955-2863(97)00184-8
60.Miadoková, E. Isoflavonoids-an overview of their biological activities and potential health benefits. Interdiscip Toxicol. (2009) 2:211–8. doi: 10.2478/v10102-009-0021-3
61.Solecka, D. Role of phenylpropanoid compounds in plant responses to different stress factors. Acta Physiol Plant. (1997) 19:257–68. doi: 10.1007/s11738-997-0001-1
62.Izbiańska, K, Arasimowicz-Jelonek, M, and Deckert, J. Phenylpropanoid pathway metabolites promote tolerance response of lupine roots to lead stress. Ecotox Environ Safe. (2004) 110:61–7. doi: 10.1016/j.ecoenv.2014.08.014
63.Bartwal, A, Mall, R, Lohani, P, Guru, SK, and Arora, S. Role of secondary metabolites and brassinosteroids in plant defense against environmental stresses. J Plant Growth Regul. (2013) 32:216–32. doi: 10.1007/s11738-997-0001-1
64.Wang, Y, Chen, S, and Yu, O. Metabolic engineering of flavonoids in plants and microorganisms. Appl Microbiol Biot. (2011) 91:949–56. doi: 10.1007/s00253-011-3449-2
65.Singh, R, Rastogi, S, and Dwivedi, UN. Phenylpropanoid metabolism in ripening fruits. Compr Rev Food Sci F. (2010) 9:398–416. doi: 10.1111/j.1541-4337.2010.00116.x
66.Boubakri, H, Poutaraud, A, Wahab, MA, Clayeux, C, Baltenweck-Guyot, R, and Steyer, D. Thiamine modulates metabolism of the phenylpropanoid pathway leading to enhanced resistance to Plasmopara viticola in grapevine. BMC Plant Biol. (2013) 13:31. doi: 10.1186/1471-2229-13-31
67.Zhu, TT, Liu, H, Wang, PY, Ni, R, Sun, CJ, Yuan, JC, et al. Functional characterization of UDP-glycosyltransferases from the liverwort Plagiochasma appendiculatum and their potential for biosynthesizing flavonoid 7-O-glucosides. Plant Sci. (2020) 299:110577. doi: 10.1016/j.plantsci.2020.110577
68.Xie, L, Cao, Y, Zhao, Z, Ren, C, Xing, M, Wu, B, et al. Involvement of MdUGT75B1 and MdUGT71B1 in flavonol galactoside/glucoside biosynthesis in apple fruit. Food Chem. (2020) 312:126124. doi: 10.1016/j.foodchem
69.Yu, X, Zhu, Y, Fan, J, Wang, D, Gong, X, and Ouyang, Z. Accumulation of flavonoid glycosides and UFGT gene expression in mulberry leaves (Morus alba L.) before and after frost. Chem Biodivers. (2017) 14:4. doi: 10.1002/cbdv.201600496
70.Yao, JB, Xing, XW, Yu, LY, and Wang, Y. Structure function relationships in plant UDP-glycosyltransferases. Ind Crop Prod. (2022) 189:115784. doi: 10.1016/j.indcrop.2022.115784
71.Yang, B, Liu, H, Yang, J, Gupta, VK, and Jiang, Y. New insights on bioactivities and synthesis of flavonoid glycosides. Trends Food Sci Tech. (2018) 79:116–24. doi: 10.1016/j.tifs.2018.07.006
72.Matsui, K, Oshima, Y, Mitsuda, N, Sakamoto, S, Nishiba, Y, Walker, AR, et al. Buckwheat R2R3 MYB transcription factor FeMYBF1 regulates flavonol biosynthesis. Plant Sci. (2018) 274:466–75. doi: 10.1016/j.plantsci.2018.06.025
73.Yang, L, Liu, H, Hao, Z, Zong, Y, Xia, H, Shen, Y, et al. Genome-wide identification and expression analysis of R2R3-MYB family genes associated with petal pigment synthesis in liriodendron. Int J Mol Sci. (2021) 22:11291. doi: 10.3390/ijms222011291
74.Liu, J, Osbourn, A, and Ma, P. MYB transcription factors as regulators of phenylpropanoid metabolism in plants. Mol Plant. (2015) 8:689–708. doi: 10.1016/j.molp.2015.03.012
75.Dubos, C, Stracke, R, Grotewold, E, Weisshaar, B, Martin, C, and Lepiniec, L. MYB transcription factors in Arabidopsis. Trends Plant Sci. (2010) 15:573–81. doi: 10.1016/j.tplants.2010.06.005
76.Li, L, He, Y, Ge, H, Liu, Y, and Chen, H. Functional characterization of SmMYB86, a negative regulator of anthocyanin biosynthesis in eggplant (Solanum melongena L.). Plant Sci. (2021) 302:110696. doi: 10.1016/j.plantsci.2020.110696
Keywords: Sechium edulel, metabolite profiling, transcriptome profiling, flavonoids, DEGs
Citation: Pu Y, Wang C, Jiang Y, Wang X, Ai Y and Zhuang W (2023) Metabolic profiling and transcriptome analysis provide insights into the accumulation of flavonoids in chayote fruit during storage. Front. Nutr. 10:1029745. doi: 10.3389/fnut.2023.1029745
Edited by:
Liang Zeng, Southwest University, ChinaCopyright © 2023 Pu, Wang, Jiang, Wang, Ai and Zhuang. This is an open-access article distributed under the terms of the Creative Commons Attribution License (CC BY). The use, distribution or reproduction in other forums is permitted, provided the original author(s) and the copyright owner(s) are credited and that the original publication in this journal is cited, in accordance with accepted academic practice. No use, distribution or reproduction is permitted which does not comply with these terms.
*Correspondence: XiaoJing Wang, eGp3YW5nOEBnenUuZWR1LmNu; YuJie Ai, Y3VzYm9haXl1amllQDEyNi5jb20=; WeiBing Zhuang, d2VpYmluZ3podWFuZ25qQHNpbmEuY29t
Disclaimer: All claims expressed in this article are solely those of the authors and do not necessarily represent those of their affiliated organizations, or those of the publisher, the editors and the reviewers. Any product that may be evaluated in this article or claim that may be made by its manufacturer is not guaranteed or endorsed by the publisher.
Research integrity at Frontiers
Learn more about the work of our research integrity team to safeguard the quality of each article we publish.