
94% of researchers rate our articles as excellent or good
Learn more about the work of our research integrity team to safeguard the quality of each article we publish.
Find out more
ORIGINAL RESEARCH article
Front. Nutr. , 15 September 2022
Sec. Food Chemistry
Volume 9 - 2022 | https://doi.org/10.3389/fnut.2022.992188
 Jiahui Liu1,2,3Tengfei Li3Hongwei Qin1,2Linsen Li4Mengmeng Yan1,2*
 Chao Zhu1,2*Feng Qu4
 A. M. Abd El-Aty5,6,7
Lactoferrin (Lf), an iron-binding glycoprotein, regulates the immune system. It has broad-spectrum antimicrobial activity and is critical for child physical growth and development. As a common additive in the dairy industry, it is crucial to quantify LF content. This study established a self-assembly and universal fluorescence aptasensor for detecting LF in milk powder based on structure-selective dyes of PicoGreen intercalated in the label-free aptamer. Herein, the aptamer functions as both a specific recognition element against targets and a fluorescent signal reporter integrated with structure-selective dyes. First, the aptamer folds into a three-dimensional spatial structure based on complementary base pairings and intermolecular weak non-covalent interactions. Then, the dye is intercalated into the minor groove structures of the aptamer and triggers its potential fluorescent property. When the target exists, the aptamer binds to it preferentially, and its space structure unfolds. This causes the freeing of the subsequent dye and decreases the corresponding fluorescence. Hence, the reflected fluorescence signals could directly determine the target concentrations. Under the optimum conditions, a good linear relationship (R2, 0.980) was obtained in the Lf range from 20 to 500 nM with a detection limit of 3 nM (2.4 mg/kg) and good specificity, as well as a reliable recovery of 95.8–105.1% in milk powder. In addition, the universality was also confirmed with a good performance by quickly changing the aptamers against other targets (chlorpyrifos, acetamiprid, bovine thyroglobulin, and human transferrin) or utilizing another fluorescence dye. Therefore, this self-assembly aptasensor provides a universal and concise strategy for effective detection.
Lactoferrin (LF) is an essential biofunctional iron-binding protein of the innate immune system with a molecular weight of approximately 80 kDa. It affects host defense and tumor growth inhibition and has antibacterial, antiviral, and antiparasitic activities (1, 2). Recently, LF has been applied in dairy products and commercial foods for non-breastfed infants as a functional component, promoting optimal growth (3, 4). In 2012, the GB14880-2012 “Food Nutrition Fortification Use Standard” issued by the National Health and Wellness Commission of the People’s Republic of China listed LF as a nutritional fortification and set the maximum use of LF at 100 mg/100 × g for infant foods. To date, different analytical techniques have been established (5). Although chromatographic methods, such as high-performance liquid chromatography (HPLC) (6, 7), high-performance capillary electrophoresis (HPCE) (8), and high-performance liquid chromatography-tandem mass spectrometry (HPLC-MS/MS) (9), have good reproducibility and high accuracy, they would require complex pretreatment processes and professional personnel to operate. In recent years, antibody-based biosensors, such as electrochemical sensors (10), surface-enhanced Raman spectroscopy (11), and enzyme-linked immunosorbent assays (12), have gradually been used to detect LF. However, the antibody is generally more expensive, complicated to prepare with animal immunization experiments, and requires strict conditions to ensure its stability. Hence, simple and convenient methods are of great significance for sensitive LF detection.
Nucleic acid aptamers are single-stranded deoxyribonucleic acid (DNA) or RNA sequences generated from a random oligonucleotide library through the systematic evolution of ligands by exponential enrichment (SELEX) (13, 14). They exhibit many advantages, such as small size, simple synthesis, good stability, and non-immunogenic nature, as viable alternatives to antibodies (15). Numerous aptasensors (16) have been recently established. Among them, fluorescence-based aptasensors are the most common type, featuring simplicity, fast response, high sensitivity, and universal applicability (17, 18). However, most of them require labeling aptamers or modifying bases with fluorescent groups, which are time-consuming and expensive, and the affinity of the aptamer to the target and the detection sensitivity are affected (19). Therefore, label-free fluorescent aptasensors have attracted much interest due to their flexible design and versatility.
As an essential type of single-stranded oligonucleotide, aptamers display three prominent characteristics for developing label-free fluorescent sensors (20, 21). (i) The aptamer exhibits multiple negatively charged phosphate functional groups, which result in the aggregation of positively charged small molecule probes and enable efficient probe fluorescence quenching, such as perylene (22), pyrene (23), silole (24), and tetraphenylethene (25) derivatives. (ii) Some special folded spatial conformations of aptamers, such as protoporphyrin (26), malachite green, thioflavin T (27), N-methyl mesoporphyrin IX (28), and DFHBI (29), could enable the intercalation of dyes to produce strong fluorescence (30). (iii) The aptamer can be easily hybridized with its complementary chain, forming a double helix conformation of double-stranded DNA (dsDNA) through hydrogen bonding from base pairing (31). Thus, some minor groove binding dyes could specifically intercalate into dsDNA, inducing exponential fluorescence enhancement and enabling sensitive detection of PicoGreen (PG) (32), SYBR Green I (SGI) (33), and AccuBlue (34). There are inherent base-complementary pairings in the self-assembly structure of the aptamers’ flexible folding. Therefore, the minor groove-binding dyes could also intercalate into the aptamer structure to fabricate various aptasensors.
Herein, a self-assembly and universal fluorescence aptasensor was designed for the sensitive detection of LF in milk powder based on the specific embedding dye PicoGreen (PG), of which there are few pieces of literature introducing PG-based self-assembly aptasensors. PG is a highly ultrasensitive fluorescent dye that does not fluoresce when it is free. Upon binding to dsDNA and inducing a >1,000-fold fluorescence enhancement (35), dsDNA detection concentrations as low as 25 pg⋅mL–1 were enabled. The aptamer against LF was screened using capillary electrophoresis (CE)-SELEX by our group in 2020 with good affinity (KD, 20.74 nM) and specificity (36). Without LF, the aptamers formed a specific spatial structure by self-assembly folding. The dyes recognized the minor groove structures and intercalated into them, generating a noteworthy augmentation of the fluorescence signal. In the presence of LF, the aptamer binds to it preferentially, and its space structure is unfolded. This caused the freeing of the subsequent dye and decreased the corresponding fluorescence. In addition, the universality was also confirmed against the other four targets or utilizing another dye. This label-free strategy achieved universal and sensitive detection only by “mix-and-detect” procedures, contenting the need to design simple and feasible aptasensors.
Lactoferrin (LF, from bovine milk), α-lactalbumin (α-La), casein (CS), chlorpyrifos, β-lactoglobulin (β-Lg), serum albumin (SA), and acetamiprid were procured from Sigma-Aldrich (Shanghai, China). Bovine thyroglobulin (TG) and human transferrin (H-TF) were acquired from Shanghai Yuanye Bio-Technology Co., Ltd. (Shanghai, China). Pico Green (PG) was procured from Shanghai BioScience Co., Ltd. (Shanghai, China), and SYBR Green I (SGI) was secured from Thermo Fisher Scientific Inc. (Bartlesville, United States). Acetic acid was purchased from Sinopharm Chemical Reagent Co., Ltd. (Shanghai, China). Three different milk powders were obtained from a local store. The aptamers were synthesized by Sangon Biotechnology Co., Ltd. (Shanghai, China), and the aptamer sequences are listed in Supplementary Table 1.
A high-speed refrigerated centrifuge (Neofuge 15R, Heal Force, Shanghai, China) and a vortex coagulator (Vortex 2, IKA, Staufen, Germany) were used to process the milk powders. Ultrapure water with a specific resistance of 18.25 MΩ cm was obtained from a Millipore filtration system (Millipore, Bedford, MA, United States). The fluorescence intensity was scanned by a microplate reader (Synergy HTX, BioTek, Vermont, United States) with an excitation wavelength of 485 nm and an emission wavelength of 528 nm. The 50 μm id bare capillary with a total length of 32.6 cm (effective length 20.3 cm) was obtained from Sino Sumtech (Handan, Hebei, China). High-performance capillary electrophoresis (HPCE) equipped with a UV detector (214 nm) was supported by Hanon Group (Jinan, China).
First, we optimized the concentration of PG. Then, 10 μL of PG at different concentrations (1 × , 3 × , 5 × , 7 × , 10 × , and 20 × ) was added to a solution containing 30 μL of 100 nM aptamer and incubated for 5 min at room temperature. The fluorescence intensities at 528 nm were recorded with a microplate reader, and the excitation wavelength was 485 nm.
LF aptamer (30 μL, 100 nM) was incubated with LF solution (60 μL, different concentrations) for 15 min at room temperature. Then, 10 μL of PG (5 × ) was added and reacted for 5 min, and the fluorescence values were determined by a microplate reader.
A certain amount (0.04 g) of milk powder was accurately weighed and then dissolved in 30 mM acetic acid solution and centrifuged at 5,000 rpm for 15 min (to dissolve fat and sediment protein). The supernatant (approximately 400 μL) was diluted with an equal volume of ultrapure water and passed through a 0.22 μm filter membrane. First, we chose one commercially available milk powder labeled with no LF as a blank sample, and its matrix solution was spiked with standard LF at concentrations of 0, 10, 20, 50, 100, 200, 500, and 1,000 nM. The linear relationship between quenching efficiencies (F0–F)/F0 and LF concentrations was fitted.
Three LF concentrations of 50, 100, and 200 nM were chosen in the recovery assay. Before the blank milk powder treatment, the LF stock solutions were spiked into the milk powder. After that, the fluorescence intensities of the processed samples were recorded, and the recoveries were calculated according to the calibration curve constructed in the matrix. In the actual application, the milk powder with three different LF concentration contents was treated and measured, and the LF content was calculated from the fluorescence intensities.
Four targets were selected as follows: chlorpyrifos (350.59 g/mol), acetamiprid (222.68 g/mol), TG (660 kDa), and H-TF (76 kDa). Under the optimal experimental conditions, the applicability of each target was investigated. The flexibility is verified by utilizing another fluorescent dye, SGI. First, the optimal concentration of SGI in the sensor system was determined. Then, the detection performance of the sensing system using SGI as a fluorescent probe was investigated under optimal conditions.
The bare capillaries were rinsed with 1 M NaOH for 25 min and then with ultrapure water for 5 min. In the HPCE assay, sequential rinses for the capillary with 1 M NaOH, water, and running buffer solution each for 3 min were required between each run. The sample was injected at 0.5 psi for 20 s or the required time. The detection wavelength was set to 214 nm. During separation, a high voltage of 12 kV (the inlet as the anode) and a temperature of 22°C were maintained.
A total of 20 μL of LF aptamer (100 nM) was incubated with 50 μL of different concentrations (300–3,000 nM) of LF standard solution for 15 min at room temperature. Then, 20 μL of 300 nM complementary DNA (cDNA) was added and incubated for 30 min. Subsequently, 10 μL of PG (7×) was added, and the fluorescence values were scanned with a microplate reader after 5 min.
As depicted in Figure 1A, the sensing system for LF detection consisted of three parts: aptamers, PG dyes, and LF targets. Without LF, the aptamers formed a specific spatial structure by self-assembly folding due to the combined and additive effect of complementary base pairings and intermolecular weak non-covalent interactions (e.g., electrostatic and π-π interactions, hydrophobic effects, hydrogen bonding and van der Waals forces). At this stage, the PG dyes recognized the minor groove structures, intercalated into them, and stimulated their potential fluorescent properties, initiating a strong fluorescence. LF targets induced configuration changes in aptamers owing to their high-affinity bonding, concurrently forcing the amount of the inserted dyes to decrease and causing a significant reduction in the fluorescence signal. Hence, the LF target concentrations could be directly determined through the reflected fluorescence signals.
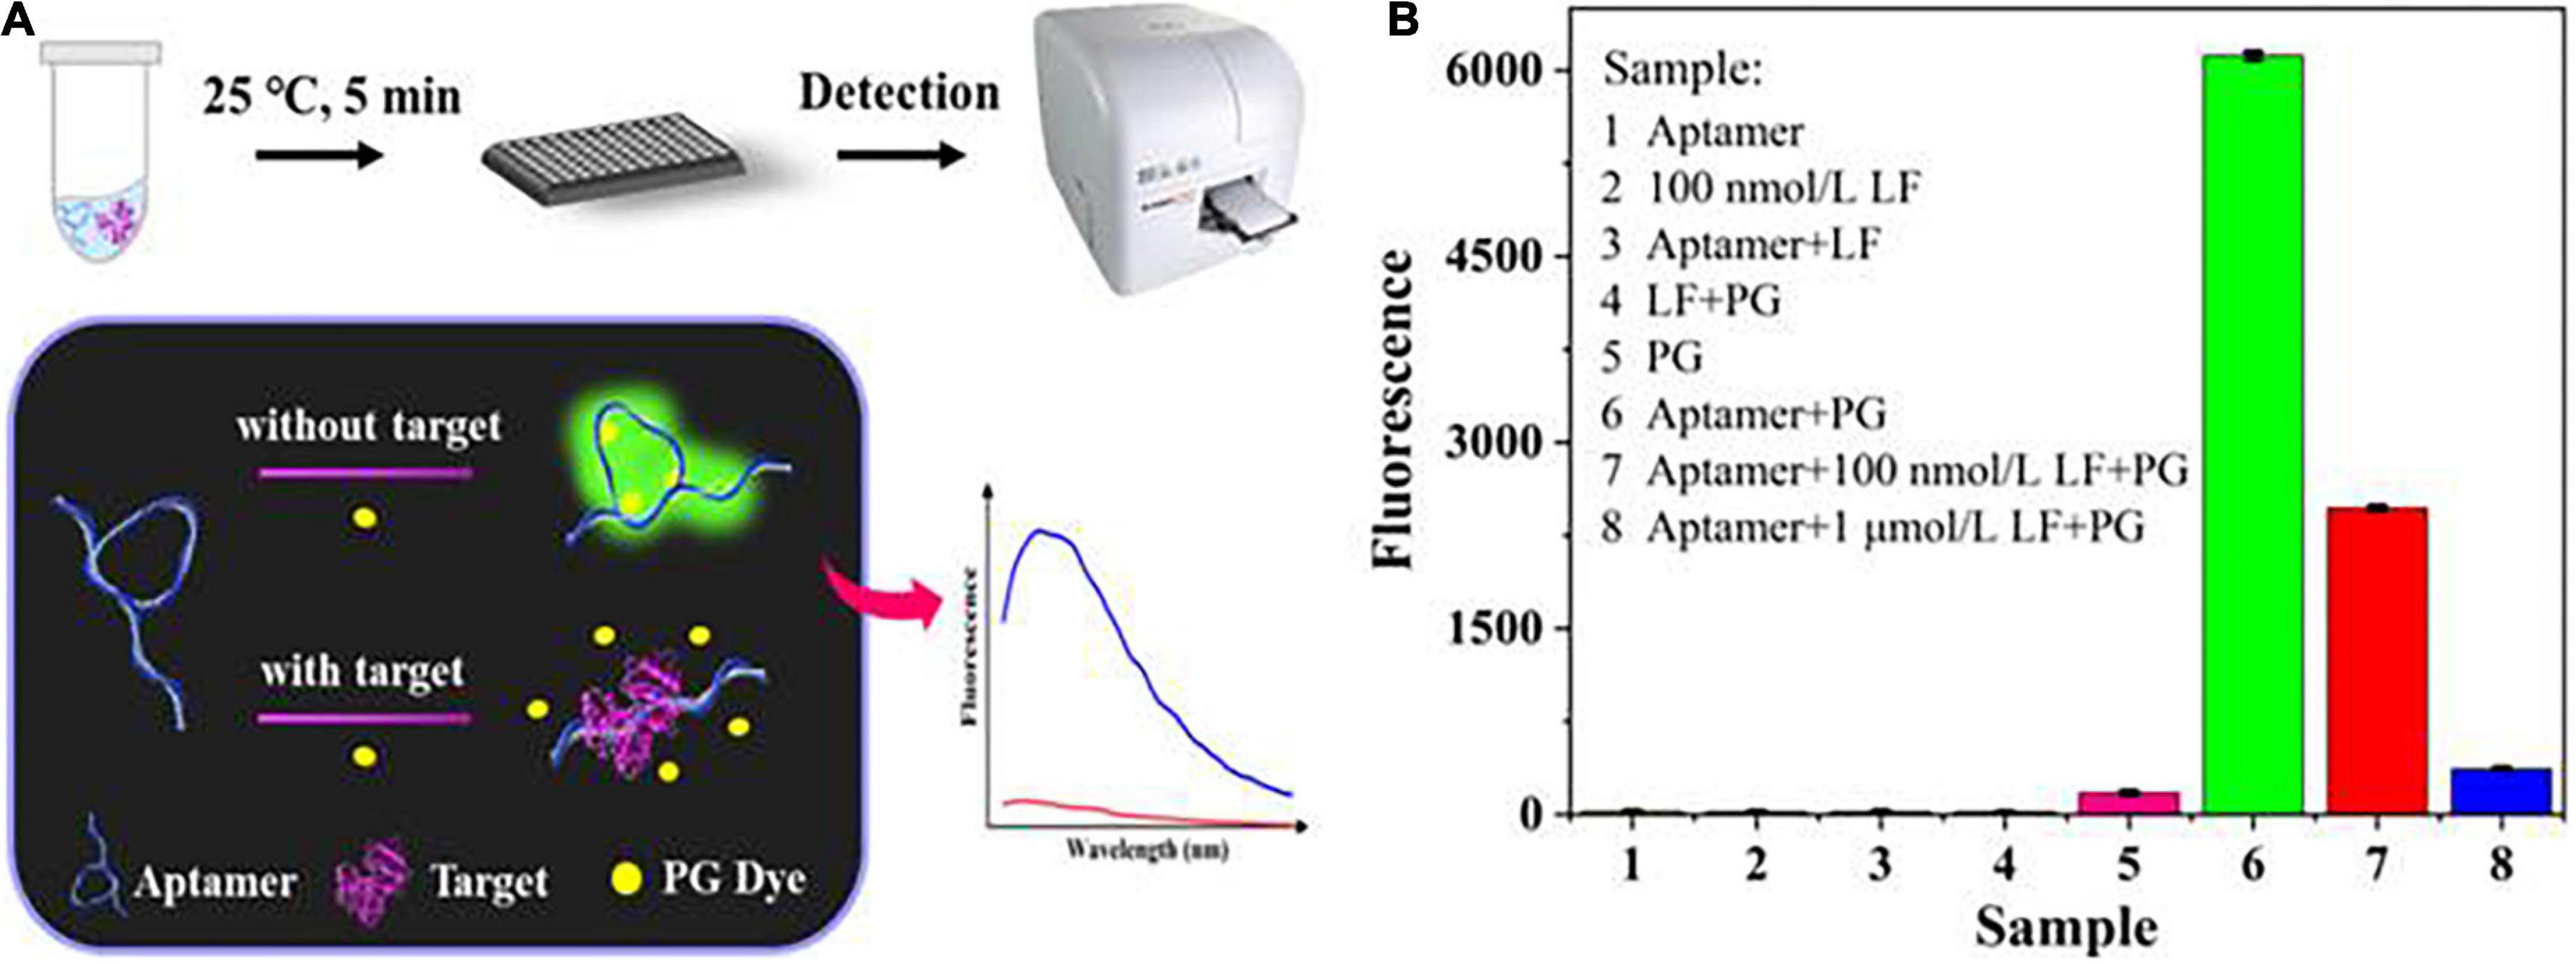
Figure 1. (A) The principle of the label-free aptasensor strategy for LF detection. (B) Feasibility verification of the aptasensor.
Figure 1B shows the feasibility of the sensing system (fluorescence spectra in Supplementary Figure 1A). The mixture of PG and aptamer generated a distinct fluorescence enhancement. In contrast, no single component produced substantially no fluorescence, which indicated that PG had availably intercalated into the partial spatial structures of the aptamer. Adding LF (100 nM, 1 μM) decreased the fluorescence, suggesting that the aptamer was more inclined to bind with its target LF, thus retaining more free PG dye. This phenomenon can also be explained by our previous molecular docking model (36) of aptamer/LF recognition that involved the 18 amino acids of LF and 17 key bases of aptamer, whose interaction would unfold the spatial structure of the aptamer and free the dyes. The result preliminarily proves that the experimental principle is feasible.
The concentration and incubation time of PG were optimized to achieve optimal performance. Supplementary Figure 1B shows the effect of different concentrations of PG on the fluorescence signal. The maximum fluorescence intensity value was obtained when the PG concentration was increased to 5 × , indicating that at this concentration, PG can completely intercalate into the minor groove of the aptamer. Nevertheless, the fluorescence values tended to decrease when the concentration was more than 5 × because an excessively high PG concentration would cause a spatial site resistance effect and thus affect the fluorescence intensity. Therefore, 5 × PG was used for further experiments. In addition, the reaction time of PG also plays a vital role in the sensing process. Supplementary Figure 1C shows that the fluorescence intensity maintained a plateau within 5–30 min of incubation time. To improve the detection efficiency, the incubation time was determined to be 5 min.
The sensing performance was evaluated in terms of sensitivity, specificity, and stability. Figure 2A shows that the fluorescence intensity declined progressively as the concentration of LF increased from 0 to 3,000 nM and reached a plateau when the concentration surpassed 500 nM. The fluorescence quenching efficiency (F0-F)/F0 showed a good linear relationship with LF concentration in the range of 20–500 nM (in logarithmic form) with a correlation coefficient (R2) of 0.992 (Figure 2A inset image). The limit of detection (LOD, 3σ/k) was 2 nM. The value of (F0–F)/F0 is defined as the quenching efficiency, where F0 and F are the fluorescence values in the absence and presence of LF, respectively. The proposed aptasensor presented an available performance only through a simple “mix-and-detect” procedure.
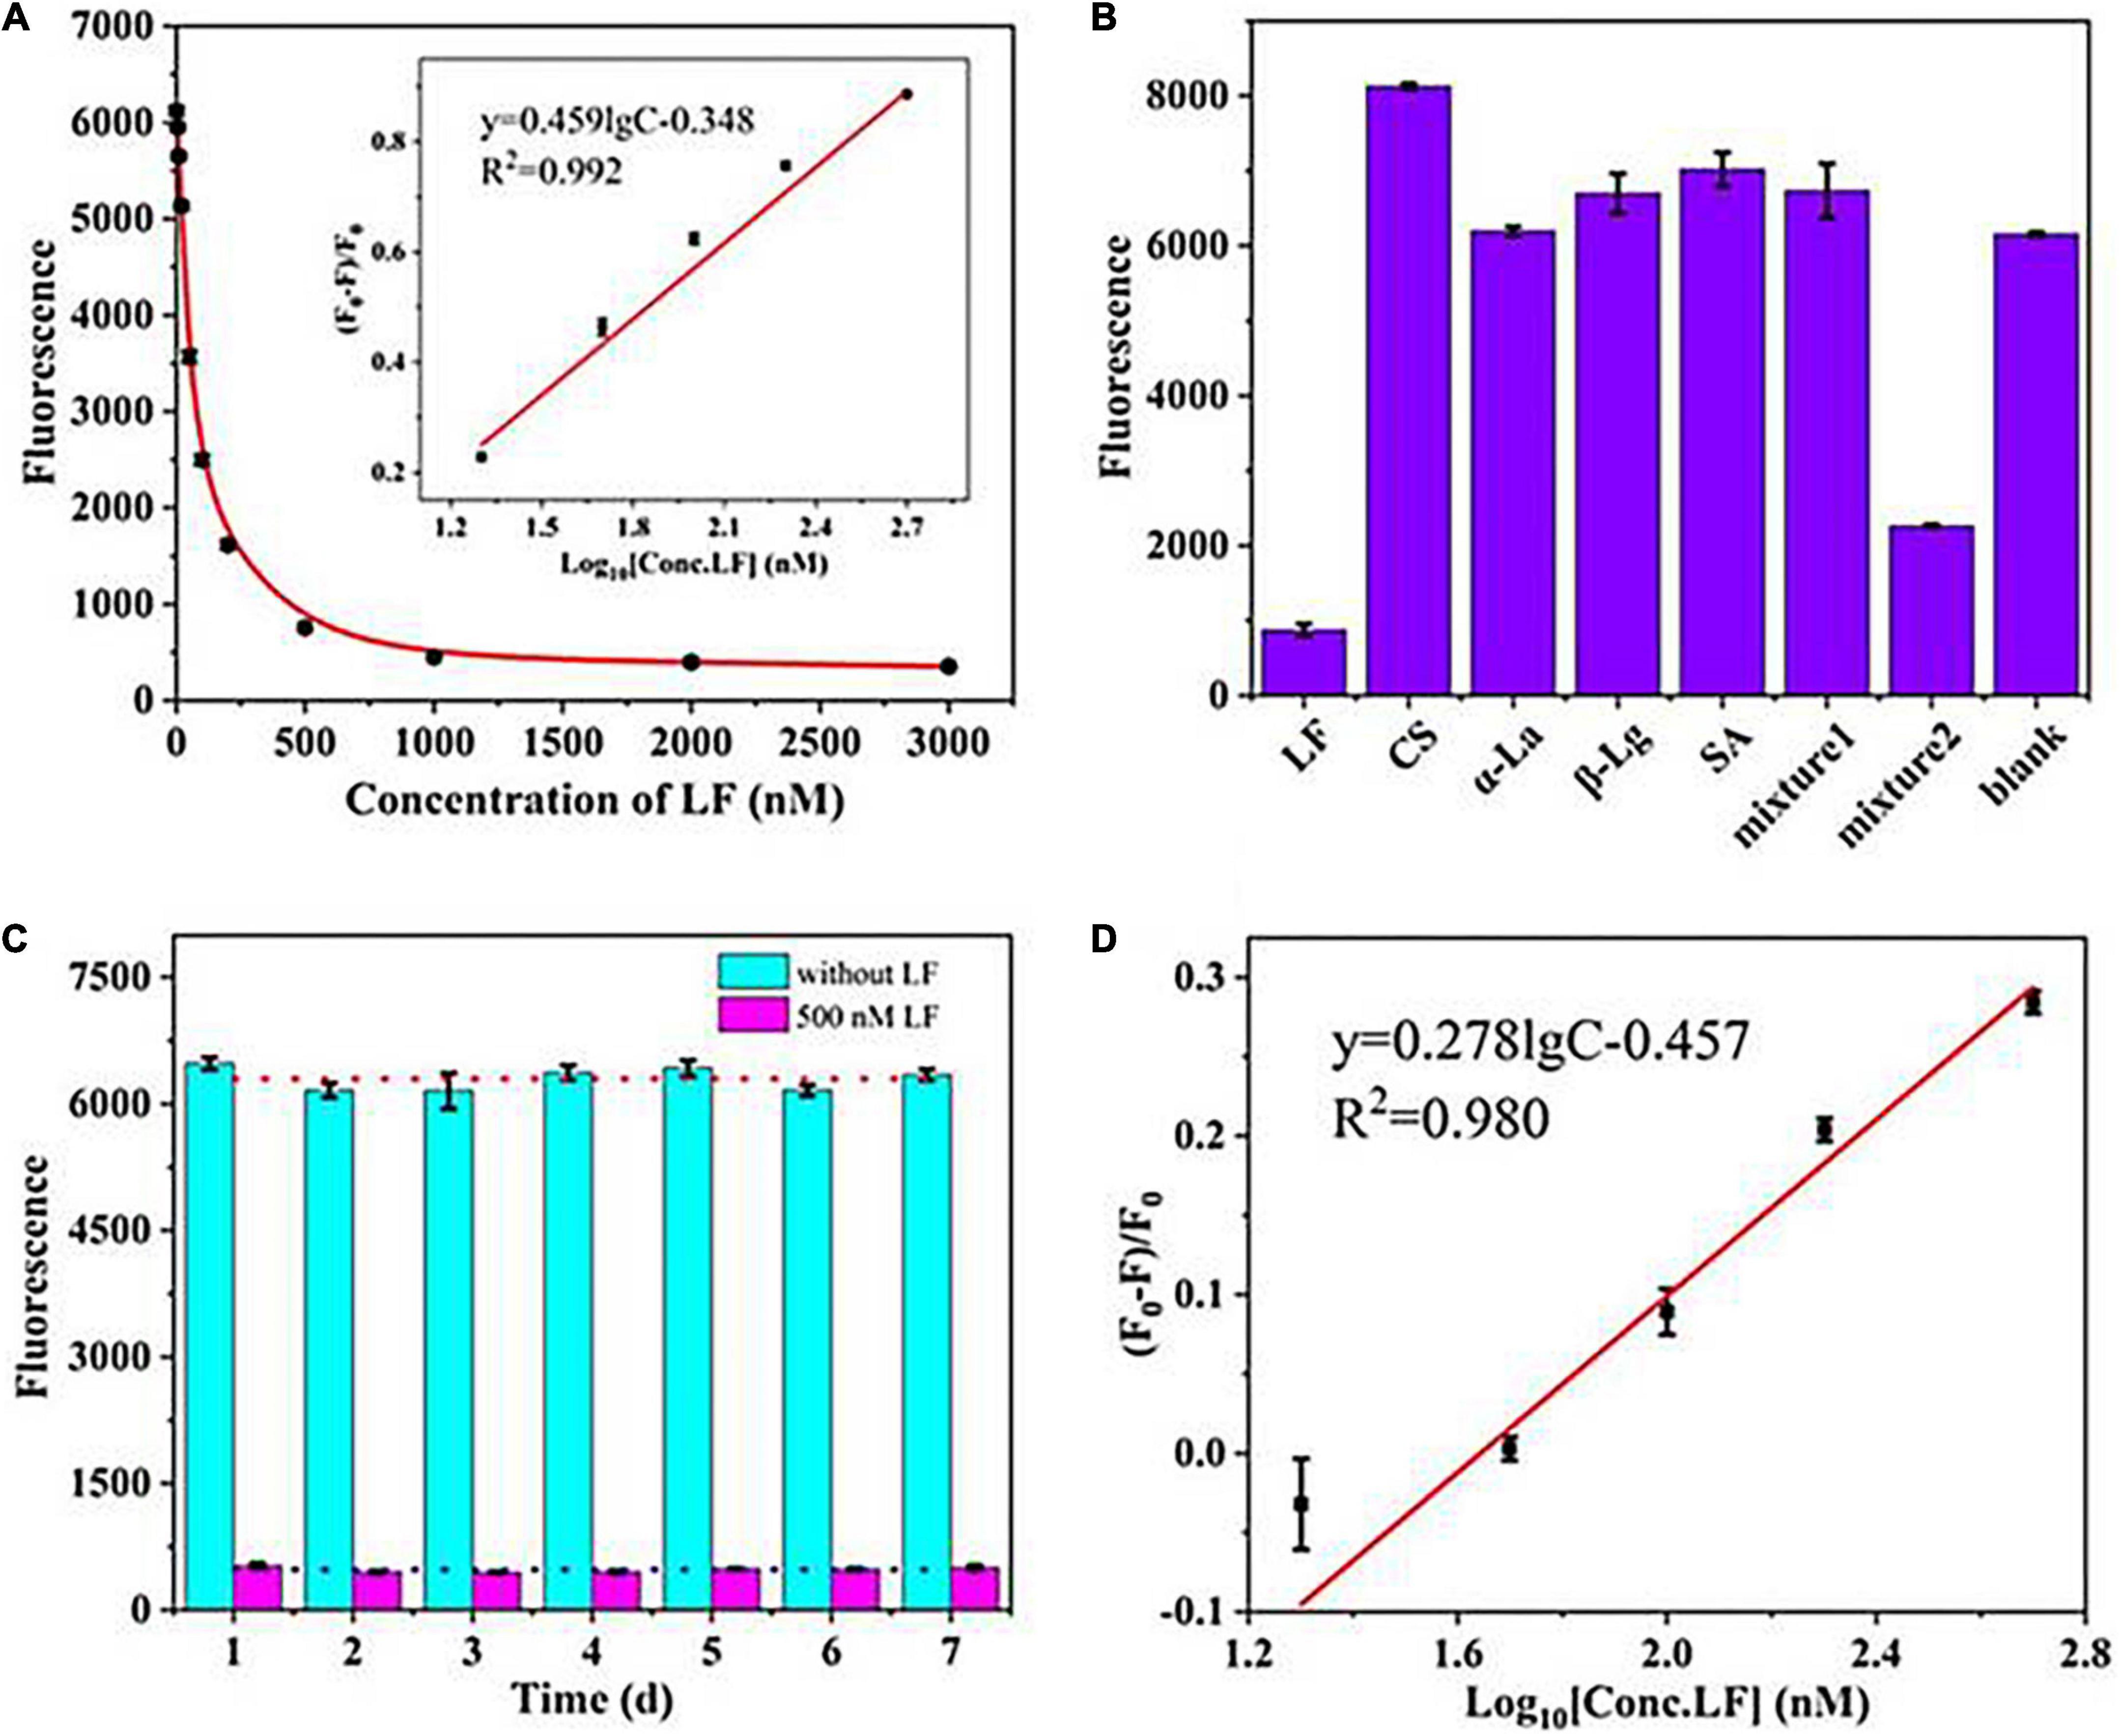
Figure 2. (A) The linear relationship between (F0–F)/F0 and the concentrations of LF. (B) The specificity of the aptasensor strategy. (C) Stability assessment of the fluorescence aptasensors. (D) The calibration curve in milk powder matrix.
To investigate the specificity of the sensing strategy, four types of high-abundance proteins commonly found in milk at high concentrations were tested, including serum albumin (SA), casein (CS), β-lactoglobulin (β-Lg), and α-lactalbumin (α-La). Figure 2B shows only LF, and mixture 2 (containing LF, CS, α-La, β-Lg, and SA) presented a noticeable reduction in fluorescence intensities in the sensing system. In contrast, the other proteins and mixture 1 (containing CS, α-La, β-Lg, and SA) led to almost no decrease even though their concentrations were 4-fold excess (2 μM) than the target LF. The results illustrated that the introduced self-assembled aptasensor presented good specificity for LF detection. However, mixture 2 of the control proteins (each at 2 μM) and LF (0.5 μM) still exhibited a slight influence on the fluorescence signal as LF (0.5 μM) only, which thereby suggested that the matrix effects of the sample need to be considered in practical applications.
To assess the stability, the fluorescence intensities of a blank sample and a standard LF of 500 nM were measured in an interday assay for seven consecutive days (Figure 2C). The coefficient of variation (CV) can relatively reflect the dispersion of experimental data and is also commonly used to evaluate the repeatability and stability of experiments (37). Higher CV values indicate higher detection errors, while lower values indicate more stable results. The calculated CV of the interday assay was 4.75%, wherein the low value demonstrated the good stability of the aptasensor.
The experiments were carried out in a milk powder matrix to assess the operability and usefulness of the introduced aptasensor in actual samples. One commercially available milk powder labeled with no LF was chosen as a blank sample, which was validated by a high-performance capillary electrophoresis (HPCE) assay (Supplementary Figure 2 an insert picture). After simple dissolution and centrifugation, the sample matrix was spiked with standard LF in the concentration range of 0–1,000 nM. Figure 2D shows that the fluorescence signal gradually decreased with increasing LF concentration. A good linear relationship was obtained over the range of 20–500 nM for the value of (F0-F)/F0 and the concentration of LF, and the LOD was calculated to be 3 nM (2.4 mg/kg). The detection limit meets China’s GB14880-2012, which shall not exceed 1.0 g/kg. Such high sensitivity could predict the potential LF content in milk powders. Although the slope presented a difference from that in the standard solution, the detection results of LF in matrixes could be quantitatively deduced by the calibration curve in the standard solution multiplied by an adjustment factor. In addition, the coefficient of determination (R2) in matrixes was greater than 0.98, showing good linearity in the analytical range. The results showed that the system fluorescence signal responded well to the LF concentration in the milk powder matrix. Furthermore, the aptasensor showed a good average recovery of 95.8–105.1%, with a relative standard deviation (RSD) of less than 4% in the milk powder sample (Table 1), which indicated that this developed aptasensor works well in practical applications.
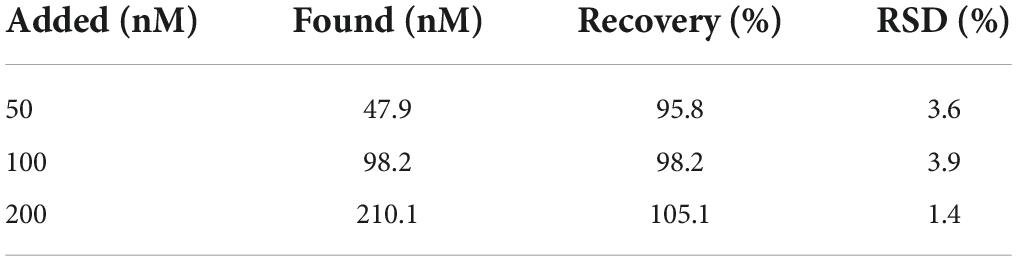
Table 1. Recovery assay in milk powder using PG-based aptasensor (n = 3).
In addition, the universality was confirmed by easily changing the aptamers against two other types of large molecular proteins (human transferrin and bovine thyroglobulin) and two kinds of small molecular pesticides (chlorpyrifos and acetamiprid). As shown in Figures 3A–D, the quenching efficiency (F0–F)/F0 values of all targets have good linear relationships with the target concentrations as well as good correlation coefficients (R2> 0.95). The results confirmed that the proposed strategy is likely to be a sensitive and universal aptasensor.
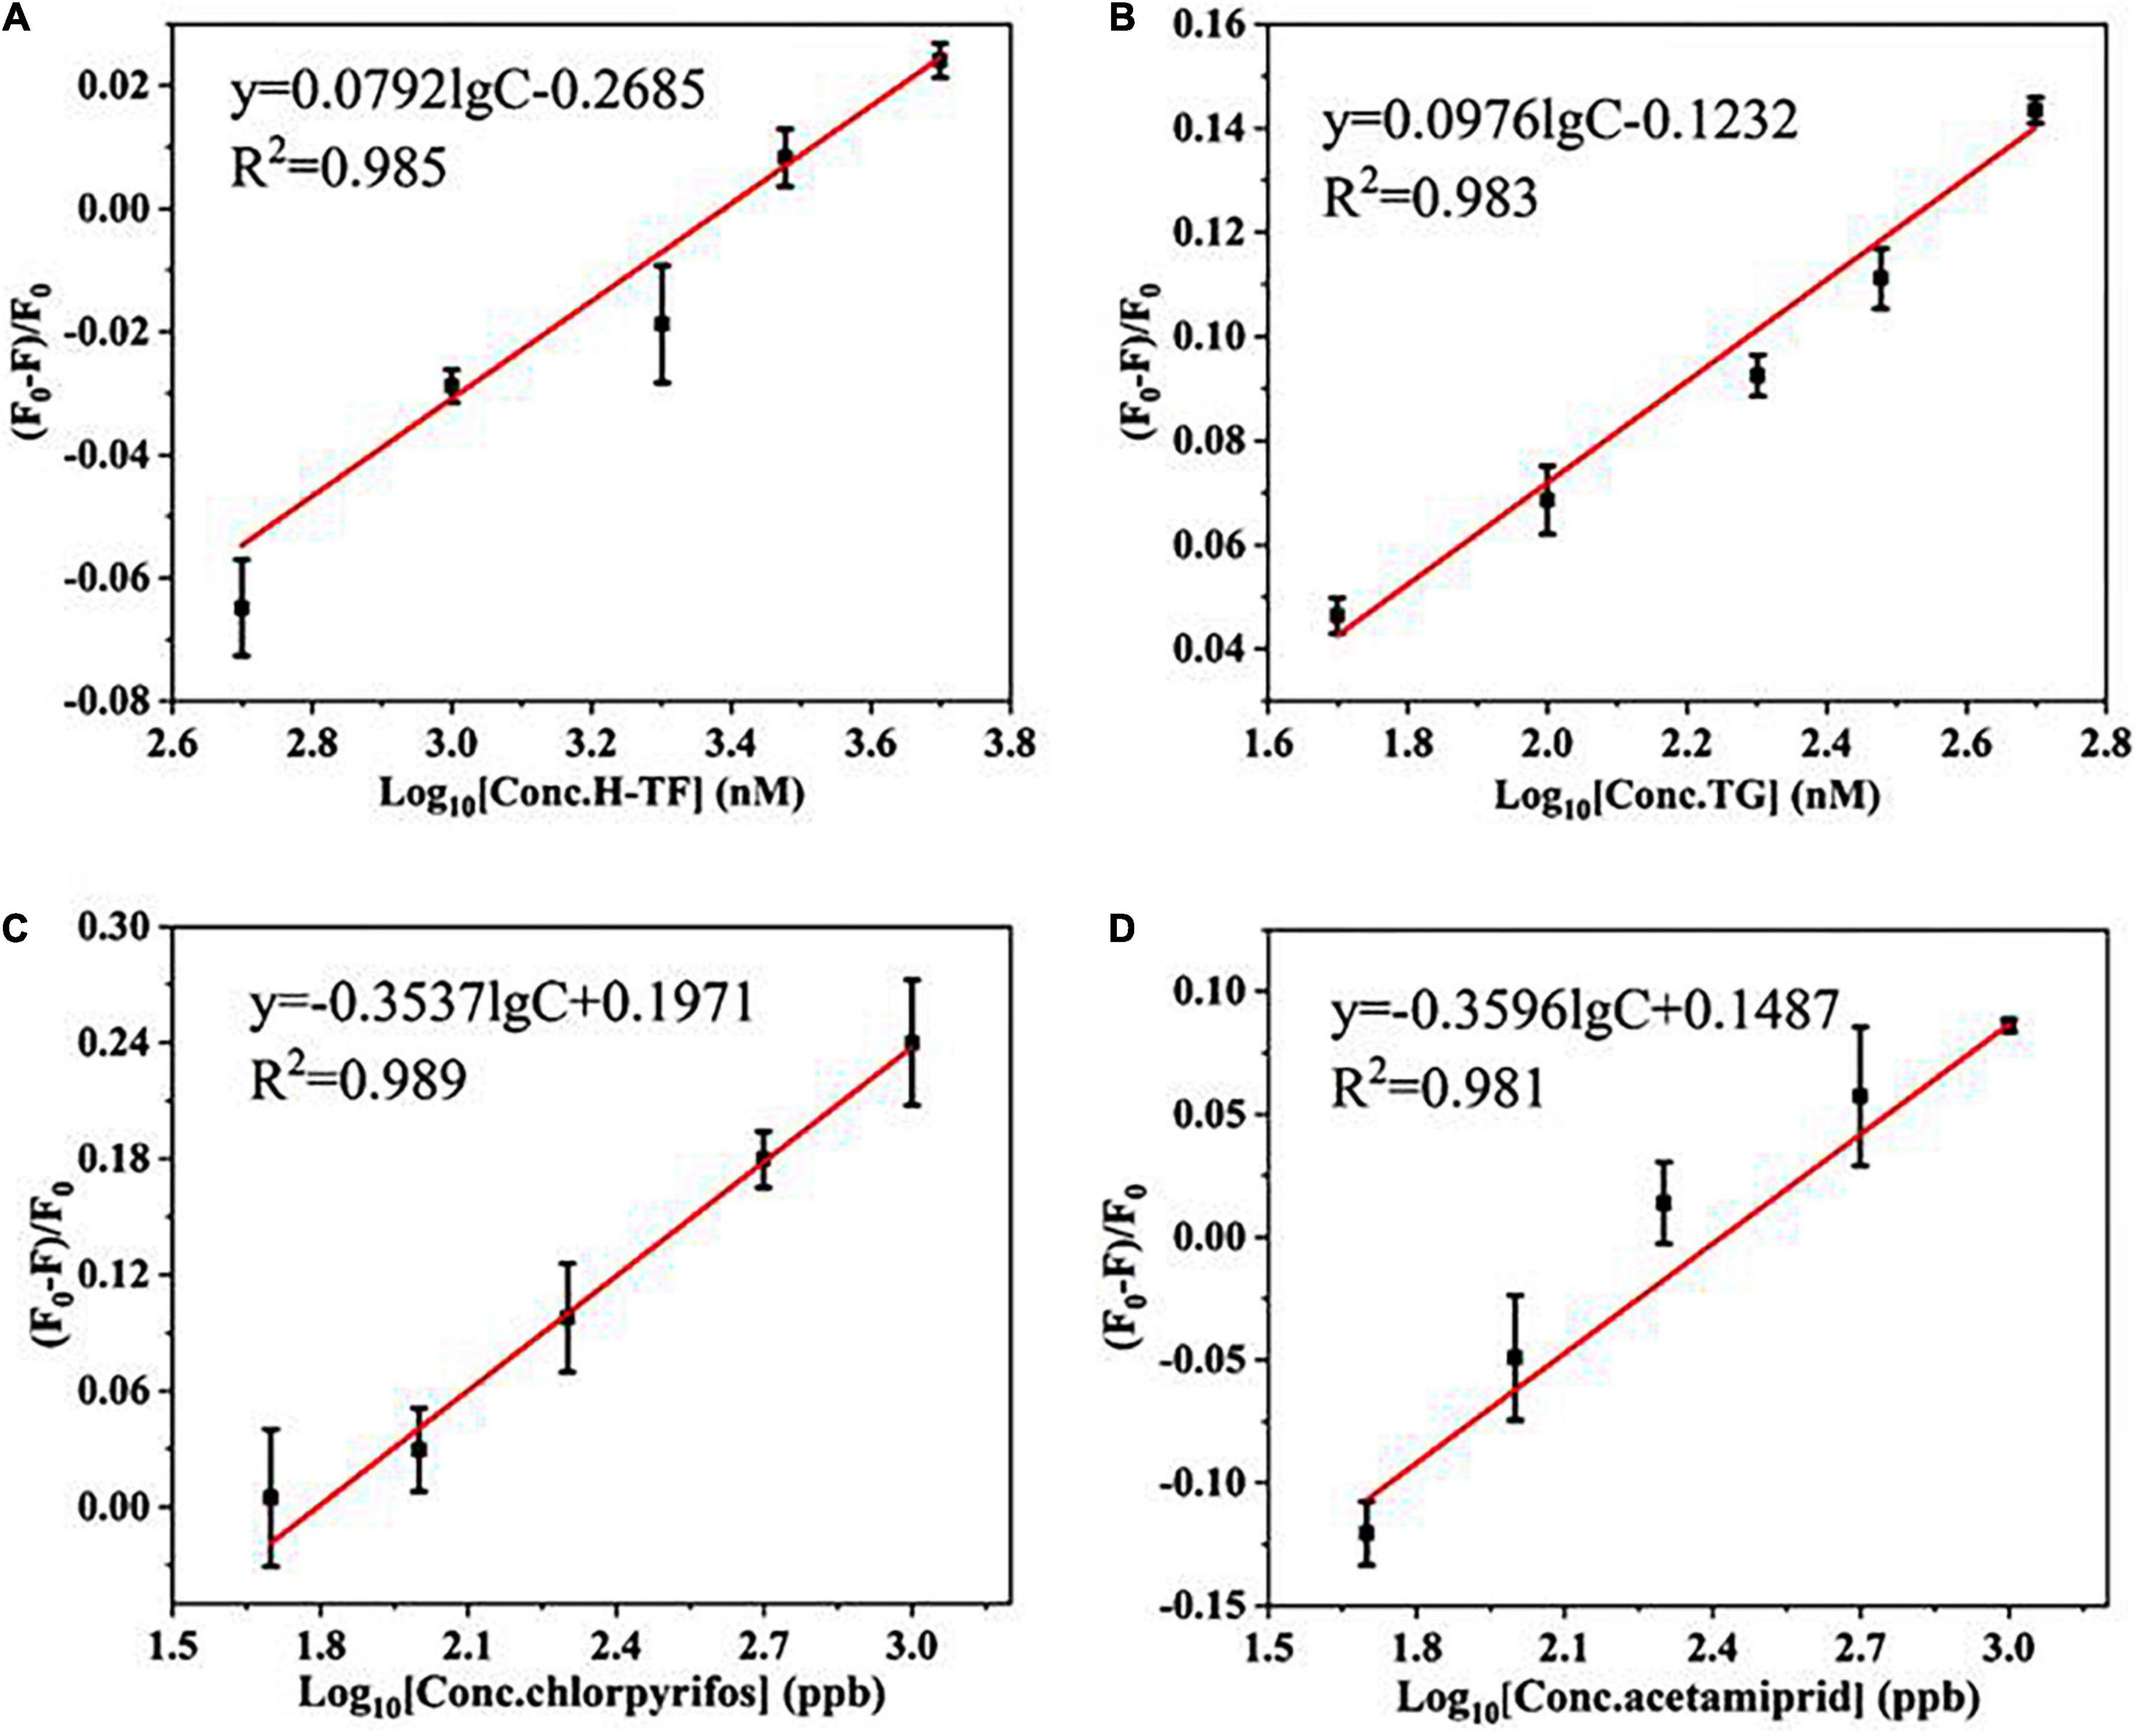
Figure 3. The linear relationship between (F0–F)/F0 and the concentrations of targets: (A) human transferrin (H-TF, 50–500 nM); (B) bovine thyroglobulin (TG, 50–500 nM); (C) chlorpyrifos (50–1,000 ppb); (D) acetamiprid (50–1,000 ppb).
Furthermore, the flexibility of the fluorescent aptasensor was also verified utilizing another fluorescent dye, SYBR Green I (SGI) (Figures 4A–F), with similar characteristics to PG, enabling dsDNA detection concentrations as low as 20 pg/mL (38). In the range of 20–500 nM, good linear relationships were obtained in the standard solution (R2, 0.990) and the milk powder matrix (R2, 0.986) with LODs of 5.4 and 5.9 nM, respectively. Meanwhile, the aptasensor exhibited good selective specificity and spiked recovery (106.2–108.5%, Supplementary Table 2), indicating that the strategy is feasible in practical applications.
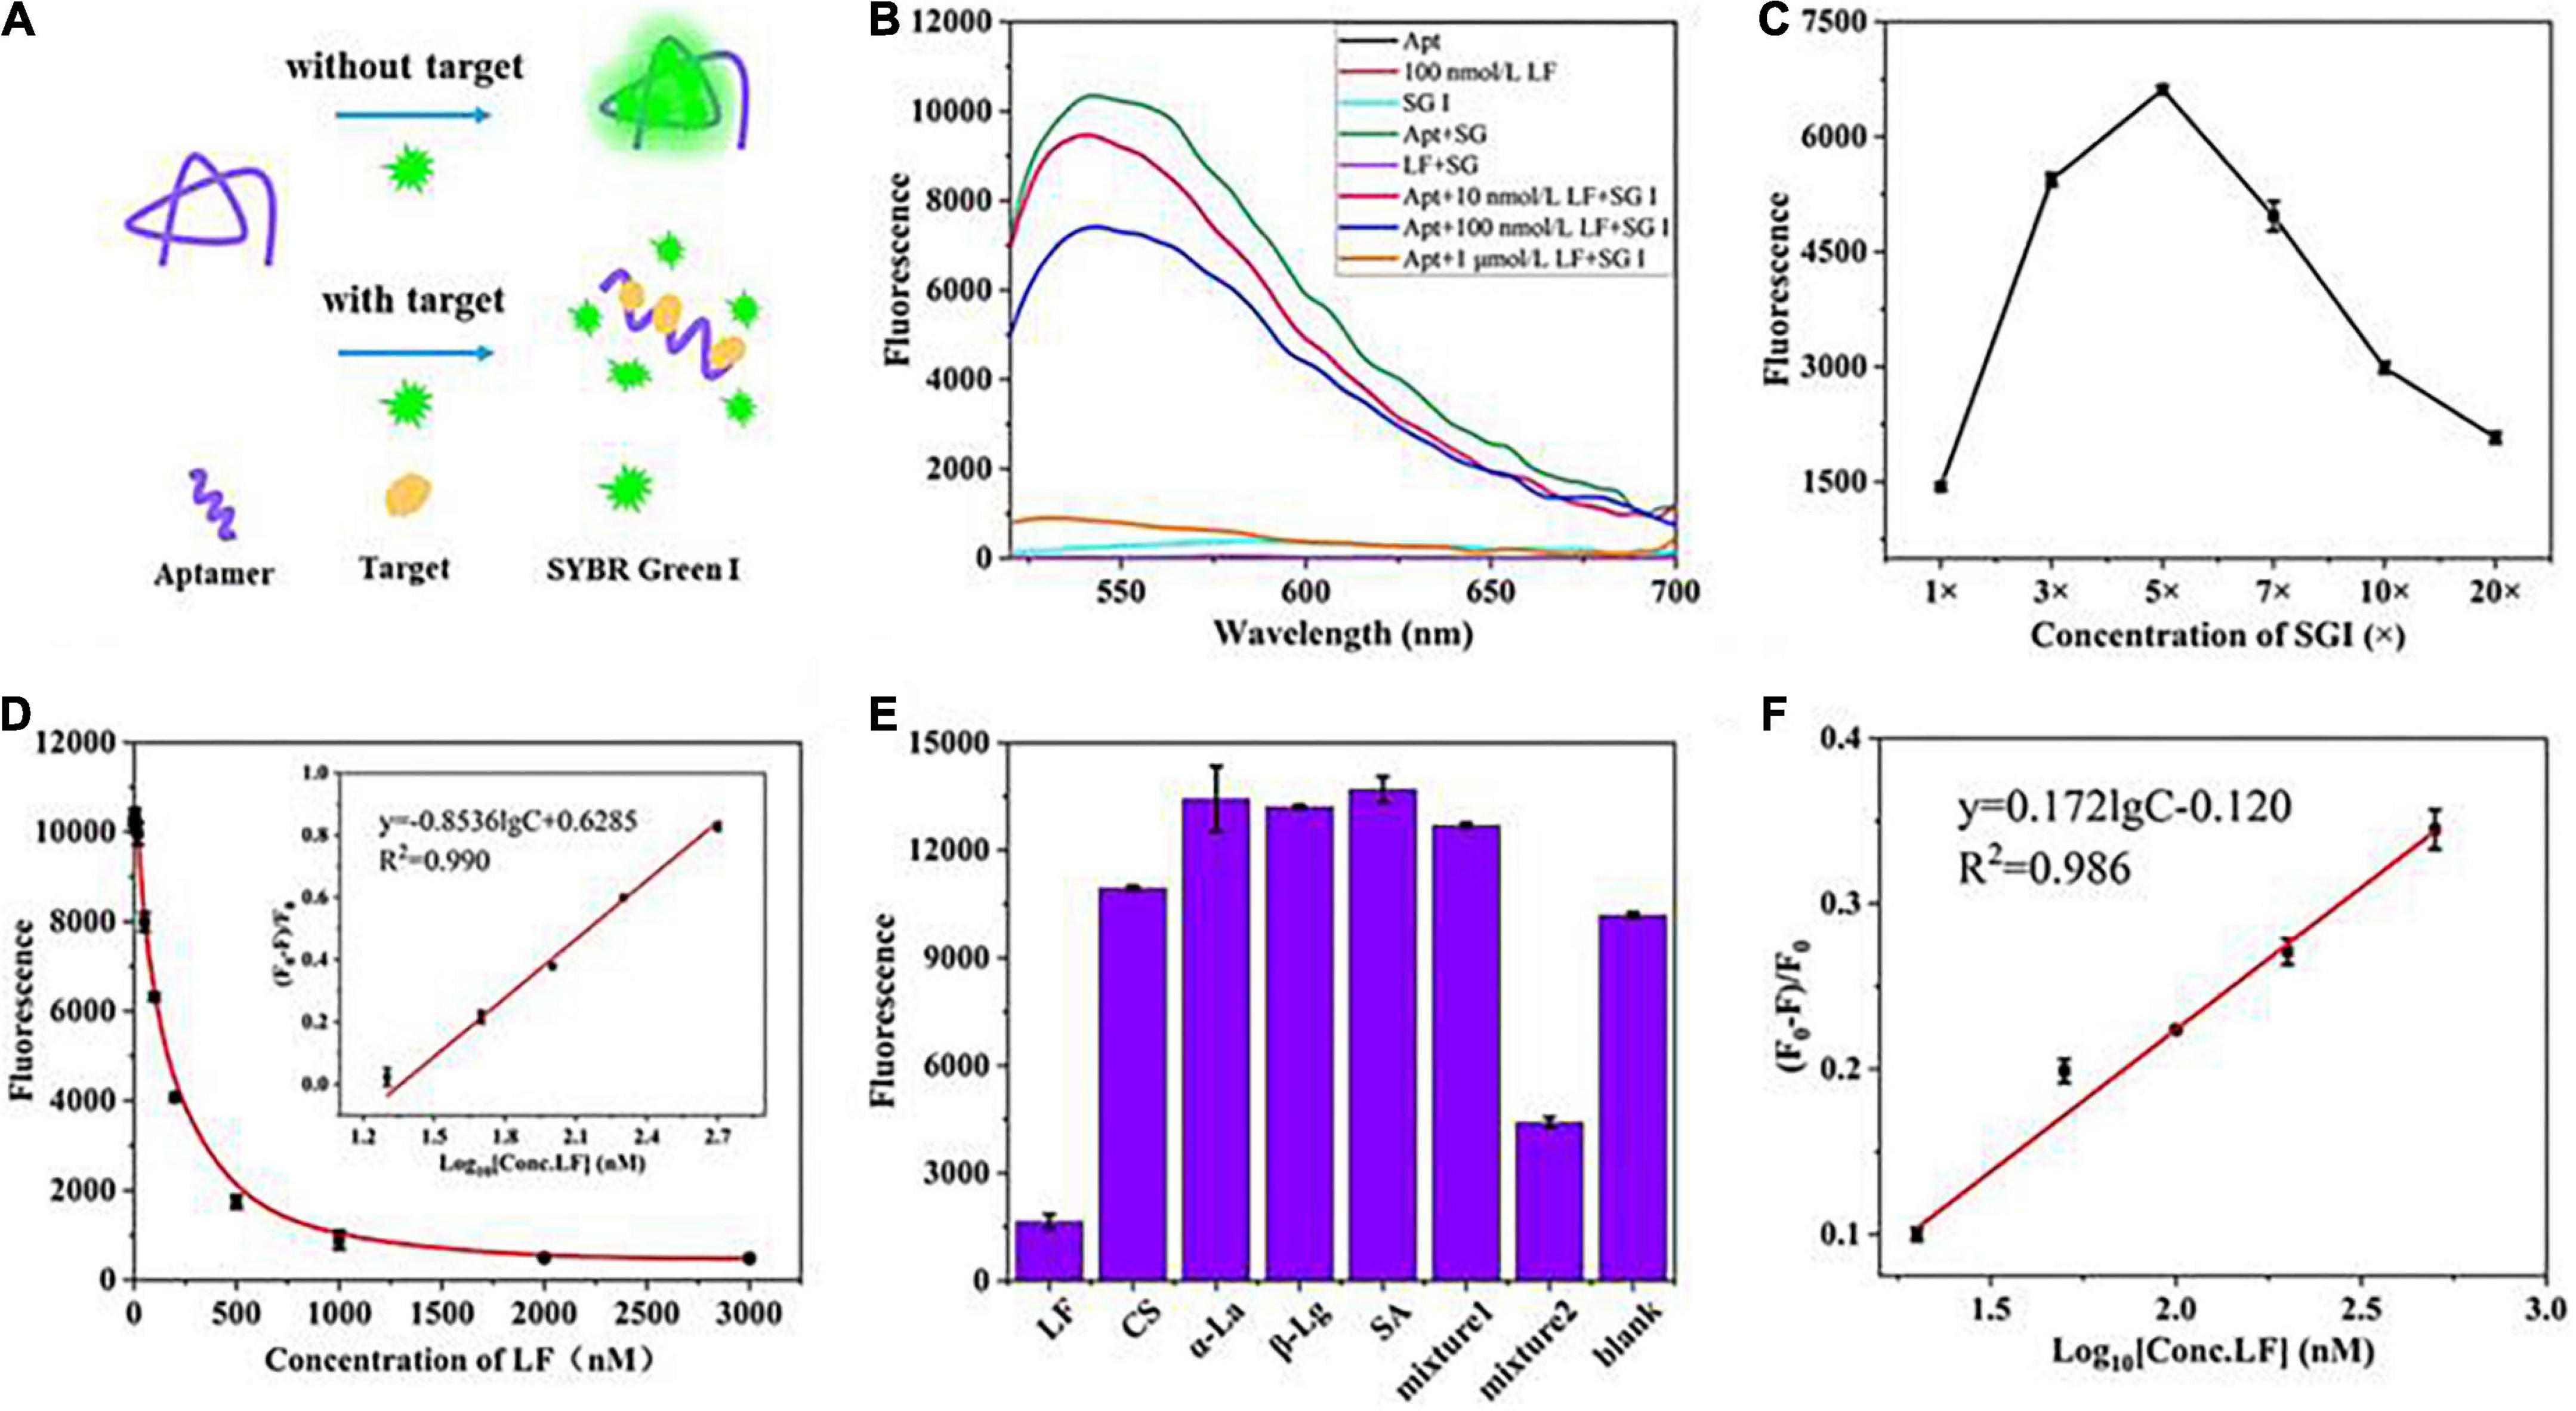
Figure 4. (A) The principle of the fluorescence aptasensor based on SGI. (B) Feasibility verification. (C) Optimization of SGI concentration. (D) Relationship between fluorescence intensity and the concentrations of LF. (E) Evaluation of aptasensor specificity. (F) The linear relationship was obtained in the milk powder matrix between (F0–F)/F0 and the concentrations of LF.
Furthermore, we applied this strategy to determine the LF content in three milk powders, which were also quantified using the HPCE method (8) (Supplementary Figure 2). The content of LF in milk powders detected by the two methods is listed in Supplementary Table 3, and the results show that the HPCE method is roughly consistent with our aptasensor. However, the aptasensor took only 20 min to complete a quick analysis in all samples, which was much shorter than that required by the commercial CE of approximately 120 min for all samples.
The performance comparison of this aptasensor with other LF methods is shown in Table 2. Radial immunodiffusion is one of the simplest methods; however, it has poor sensitivity. HPCE, HPLC, and SPR techniques have shown good performance, but they are expensive and require professional technicians. Microfluidic paper and ELISA have high accuracy, but both are based on the immunoreaction between LF and its antibody, which are expensive reagents and complicated to prepare. Among the detection methods, the present work reported a very low LOD of 0.16 μg/mL (2 nM). Although Huang et al. (10) reported a higher sensitivity with a lower LOD, electrochemical sensors still rely heavily on expensive electrochemical systems with high resolution, and cyclic voltammetry requires 20 scans to obtain reliable results. The self-assembled fluorescent aptasensor presented a low dependence on instruments and an available performance with a simple “mix-and-detect” procedure, high sensitivity and time savings compared with other reported methods for LF detection.
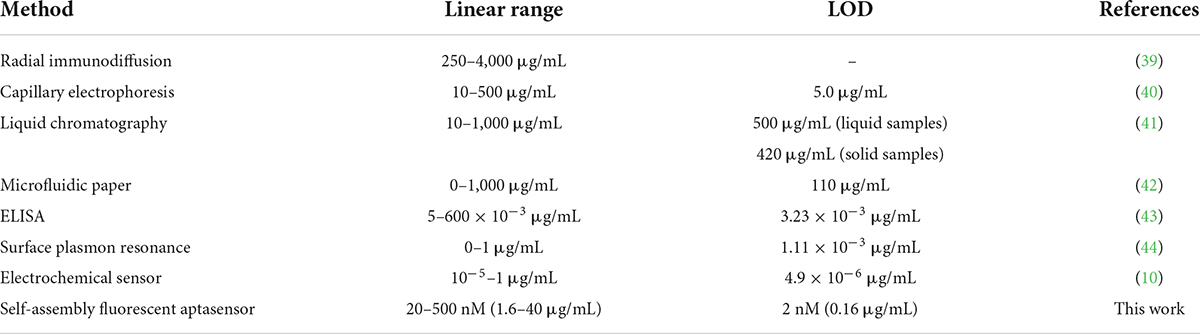
Table 2. Performance comparison of various methods for detecting LF.
In conclusion, we presented a label-free and universal aptasensor for LF detection in milk powder based on the dual functions of aptamers as a specific recognition element against targets and a fluorescent signal reporter integrated with structure-selective dyes. The direct-recognition aptasensor avoids the synthesis, consumption and complex optimization of the complimentary chains generally required in dsDNA-based aptasensors and gains a better performance (LOD, 2 nM vs. 205 nM, Supplementary Figure 3) by a facile “mix-and-detect” operation. Furthermore, this strategy has been demonstrated for four target detection methods (TG, H-TF, chlorpyrifos, and acetamiprid) and two fluorescence dyes (PG and SGI). Therefore, the aptasensor provides expansive prospects for developing a simple, general, cost-effective detection.
The original contributions presented in this study are included in the article/Supplementary material, further inquiries can be directed to the corresponding author/s.
CZ: writing original draft, data curation, funding acquisition, and project administration. JL: investigation, validation, data curation, and formal analysis. LL: data curation and formal analysis. HQ and TL: formal analysis. MY: funding acquisition. FQ: writing – review and editing, and funding acquisition. AA: validation, formal analysis, and writing – review and editing. All authors contributed to the article and approved the submitted version.
This work was supported by the National Natural Science Foundation of China (Nos. 32102088, 21874010, and 21827810), the Agricultural Scientific and Technological Innovation Project of the Shandong Academy of Agricultural Sciences (No. CXGC2022E05), Focus on Research and Development Plan in Shandong Province (No. 2020CXGC010804), the Young Elite Scientist Sponsorship Program of Beijing Association for Science and Technology, and the Natural Science Foundation of Beijing Municipality (No. 7222310).
The authors declare that the research was conducted in the absence of any commercial or financial relationships that could be construed as a potential conflict of interest.
All claims expressed in this article are solely those of the authors and do not necessarily represent those of their affiliated organizations, or those of the publisher, the editors and the reviewers. Any product that may be evaluated in this article, or claim that may be made by its manufacturer, is not guaranteed or endorsed by the publisher.
The Supplementary Material for this article can be found online at: https://www.frontiersin.org/articles/10.3389/fnut.2022.992188/full#supplementary-material
1. González-Chávez SA, Arévalo-Gallegos S, Rascón-Cruz Q. Lactoferrin: structure, function and applications. Int J Antimicrob Agents. (2009) 301:e1–8. doi: 10.1016/j.ijantimicag.2008.07.020
3. Lönnerdal B, Du X, Jiang R. Biological activities of commercial bovine lactoferrin sources. Biochem Cell Bio. (2021) 99:35–46. doi: 10.1139/bcb-2020-0182
4. Niaz B, Saeed F, Ahmed A, Imran M, Maan AA, Khan MK. Lactoferrin (LF): A natural antimicrobial protein. Int J Food Prop. (2019) 22:1626–41. doi: 10.1080/10942912.2019.1666137
5. Zhang Y, Lu C, Zhang J. Lactoferrin and its detection methods: a review. Nutrients. (2021) 13:2492. doi: 10.3390/nu13082492
6. Chen M, Wen F, Zhang Y, Li P, Zheng N, Wang J. Determination of native lactoferrin in milk by HPLC on HiTrapTM Heparin HP column. Food Anal Method. (2019) 12:2518–26. doi: 10.1007/s12161-019-01572-x
7. Tsakali E, Chatzilazarou A, Houhoula D, Koulouris S, Tsaknis J, Van Impe J. A rapid HPLC method for the determination of lactoferrin in milk of various species. J Dairy Res. (2019) 86:238–41. doi: 10.1017/S0022029919000189
8. Chen H, Wang Z, Fan F, Shi PJ, Xu XB, Du M, et al. Analysis method of lactoferrin based on uncoated capillary electrophoresis. eFood. (2021) 2:147–53. doi: 10.2991/efood.k.210720.001
9. Li X, Li Z, Xu E, Chen L, Feng H, Chen L, et al. Determination of lactoferrin in camel milk by ultrahigh-performance liquid chromatography-tandem mass spectrometry using an isotope-labeled winged peptide as internal standard. Molecules. (2019) 24:4199. doi: 10.3390/molecules24224199
10. Huang J, He Z, Cao J, Hong J, Wu ZJ, Gao HY, et al. Electrochemical immunosensor detection for lactoferrin in milk powder. Int J Electrochem Sci. (2018) 13:7816–26. doi: 10.20964/2018.08.47
11. Zavatski S, Khinevich N, Girel K, Redko S, Kovalchuk N, Komissarov I. Surface enhanced Raman spectroscopy of lactoferrin adsorbed on silvered porous silicon covered with graphene. Biosensors. (2019) 9:34. doi: 10.3390/bios9010034
12. Wang R, Wang J, Liu H, Gao Y, Zhao Q, Ling S, et al. Sensitive immunoassays based on specific monoclonal IgG for determination of bovine lactoferrin in cow milk samples. Food Chem. (2021) 338:127820. doi: 10.1016/j.foodchem.2020.127820
13. Ellington AD, Szostak JW. In vitro selection of RNA molecules that bind specific ligands. Nature. (1990) 346:818–22. doi: 10.1038/346818a0
14. Tuerk C, Gold L. Systematic evolution of ligands by exponential enrichment: RNA ligands to bacteriophage T4 DNA polymerase. Science. (1990) 249:505–10. doi: 10.1126/science.2200121
15. Röthlisberger P, Hollenstein M. Aptamer chemistry. Adv Drug Deliver Rev. (2018) 134:3–21. doi: 10.1016/j.addr.2018.04.007
16. Zhang Y, Li B, Juhas M. Recent advances in aptamer discovery and applications. Molecules. (2019) 24:941. doi: 10.3390/molecules24050941
17. Liu R, Haruna SA, Ali S, Xu J, Zhang Y, Lv P. A sensitive and accurate fluorescent genosensor for Staphylococcus aureus detection. Sensor Actuat B-Chem. (2021) 355:131311. doi: 10.1016/j.snb.2021.131311
18. Zhou Y, Mahapatra C, Chen H, Peng X. Recent developments in fluorescent aptasensors for detection of antibiotics. Curr Opin Biomed Eng. (2020) 13:16–24. doi: 10.1016/j.cobme.2019.08.003
19. Ma K, Li X, Xu B, Tian W. Label-free bioassay with graphene oxide-based fluorescent aptasensors: A review. Anal Chim Acta. (2021) 1188:338859. doi: 10.1016/j.aca.2021.338859
20. Li B, Dong S, Wang E. Homogeneous analysis: label-free and substrate-free aptasensors. Chem Asian J. (2010) 5:1262–72. doi: 10.1002/asia.200900660
21. Li Y, Zhou H, Chen J, Shahzad SA, Yu C. Controlled self-assembly of small molecule probes and the related applications in bioanalysis. Biosens Bioelectron. (2016) 76:38–53. doi: 10.1016/j.bios.2015.06.067
22. Wen J, Jiang D, Shan X, Wang W, Xu F, Shiigi H. Ternary electrochemiluminescence biosensor based on black phosphorus quantum dots doped perylene derivative and metal organic frameworks as a coreaction accelerator for the detection of chloramphenicol. Microchem J. (2022) 172:106927. doi: 10.1016/j.microc.2021.106927
23. Khan NI, Song E. Detection of an IL-6 Biomarker Using a GFET Platform Developed with a Facile Organic Solvent-Free Aptamer Immobilization Approach. Sensors (Basel). (2021) 21:1335. doi: 10.3390/s21041335
24. Zhu Y, Xia X, Deng S, Yan B, Dong Y, Zhang K. Label-free fluorescent aptasensing of mycotoxins via aggregation-induced emission dye. Dyes Pigments. (2019) 170:107572. doi: 10.1016/j.dyepig.2019.107572
25. Jia Y, Wu F, Liu P, Zhou G, Yu B, Lou X, et al. A label-free fluorescent aptasensor for the detection of Aflatoxin B1 in food samples using AIEgens and graphene oxide. Talanta. (2019) 198:71–7. doi: 10.1016/j.talanta.2019.01.078
26. Luo G, Biniuri Y, Chen WH, Wang J, Neumann E, Marjault HB, et al. Modelling Photosynthesis with ZnII-Protoporphyrin All-DNA G-Quadruplex/Aptamer Scaffolds. Angew Chem. (2020) 132:9248–55. doi: 10.1002/ange.202002915
27. Wang X, Yang Y, Yin Y, Zeng N, Dong Y, Liu J, et al. High-Throughput Aptamer Microarrays for Fluorescent Detection of Multiple Organophosphorus Pesticides in Food. Anal Chem. (2022) 94:3173–9. doi: 10.1021/acs.analchem.1c04650
28. Liu Y, Yang H, Wan R, Khan MR, Wang N, Busquets R, et al. Ratiometric G-quadruplex assay for robust lead detection in food samples. Biosensors (Basel). (2021) 11:274. doi: 10.3390/bios11080274
29. Zhang T, Zhou W, Lin X, Khan MR, Deng S, Zhou M, et al. Light-up RNA aptamer signaling-CRISPR-Cas13a-based mix-and-read assays for profiling viable pathogenic bacteria. Biosens Bioelectron. (2021) 176:112906. doi: 10.1016/j.bios.2020.112906
30. Tang Z, Mallikaratchy P, Yang R, Kim Y, Zhu Z, Wang H, et al. Aptamer switch probe based on intramolecular displacement. J Am Chem Soc. (2008) 130:11268–9. doi: 10.1021/ja804119s
31. Munzar JD, Ng A, Juncker D. Duplexed aptamers: history, design, theory, and application to biosensing. Chem Soc Rev. (2019) 48:1390–419. doi: 10.1039/C8CS00880A
32. Bahreyni A, Luo H, Ramezani M, Alibolandi M, Soheili V, Danesh NM, et al. A fluorescent sensing strategy for ultrasensitive detection of oxytetracycline in milk based on aptamer-magnetic bead conjugate, complementary strand of aptamer and PicoGreen. Spectrochim Acta A Mol Biomol Spectrosc. (2021) 246:119009. doi: 10.1016/j.saa.2020.119009
33. Ma P, Ye H, Gou H, Ma X, Yue L, Wang Z. Aptamer truncation strategy assisted by molecular docking and sensitive detection of T-2 toxin using SYBR Green I as a signal amplifier. Food Chem. (2022) 381:132171. doi: 10.1016/j.foodchem.2022.132171
34. Duan N, Wu S, Ma X, Xia Y, Wang Z. A universal fluorescent aptasensor based on AccuBlue dye for the detection of pathogenic bacteria. Anal Biochem. (2014) 454:1–6. doi: 10.1016/j.ab.2014.03.005
35. Bruno JG, Sivils JC. Studies of DNA aptamer oligreen and picogreen fluorescence interactions in buffer and serum. J Fluoresc. (2016) 26:1479–87. doi: 10.1007/s10895-016-1840-1
36. Zhu C, Li L, Yang G, Irfan M, Wang Z, Fang S, et al. High-efficiency selection of aptamers for bovine lactoferrin by capillary electrophoresis and its aptasensor application in milk powder. Talanta. (2019) 205:120088. doi: 10.1016/j.talanta.2019.06.088
37. Shechtman O. The Coefficient of Variation as an Index of Measurement Reliability. In: Doi S Williams G editor. Methods of clinical epidemiology, Springer Series on Epidemiology and Public Health. Berlin: Springer (2013). p. 39–49. doi: 10.1007/978-3-642-37131-8_4
38. Dragan AI, Pavlovic R, McGivney JB, Casas-Finet JR, Bishop ES, Strouse RJ, et al. fluorescence properties and interaction with DNA. J Fluoresc. (2012) 22:1189–99. doi: 10.1007/s10895-012-1059-8
39. Janssen PT, van Bijsterveld OP. A simple test for lacrimal gland function: a tear lactoferrin assay by radial immunodiffusion. Graefe’s Arch Clin Exp Ophthalmol. (1983) 220:171–4. doi: 10.1007/BF02186663
40. Kudo H, Maejima K, Hiruta Y, Citterio D. Microfluidic paper-based analytical devices for colorimetric detection of lactoferrin. SLAS Technol. (2020) 25:47–57. doi: 10.1177/2472630319884031
41. Zhang Y, Lou F, Wu W, Dong X, Ren J, Shen Q. Determination of bovine lactoferrin in food by HPLC with a heparin affinity column for sample preparation. J AOAC Int. (2017) 100:133–8. doi: 10.5740/jaoacint.16-0259
42. Mao K, Du H, Bai L, Zhang Y, Zhu H, Wang Y. Poly (2-methyl-2-oxazoline) coating by thermally induced immobilization for determination of bovine lactoferrin in infant formula with capillary electrophoresis. Talanta. (2017) 168:230–9. doi: 10.1016/j.talanta.2017.03.051
43. Liu L, Kong D, Xing C, Zhang X, Kuang H, Xu C. Sandwich immunoassay for lactoferrin detection in milk powder. Anal Methods. (2014) 6:4742–5. doi: 10.1039/C4AY00321G
Keywords: aptamer, fluorescent aptasensor, DNA intercalated dyes, lactoferrin detection, milk powder
Citation: Liu J, Li T, Qin H, Li L, Yan M, Zhu C, Qu F and Abd El-Aty AM (2022) Self-assembly and label-free fluorescent aptasensor based on deoxyribonucleic acid intercalated dyes for detecting lactoferrin in milk powder. Front. Nutr. 9:992188. doi: 10.3389/fnut.2022.992188
Received: 12 July 2022; Accepted: 29 August 2022;
Published: 15 September 2022.
Edited by:
Liguang Xu, Jiangnan University, ChinaReviewed by:
Zhou Xu, Changsha University of Science and Technology, ChinaCopyright © 2022 Liu, Li, Qin, Li, Yan, Zhu, Qu and Abd El-Aty. This is an open-access article distributed under the terms of the Creative Commons Attribution License (CC BY). The use, distribution or reproduction in other forums is permitted, provided the original author(s) and the copyright owner(s) are credited and that the original publication in this journal is cited, in accordance with accepted academic practice. No use, distribution or reproduction is permitted which does not comply with these terms.
*Correspondence: Mengmeng Yan, eW5reTIwMkAxNjMuY29t; Chao Zhu, bmR5dHpodWNoYW9AMTI2LmNvbQ==
Disclaimer: All claims expressed in this article are solely those of the authors and do not necessarily represent those of their affiliated organizations, or those of the publisher, the editors and the reviewers. Any product that may be evaluated in this article or claim that may be made by its manufacturer is not guaranteed or endorsed by the publisher.
Research integrity at Frontiers
Learn more about the work of our research integrity team to safeguard the quality of each article we publish.