- 1Department of Epidemiology and Biostatistics, School of Public Health, Anhui Medical University, Hefei, China
- 2Department of Hematology, Affiliated Hospital of Xuzhou Medical University, Xuzhou, China
- 3Department of Radiology, Affiliated Hospital of Xuzhou Medical University, Xuzhou, China
Background: Diffuse large B-cell lymphoma (DLBCL) is a heterogeneous disease and the existing prognosis systems based on clinical variables are difficult to stratify patients accurately. Nutritional indices play a meaningful role in prognosis of solid tumors, whereas the effect on DLBCL is still equivocal. This retrospective study aimed to develop a novel model based on nutritional indices and other clinical variables to accurately differentiate the prognosis of DLBCL.
Methods: A total of 129 patients pathologically diagnosed with DLBCL in Affiliated Hospital of Xuzhou Medical University from 2014 to 2018 were retrospectively recruited. The total fat area (TFA), visceral fat area (VFA) and subcutaneous fat area (SFA) at the third lumbar vertebra level spine were obtained by computed tomography (CT) to assess the effect of nutritional status on the prognosis of DLBCL. Principal component analysis was used to reduce the dimension of nutritional indices, and continuous variables were evaluated according to X-Tile and Restricted cubic spline. Univariable and multivariable Cox proportional hazard analyses were performed on potential variables. Kaplan-Meier method was utilized to evaluate survival probabilities and the differences between groups were assessed by log-rank test.
Results: X-Tile analysis divided VFA and albumin into two and three groups when applying 114.7 cm2 of VFA, 38.3 and 42.4 g/L of albumin as the optimal cut-off points, respectively. The final scoring model of nutrition-related prognostic index (NPI) comprised four independent prognostic variables. The C-index of the final model was 0.823 [95% CI (0.749~0.897)] by bootstrap resampling. Finally, a maximum score of 6 points was obtained. Compared with IPI, NCCN-IPI and GELTAMO-IPI, NPI showed better accuracy in discerning the prognostic risk of patients.
Conclusion: VFA and albumin were associated with the prognosis of DLBCL, and the NPI model based on nutritional indices could better stratify the prognosis of DLBCL.
Introduction
Diffuse large B-cell lymphoma (DLBCL) is an aggressive lymphoma, accounting for about 40% of non-Hodgkin lymphoma (NHL) (1). High heterogeneity, genetic diversities, immune markers, nutritional indices and clinical variables significantly affect the prognosis of DLBCL. The majority of DLBCL patients can be cured with rituximab based immunochemotherapy and optimization of frontline therapy remains an important goal. Previous studies have shown that age, Ki-67, β2-microglobulin, lactate dehydrogenase (LDH), and other clinical variables are independent prognostic factors of DLBCL (2–5). In the past decades, clinical variables based prognostic models such as International Prognostic Index (IPI) and NCCN-IPI were widely adopted to evaluate the prognosis of DLBCL with certain limitations (2, 6). However, few studies were focused on the prognosis of DLBCL patients according to their nutritional status and body composition.
Nutritional status closely correlates with various metabolic processes, which also affects quality of life, therapeutic regimen and prognosis in cancer patients (7). Many nutrition indices-based scoring systems such as cachexia score (CASCO), Glasgow prognostic score (GPS) and prognostic nutritional index (PNI) have been used to stratify the prognosis of solid tumors (8–10). Sungwoo Park et.al revealed that DLBCL patients in low-PNI group showed more frequent treatment-related toxicities and mortality (11). A systematic review showed that body mass index (BMI) was associated with the risk of prognosis in patients with DLBCL and the summary relative risk (RR) per 5 kg/m2 increment of BMI was 1.11 (95% CI: 1.05~1.16) for DLBCL (12). McMillan et al. confirmed that low albumin concentrations correlated with poor survival in patients with gastric, rectal, and esophageal squamous cell cancers (13–15). In recent years, human body composition analysis has become an indicator of nutrition monitoring, and it can reflect human health level and nutritional status. Computed tomography (CT), the gold standard for quantitative measurement of regional human adipose tissue with the advantages of accurate positioning and quantification, simple operation and high-density resolution, provides a reference for regional adipose tissue quantification. Grillot et al. demonstrated that sarcopenia and visceral obesity were associated with adverse outcomes in patients with Crohn's disease by CT (16). Excessive area of subcutaneous fat in the abdomen can secrete a large amount of chemicals, resulting in metabolic changes, thus increasing the burden of the heart and the risk of other cancers. Visceral fat acts as a large endocrine gland, excreting cytokines and adipocytes, leading to insulin resistance and proinflammatory states (17). Studies have shown that visceral obesity may be a better predictor than BMI of morbidity and mortality associated with cardiovascular disease and type 2 diabetes (17–20). However, the effect of visceral obesity on the prognosis of DLBCL patients is still unclear and worth exploring.
In this retrospective study, we obtained total fat area (TFA), visceral fat area (VFA) and subcutaneous fat area (SFA) data at the section of the third lumbar by CT. We aimed to evaluate the effect of nutritional status on the prognosis of DLBCL by measuring patients' nutrition indices and introduced other clinical variables to develop a novel scoring prognostic model.
Materials and methods
Patients
All enrolled hospitalized patients were pathologically diagnosed as DLBCL by at least two pathologists from 2014 to 2018 in the Affiliated Hospital of Xuzhou Medical University. Study approval was obtained from the independent Ethics Committees of each participating center in HHLWG and met Helsinki Declaration. Informed consent was obtained from each patient. At admission, the following variables were considered: age, gender, Ann Arbor stage, LDH, β2-microglobulin (β2-MG), B symptoms, ECOG PS, cell of origin (COO), and other newer interesting prognostic factors, such as red blood cell count (RBC), white blood cell count (WBC) and lymphocyte count (LYC).
Inclusion criteria: (1) Clear pathological diagnosis; (2) Rituximab and doxorubicin based immunochemotherapy; (3) Complete clinical and CT scanning data. Exclusion criteria: (1) Patients with other malignant tumors; (2) Patients with special types of lymphoma (primary central nervous system lymphoma, primary mediastinal DLBCL, transformed DLBCL). Follow-up was conducted through reviewing in-patient medical records and making phone calls. Overall survival (OS) was calculated as the interval between the time of diagnosis and death from any cause or the last follow-up.
Fluorescence in situ hybridization (FISH) analysis for MYC, BCL-6, and BCL-2 was performed in all cases using the LSI MYC or BCL-6 dual-color break-apart and LSI IGH@BCL-2 dual-color, dual fusion probes (Abbott Laboratories, Des Plaines, IL, USA). All cases in this study with MYC, BCL-2, and BCL-6 rearrangements had abnormal signals present in >20% of all nuclei assessed. The operation was carried out according to the probe instructions described previously. By immunohistochemical (IHC), patients were divided into germinal center B cell (GCB) and Non-GCB groups (21).
Assessment of body composition by CT scan
This research used the tomography/computed tomography (PET/CT) examination to obtain CT images. All patients, placed in a supine position with both upper limbs raised above the head, underwent whole-body CT examination using discovery PET / CT elite scanner (GE Healthcare, Milwaukee, Wisconsin, USA) and light speed 128 slice spiral. After the completion of the CT localization image, CT scanning was performed and the corresponding data were collected. The scanning range was from the cranial apex to the middle part of the thigh. CT scanning parameters: 120 kV, 180 mA, rotation time 0.5 s/r, pitch 1.375, layer thickness 3.75 mm, layer spacing 3.25 mm. After scanning, the whole-body CT image was transmitted to GE Advantage workstations (GEAW) 4.5 post-processing workstation, the image was positioned to the level of navel, and the “X-Sect” mode was started to draw the total area along the abdominal skin contour, and then the abdominal area was drawn along the inner edge of abdominal wall muscle tissue, and the fat attenuation range (−190 ~ −30 Hounsfield units) was adjusted. The color part is the fat area (Figure 1), and then the post-processing workstation calculates the TFA and VFA. SFA was calculated by subtracting VFA from TFA. VFA, TFA, SFA were computed for each image in cm2.
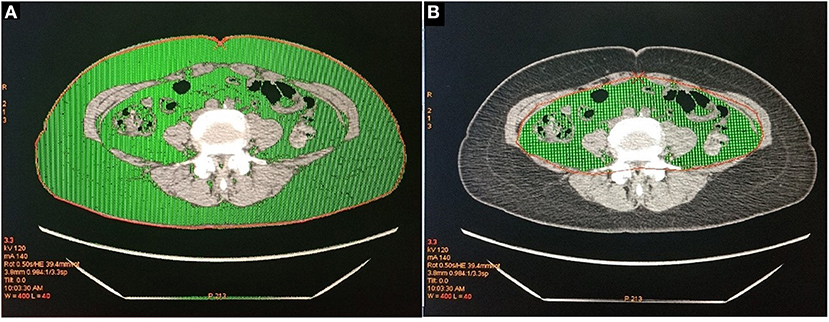
Figure 1. (A) The green part is the total abdominal fat area (TFA). (B) The green part is visceral fat area (VFA).
Statistical analysis
Principal component analysis (PCA) is a mathematical algorithm that reduces the dimensionality of a data while retaining as much as possible the variation in the data. The samples can then be plotted to visually evaluate the similarities and differences between the samples and determine whether the samples can be grouped (22). Continuous variables were transformed into categorical variables by X-Tile program (23) or restricted cubic spline (RCS) (24). Pearson's correlation analysis was used to analyze the correlation between nutritional markers and survival time. Univariable analysis was used to select variables, with P < 0.1 considered statistically significant. Multivariable analysis was performed for predictive prognostic variables. The best prediction variable set was obtained by both stepwise regression and Akaike Information Criteria (AIC) (25) was used to evaluate the optimal model. The Harrell's concordance index of the model was calculated by bootstrap method according to the regression results. The procedure was repeated 1,000 times.
Decision curve analysis (DCA) is a novel method for evaluating diagnostic tests, prediction models, and molecular markers to determine whether a model or one of several models is needed (26, 27). In order to evaluate the effect of nutritional factors on the prognosis of DLBCL, we established a nutrition-related prognosis index (NPI) model based on the separate analysis of PCA (Model 1) and the accurate cut-off points of continuous variables (Model 2), and the performance of the two models was compared using DCA. Statistical analysis was conducted with IBM SPSS Statistics (version 19.0) and R software (version 3.6.1; http://www.Rproject.org).
Results
Clinical characteristics
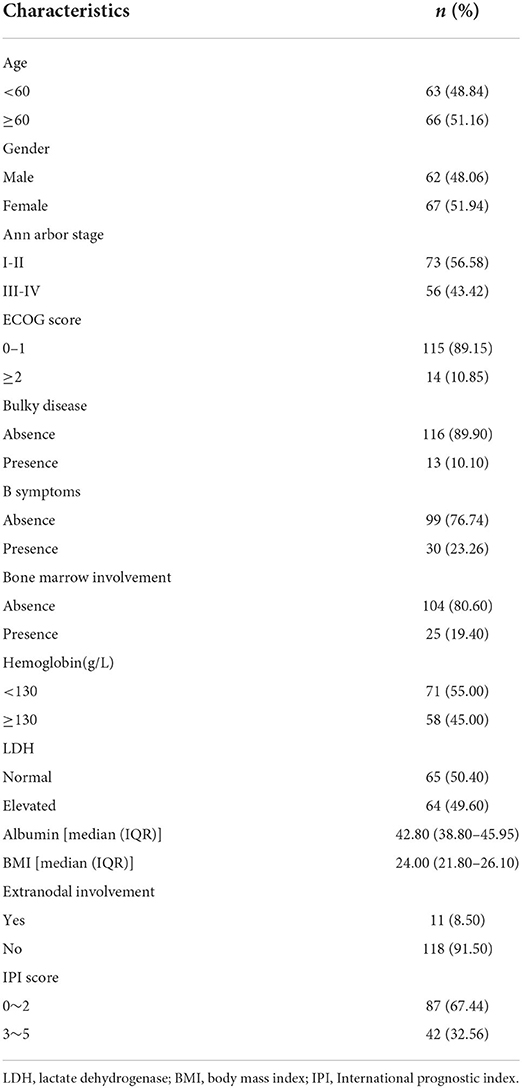
The follow-up deadline was May 1, 2020, and the median follow-up time was 19.1 months. At the end of follow-up, a total of 43 (33.33%) deaths occurred. Median age at diagnosis was 61 years (range: 21–87), of whom 62 were males. Ann Arbor stage I, II, III, IV period accounted for 26.4, 30.2, 22.5 and 20.9%, respectively. Only 23.26% of patients had B symptoms. Patient characteristics were shown in Table 1.
Analysis of nutrition-based indices
The impact of nutritional status expressed by nutritional variables (TFA, VFA, SFA, BMI and albumin) on the prognosis of DLBCL patients was explored by two statistical methods. First of all, correlation analysis showed that all markers above were correlated with survival. Furthermore, albumin had the strongest correlation with survival time (r = 0.6, P < 0.001). PCA extracted three components from five nutritional markers, among which the characteristic values of the first and second principal components were both greater than 1, and the contribution values of the first, second and third principal components were 90.04% (Figure 2). The relevant scores of each patient were calculated, and the scores were evaluated and converted using X-Tile program. Second, data type conversion was performed for the five nutritional markers. By using X-Tile program, TFA, VFA, SFA and BMI were divided into high and low groups, and albumin was divided into three groups. The maximum chi-square point of 5.163 was reached when applying SFA = 145.3 cm2 as the optimal cut-off point. Similarly, the optimal cut-off points of TFA and VFA were 210.7 cm2 and 114.7 cm2, respectively. The optimal cut-off point for BMI was 27.3 kg/m2 (P < 0.05). The optimal thresholds of albumin were 38.3 g/L and 42.4 g/L for survival prediction in DLBCL patients (P < 0.001, Figure 3).
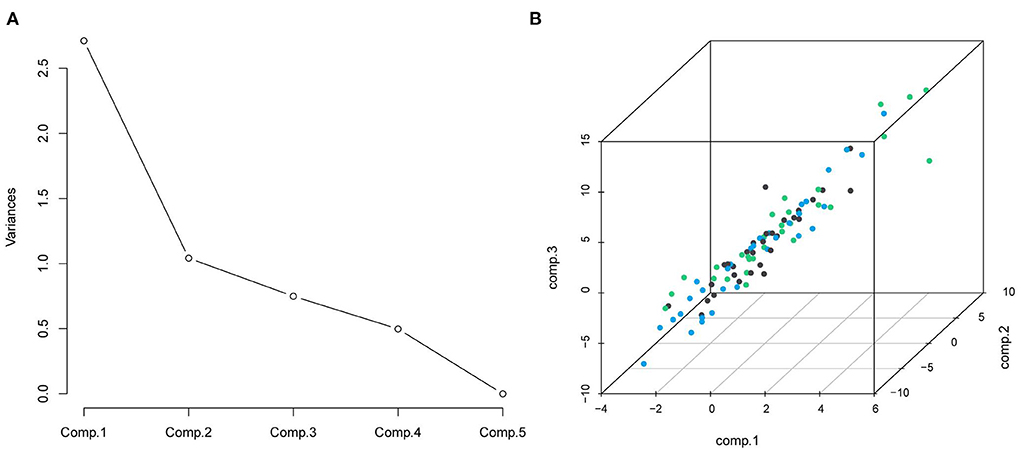
Figure 2. (A) Scree plot from principal components analysis of nutrition elements; the five components were: TFA, VFA, SFA, BMI, and albumin; (B) the distribution of the three principal components.
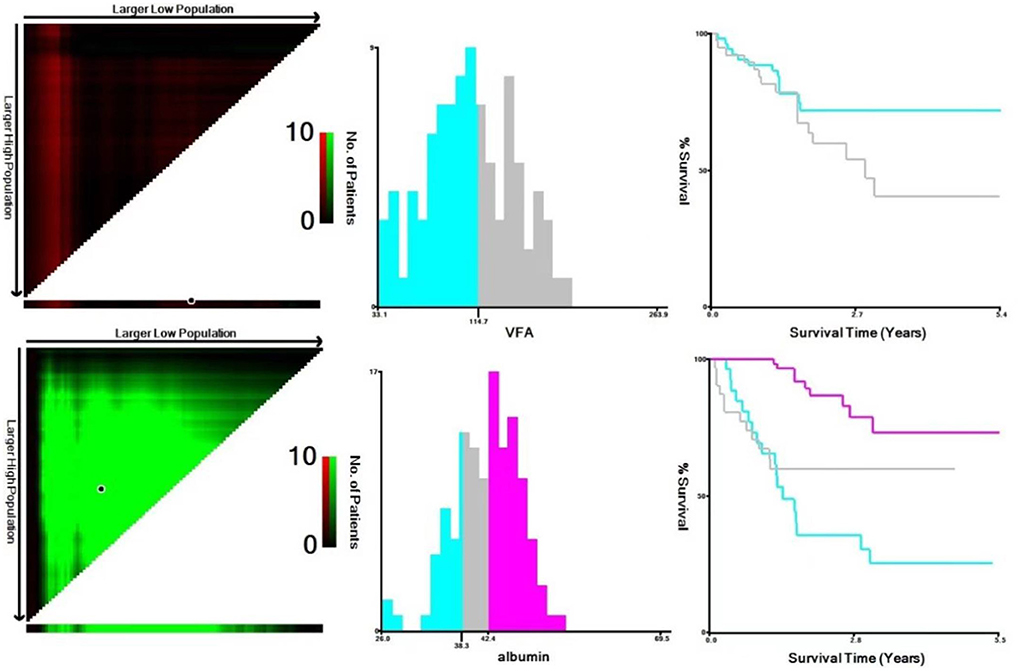
Figure 3. Analysis of VFA and albumin using X-Tile program. The black circles highlight the optimal cutoff values which were presented in histograms.
Cut-off points identification of continuous variables
Continuous variables included in this study, registered at the time of diagnosis, were age, LDH, β2-microglobulin, globulin, RBC, WBC, LYC, hemoglobin and platelet. The continuous variables were processed separately by X-Tile program, RCS and laboratory reference range. The results showed that there was a non-linear correlation between age and death risk (P < 0.001). The X-Tile program divided age into three groups. By comparing the results of RCS and X-Tile, two cut-off points could more accurately indicate the relationship between age and survival of DLBCL (P < 0.001, X-Tile; P = 0.011, RCS). Similarly, LDH, Ki-67, RBC, β2-microglobulin and globulin were grouped by X-Tile program. WBC was grouped using the RCS. The normal reference range (130–175g/L) could better reflect the relationship between hemoglobin and survival outcome.
Univariable and multivariate analysis of DLBCL patients
Based on the two statistical analysis methods, we constructed two models related to DLBCL prognosis. The results of univariable analysis of Model 1 revealed that β2-microglobulin, globulin, Ann Arbor stage, age, Ki-67, hemoglobin, RBC, significantly affected OS (P < 0.05). β2-microglobulin appeared to be a stronger predictor (P < 0.001). The results of univariable analysis of variable extracted by PCA showed that it had an impact on the prognosis of DLBCL patients (P < 0.1). After iterative analysis of the multivariate model, the final prognostic indicator was composed of four factors (bone marrow involvement, β2-microglobulin, B symptoms, RBC, Table 2). Likewise, β2-microglobulin, globulin, Ann Arbor stage, age, Ki-67, hemoglobin, RBC, BMI significantly affected OS in univariable analysis of Model 2 (P < 0.05). Albumin, β2-microglobulin appeared to be stronger predictors (P < 0.001). After iterative analysis of the multivariate model, the final prognostic indicator was composed of four adverse factors (Table 2), which showed a better model fit (AIC = 140.02).
Efficacy evaluation of nutrition-related prognosis index
The net benefit of clinical predictors was plotted according to the threshold probability. Model 2 demonstrated an increased net benefit over Model 1 for predicting DLBCL patients (Figure 4). Afterwards, a prognostic model of DLBCL based on the exploration of nutritional indices and clinical usage was established (Table 3).
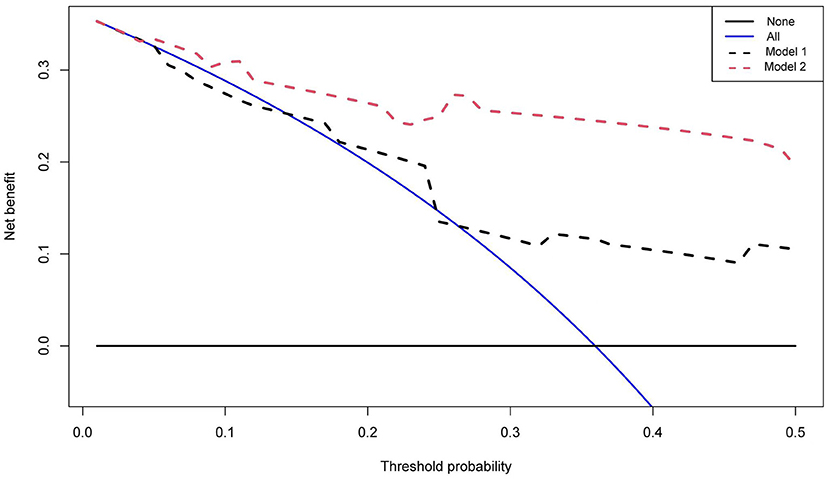
Figure 4. Decision curves of two multivariate models. The vertical axis represents the value of net benefit and the horizontal axis represents the threshold level (possible probabilistic pointcuts).
Prognostic values of albumin with pathological patterns in DLBCL
The results indicated that patients with albumin value <38.3 g/L had a poor prognosis. GCB patients accounted for 66.67% in all patients, and the results showed that albumin level was significant for the prognosis of GCB and Non-GCB patients (P < 0.005, Figures 5E, F). In addition, albumin level in both BCL-2 and BCL-6 negative groups had no effect on the prognosis of DLBCL patients (P = 0.170, P = 0.054), while different albumin level in BCL-2 and BCL-6 positive groups had influence on the prognosis (P < 0.001, Figures 5C, D). Similarly, different VFA level in c-Myc and BCL-2 negative groups had influence on the prognosis (P < 0.05, Figures 5A, B).
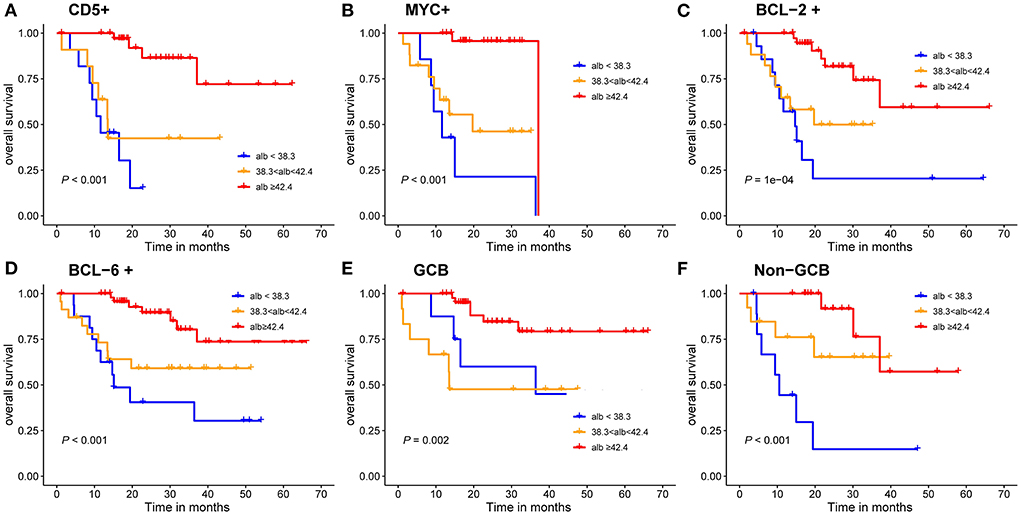
Figure 5. Kaplan-Meier survival curves of the DLBCL patients. (A–D) prognosis of different albumin levels in CD5 positive, c-Myc positive, BCL-2 positive and BCL-6 positive groups; (E,F) prognosis of different albumin levels in GCB and Non-GCB groups.
Development and validation of nutrition-associated prognosis index
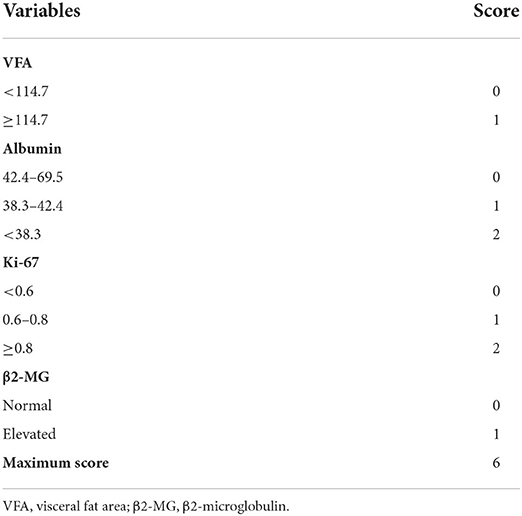
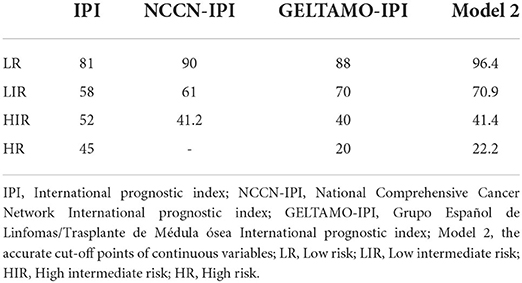
After exploration of nutritional indices and comparison by DCA, the current Model 2 used a maximum of 6 scoring points for categorized VFA, albumin, Ki-67 and β2-microglobulin (Table 3). This resulted in the establishment of four risk groups: low-risk (LR: 0–1points), low-intermediate risk (LIR: 2 points), high-intermediate risk (HIR: 3 points) and high-risk (HR: ≥ 4 points) with 2-year OS rates of 96.4, 70.9, 41.4 and 22.2%, respectively (Table 4). The C-index for the prediction model 2 was 0.823 [95% CI (0.749~0.897)] for validation.
All cases had complete data for the calculation of IPI, the 2-year OS rate for the LR, LIR, HIR and HR were 81, 58, 52 and 45%, respectively (Figure 6), and they were significantly different in the global (P < 0.010). Nevertheless, the IPI failed to distinguish LIR and HIR patients (P = 0.770). The NCCN-IPI separated patients into three risk groups and there was a marked difference between groups (LR vs. LIR: P = 0.021, LIR vs. HR: P = 0.019). The GELTMAO-IPI(Grupo Español de Linfomas/Trasplante de Médula ósea International prognostic index) separated patients into four risk groups and there was also a marked difference between LIR and HIR (P < 0.001) but it failed to distinguish LR and LIR (P = 0.140), HIR and HR (P = 0.940). However, model 2 could overcome the defects of IPI to distinguish LIR and HIR (P < 0.050). In addition, compared with NCCN-IPI, our model made a more obvious distinction between LIR and HIR.
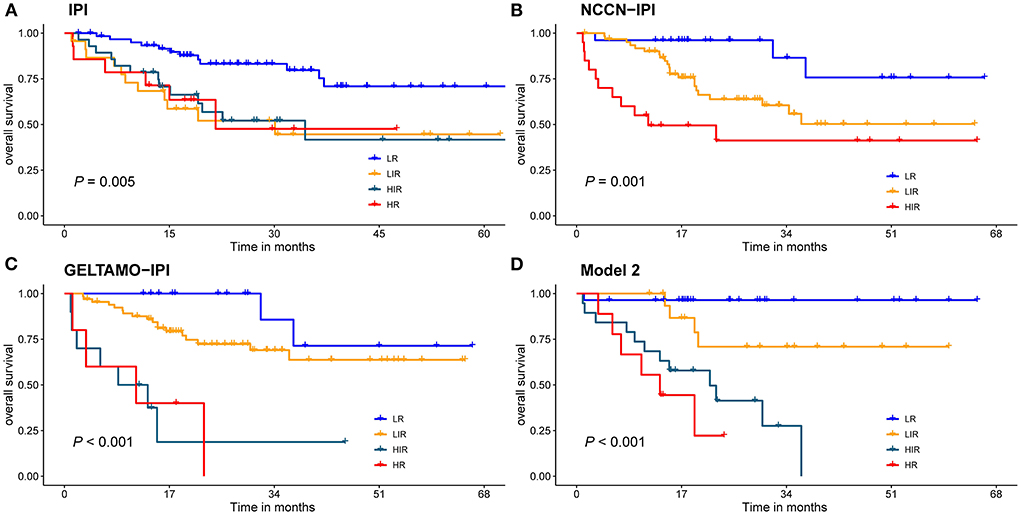
Figure 6. Risk groups according to stratification with the (A) IPI scores; (B) NCCN-IPI scores; (C) GELTAMO-IPI scores; (D) Model 2 scores. Global comparison P < 0.05.
Discussion
In this retrospective study of newly diagnosed DLBCL patients, we demonstrated that nutritional indices of VFA and albumin could be independent prognostic factors for patients with DLBCL. By introducing β2-microglobulin and Ki-67, a nutrition-related prognosis index (NPI) was developed for a more accurate stratification of patients.
About one third of tumors patients are with poor nutritional status. The nutritional index PNI was identified as a powerful prognostic predictor of OS and PFS in patients with extranodal natural killer/T cell lymphoma (28). Similarly, it also could be used to predict the response to treatment, OS and PFS in DLBCL patients and low PNI predicted poor outcome (29). Visceral fat is an important index to evaluate recessive obesity and excessive accumulation of abdominal fat can easily cause abnormal glucose metabolism, lead to diabetes, and increase the risk of heart disease, colorectal cancer and uterine cancer (30–32). In this study, X-Tile program divided VFA into two groups with the optimal cut-off point of 114.7 cm2, whereas as reported before in the literature, visceral obesity was defined as a VFA≥130 cm2 (33). Univariable analysis showed that when the cut-off point of VAF was 130 cm2, it could not predict the prognosis of patients in our study (P = 0.12). When VFA exceeded 114.7 cm2, the mortality risk of DLBCL increased by 2.66 times. Albumin is widely recognized as a biomarker of nutritional status and its predictive roles of morbidity following outcomes in certain tumors have been illustrated (34–36). Albumin levels were divided into three groups and the optimal thresholds of albumin were 38.3 g/L and 42.4 g/L for survival prediction in DLBCL patients in our study. We also used X-Tile program to explore the optimal cut-off point for SFA (145.3 cm2), TFA (210.7 cm2) and BMI (27.3 kg/m2). Univariable analysis results showed that BMI could be a prognostic factor for the prognosis DLBCL, while TFA had no significance (P = 0.123). Furthermore, BMI was observed to be not predictive in multivariable analysis.
Based on nutritional indices, Model 2 showed a higher net benefit over Model 1 for predicting patients with DLBCL by using DCA. In univariable analysis, we found that three nutritional markers (VFA, albumin and BMI) were associated with prognosis of DLBCL. β2-microglobulin has been a classic prognostic factor in the pre-rituximab (37) and post-rituximab eras (38, 39). According to multivariable Cox regression, the coefficients of each risk factor were calculated, and the basic risk reference value was determined, then the score of each risk factor was calculated by scoring distance (40). The final model included four independent variables: VFA, albumin, Ki-67, and β2-microglobulin. The C-index was 0.823 between the predicted outcome and the real outcome of the model. NPI divides DLBCL patients into four groups with 2-year OS rates of 96.4, 70.9, 41.4 and 22.2%.
Previous studies have shown that different pathologic immunophenotypes influence the prognosis of DLBCL. In this study, we noticed that in different immunophenotypes, such as c-Myc and BCL-2 negative group, different levels of VFA could affect prognosis. Similarly, in different immunophenotypes, such as GCB, Non-GCB, BCL-2 and BCL-6 positive groups, different levels of albumin could affect the prognosis of DLBCL patients. The cut-off value of albumin was set at 3.5 g/dl in a previous study, while the lowest value of albumin in our study was 38.3 g/l, which may be due to the difference of ethnicity (41).
IPI has been the internationally recognized basis for the prognosis evaluation of DLBCL patients in the pre-rituximab era but it failed to accurately discern risk groups, especially high-risk patients due to the addition of rituximab to conventional CHOP regimens. On the basis of IPI, NCCN-IPI further refined the categorization of age and normalized LDH to better distinguish low-risk and high-risk subgroups (6). On the basis of NCCN-IPI, by adding β2-microglobulin, GELTAMO-IPI can better discriminate authentic high-risk group than NCCN-IPI and is not influenced by primary extranodal presentation or treatments of different intensity (5). The comparisons of the IPI, NCCN-IPI, GELTAMO-IPI and NPI were shown in Table 4 and Figure 6. Taking 3-year OS for example, IPI failed to discern authentic LR patients (3-y OS: 80%) but NCCN-IPI and GELTAMO-IPI showed better discrimination in identifying LR patients than IPI (3-y OS: 87%), while NPI showed a highest discernment in identifying LR patients (3-y OS: 90%). In addition, IPI did not distinguish between LIR and HIR groups. It is worth noting that in our study, NCCN-IPI failed to identify HR group, and GELTAMO-IPI failed to distinguish LR and LIR, HIR and HR groups. Although in NPI, there were no significant differences in HIR and HR, the survival curve was different.
In conclusion, the prognostic NPI model based on nutritional markers can accurately stratify low-risk patients and improve the prognostic assessment of patients with DLBCL. However, due to the retrospective study, small sample size and insufficient median follow-up time, this study has some limitations. In future prospective multicenter studies, the relationship between nutritional status and prognosis of DLBCL will be further explored.
Data availability statement
The raw data supporting the conclusions of this article will be made available by the authors, without undue reservation.
Author contributions
WS and GC contributed to conceptualization, supervision, and writing—review and editing. ZS and LH contributed to formal analysis and writing—original draft. SZ and QS contributed to acquisition of data. DY and WL contributed to conceptualization. All authors contributed to the article and approved the submitted version.
Funding
This study was funded by the Natural Science Foundation of Jiangsu Province, Grant/Award Number BK20171181; Jiangsu Key Research and Development Project of Social Development, Grant/Award Number BE2019638; and Young Medical Talents of Jiangsu Science and Education Health Project, Grant/Award Number QNRC2016791.
Acknowledgments
Thanks to all authors for their contributions.
Conflict of interest
The authors declare that the research was conducted in the absence of any commercial or financial relationships that could be construed as a potential conflict of interest.
Publisher's note
All claims expressed in this article are solely those of the authors and do not necessarily represent those of their affiliated organizations, or those of the publisher, the editors and the reviewers. Any product that may be evaluated in this article, or claim that may be made by its manufacturer, is not guaranteed or endorsed by the publisher.
References
2. International Non-Hodgkin's Lymphoma Prognostic Factors P. A predictive model for aggressive non-Hodgkin's lymphoma. N Engl J Med. (1993) 329:987-94. doi: 10.1056/NEJM199309303291402
3. Johnson PW, Whelan J, Longhurst S, Stepniewska K, Matthews J, Amess J, et al. Beta-2 microglobulin: a prognostic factor in diffuse aggressive non-Hodgkin's lymphomas. Br J Cancer. (1993) 67:792-7. doi: 10.1038/bjc.1993.144
4. Jung YH, Woo IS, Han CW. Clinical characteristics and outcomes in diffuse large B cell lymphoma patients aged 70 years and older: a single-center experience with a literature review. Korean J Intern Med. (2015) 30:684-93. doi: 10.3904/kjim.2015.30.5.684
5. Montalban C, Diaz-Lopez A, Dlouhy I, Rovira J, Lopez-Guillermo A, Alonso S, et al. Validation of the NCCN-IPI for diffuse large B-cell lymphoma (DLBCL): the addition of beta2 -microglobulin yields a more accurate GELTAMO-IPI. Br J Haematol. (2017) 176:918-28. doi: 10.1111/bjh.14489
6. Zhou Z, Sehn LH, Rademaker AW, Gordon LI, Lacasce AS, Crosby-Thompson A, et al. An enhanced international prognostic index (NCCN-IPI) for patients with diffuse large B-cell lymphoma treated in the rituximab era. Blood. (2014) 123:837–42. doi: 10.1182/blood-2013-09-524108
7. Kim DH. Nutritional issues in patients with cancer. Intest Res. (2019) 17:455–62. doi: 10.5217/ir.2019.00076
8. Argiles JM, Lopez-Soriano FJ, Toledo M, Betancourt A, Serpe R, Busquets S. The cachexia score (CASCO): a new tool for staging cachectic cancer patients. J Cachexia Sarcopenia Muscle. (2011) 2:87–93. doi: 10.1007/s13539-011-0027-5
9. Nozoe T, Matono R, Ijichi H, Ohga T, Ezaki T. Glasgow prognostic score (GPS) can be a useful indicator to determine prognosis of patients with colorectal carcinoma. Int Surg. (2014) 99:512–7. doi: 10.9738/INTSURG-D-13-00118.1
10. Onodera T, Goseki N, Kosaki G. [Prognostic nutritional index in gastrointestinal surgery of malnourished cancer patients]. Nihon Geka Gakkai Zasshi. (1984) 85:1001–5.
11. Go SI, Park S, Kang MH, Kim HG, Kim HR, Lee GW. Clinical impact of prognostic nutritional index in diffuse large B cell lymphoma. Ann Hematol. (2019) 98:401–11. doi: 10.1007/s00277-018-3540-1
12. Abar L, Sobiecki JG, Cariolou M, Nanu N, Vieira AR, Stevens C, et al. Body size and obesity during adulthood, and risk of lympho-haematopoietic cancers: an update of the WCRF-AICR systematic review of published prospective studies. Ann Oncol. (2019) 30:528–41. doi: 10.1093/annonc/mdz045
13. Crumley AB, Stuart RC, McKernan M, McMillan DC. Is hypoalbuminemia an independent prognostic factor in patients with gastric cancer? World J Surg. (2010) 34:2393–8. doi: 10.1007/s00268-010-0641-y
14. Azab B, Kedia S, Shah N, Vonfrolio S, Lu W, Naboush A, et al. The value of the pretreatment albumin/globulin ratio in predicting the long-term survival in colorectal cancer. Int J Colorectal Dis. (2013) 28:1629–36. doi: 10.1007/s00384-013-1748-z
15. Wu N, Chen G, Hu H, Pang L, Chen Z. Low pretherapeutic serum albumin as a risk factor for poor outcome in esophageal squamous cell carcinomas. Nutr Cancer. (2015) 67:481–5. doi: 10.1080/01635581.2015.1004726
16. Grillot J, D'Engremont C, Parmentier AL, Lakkis Z, Piton G, Cazaux D, et al. Sarcopenia and visceral obesity assessed by computed tomography are associated with adverse outcomes in patients with Crohn's disease. Clin Nutr. (2020) 39:3024–30. doi: 10.1016/j.clnu.2020.01.001
18. Bastien M, Poirier P, Lemieux I, Despres JP. Overview of epidemiology and contribution of obesity to cardiovascular disease. Prog Cardiovasc Dis. (2014) 56:369–81. doi: 10.1016/j.pcad.2013.10.016
19. Soysal P, Arik F, Smith L, Jackson SE, Isik AT. Inflammation, frailty and cardiovascular disease. Adv Exp Med Biol. (2020) 1216:55–64. doi: 10.1007/978-3-030-33330-0_7
20. Ali AT. Polycystic ovary syndrome and metabolic syndrome. Ceska Gynekol. (2015) 80:279–89. doi: 10.1093/med/9780190214791.003.0016
21. Hans CP, Weisenburger DD, Greiner TC, Gascoyne RD, Delabie J, Ott G, et al. Confirmation of the molecular classification of diffuse large B-cell lymphoma by immunohistochemistry using a tissue microarray. Blood. (2004) 103:275–82. doi: 10.1182/blood-2003-05-1545
22. Ringner M. What is principal component analysis? Nat Biotechnol. (2008) 26:303–4. doi: 10.1038/nbt0308-303
23. Camp RL, Dolled-Filhart M, Rimm DL. X-tile: a new bio-informatics tool for biomarker assessment and outcome-based cut-point optimization. Clin Cancer Res. (2004) 10:7252–9. doi: 10.1158/1078-0432.CCR-04-0713
24. Rao RBSJ. Regression modeling strategies: with applications to linear models, logistic regression, and survival analysis. J Am Statal Assoc. (2003) 98:257–8. doi: 10.1198/jasa.2003.s263
25. Akaike H. A new look at the statistical model identification. IEEE Trans Automat. Contr. (1974) 19:716–23. doi: 10.1109/TAC.1974.1100705
26. Vickers AJ, Elkin EB. Decision curve analysis: a novel method for evaluating prediction models. Med Decis Making. (2006) 26:565–74. doi: 10.1177/0272989X06295361
27. Vickers AJ, Cronin AM, Elkin EB, Gonen M. Extensions to decision curve analysis, a novel method for evaluating diagnostic tests, prediction models and molecular markers. BMC Med Inform Decis Mak. (2008) 8:53. doi: 10.1186/1472-6947-8-53
28. Chen KL, Liu YH, Li WY, Chen J, Gu YK, Geng QR, et al. The prognostic nutritional index predicts survival for patients with extranodal natural killer/T cell lymphoma, nasal type. Ann Hematol. (2015) 94:1389–400. doi: 10.1007/s00277-015-2361-8
29. Perisa V, Zibar L, Knezovic A, Perisa I, Sincic-Petricevic J, Aurer I. Prognostic nutritional index as a predictor of prognosis in patients with diffuse large B cell lymphoma. Wien Klin Wochenschr. (2017) 129:411–9. doi: 10.1007/s00508-016-1077-7
30. Sabag A, Way KL, Keating SE, Sultana RN, O'Connor HT, Baker MK, et al. Exercise and ectopic fat in type 2 diabetes: a systematic review and meta-analysis. Diabetes Metab. (2017) 43:195–210. doi: 10.1016/j.diabet.2016.12.006
31. Levelt E, Pavlides M, Banerjee R, Mahmod M, Kelly C, Sellwood J, et al. Ectopic and visceral fat deposition in lean and obese patients with type 2 diabetes. J Am Coll Cardiol. (2016) 68:53–63. doi: 10.1016/j.jacc.2016.03.597
32. Yamamoto S, Nakagawa T, Matsushita Y, Kusano S, Hayashi T, Irokawa M, et al. Visceral fat area and markers of insulin resistance in relation to colorectal neoplasia. Diabetes Care. (2010) 33:184–9. doi: 10.2337/dc09-1197
33. Kullberg J, Brandberg J, Angelhed JE, Frimmel H, Bergelin E, Strid L, et al. Whole-body adipose tissue analysis: comparison of MRI, CT and dual energy X-ray absorptiometry. Br J Radiol. (2009) 82:123–30. doi: 10.1259/bjr/80083156
34. Arques S. Human serum albumin in cardiovascular diseases. Eur J Intern Med. (2018) 52:8–12. doi: 10.1016/j.ejim.2018.04.014
35. Huang H, Chen LM, Fang XJ, Guo CC, Lin XP, Hong HM, et al. Prognostic value of the modified systemic inflammation score in patients with extranodal natural killer/T-cell lymphoma. Front Pharmacol. (2020) 11:593392. doi: 10.3389/fphar.2020.593392
36. Kuo HT, Lin KS, Zhang Z, Uribe CF, Merkens H, Zhang C, et al. Novel (177)Lu-labeled Albumin-binder-conjugated PSMA-targeting agents with extremely high tumor uptake and enhanced tumor-to-kidney absorbed dose ratio. J Nucl Med. (2021) 62:521–7. doi: 10.2967/jnumed.120.250738
37. Rodriguez J, Cabanillas F, McLaughlin P, Swan F, Rodriguez M, Hagemeister F, et al. A proposal for a simple staging system for intermediate grade lymphoma and immunoblastic lymphoma based on the 'tumor score'. Ann Oncol. (1992) 3:711–7. doi: 10.1093/oxfordjournals.annonc.a058324
38. Irving NG, Hardy JA, Bahary N, Friedman JM, Brown SD. The alpha 2 chain of type 1 collagen does not map to mouse chromosome 16 but maps close to the Met proto-oncogene on mouse chromosome 6. Cytogenet Cell Genet. (1989) 50:121–2. doi: 10.1159/000132737
39. Zhou H, Xu-Monette ZY, Xiao L, Strati P, Hagemeister FB, He Y, et al. Prognostic factors, therapeutic approaches, and distinct immunobiologic features in patients with primary mediastinal large B-cell lymphoma on long-term follow-up. Blood Cancer J. (2020) 10:49. doi: 10.1038/s41408-020-0312-7
40. Sullivan LM, Massaro JM, D'Agostino RB. Presentation of multivariate data for clinical use: the framingham study risk score functions. Stat Med. (2004) 23:1631–60. doi: 10.1002/sim.1742
Keywords: DLBCL, visceral fat area, albumin, nutritional indices, prognosis
Citation: Shen Z, Hu L, Zhang S, Sun Q, Li W, Yan D, Cai G and Sang W (2022) Visceral fat area and albumin based nutrition-related prognostic index model could better stratify the prognosis of diffuse large B-cell lymphoma in rituximab era. Front. Nutr. 9:981433. doi: 10.3389/fnut.2022.981433
Received: 29 June 2022; Accepted: 11 August 2022;
Published: 08 September 2022.
Edited by:
Weili Zhao, Shanghai Jiao Tong University, ChinaReviewed by:
Xiaoxia Hu, Ruijin Hospital, ChinaLi Gao, Xinqiao Hospital, China
Shujuan Wen, Xinjiang Medical University, China
Copyright © 2022 Shen, Hu, Zhang, Sun, Li, Yan, Cai and Sang. This is an open-access article distributed under the terms of the Creative Commons Attribution License (CC BY). The use, distribution or reproduction in other forums is permitted, provided the original author(s) and the copyright owner(s) are credited and that the original publication in this journal is cited, in accordance with accepted academic practice. No use, distribution or reproduction is permitted which does not comply with these terms.
*Correspondence: Wei Sang, c3cxOTgxNzI2QDEyNi5jb20=; Guoqi Cai, R3VvcWkuQ2FpQHV0YXMuZWR1LmF1
†These authors have contributed equally to this work and share first authorship
 Ziyuan Shen
 Lingling Hu2†
 Guoqi Cai
 Wei Sang