- 1College of Food Science and Nutritional Engineering, China Agricultural University, Beijing, China
- 2Key Laboratory of Precision Nutrition and Food Quality, Department of Nutrition and Health, China Agricultural University, Beijing, China
Objectives: Large interpersonal variability in postprandial glycemic response (PGR) to white rice has been reported, and differences in the PGR patterns during the oral glucose tolerance test (OGTT) have been documented. However, there is scant study on the PGR patterns of white rice. We examined the typical PGR patterns of white rice and glucose and the association between them.
Materials and methods: We analyzed the data of 3-h PGRs to white rice (WR) and glucose (G) of 114 normoglycemic female subjects of similar age, weight status, and same ethnic group. Diverse glycemic parameters, based on the discrete blood glucose values, were calculated over 120 and 180 min. K-means clustering based on glycemic parameters calculated over 180 min was applied to identify subgroups and representative PGR patterns. Principal factor analysis based on the parameters used in the cluster analysis was applied to characterize PGR patterns. Simple correspondence analysis was performed on the clustering categories of WR and G.
Results: More distinct differences were found in glycemic parameters calculated over 180 min compared with that calculated over 120 min, especially in the negative area under the curve and Nadir. We identified four distinct PGR patterns to WR (WR1, WR2, WR3, and WR4) and G (G1, G2, G3, and G4), respectively. There were significant differences among the patterns regard to postprandial hyperglycemia, hypoglycemic, and glycemic variability. The WR1 clusters had significantly lower glycemic index (59 ± 19), while no difference was found among the glycemic index based on the other three clusters. Each given G subgroup presented multiple patterns of PGR to WR, especially in the largest G subgroup (G1), and in subgroup with the greatest glycemic variability (G3).
Conclusion: Multiple subgroups could be classified based on the PGR patterns to white rice and glucose even in seemingly homogeneous subjects. Extending the monitoring time to 180 min was conducive to more effective discrimination of PGR patterns. It may not be reliable to extrapolate the patterns of PGR to rice from that to glucose, suggesting a need of combining OGTT and meal tolerance test for individualized glycemic management.
Introduction
As the risk factors of the cardiovascular disease and some cancers, diabetes, and dysglycemia are regarded as one of the most important medical concerns in most parts of the world (1). Early detection of a tendency toward diabetes, as well as the effective management of postprandial glycemic excursion, are of public health significance.
The progression from an apparent health person to a diabetic consists of multiple stages such as insulin resistance, hyperglycemia, β-cell dysfunction, β-cell mass reduction, and impaired glucose tolerance (1, 2). The oral glucose tolerance test (OGTT), which measures the postprandial glycemic response (PGR) to glucose in 120 min of an individual, is widely used to assess the insulin sensitivity, the beta-cell function, and judge an individual’s metabolic capacity to handle carbohydrate foods (3). The glycemic compromised individuals were usually classified into several category of dysglycemia and receive advice based on their OGTT results based on the fasting and glucose values within 120 min (4). However, recent studies indicated that compared with the glucose values at certain time points, the features of OGTT curve might be better associated with future end points such as diagnosed T2DM and all-cause mortality risk (5–7).
Similarly, the glycemic index (GI), which is calculated based on the incremental area under curve (iAUC) of glucose and a test food, is an extensively used parameter of the PGR curve to a certain food. However, there are evidence that the GI value and the iAUC of a food could not fully illustrate the multiple attributes of the PGR patterns among difference groups of responders (8, 9). The connotation of PGR to a food includes postprandial hyperglycemia, hypoglycemic, and glycemic variability. Compared with glucose concentration of 1 or 2 h and the iAUC, the PGR pattern, which describes the peak and the peak time, the speed of glucose dropping, the level of nadir, and the magnitude of glycemic excursion over the time, may provide more information related to pathophysiological differences of individuals (10–12). Such a set of glycemic information can be conducive not only to early identification of the individuals at risk, but also to successful management of the prediabetes and the diabetes.
White rice, a major staple food in most Asian diets and one of the important carbohydrate sources in many other regions over the world (13, 14), has caused wide concern in terms of its contribution to the overall glycemic load. However, the results of epidemiologic literature on rice consumption and risk of type 2 diabetes mellitus (T2DM) are mixed, range from positive (15), null (16, 17) to negative (18). One of the potential contributors to this inconsistency may be the large interpersonal variability in PGR to white rice, which have been investigated by previous studies in aspect of iAUC (19–21). But few of them have inspected the PGR patterns to rice. In addition, the correspondence between the individual PGR patterns to rice and glucose has not been investigated. It is yet to be confirmed that whether the postprandial glycemic curve of a glucose test can predict the PGR patterns to a rice meal.
In the present study, the data of PGRs to white rice (WR) and glucose (G) of 114 subjects in previous studies carried out in our laboratory were included for comparison with respect to their PGR characteristics. The aims of this study were: (1) to identify the subgroups based on their PGR patterns of WR and G; (2) to examine the association between the PGR patterns of WR and G; (3) to find whether the glycemic index (GI) of rice would differ among subgroups. We assumed that the PGR patterns to white rice and glucose varied even in seemingly homogenous healthy subjects and could be classified into distinguish subgroups.
Materials and methods
Data collection
This study was a post-hoc analysis. We derived the data from several acute feeding trials conducted in our laboratory in the past 5 years, and all participants signed informed consent forms for participation in these studies (22–27). The subjects of these trials were recruited through the university bulletin boards and online advertisements with similar recruitment criteria which were: (1) normal weight (BMI in the range of 18.5–25.0 kg/m2) healthy university students aged between 18 and 25 with normal fasting glucose and normal glucose tolerance; (2) having three meals regularly and not on diet to gain or to lose weight in the past 3 months; (3) no habit of smoking/alcohol drinking/dependency on drugs or medication; (4) not participated in competitive sports or high intensity training.
These trials used randomized, repeated measures cross-over design and same procedure. The participants consumed test meals in a randomized order. The test meals included cooked white rice (Oryza sativa spp. japonica) and glucose solution, each containing 50 g available carbohydrates. There was at least 3 days between two test sessions to ensure adequate washout. The subjects were asked not to take any test 3 days before and after the start of menstruation. One day before each trial day, the participants were instructed to refrain from excessive eating, alcohol, staying up late and strenuous exercise.
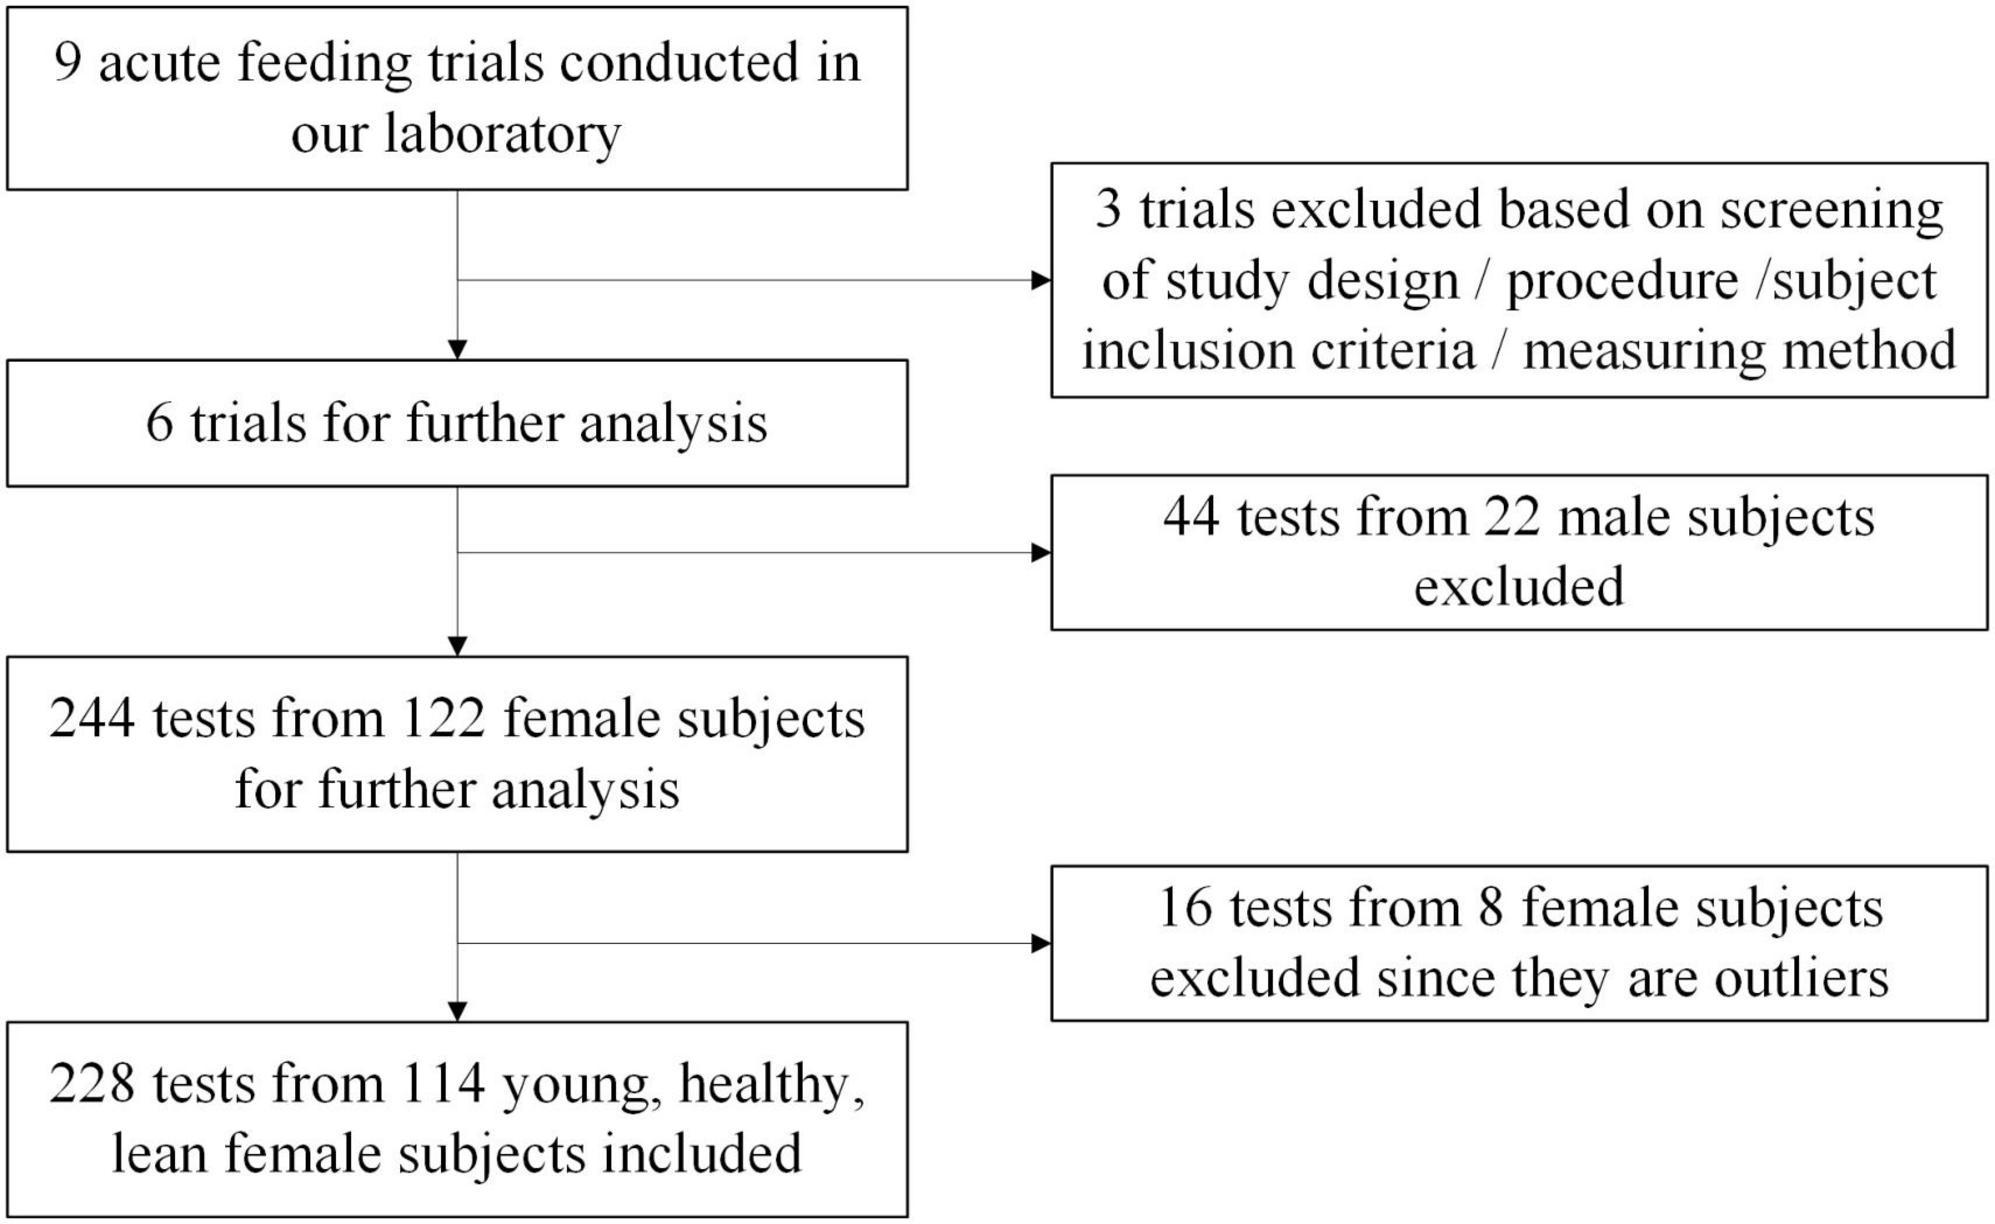
On the test day, the subjects came to the laboratory at morning after a 12 h overnight fast, and their fasting plasma glucose concentrations were tested after a short rest. Then the test meal was provided to the subjects and the food was ingested within 5–15 min. The finger prick blood samples were collected at 0 (fasting), 15, 30, 45, 60, 90, 120, 150, and 180 min. The plasma blood glucose concentrations were measured on an ONETOUCH® Ultra® (LifeScan Inc., Milpitas, CA, USA) glucometer using the glucose oxidase method. The fat mass was assessed by bio-impedance, using an eight-polar tactile electrode system (HBF-371, OMRON Corp., Kyoto, Japan). All the trials were approved by the Ethics Committee of China Agricultural University (ethics number 2016011, 2016012, CAUHR-2019001, CAUHR-2019002, CAUHR-2019006, CAUHR-2019007). After the selection and exclusion procedure (as shown in Figure 1), 228 tests from 114 female participants were included in the final analysis.
Outcome
The primary measurements were glucose concentrations at 0 (fasting), 15, 30, 45, 60, 90, 120, 150, and 180 min. The PGRs were converted to the values of glucose rises from the fasting value.
The specific outcomes were the incremental areas under the curve of PGRs (iAUC), the ratio of iAUC in different periods to total iAUC (iAUC%), the maximum postprandial glucose rise (Peak), the minimum postprandial glucose rise (Nadir), the standard deviation (SD) of glycemic variability, continuous overlapping net glycemic action (CONGA1), and the negative area under the curve (NAUC). The iAUCs were calculated using the trapezoidal method, ignoring the area beneath the fasting level. The CONGA1 described the SD of the differences between any individual glucose reading and a reading recorded either 1 h previously (28). The NAUC was the area beneath the fasting level. Given that the current recommendations stipulate the blood glucose should be monitored for 2-h post-ingestion in GI determinations and OGTT, these parameters were calculated both over 120 and 180 min, respectively.
Statistical analysis
A power calculation was conducted with the PASS 2021 (NCSS, Kaysville, UT, USA) using one-way analysis of variance allowing unequal variances, based on the mean and SD of iAUCs of four distinct glucose patterns during the OGTT observed by Hulman et al. (7). A sample size of n = 52 was required to provide 90% power to detect the difference in iAUC at 90% power and significance of 5% between groups. All statistical analyses were performed with SPSS version 21.0 (SPSS Inc. Chicago, IL, USA). The Identify Unusual Cases application in SPSS was used for the outlier exclusion. The parameters calculated over 180 min (iAUC60–180%, iAUC180, NAUC180, SD180, Peak180, Nadir180, and CONGA1180) were selected as analysis variables. The anomaly detection was performed on the datasets of white rice (WR) tests and glucose (G) tests separately. If a subject was identified as an anomalous case in any detection, the data of WR and G test would be excluded both. Comparison of glycemic parameters between test meals was done by using paired t-test or Wilcoxon signed-rank test.
Considering the intra-individual variability of the PGR to different test meals, cluster analysis was performed on the datasets of white rice (WR) tests and glucose (G) tests separately. After the pre-analysis, the parameters calculated over 180 min (iAUC60–180%, iAUC180, NAUC180, SD180, Peak180, Nadir180, and CONGA1180) were used for identification and classification of PGR patterns. We applied K-means clustering based on these glycemic parameters to identify subgroups, using squared Euclidean distance as distance measure. To ensure that the classes were in the same range, Z-score normalization was applied. To improve the reproducibility, clustering was replicated 50 times, and the outcome with lowest total sum of distances was chosen. We chose K = 4 because it led to distinct PGR patterns that represent the variation in the population. Then, differences of anthropometric characteristics were estimated by multinomial logistic regression models with class of PGR pattern as the outcome and values of BMI and fat mass as factors.
Generalized estimating equation was used to compare the difference of glucose rises at each time point between clusters. Postprandial glycemic parameters of clusters were analyzed by one-way ANOVA test or Kruskal–Wallis test. Then, we applied principal factor analysis (PFA) to summarize and visualize the responses to the parameters, and further characterize subgroups. PFA with varimax rotation was performed on the “114 × 7” matrix (114 participants × 7 parameters used in the cluster analysis) of the WR dataset and the G dataset separately. Retention of items was based on combined evaluation of the scree plot (number of factors on scree plot just before elbow) and eigenvalues over 1.0 to model factor structure (29). The factor scores were calculated by regression method. Then, the PFA was repeated on the dataset conducted by glycemic parameters calculated over 120 min (iAUC60–120%, iAUC120, NAUC120, SD120, Peak120, Nadir120, and CONGA1120). One-way ANOVA test was applied to compare the factor scores between subgroups. P-values of < 0.05 were considered statistically significant. Furthermore, simple correspondence analysis (SCA) was performed on clustering categories of WR and G.
Results
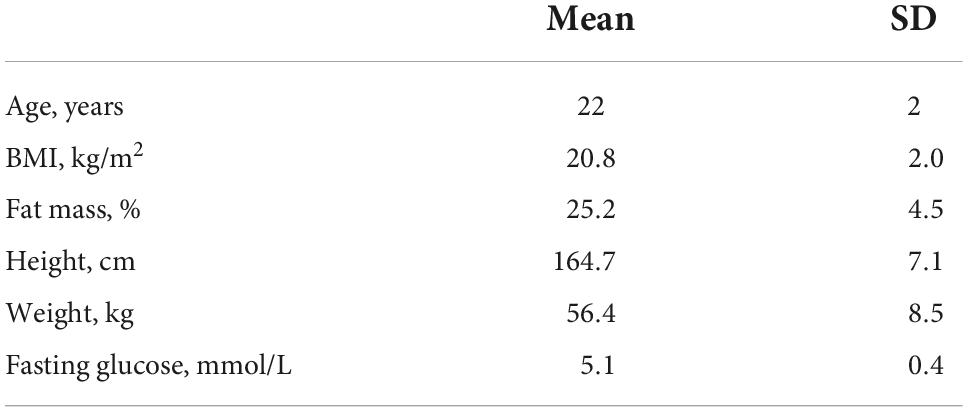
Baseline characteristics of participants are displayed in Table 1. The anthropometric measurements of the participants were within the acceptable normal limits for BMI, fasting blood glucose.
Inter-individual variation in postprandial responses
We examined interpersonal variability in the PGRs to WR and G. When comparing the PGRs of each person to the same meal, we found high interpersonal variability across all postprandial time points (Figure 2A). There was also a broad range of individual response to specific outcomes (Figure 3), especially in iAUC180 (CV = 32.97 for WR, 30.50 for G), CONGA1180 (CV = 34.07 for WR, 33.61 for G), CONGA1120 (CV = 38.65 for WR, 33.91 for G), and NAUC180 (interquartile range for WR, 33.76 for G). There was difference between the GI180 of white rice based on iAUC180 (86 ± 28) and the GI120 based on iAUC120 (80 ± 25). The large interpersonal differences in PGRs are also evident in that the type of meal that induced the highest PGR differs across participants and that different participants might have opposite PGRs to the pair of meals (Figure 2B).
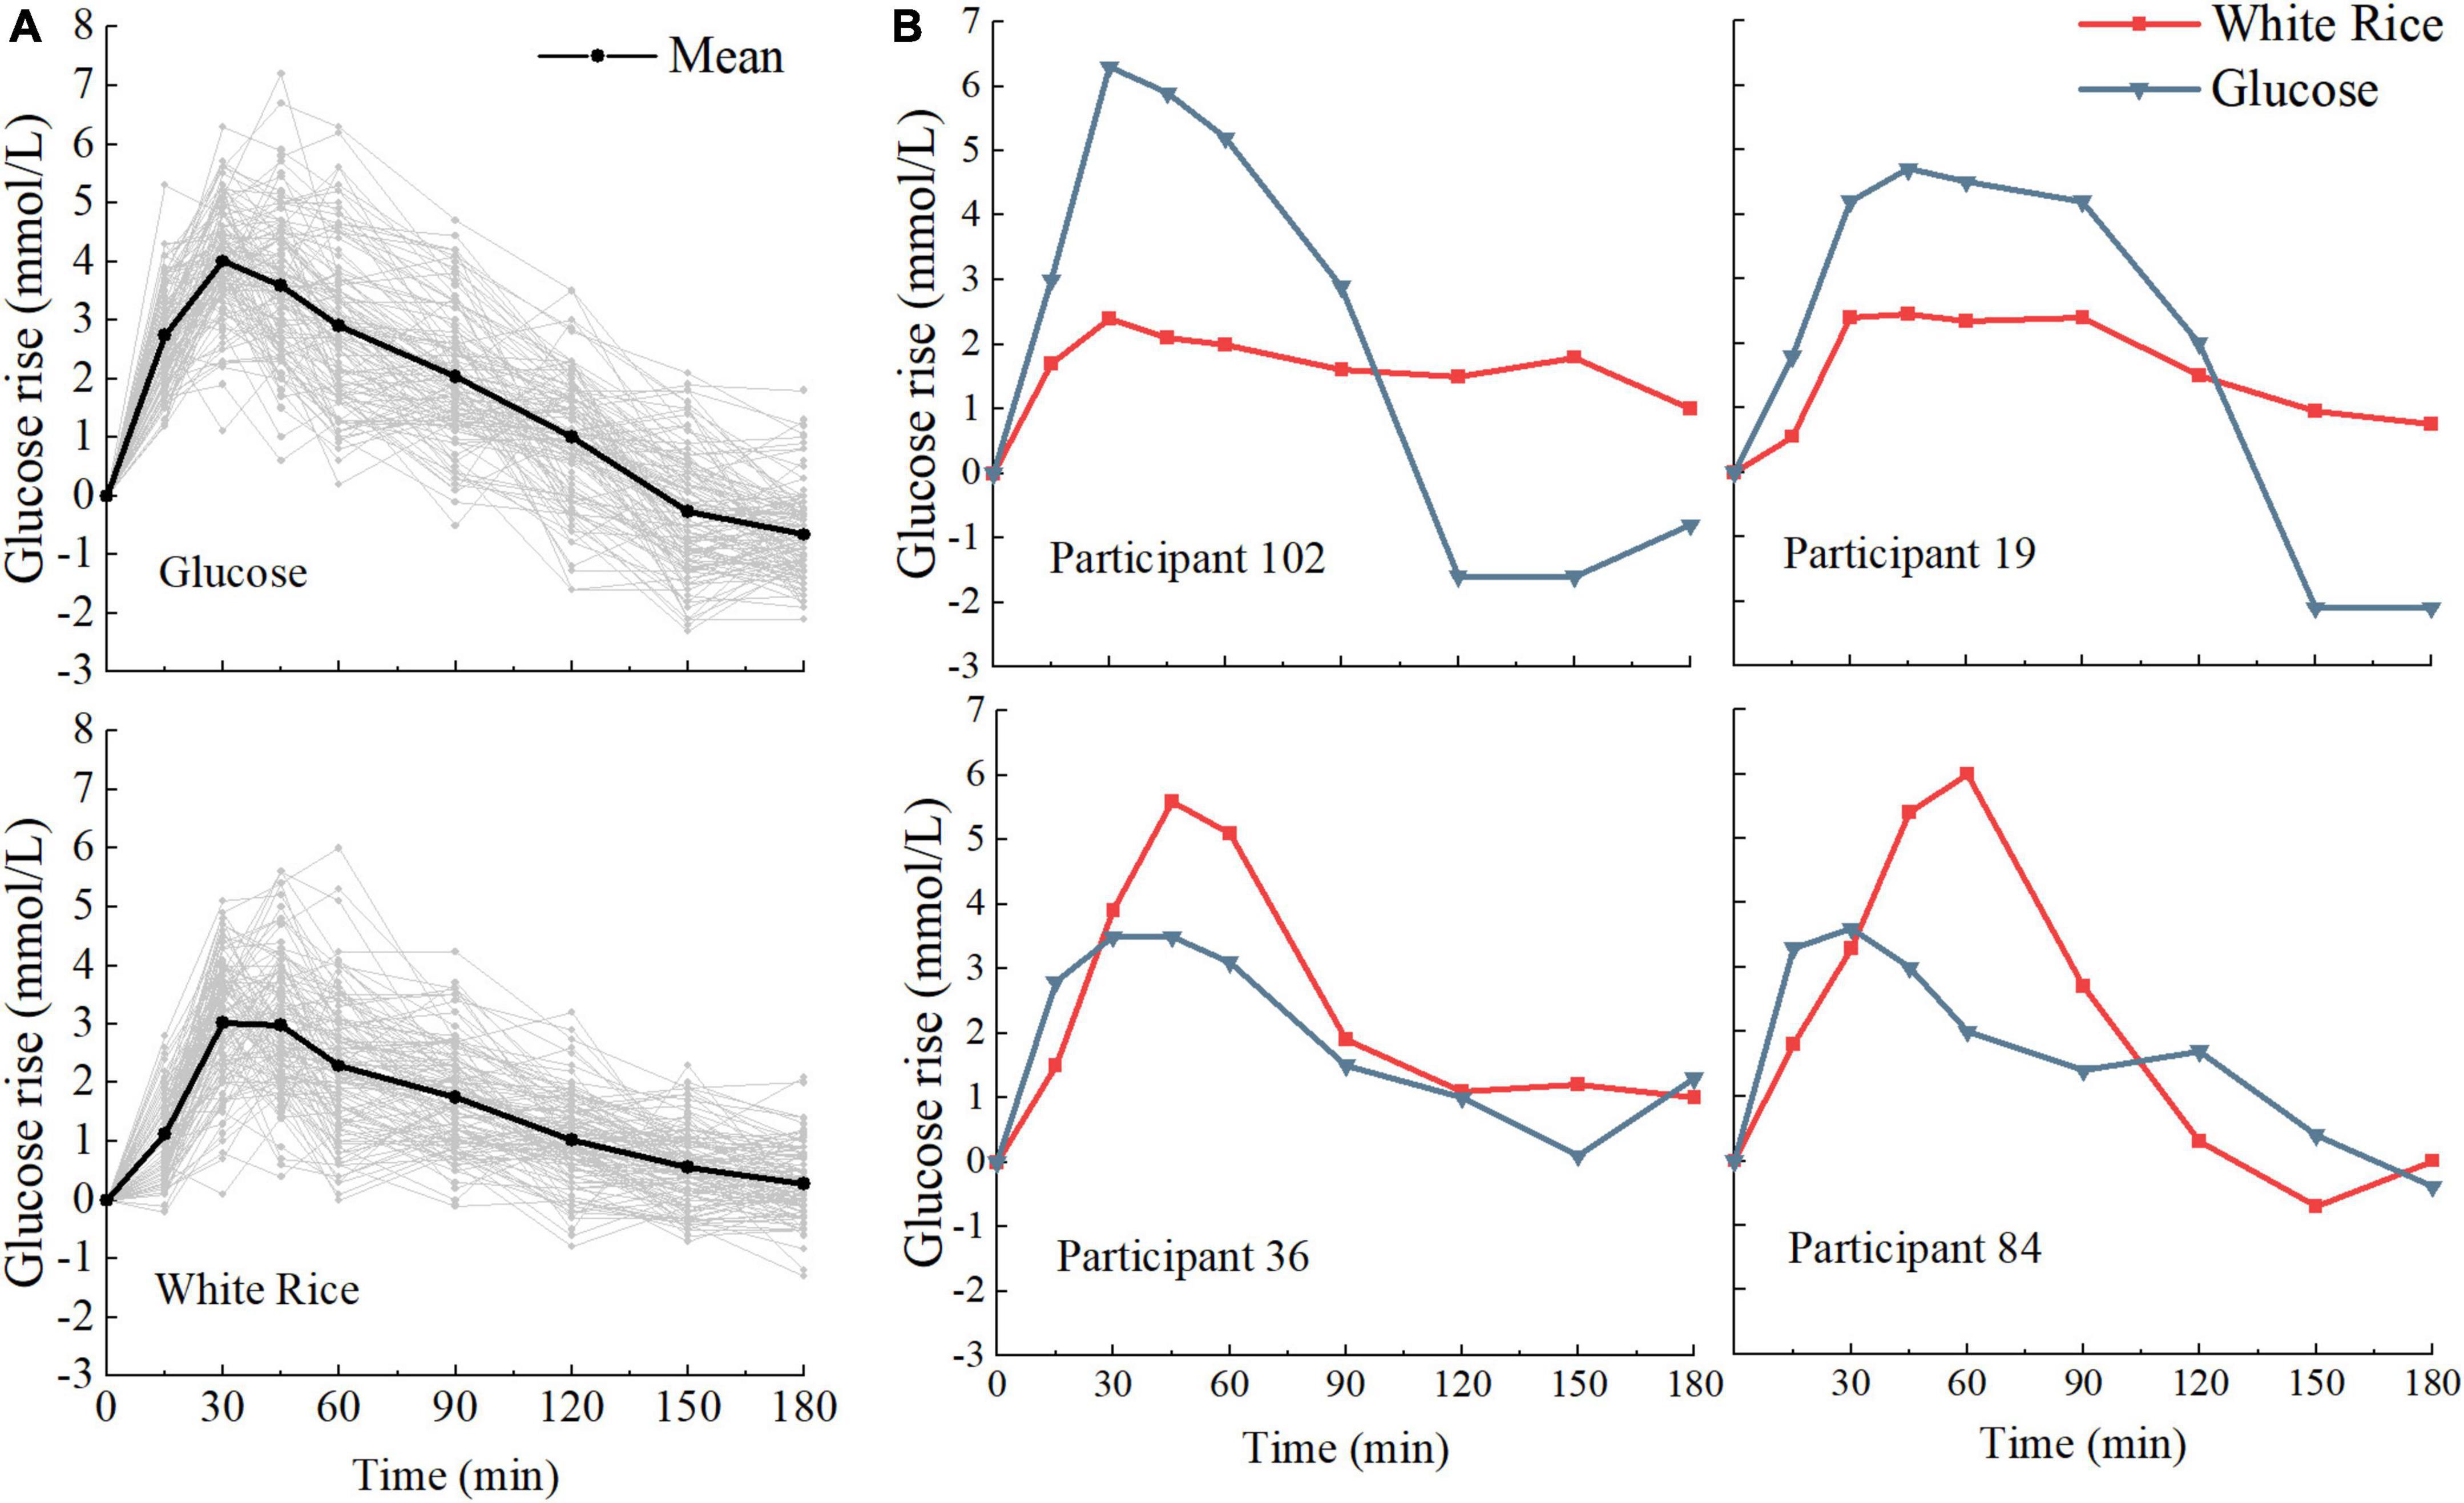
Figure 2. Variation in postprandial responses. (A) Inter-individual variation in glucose postprandial responses to white rice (WR) and glucose (G) (n = 114). (B) Example of the postprandial glycemic response (PGR) to meals for four participants exhibiting opposite PGR patterns.
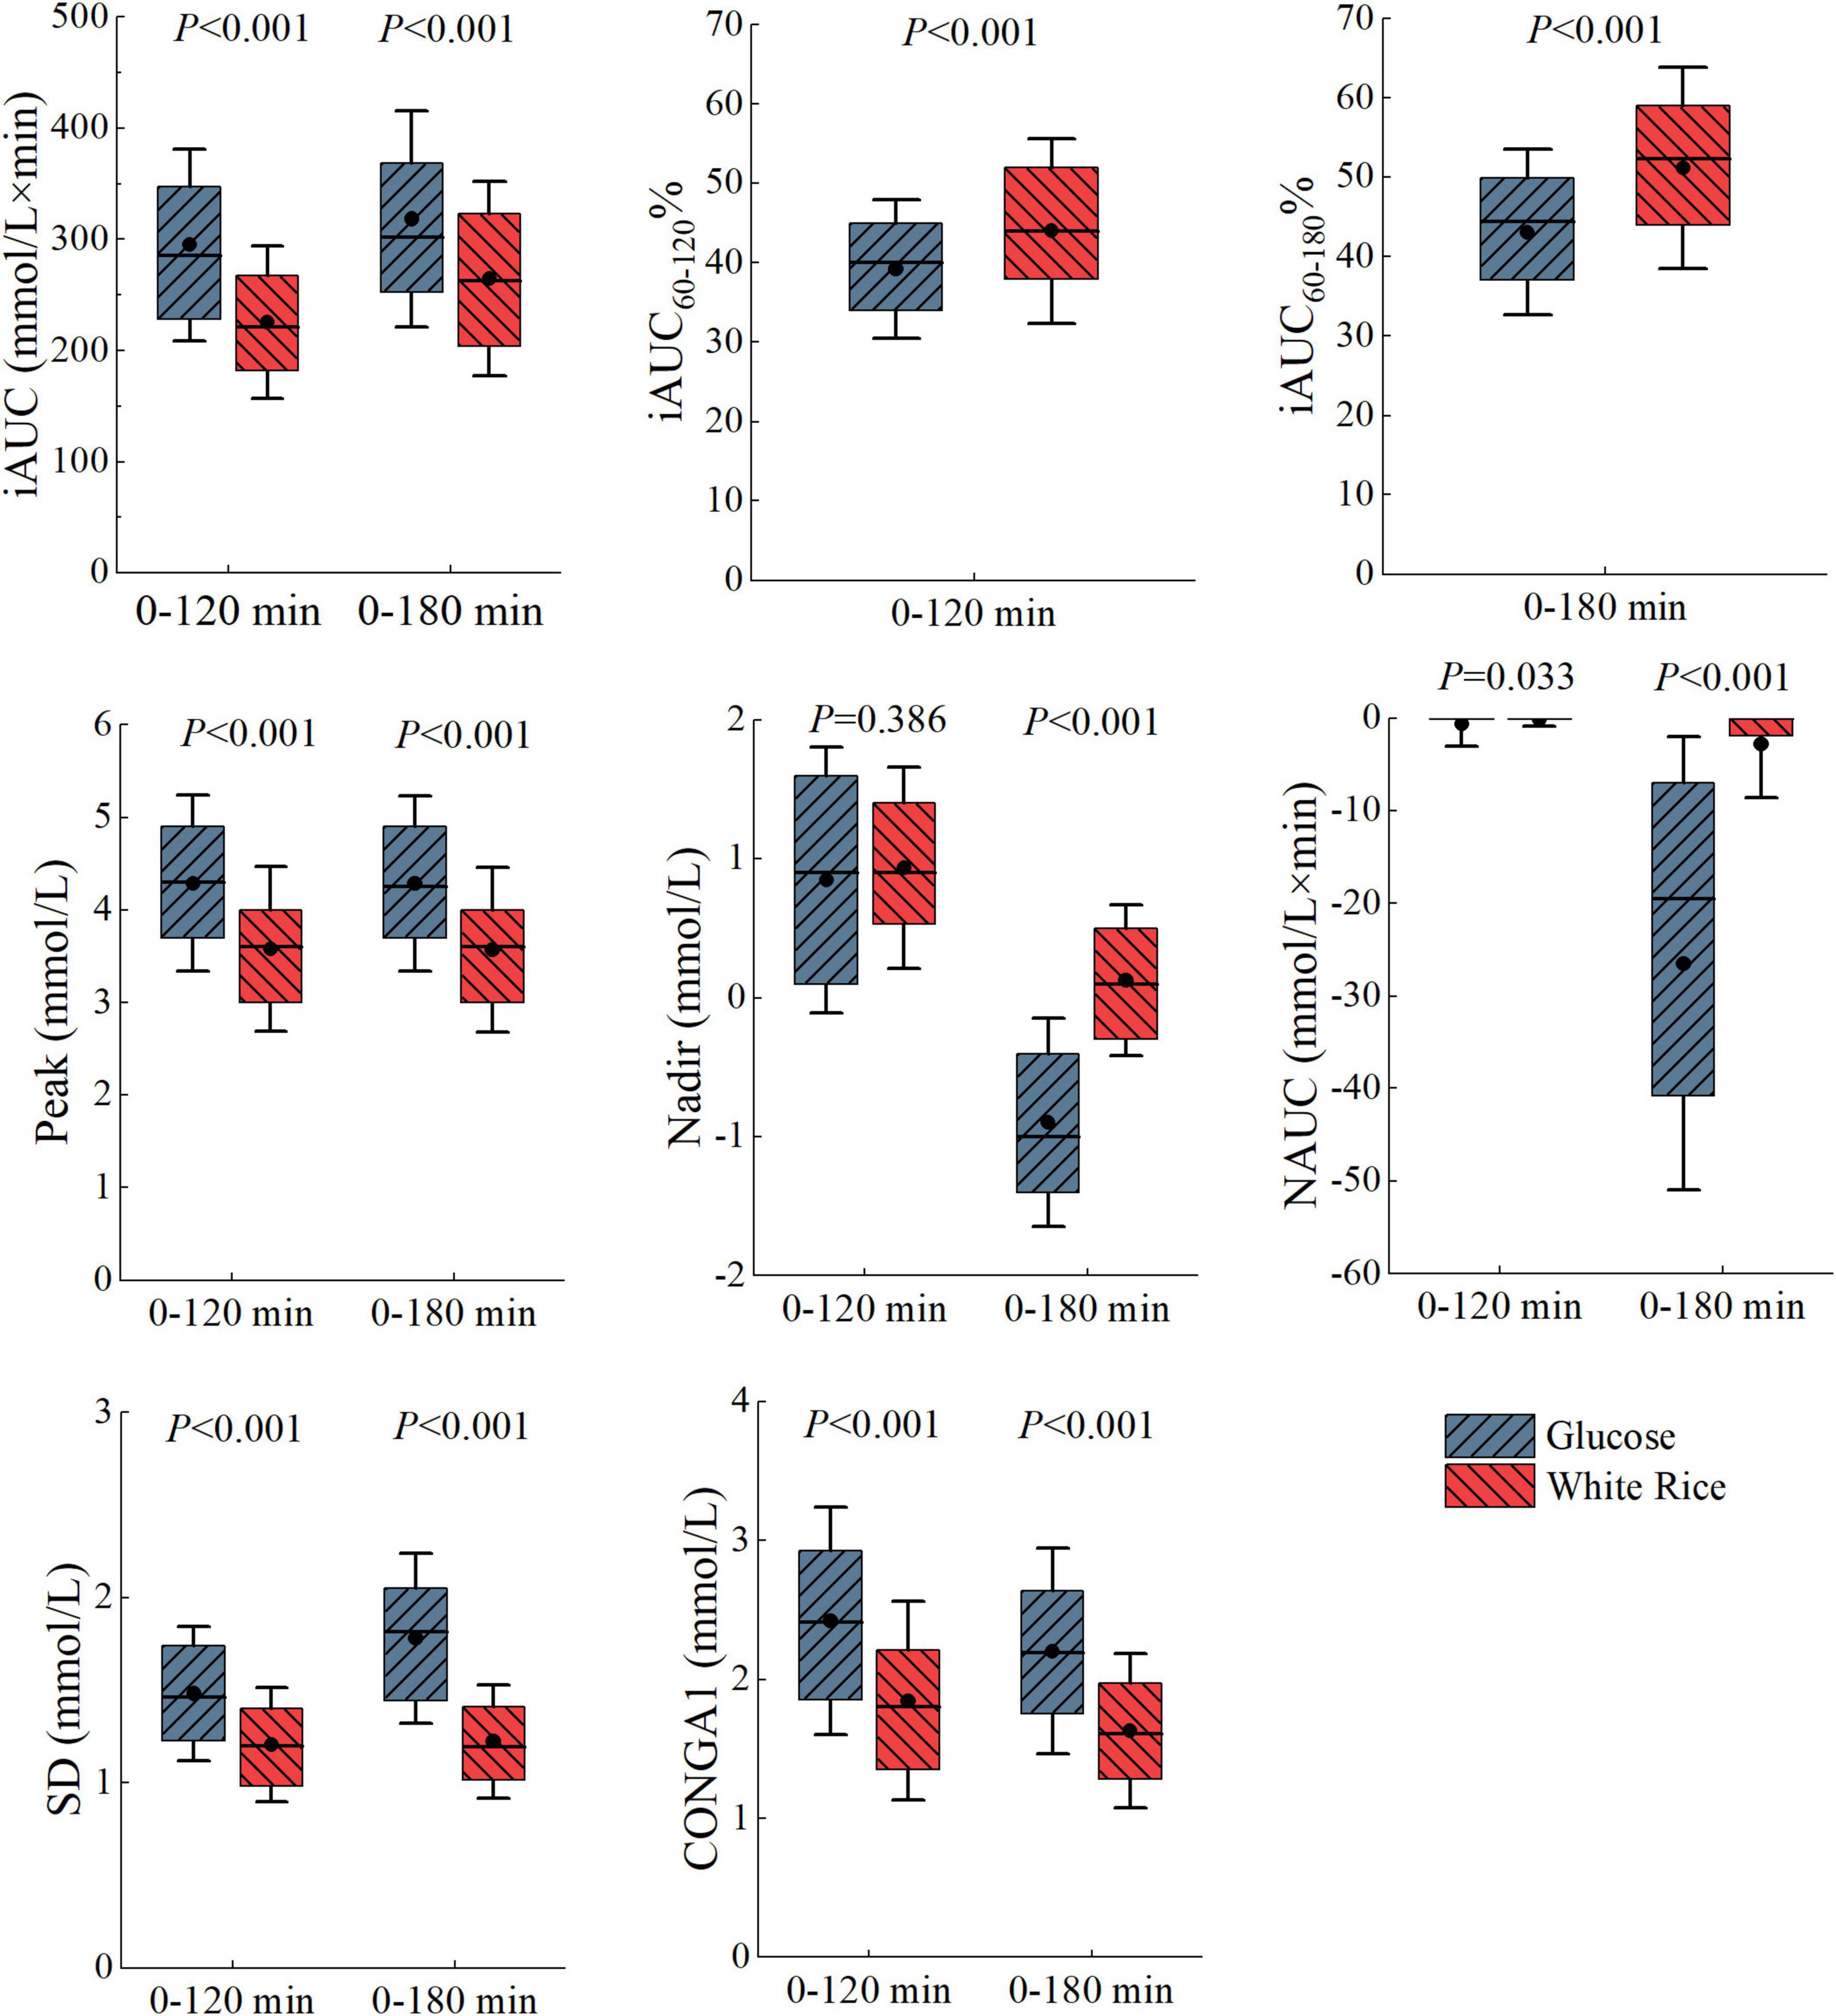
Figure 3. Boxplot of glycemic parameters calculated over 180 and 120 min. The dots indicate the mean, the line indicate the media, top of the box indicate the 75th percentile, bottom of the box indicate the 25th percentile and the error bars indicate the mean ± SD. Statistical significance between white rice (WR) test and glucose (G) test is marked.
Clustering subgroups
When comparing the glycemic parameters of WR and G test, the difference was more distinct in outcomes calculated over 180 min (Figure 3). Hence, the cluster analysis was carried out on parameters over 180 min, which were iAUC60–180%, iAUC180, NAUC180, SD180, Peak180, Nadir180, and CONGA1180.
Glucose subgroups
The clustering carried out on PGRs to glucose divided the participants into four subgroups (G1, G2, G3, G4), and the silhouette coefficient was 0.241. As shown in Figure 4, striking differences appeared in all postprandial time points (P < 0.05). Immediately after the meal, the rate of blood glucose rise was found to be higher in G1, G3, and G4 than G2, particularly in G4. According to the average PGR curves, the time to peak of G1, G2, and G3 was 30 min, while G4 was 45 min. In the wake of a rapid drop of blood glucose level, evident hypoglycemic troughs appeared in G1 and G3 (0 vs. 150, 180 min, P < 0.005). Postprandial blood glucose values of G2 were above the fasting level throughout the test session (0 vs. 180 min, P = 0.843). In G4, only the glucose value at 180 min was lower than the fasting value. No significant difference was found in terms of BMI and fat mass distribution among the four subgroups.
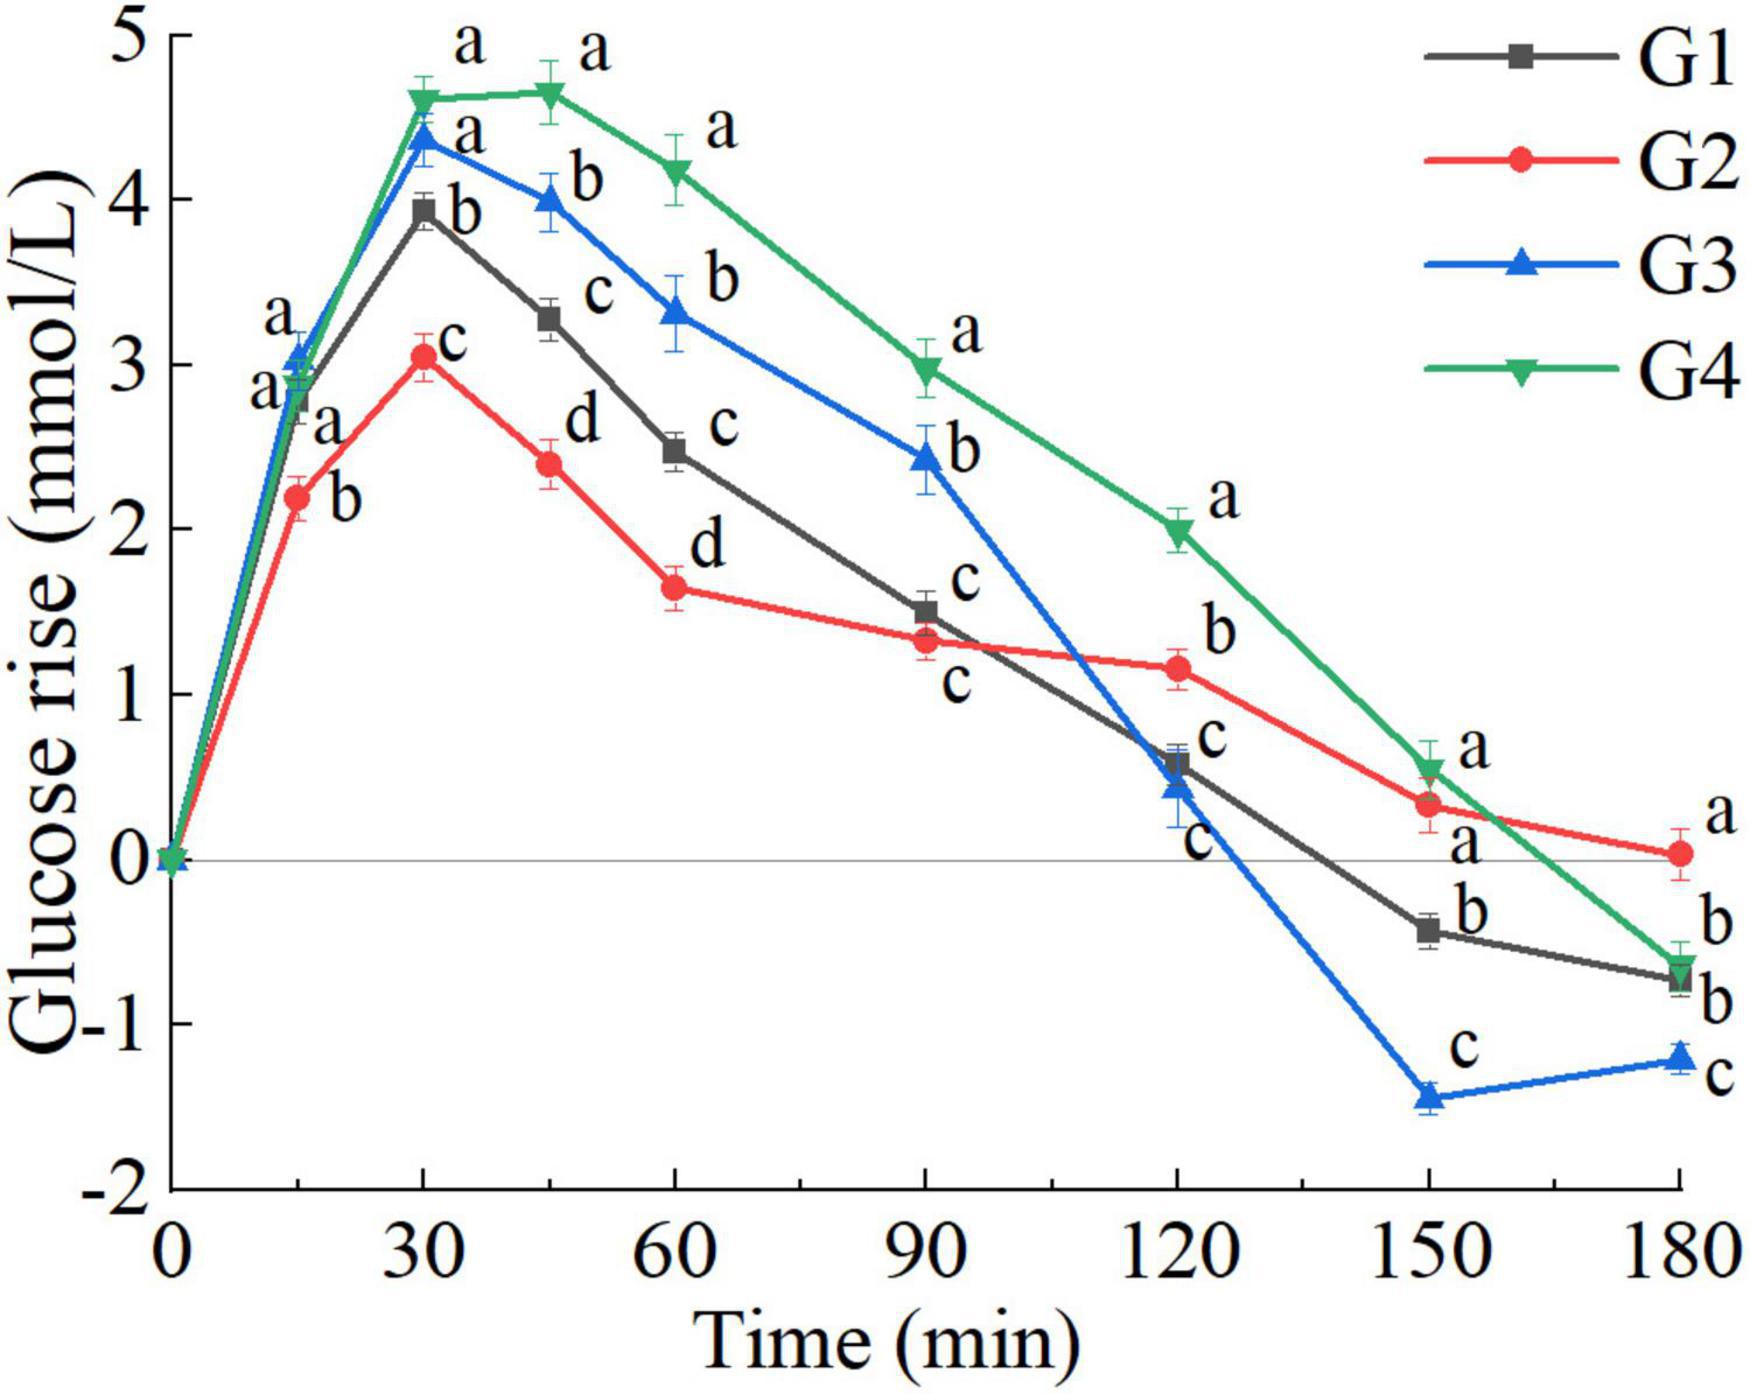
Figure 4. Postprandial glycemic response (PGR) to glucose of G clusters (G1, G2, G3, G4). a, b, c, d, used for comparison between subgroups at that time point (P < 0.05). The error bars indicate the mean ± SE.
Postprandial glycemic response pattern characteristics of glucose clusters
Principal factor analysis of glycemic parameters calculated over 120 min.
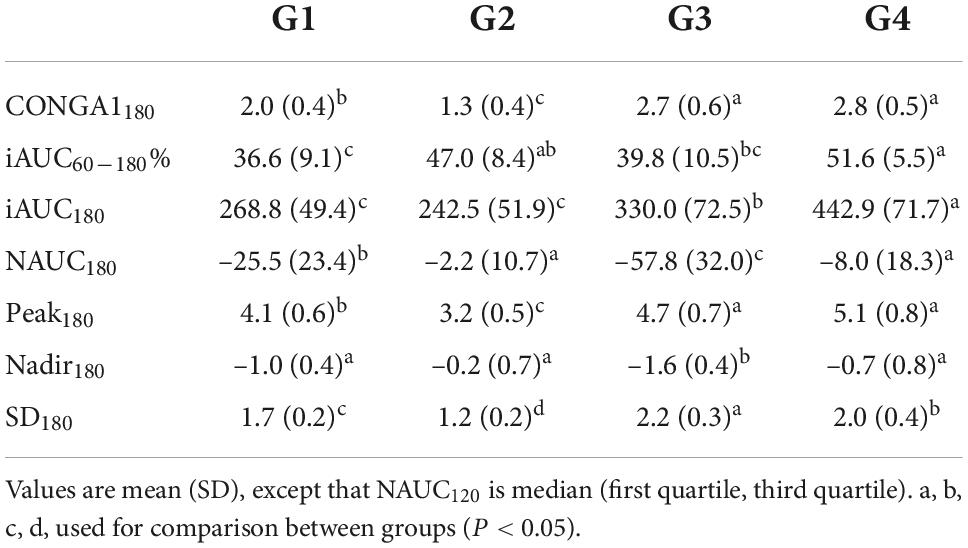
There were differences in all glycemic parameters among the clusters (Table 2). However, univariate analysis was inappropriate because of the correlation between the glycemic parameters. Therefore, PFA was applied to summarize and visualize the responses to all the observed parameters, and further characterize subgroups. This multivariate visualization is complementary to the PGR curve. The examination of the scree plot and eigenvalues suggested that two factors best fit the data. The factors extracted (PC1, PC2) accounted for 82.6% of the variance (Figure 5A). The loadings of iAUC120, SD120, Peak120, and CONGA1120 in PC1 were greater than PC2, suggesting that PC1 score was related to the amplitude of PGR and the glycemic variability. As shown in Figure 5A, the PC1 score was positively correlated with iAUC120, SD120, Peak120, and CONGA1120. The loadings of iAUC60–120%, NAUC120, and Nadir120 in PC2 were greater than PC1, suggesting that PC2 score was related to the rate of glucose decline and the hypoglycemic excursion, while the PC2 score was positively associated with iAUC60–120%, NAUC120, and Nadir120. The G4 and G3 clusters possessed the high amplitude of PGR to G (highest PC1 score). In contrast, G2 cluster was able to sustain a small elevation with lowest PC1 score. However, when comparing the PC2 scores related to the rate of glucose decline and the hypoglycemic fluctuation, no significant difference was found between G1, G2 and G3 clusters (P > 0.05).
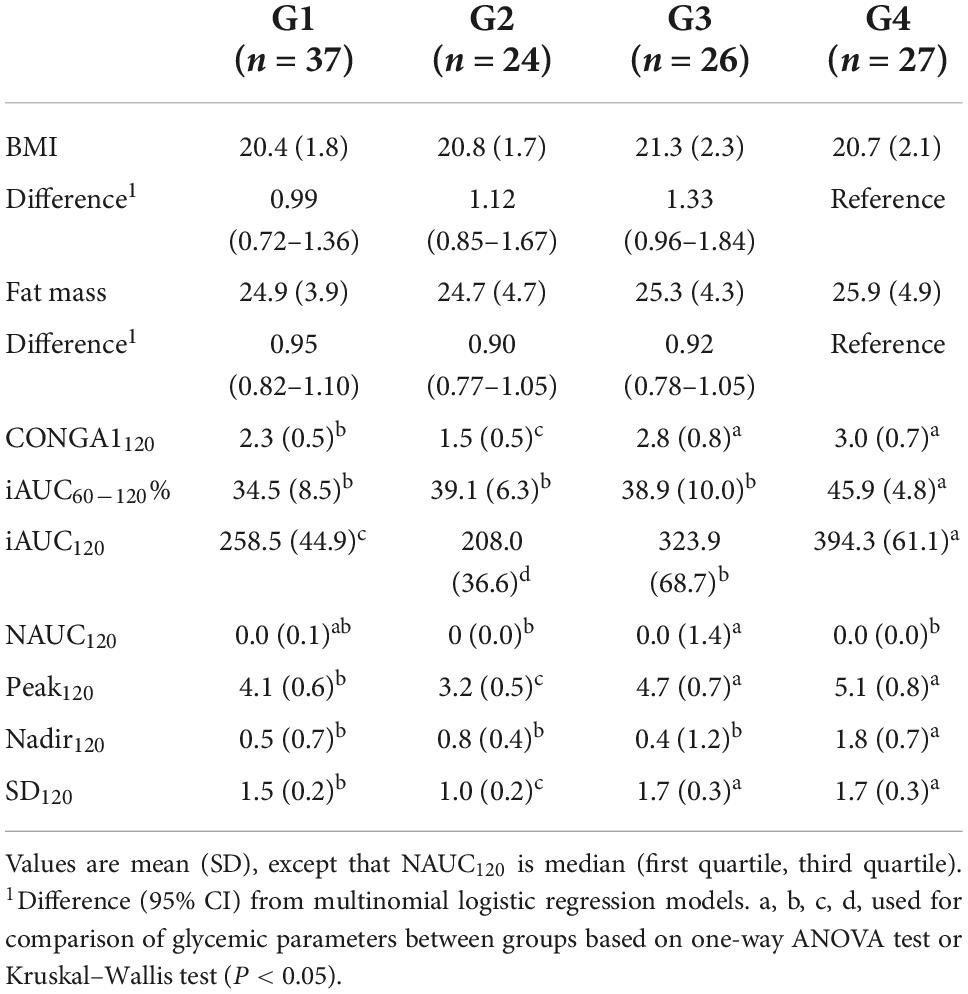
Table 2. Body mass index (BMI), fat mass, and glycemic parameters calculated over 120 min of glucose (G) clusters (n = 114).
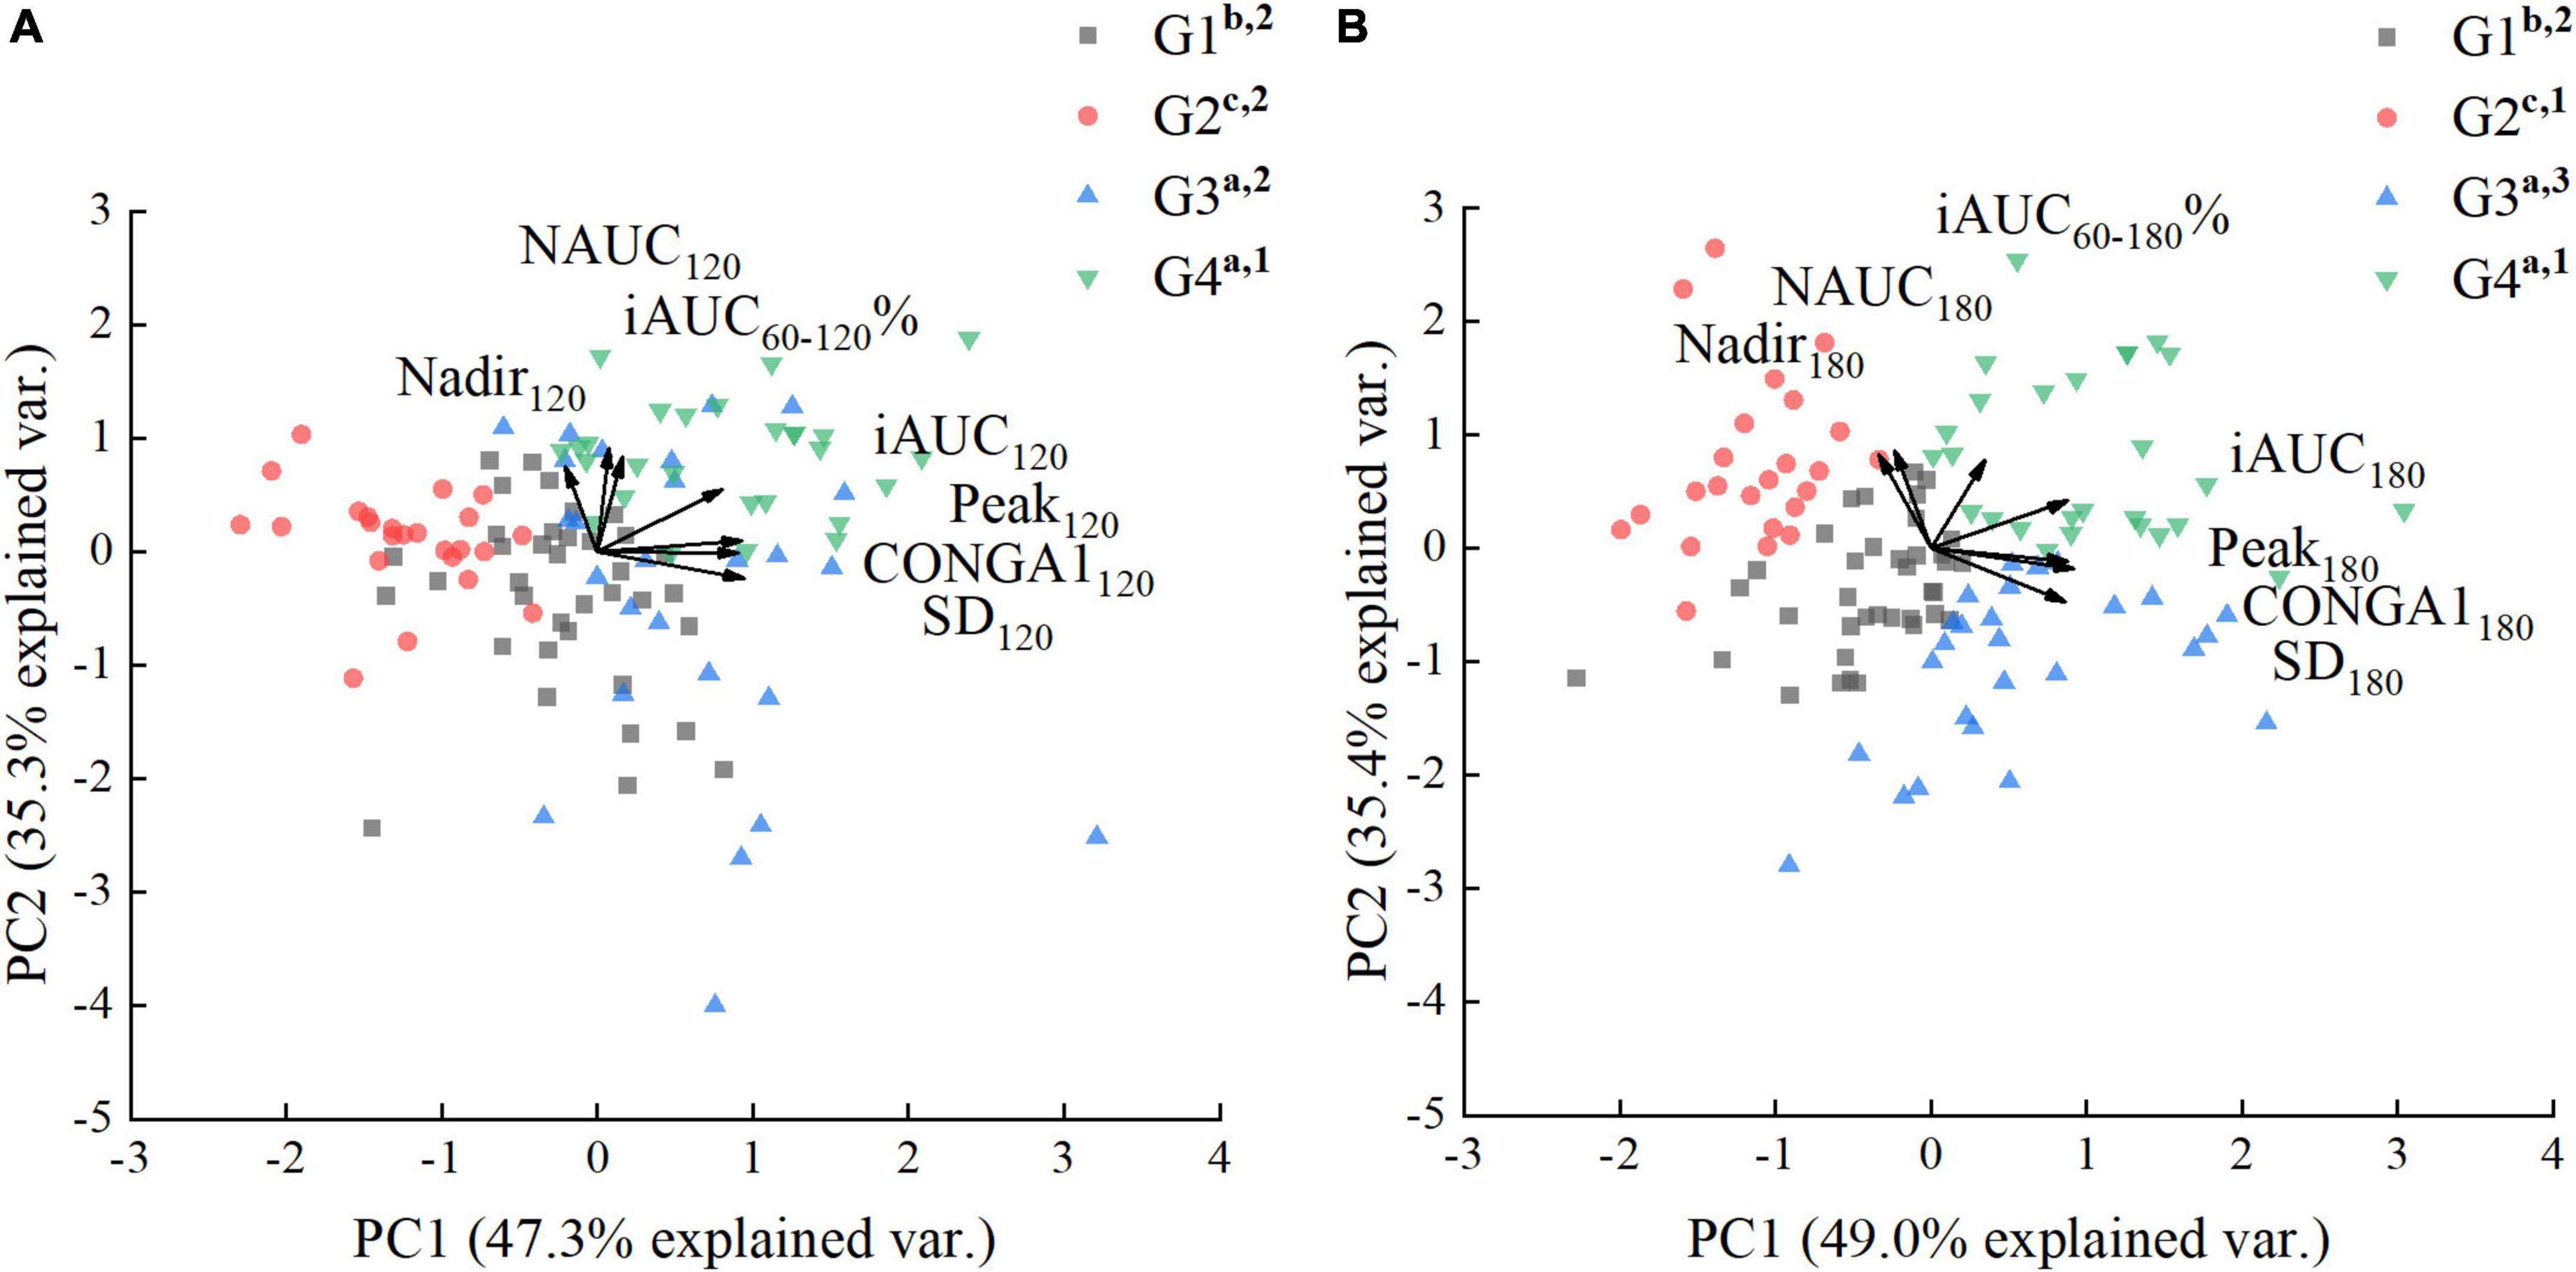
Figure 5. Principal factor analysis loading and score plots of glucose (G) clusters. (A) Principal factor analysis (PFA) based on parameters calculated over 120 min. (B) PFA based on parameters calculated over 180 min. The loadings of the parameters are shown with arrows, and the scores of the participants are shown as dots in the background. a, b, c used for comparison of PC1 scores (P < 0.05). 1–4 used for comparison of PC2 scores (P < 0.05).
Principal factor analysis of glycemic parameters calculated over 180 min.
There was more distinct difference in parameters calculated over 180 min, especially in the NAUC and SD (Table 3). For comparing the parameters calculated over 180 min between G clusters, the PFA was carried on the dataset conducted by iAUC60–180%, iAUC180, NAUC180, SD180, Peak180, Nadir180, and CONGA1180. The factors extracted (PC1, PC2) accounted for 84.4% of the variance (Figure 5B). The PC1 score was positively correlated with iAUC180, SD180, Peak180, and CONGA1180, while the PC2 score was positively associated with iAUC60–180%, NAUC180 and Nadir180. Unlike the PFA based on glycemic parameters calculated over 120 min, G clusters can be separated into four parts in the score plot clearly according to the PFA based on glycemic parameters calculated over 180 min (Figure 5B). Compared with F-Statistic of ANOVA performed on PC2 scores derived from the parameters calculated over 120 min (12.7), greater F-Statistic (46.9) indicated larger between-group variance. The highest glycemic variability observed in G3 clusters was reflected by the highest PC2 score and lowest PC1 score. The G4 cluster possessed not only the high amplitude of PGR to G (highest PC1 score), but also the low rate of blood glucose dropping (highest PC2 score). On the contrary, G2 clusters were capable of sustaining a mild increase and a slow post-peak decline of blood glucose, reflected by the lowest PC1 score and greater PC2 score. The glucose caused a moderately high rise of blood glucose but a wild hypoglycemic fluctuation in G1 clusters indicated by lower PC1 score and PC2 score.
White rice subgroups
The cluster analysis identified four subgroups based on PGRs to white rice (WR1, WR2, WR3, WR4), and the silhouette coefficient was 0.277. As shown in Figure 6, there were significant differences across all postprandial time points except at 15 min (P < 0.05). The white rice caused steeper glucose rise in WR2 and WR4 than WR1 and WR3 in the first 30 min, while the subsequent fall in glucose after 45 min was more rapid in WR1 and WR2 than WR3 and WR4. According to the average PGR curves, the time to peak was 30 min except for WR4, which was 45 min. Compared with the fasting values, both the WR3 and WR4 ended with a higher glucose concentration (0 vs. 180 min, P < 0.01), while the WR2 reverted to the fasting level at 180 min (0 vs. 180 min, P = 0.792). However, the WR1 cluster showed prolonged negative incremental glucose value after 120 min (0 vs. 150, 180 min, P < 0.05). No significant difference was found in terms of BMI and fat mass distribution among the four subgroups.
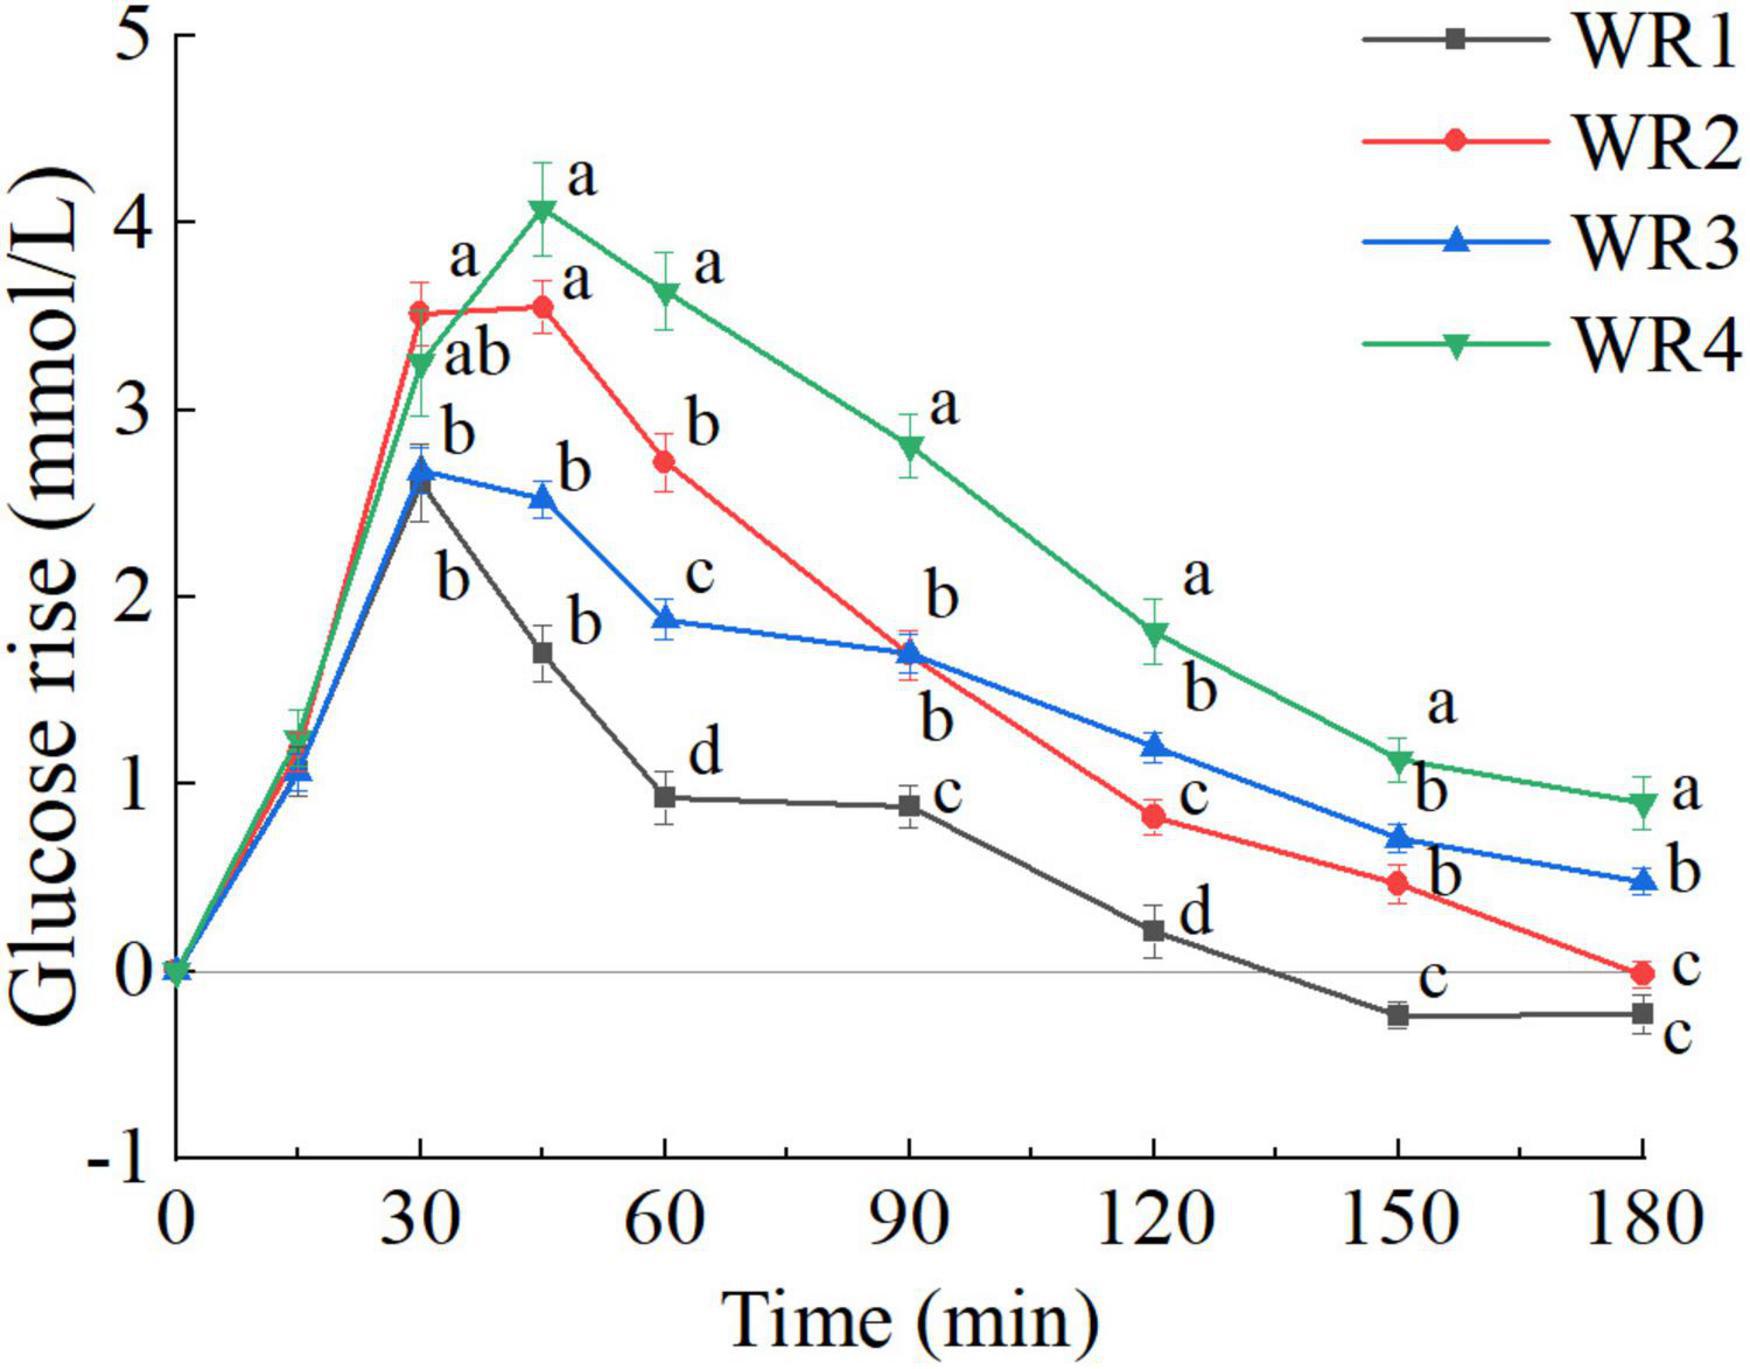
Figure 6. Postprandial glycemic response (PGR) to white rice of white rice (WR) clusters (WR1, WR2, WR3, WR4). a, b, c, d, used for comparison between subgroups at that time point (P < 0.05). The error bars indicate the mean ± SE.
Postprandial glycemic response pattern characteristics of white rice clusters
Principal factor analysis of glycemic parameters calculated over 120 min.
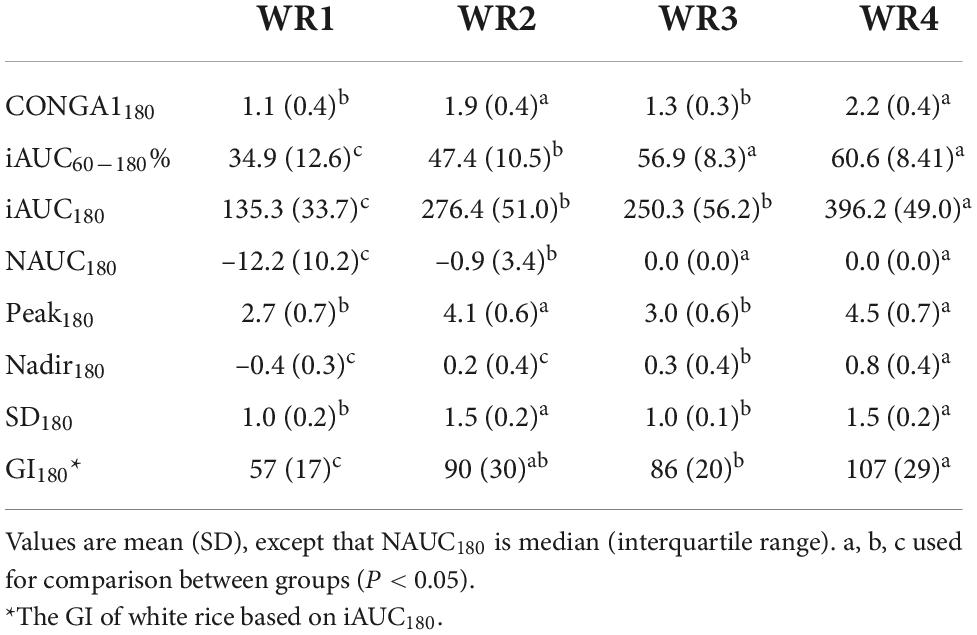
There were differences in all glycemic parameters among the clusters (Table 4). The factors extracted (PC1, PC2) accounted for 79.1% of the variance (Figure 7A). The PC1 score was positively correlated with iAUC120, SD120, PEAK120, and CONGA1120, while the PC2 score was positively associated with iAUC60–120%, NAUC120, and LOW120. WR2 clusters displayed the most oscillating glucose levels, characterized by high PC1 score and relatively low PC2 score. WR4 clusters showed constant hyperglycemia with higher PC1 and PC2 score. However, when comparing the rate of glucose decline and the hypoglycemic fluctuation (PC2 scores), no significant difference was found between WR3 and WR4 clusters (P > 0.05). What’s more, there was no significant difference in GI120 between WR2, WR3, and WR4 (Table 4).
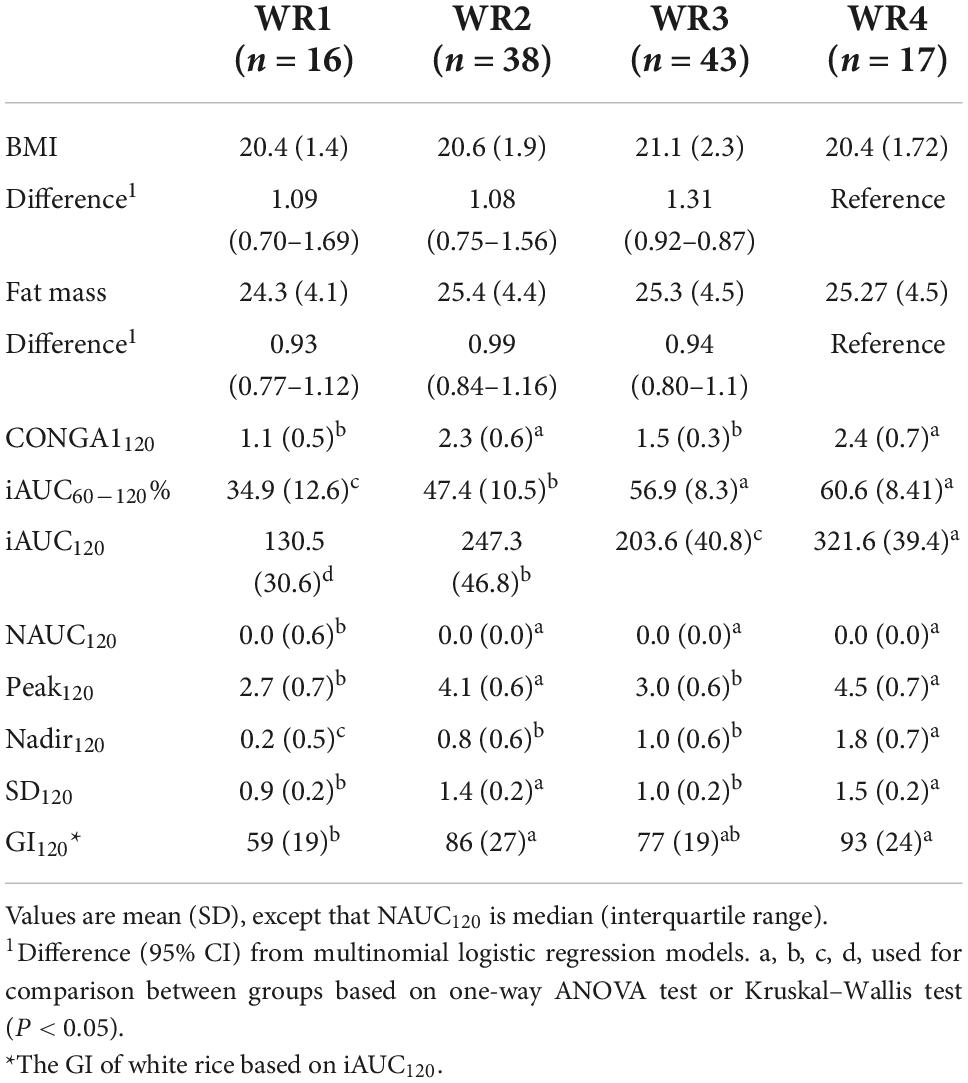
Table 4. Body mass index (BMI), fat mass, and glycemic parameters calculated over 120 min of white rice (WR) clusters (n = 114).
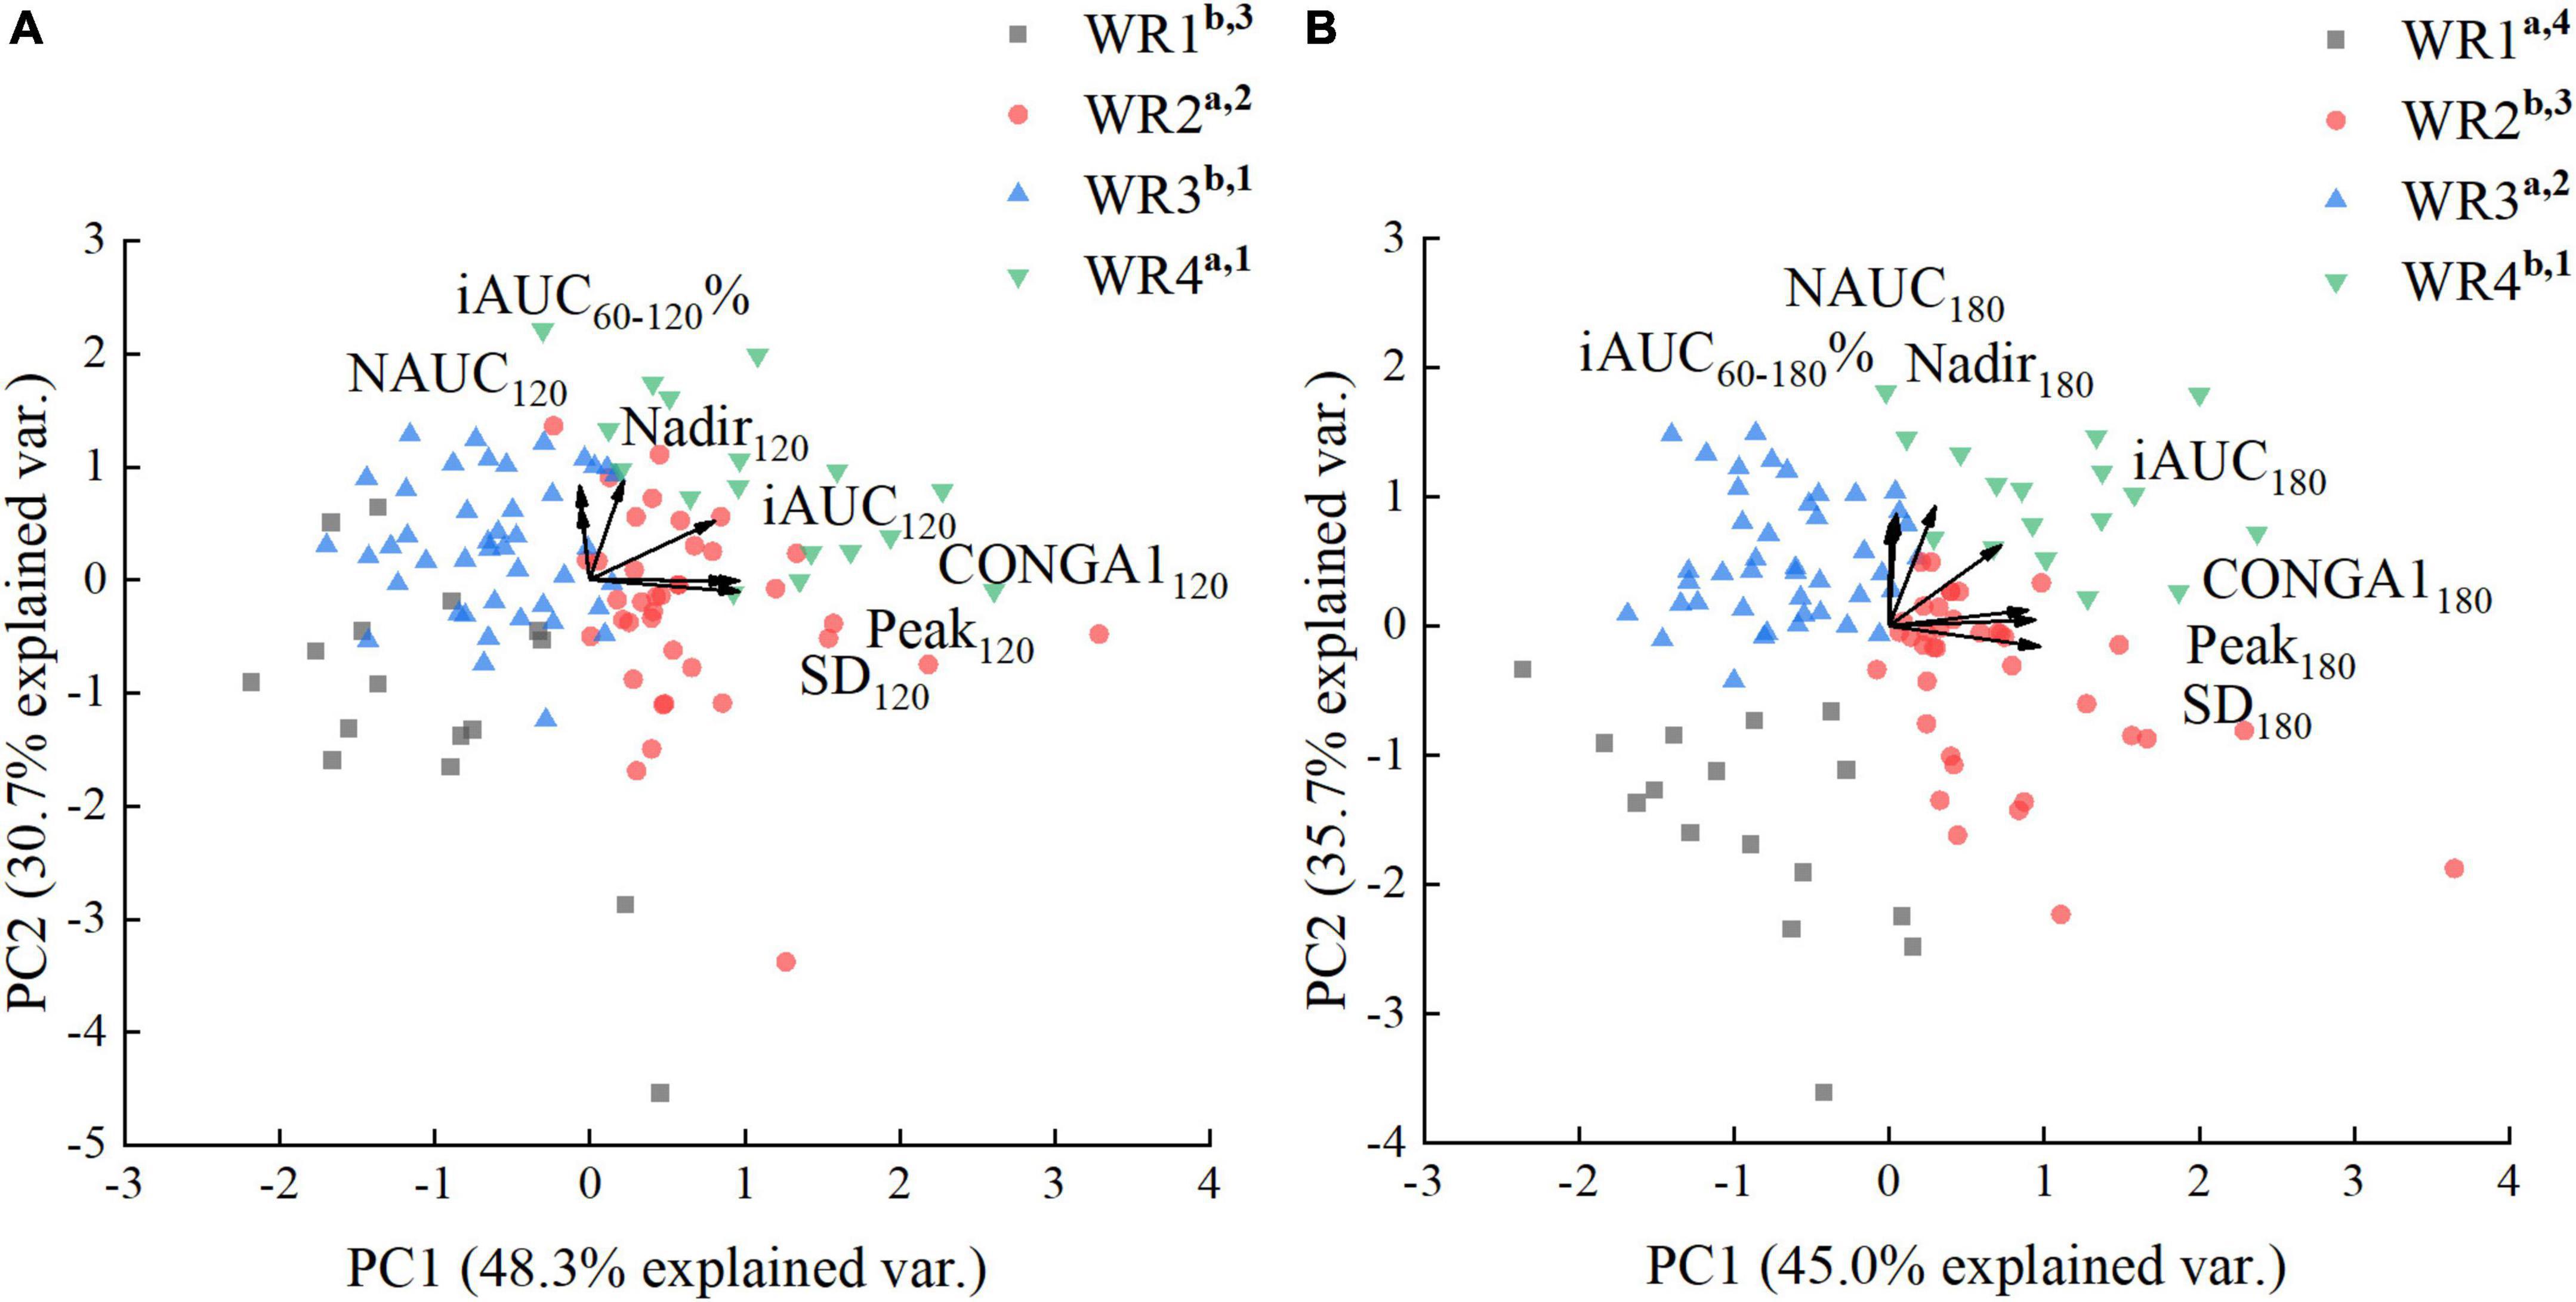
Figure 7. Principal factor analysis loading and score plots of white rice (WR) clusters. (A) Principal factor analysis (PFA) based on parameters calculated over 120 min. (B) PFA based on parameters calculated over 180 min. The loadings of the parameters are shown with arrows, and the scores of the participants are shown as dots in the background. a, b, c used for comparison of PC1 scores (P < 0.05). 1–4, used for comparison of PC2 scores (P < 0.05).
Principal factor analysis of glycemic parameters calculated over 180 min.
The factors extracted (PC1, PC2) accounted for 80.7% of the variance (Figure 7B). The PC1 score was positively correlated with iAUC180, SD180, Peak180, and CONGA1180, while the PC2 score was positively associated with iAUC60–180%, NAUC180, and Nadir180. As shown in Figure 7B, WR clusters can be separated into four parts in the score plot distinctly. Moreover, the F-Statistic of ANOVA performed on PC2 scores was 63.5, which was greater than the F-Statistic of ANOVA performed on PC2 scores derived from the parameters calculated over 120 min (19.3), indicating larger between-group variance. The WR1 clusters experienced more hypoglycemia with the lowest PC2 score and greatest NAUC180, while the GI180 based on WR1 clusters was the lowest. WR3 clusters had lower PC1 score and less postprandial glucose dips (higher PC2 score), indicating a stable PGR to WR. Compared with the GI180 calculated based on the WR1 and WR3 clusters, the mean value and the SD of GI180 derived from the WR2 and WR4 were significantly higher (Table 5).
Simple correspondence analysis performed on clustering categories of white rice and glucose
The results of the Pearson’s chi-square test and Monte Carlo’s exact test revealed the significant dependence between the clustering categories of WR and G (P < 0.001, Cramer’s V = 0.304). Thus, SCA is applied to determine the relationships between categories of specified variables. The most important output of the analysis is a correspondence map (Figure 8A), which clearly shows the categories of analyzed variables, their mutual similarity and differences, or associations with categories of other variables. The closer two points located in the correspondence map, and the farther away the points deviated from the origin, the stronger the mutual dependence of the categories were.
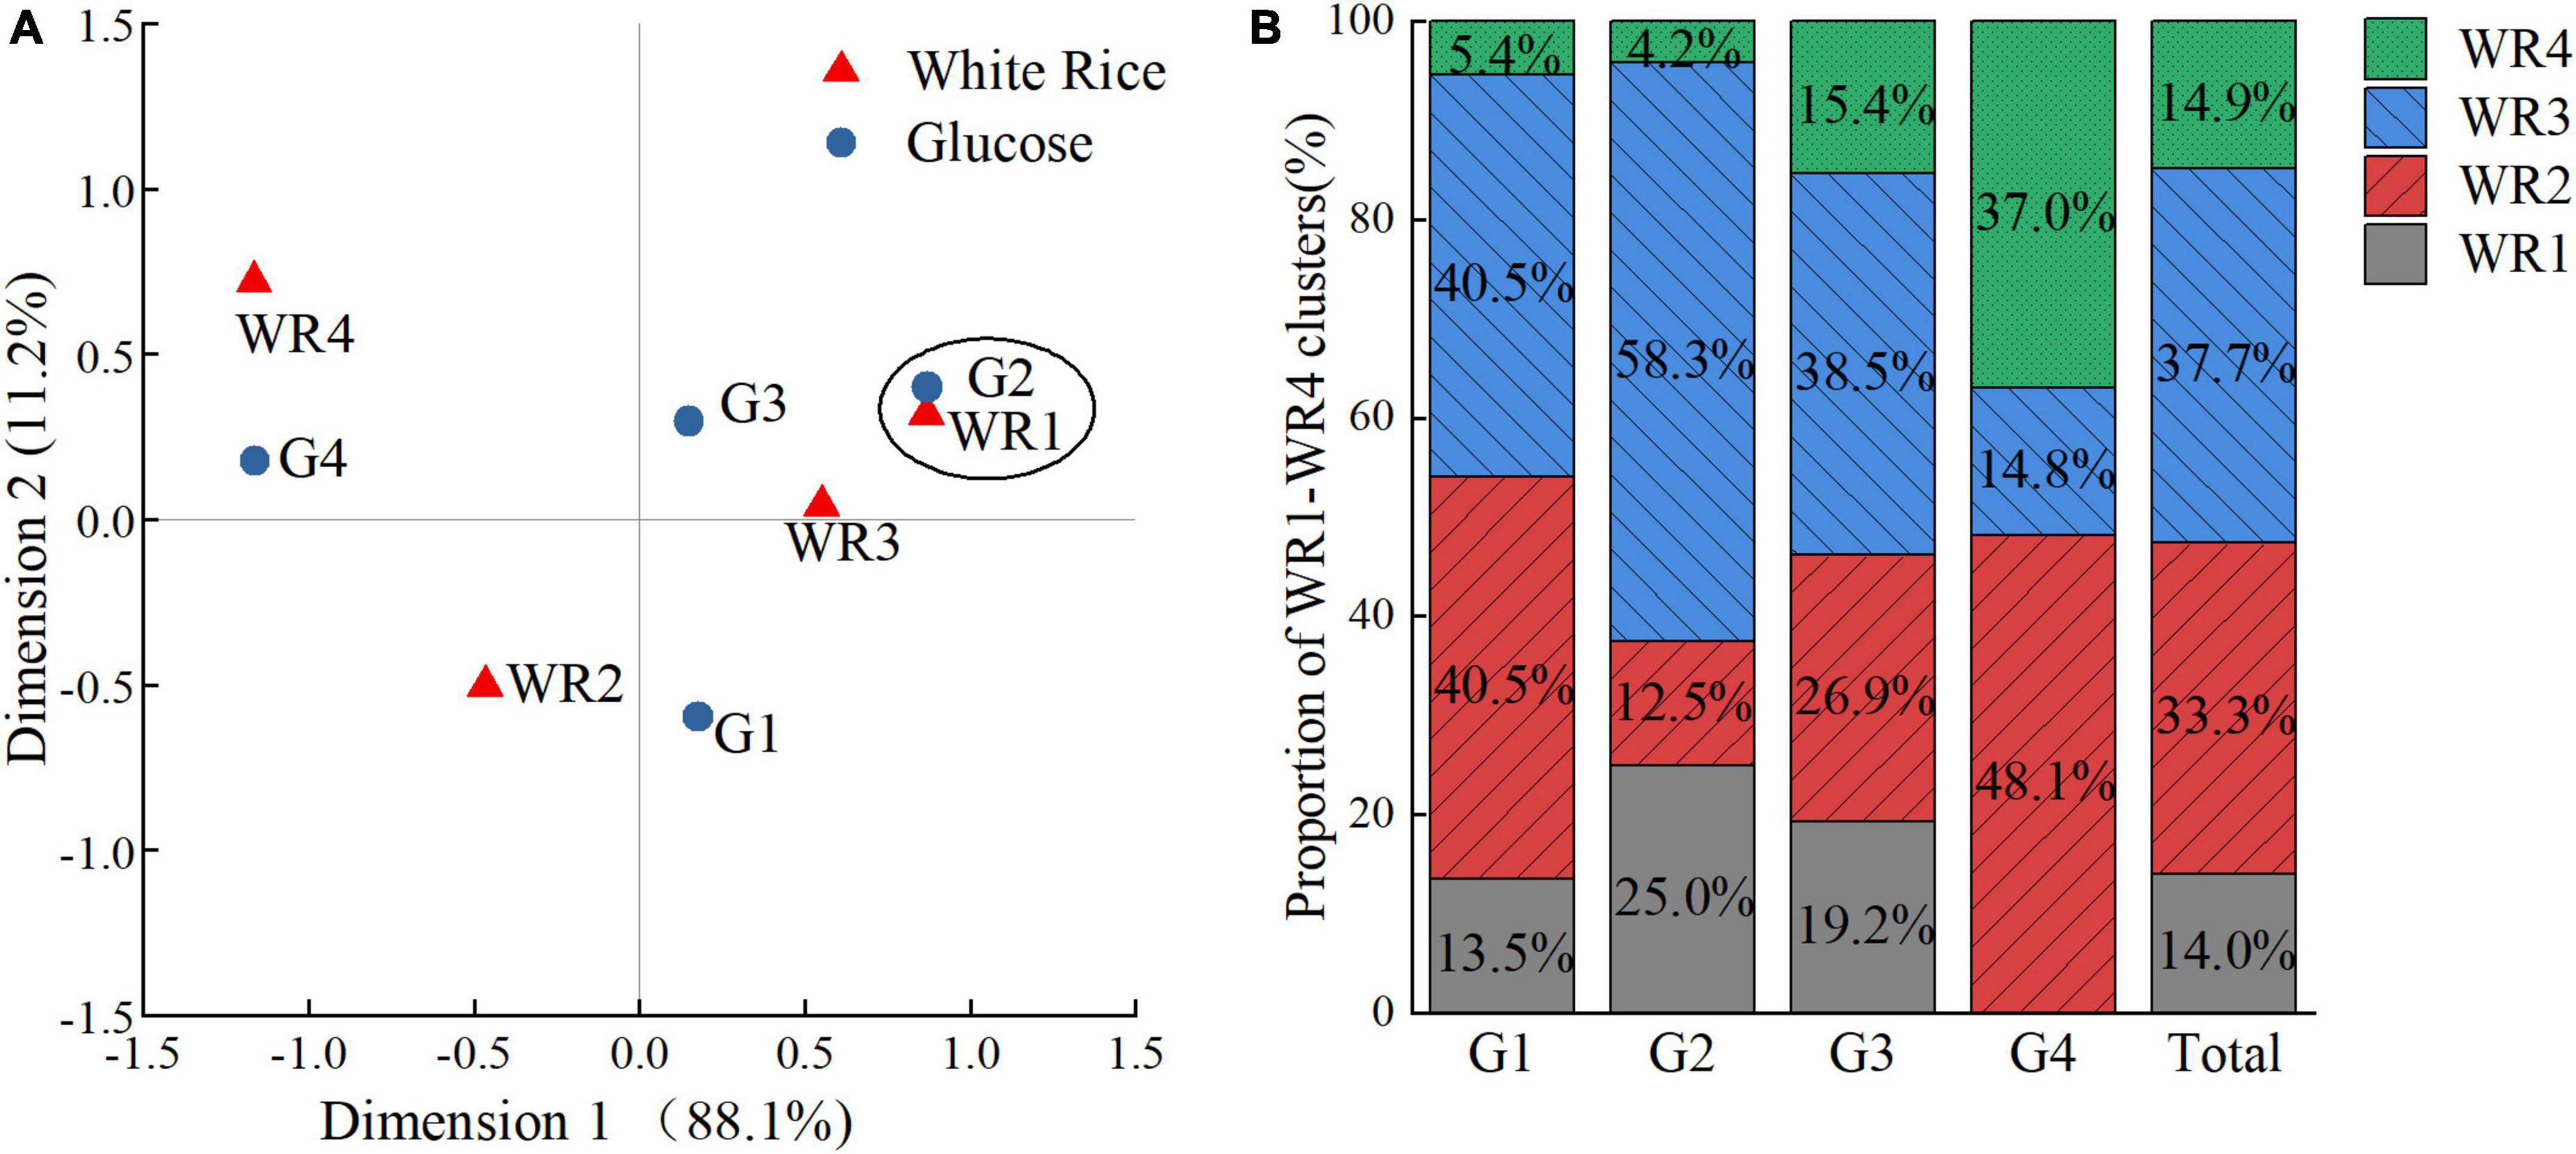
Figure 8. The relationships between clustering categories of white rice (WR)and glucose (G). (A) Individual correspondence maps between clustering categories of WR and G. (B) The proportions of WR1–WR4 clusters in G1–G4 clusters and the entire subjects.
As shown in Figure 8A, significant dependence was found between the clustering categories of WR1 and G2 sustaining a mild rise of blood glucose after the ingestion. Moderate dependence was found between the clustering categories of WR3 and G2, both characterized by less hyperglycemic and hypoglycemic fluctuation. In contrast, the percentage of WR2 clusters or WR4 clusters to G4 group was much larger than average either (Figure 8B), while WR2 and WR4 clusters were comparable in terms of large amplitudes of PGR but significantly different in terms of postprandial glucose dips.
As shown in Figure 8B, the share of WR2 and WR3 clusters took dominance in the G1 group, while the WR2 and WR3 clusters possessed the opposite PGR patterns to WR. In G3 group, which had the greatest glycemic excursion, the shares of the four WR subgroups were relatively balanced, while the proportion of WR1 or WR3 clusters was measurably larger than average.
Discussion
The data of the current study showed that PGRs to the same food were highly variable across individuals even in healthy subjects of the same gender and ethnic group, similar age. Cluster analysis revealed that the subjects could be classified into distinct subgroups according to their PGR patterns to glucose and white rice. The results indicated that extending the glucose tolerance test to 180 min would be helpful to detect the possible hypoglycemic troughs after 120 min characterized in some subgroups.
In order to capture the information inherent in the PGR pattern, we used diverse parameters derived from the PGR curve. Not only those represented the elevation of blood glucose (Peak and iAUC), but also those related to the rate of post-peak decline (iAUC60–120% and iAUC60–180%), the hypoglycemia (NAUC and Nadir) and the glycemic variability (SD and CONGA) were included.
The study demonstrated that the rate of glucose decline and the NAUC could be regarded as an important aspect when differentiating the responders’ PGR patterns. The hypoglycemic variability, characterized by the rapid decline in blood glucose and a nadir below the baseline, was one of the deleterious effects of vacillating glucose levels. In the diabetic, frequent severe hypoglycemia was associated with increased risks of cardiovascular events (30), brain damage (31), retinopathy (32), and death (33). In non-diabetic persons, severe hypoglycemia after OGTT indicates the susceptibility to metabolic disorders (34). Postprandial glycemic dip in healthy subjects is also found to be able to predict appetite and energy intake (35). What’ more, there is evidence that the hyperglycemia after recovery from hypoglycemia leads to worsened endothelial function, increased oxidative stress and inflammation in both healthy individuals and the diabetic (36). Given that the most hypoglycemic values appeared after 120 min, the classification of blood glucose patterns based on 180 min blood glucose data is relevant for the management of individual PGR and contribute to the precision nutrition.
Oral glucose tolerance test is used to detect the status of glucose tolerance based on the fasting plasma glucose and 2 or 3-h plasma glucose after meal. Previous study suggested that the analysis of PGR patterns during OGTT might help to extract metabolic information and identify risks of diseases. Using the latent class trajectory analysis, Hulman et al. identified different glucose response patterns based on the shape of blood glucose curves and found that it was the PGR patterns, rather than the fasting plasma glucose and 2-h plasma glucose, that were remarkably associated with the risk of future diabetes and all-cause mortality (7, 12, 37). Froslie et al. (11) applied a functional principal component analysis to OGTT data and identified the typical temporal morphology that associated with high risk of gestational diabetes later in pregnancy. Similar to the previous studies, by cluster analysis and PFA, we observed four representative PGR patterns to glucose, i.e., the monophasic type (G1), the smooth type (G2), the biphasic oscillating type (G3), and the hyperglycemia type (G4).
In normoglycemic insulin sensitive individuals, after digestion of a bolus dosage of glucose, the blood glucose concentration increase initiates the pancreatic β-cells to secrete insulin with a biphasic pattern, results in a quick first-phase peak and a slowly rising second phase (38). The rise in blood glucose and insulin concentrations suppress the endogenous glucose production promptly, and then stimulate the uptake of glucose from peripheral tissues gradually (39). If the blood glucose level is too low, the glucagon secretion will induce the endogenous glucose production to restore the glucose homeostasis.
The equilibrium of the glucose-insulin (G-I) dynamic is reflected by an early and low peak (12), a steep slope of the decrease (6), and the nadir around the fasting level of PGR curve (40), while the G-I-related dysregulations will affect the PGR patterns in turn. We would speculate that the late and high glucose peak, a slow post-peak decline of blood glucose in G4 indicated the risk of hepatic and peripheral insulin resistance (41, 42), a weak first phase insulin secretion (43), and the lack of compensatory second phase insulin secretion (44). The coexisted high peak, rapid post-peak decline, and hypoglycemic trough in G3 implied an exaggerated second phase insulin secretion (45, 46) compensating for the inadequate first insulin secretion (47, 48) and impaired hepatic insulin sensitivity (39).
A number of studies demonstrated that genetic risk (49, 50), demographic and lifestyle factors (12) contribute to the variation of PGR pattern as deeper reasons. In addition, the rate of gastric emptying (51) and glucose absorption (52) as well as the release of incretin hormones (41, 53) may influence G-I control system and further affect the shape of the PGR curve. Hence, better understanding of glycemic patterns to glucose might allow more comprehensive assessment of the metabolic status and help to identify high-risk individuals by a simple OGTT test.
In line with the previous studies that examined individual PGRs (54, 55), we found great individual variability in PGR to glucose and rice even among the relatively homogenous subjects with similar baseline glucose value. Some research suggested that a person’s glycemic response is the result of glucose scaling to the individual (54). However, we found that the PGR pattern of glucose did not correspond to the PGR pattern of white rice exactly. The white rice elicited four distinct PGR patterns, which were the hypoglycemia type (WR1), the smooth type (WR3), the oscillating type (WR2), and the hyperglycemia type (WR4). For those who showed prolonged hyperglycemia in the glucose test (G4), merely 14.8% of them in fact had a stable glycemic response to white rice (WR3). Among those who had the best glycemic stability in glucose test (G2), only 16.7% of them were characterized by hyperglycemia after rice ingestion (WR2 and WR4). However, in the largest G subgroup (G1), and the cluster with the greatest glycemic variability (G3), the heterogeneous PGR patterns to rice made it almost impossible to predict a subject’s real PGR pattern to rice meal by OGTT.
Considering the good homogeneity of subjects, we postulate that the discrepancy between the individual PGR patterns of G and WR can be explained by the disparate digestive process of rice and glucose. Factors including salivary α-amylase activity (56), chewing patterns (57, 58), gastric emptying (51), pancreatic α-amylase activity and the impact of the food texture properties (59), and non-carbohydrate nutrients (60) might make differences to the bioavailability of carbohydrate food, the rate of gastrointestinal glucose diffusion and absorption, as well as the secretion of incretin hormones and insulin (61, 62).
In the present study, we found that a moderate proportion of the subjects, who showed great glycemic variability during G test, achieved relatively mild PGR in WR test. If they consume mixed meals consist of rice, green vegetable and protein food, they will be likely to be able to keep the PGR and the HbA1c at bay (63). Hence, in regions taking white rice as the major carbohydrate food, a combination of the OGTT, HbA1c and a white rice tolerance test may be instrumental for individualized glycemic management (64). What’s more, growing body of research have shown that the meal tolerance test could provide reliable estimation of beta-cell function and insulin resistance (65–68). Compared with other carbohydrate reference food for the meal tolerance test, the white rice meal has the advantages of good availability, high acceptability, and easy standardization.
In our study, the average GI120 of white rice (O. sativa spp. japonica) was 80 ± 25, close to the values reported by Atkinson et al. (69) and Yang et al. (70). However, the WR1 clusters marked difference in obviously lower GI120. Given the high interpersonal variability in PGR, generally grading of the japonica type white rice as “high GI food” based on the average GI may not apply to a part of the individuals. No difference was found between the GI120 based on WR2 and WR3, in spite of the fact that the two clusters had different PGR patterns. It is notable that the GI calculated based on the 180 min data achieved significant differences among the WR1, WR3, and WR4 subgroups, while the GI based on the 120 min data failed to differentiate the WR3 from WR4 subgroups.
Though the GI was widely used as an indicator of the quality of carbohydrate foods, the certainty of evidence for the relationship between GI and clinical outcomes was graded as low (71). This contradictory might be explained by the fact that the GI is calculated only by the iAUC in 120 min, which might not be enough to represent the PGR patterns in 180 min and beyond, which were affected by both the characteristics of the foods and the type of the subjects. Previous studies observed that the shapes of the PGR curve of foods with comparable GI could vary considerably, especially when it comes to glycemic troughs (72). Recently, based on continuous blood glucose monitoring data, new indicators such as glycemic deviation index (GDI) was developed to integrate the characteristics of the glycemic numerical value and variability, and the possibility of severe hyperglycemia/hypoglycemia (73). As most hypoglycemic episode occurred after 120 min, it is expected that some new index of glycemic stability, which includes negative area under the glycemic curve after 120 min and beyond to fully describe the glycemic variability elicited by food items.
No significant relationship between anthropometric characteristics and PGR pattern was found in this study. Since the subjects consisted of pure young, lean and healthy female subjects, living in the same environment, this study had a relatively small inter-individual variability of BMI (CV = 9.54) and fat mass (CV = 17.87). The uncollected data such as body visceral fat and lean body mass, physical activity level, lifestyle factors, genetic backgrounds, gut microbiome, which varied even in the relatively homogeneous subjects, might affect PGR pattern and need to be explored in future study.
To our knowledge, the current study is the first to classify the PGR patterns of white rice in healthy people, which might be helpful to give insight into the individual PGR to white rice. We used multiple parameters derived from the glucose curves and compared the results based on both 120 and 180 min including those associated with glycemic dips to render a full picture of the PGR patterns. Since the subjects in this study are of same ethnic group and gender group, lived in the dormitories of the same campus, and dined in the same several dining halls, the lifestyle confounders and inter-person variability were minimized. However, even if the trials included are well consistent in terms of study procedure and setting, and the management of subjects, the inter-day glycemic variation might still exist. It is suggested to take repeated measures of individual PGR to the same food. The results may not be applied to people in the diabetic, male subjects and other ethnic groups. The number of the subjects in this study is still limited. Besides, the rice sample used in the study was the japonica type rice prepared by rice cooker, which prevailed in the northeast Asia. The PGR pattern to white rice of indica type or prepared with other procedures is yet to be explored. The insulin and incretin responses of different PGR patterns, which are crucial for understanding the underlying mechanism, were not included in this analysis.
In conclusion, the present study identified four typical PGR patterns to glucose and four typical PGR patterns to white rice by cluster analysis and PFA, indicating high interpersonal variability in PGR pattern to a certain kind of food. Each given subgroup of PGR to G presented multiple patterns of PGR to WR, suggesting a need of combining the glucose tolerance test and white rice tolerance test in rice culture regions. Compared with the parameters calculated based on the postprandial 120 min curve, those based on 180 min curve might be more effective for discriminating the PGR patterns, as it better characterized the hypoglycemic part of the curve. Since it is not accurate to extrapolate the PGR patterns to a certain food only from an OGTT in many subjects, further studies are expected to understand the glycemic variability elicited by major carbohydrate food items for effective daily glycemic management.
Data availability statement
The raw data supporting the conclusions of this article will be made available by the authors, without undue reservation.
Ethics statement
The studies involving human participants were reviewed and approved by China Agricultural University Ethics Committee. The patients/participants provided their written informed consent to participate in this study.
Author contributions
A-SL collected and analyzed the data and drafted the manuscript, tables, and figures. Z-HF proposed the research idea and revised the manuscript. X-JL, W-QZ, Y-XW, X-LL, J-HH, and X-Y-HP helped to collect the data. All authors contributed to the article and approved the submitted version.
Funding
The financial support for this study came from China Agricultural University, Beijing, China.
Acknowledgments
We sincerely thank all the volunteers participated in the acute feeding trials conducted in our university for their time and corporation. We thank Ying Zhou, Linlin Wang, Yuqing Yuan, Jiacan Lu, Ruixin Zhu, Xiaofang Lan, Ting Ye, and Manman Liu for their kindness of giving their consent for sharing the research data to our study.
Conflict of interest
The authors declare that the research was conducted in the absence of any commercial or financial relationships that could be construed as a potential conflict of interest.
Publisher’s note
All claims expressed in this article are solely those of the authors and do not necessarily represent those of their affiliated organizations, or those of the publisher, the editors and the reviewers. Any product that may be evaluated in this article, or claim that may be made by its manufacturer, is not guaranteed or endorsed by the publisher.
Abbreviations
PGR, postprandial glycemic response; OGTT, oral glucose tolerance test; WR, white rice; G, glucose; iAUC, incremental area under the curve; GI, glycemic index; BMI, body mass index; SD, standard deviation; CONGA, continuous overlapping net glycemic action; NAUC, negative area under the curve; PFA, principal factor analysis; SCA, simple correspondence analysis; G-I, glucose-insulin.
References
1. Chen CG, Cohrs CM, Stertmann J, Bozsak R, Speier S. Human beta cell mass and function in diabetes: recent advances in knowledge and technologies to understand disease pathogenesis. Mol Metab. (2017) 6:943–57. doi: 10.1016/j.molmet.2017.06.019
2. Kahn SE. The importance of β-cell failure in the development and progression of type 2 diabetes. J Clin Endocrinol Metab. (2001) 86:4047–58. doi: 10.1210/jcem.86.9.7713
3. American Diabetes Association. Diagnosis and classification of diabetes mellitus. Diabetes Care. (2013) 361:S67–74. doi: 10.2337/dc13-S067
4. Bergman M, Abdul-Ghani M, DeFronzo RA, Manco M, Sesti G, Fiorentino TV, et al. Review of methods for detecting glycemic disorders. Diabetes Res Clin Pract. (2020) 165:108233. doi: 10.1016/j.diabres.2020.108233
5. Alyass A, Almgren P, Akerlund M, Dushoff J, Isomaa B, Nilsson P, et al. Modelling of OGTT curve identifies 1 h plasma glucose level as a strong predictor of incident type 2 diabetes: results from two prospective cohorts. Diabetologia. (2015) 58:87–97. doi: 10.1007/s00125-014-3390-x
6. Abdul-Ghani MA, Lyssenko V, Tuomi T, DeFronzo RA, Groop L. The shape of plasma glucose concentration curve during OGTT predicts future risk of type 2 diabetes. Diabetes Metab Res. (2010) 26:280–6. doi: 10.1002/dmrr.1084
7. Hulman A, Vistisen D, Glumer C, Bergman M, Witte DR, Faerch K. Glucose patterns during an oral glucose tolerance test and associations with future diabetes, cardiovascular disease and all-cause mortality rate. Diabetologia. (2018) 61:101–7. doi: 10.1007/s00125-017-4468-z
8. Wolever TMS. Effect of blood sampling schedule and method of calculating the area under the curve on validity and precision of glycaemic index values. Brit J Nutr. (2004) 91:295–300. doi: 10.1079/BJN20031054
9. Tay J, Thompson CH, Brinkworth GD. Glycemic variability: assessing glycemia differently and the implications for dietary management of diabetes. Annu Rev Nutr. (2015) 35:389–424. doi: 10.1146/annurev-nutr-121214-104422
10. Hulman A, Gujral UP, Narayan KMV, Pradeepa R, Mohan D, Anjana RM, et al. Glucose patterns during the OGTT and risk of future diabetes in an urban Indian population: the CARRS study. Diabetes Res Clin Pract. (2017) 126:192–7. doi: 10.1016/j.diabres.2017.01.009
11. Froslie KF, Roislien J, Qvigstad E, Godang K, Bollerslev J, Voldner N, et al. Shape information from glucose curves: functional data analysis compared with traditional summary measures. BMC Med Res Methodol. (2013) 13:6. doi: 10.1186/1471-2288-13-6
12. Hulman A, Witte DR, Vistisen D, Balkau B, Dekker JM, Herder C, et al. Pathophysiological characteristics underlying different glucose response curves: a latent class trajectory analysis from the prospective EGIR-RISC study. Diabetes Care. (2018) 41:1740–8. doi: 10.2337/dc18-0279
13. Murakami K, Sasaki S, Takahashi Y, Okubo H, Hosoi Y, Horiguchi H, et al. Dietary glycemic index and load in relation to metabolic risk factors in Japanese female farmers with traditional dietary habits. Am J Clin Nutr. (2006) 83:1161–9. doi: 10.1093/ajcn/83.5.1161
14. Hu EA, Pan A, Malik V, Sun Q. White rice consumption and risk of type 2 diabetes: meta-analysis and systematic review. BMJ. (2012) 344:e1454. doi: 10.1136/bmj.e1454
15. Bhavadharini B, Mohan V, Dehghan M, Rangarajan S, Swaminathan S, Rosengren A, et al. White rice intake and incident diabetes: a study of 132,373 participants in 21 countries. Diabetes Care. (2020) 43:2643–50. doi: 10.2337/dc19-2335
16. Dong F, Howard A, Herring AH, Popkin BM, Gordon-Larsen P. White rice intake varies in its association with metabolic markers of diabetes and dyslipidemia across region among Chinese adults. Ann Nutr Metab. (2015) 66:209–18. doi: 10.1159/000430504
17. Seah JYH, Koh W, Yuan J, van Dam RM. Rice intake and risk of type 2 diabetes: the Singapore Chinese health study. Eur J Nutr. (2019) 58:3349–60. doi: 10.1007/s00394-018-1879-7
18. Soriguer F, Colomo N, Olveira G, Garcia-Fuentes E, Esteva I, Ruiz De Adana MS, et al. White rice consumption and risk of type 2 diabetes. Clin Nutr. (2013) 32:481–4. doi: 10.1016/j.clnu.2012.11.008
19. Tan VMH, Ooi DSQ, Kapur J, Wu T, Chan YH, Henry CJ, et al. The role of digestive factors in determining glycemic response in a multiethnic Asian population. Eur J Nutr. (2016) 55:1573–81. doi: 10.1007/s00394-015-0976-0
20. Sun L, Ranawana DV, Tan WJK, Quek YCR, Henry CJ. The impact of eating methods on eating rate and glycemic response in healthy adults. Physiol Behav. (2015) 139:505–10. doi: 10.1016/j.physbeh.2014.12.014
21. Kataoka M, Venn BJ, Williams SM, Te Morenga LA, Heemels IM, Mann JI. Glycaemic responses to glucose and rice in people of Chinese and European ethnicity. Diabetic Med. (2013) 30:E101–7. doi: 10.1111/dme.12080
22. Zhao WQ, Zhou Y, Yuan YQ, Fan ZH, Wu YX, Liu AS, et al. Potato preload mitigated postprandial glycemic excursion in healthy subjects: an acute randomized trial. Nutrients. (2020) 12:2759. doi: 10.3390/nu12092759
23. Lu JC, Zhao WQ, Wang LL, Fan ZH, Zhu RX, Wu YX, et al. Apple preload halved the postprandial glycaemic response of rice meal on in healthy subjects. Nutrients. (2019) 11:2912. doi: 10.3390/nu11122912
24. Lu XJ, Lu JC, Fan ZH, Liu AS, Zhao WQ, Wu YX, et al. Both isocarbohydrate and hypercarbohydrate fruit preloads curbed postprandial glycemic excursion in healthy subjects. Nutrients. (2021) 13:2470. doi: 10.3390/nu13072470
25. Zhu RX, Liu MM, Han Y, Wang LL, Ye T, Lu JC, et al. Acute effects of non-homogenised and homogenised vegetables added to rice-based meals on postprandial glycaemic responses and in vitro carbohydrate digestion. Br J Nutr. (2018) 120:1023–33. doi: 10.1017/S0007114518002489
26. Zhao WQ, Ye T, Fan ZH, Wu YX, Liu AS, Lu JC. Yam paste in glycemic preloads curbs peak glycemia of rice meals in apparent healthy subjects. Asia Pac J Clin Nutr. (2021) 30:436–45. doi: 10.6133/apjcn.202109_30(3).0010
27. Zhu RX, Lan XF, Fan ZH, Wang LL. Effect of Co-ingestion of five vegetables on postprandial glycemic response to rice meals. Food Sci. (2018) 39:207–11. doi: 10.7506/spkx1002-6630-201819032
28. McDonnell CM, Donath SM, Vidmar SI, Werther GA, Cameron FJ. A novel approach to continuous glucose analysis utilizing glycemic variation. Diabetes Technol Ther. (2005) 7:253–63. doi: 10.1089/dia.2005.7.253
29. Moser A, Stuck AE, Silliman RA, Ganz PA, Clough-Gorr KM. The eight-item modified medical outcomes study social support survey: psychometric evaluation showed excellent performance. J Clin Epidemiol. (2012) 65:1107–16. doi: 10.1016/j.jclinepi.2012.04.007
30. Echouffo-Tcheugui JB, Daya N, Lee AK, Tang O, Ndumele CE, Windham BG, et al. Severe hypoglycemia, cardiac structure and function, and risk of cardiovascular events among older adults with diabetes. Diabetes Care. (2021) 44:248–54. doi: 10.2337/dc20-0552
31. McCrimmon RJ. Consequences of recurrent hypoglycaemia on brain function in diabetes. Diabetologia. (2021) 64:971–7. doi: 10.1007/s00125-020-05369-0
32. Sherwin RS. Blood-glucose control and the evolution of diabetic-retinopathy and albuminuria – a preliminary multicenter trial. New Engl J Med. (1984) 311:365–72. doi: 10.1056/NEJM198408093110604
33. McCoy RG, Van Houten HK, Ziegenfuss JY, Shah ND, Wermers RA, Smith SA. Increased mortality of patients with diabetes reporting severe hypoglycemia. Diabetes Care. (2012) 35:1897–901. doi: 10.2337/dc11-2054
34. Sun Y, Zhao L, Teng D, Shi XG, Li YZ, Shan ZY, et al. Postprandial glycemic dips are associated with metabolic disorders and CVD risk in euglycemic individuals. J Clin Endocr Metab. (2022) 107:E1631–42. doi: 10.1210/clinem/dgab831
35. Wyatt P, Berry SE, Finlayson G, O’Driscoll R, Hadjigeorgiou G, Drew DA, et al. Postprandial glycaemic dips predict appetite and energy intake in healthy individuals. Nat Metab. (2021) 3:523. doi: 10.1038/s42255-021-00383-x
36. Ceriello A, Novials A, Ortega E, La Sala L, Pujadas G, Testa R, et al. Evidence that hyperglycemia after recovery from hypoglycemia worsens endothelial function and increases oxidative stress and inflammation in healthy control subjects and subjects with type 1 diabetes. Diabetes. (2012) 61:2993–7. doi: 10.2337/db12-0224
37. Hulman A, Simmons RK, Vistisen D, Tabak AG, Dekker JM, Alssema M, et al. Heterogeneity in glucose response curves during an oral glucose tolerance test and associated cardiometabolic risk. Endocrine. (2017) 55:427–34. doi: 10.1007/s12020-016-1126-z
38. Pedersen MG, Tagliavini A, Henquin J. Calcium signaling and secretory granule pool dynamics underlie biphasic insulin secretion and its amplification by glucose: experiments and modeling. Am J Physiol Endocrinol Metab. (2019) 316:E475–86. doi: 10.1152/ajpendo.00380.2018
39. Abdul-Ghani MA, Matsuda M, Balas B, DeFronzo RA. Muscle and liver insulin resistance indexes derived from the oral glucose tolerance test. Diabetes Care. (2007) 30:89–94. doi: 10.2337/dc06-1519
40. Shanik MH, Xu Y, Skrha J, Dankner R, Zick Y, Roth J. Insulin resistance and hyperinsulinemia is hyperinsulinemia the cart or the horse? Diabetes Care. (2008) 312:S262–8. doi: 10.2337/dc08-s264
41. Kim JY, Tfayli H, Bacha F, Lee S, Michaliszyn SF, Yousuf S, et al. Beta-cell function, incretin response, and insulin sensitivity of glucose and fat metabolism in obese youth: relationship to OGTT-time-to-glucose-peak. Pediatr Diabetes. (2020) 21:18–27. doi: 10.1111/pedi.12940
42. Cheng XQ, Yang N, Li YX, Sun Q, Qiu L, Xu LL, et al. The shape of the glucose response curve during an oral glucose tolerance test heralds beta-cell function in a large Chinese population. BMC Endocr Disord. (2019) 19:119. doi: 10.1186/s12902-019-0446-4
43. Yuan T, Song SN, Zhao TY, Duo YB, Wang SH, Gao JX, et al. Patterns of insulin secretion during first-phase insulin secretion in normal Chinese adults. Front Endocrinol. (2021) 12:738427. doi: 10.3389/fendo.2021.738427
44. Chung ST, Ha J, Onuzuruike AU, Kasturi K, Galvan-De La Cruz M, Bingham BA, et al. Time to glucose peak during an oral glucose tolerance test identifies prediabetes risk. Clin Endocrinol. (2017) 87:484–91. doi: 10.1111/cen.13416
45. Kim JY, Michaliszyn SF, Nasr A, Lee S, Tfayli H, Hannon T, et al. The shape of the glucose response curve during an oral glucose tolerance test heralds biomarkers of type 2 diabetes risk in obese youth. Diabetes Care. (2016) 39:1431–9. doi: 10.2337/dc16-0352
46. Tschritter O, Fritsche A, Shirkavand F, Machicao F, Haring H, Stumvoll M. Assessing the shape of the glucose curve during an oral glucose tolerance test. Diabetes Care. (2003) 26:1026–33. doi: 10.2337/diacare.26.4.1026
47. Henquin J, Dufrane D, Kerr-Conte J, Nenquin M. Dynamics of glucose-induced insulin secretion in normal human islets. Am J Physiol Endocrinol Metab. (2015) 309:E640–50. doi: 10.1152/ajpendo.00251.2015
48. Mitrakou A, Kelley D, Mokan M, Veneman T, Pangburn T, Reilly J, et al. Role of reduced suppression of glucose-production and diminished early insulin release in impaired glucose-tolerance. New Engl J Med. (1992) 326:22–9. doi: 10.1056/NEJM199201023260104
49. Gandasi NR, Yin P, Omar-Hmeadi M, Laakso EO, Vikman P, Barg S. Glucose-dependent granule docking limits insulin secretion and is decreased in human type 2 diabetes. Cell Metab. (2018) 27:470. doi: 10.1016/j.cmet.2017.12.017
50. Wagner R, Heni M, Tabak AG, Machann J, Schick F, Randrianarisoa E, et al. Pathophysiology-based subphenotyping of individuals at elevated risk for type 2 diabetes. Nat Med. (2021) 27:49. doi: 10.1038/s41591-020-1116-9
51. Marathe CS, Rayner CK, Jones KL, Horowitz M. Relationships between gastric emptying, postprandial glycemia, and incretin hormones. Diabetes Care. (2013) 36:1396–405. doi: 10.2337/dc12-1609
52. Faerch K, Pacini G, Nolan JJ, Hansen T, Tura A, Vistisen D. Impact of glucose tolerance status, sex, and body size on glucose absorption patterns during OGTTs. Diabetes Care. (2013) 36:3691–7. doi: 10.2337/dc13-0592
53. Holst JJ, Gribble F, Horowitz M, Rayner CK. Roles of the gut in glucose homeostasis. Diabetes Care. (2016) 39:884–92. doi: 10.2337/dc16-0351
54. Berry SE, Valdes AM, Drew DA, Asnicar F, Mazidi M, Wolf J, et al. Human postprandial responses to food and potential for precision nutrition. Nat Med. (2020) 26:964. doi: 10.1038/s41591-020-0934-0
55. Zeevi D, Korem T, Zmora N, Israeli D, Rothschild D, Weinberger A, et al. Personalized nutrition by prediction of glycemic responses. Cell. (2015) 163:1079–94. doi: 10.1016/j.cell.2015.11.001
56. Mandel AL, Breslin PAS. High endogenous salivary amylase activity is associated with improved glycemic homeostasis following starch ingestion in adults. J Nutr. (2012) 142:853–8. doi: 10.3945/jn.111.156984
57. Suzuki H, Fukushima M, Okamoto S, Takahashi O, Shimbo T, Kurose T, et al. Effects of thorough mastication on postprandial plasma glucose concentrations in nonobese Japanese subjects. Metabolism. (2005) 54:1593–9. doi: 10.1016/j.metabol.2005.06.006
58. Ranawana V, Monro JA, Mishra S, Henry CJK. Degree of particle size breakdown during mastication may be a possible cause of interindividual glycemic variability. Nutr Res. (2010) 30:246–54. doi: 10.1016/j.nutres.2010.02.004
59. Bolton RP, Heaton KW, Burroughs LF. The role of dietary fiber in satiety, glucose, and insulin - studies with fruit and fruit juice. Am J Clin Nutr. (1981) 34:211–7. doi: 10.1093/ajcn/34.2.211
60. Mishra S, Edwards H, Hedderley D, Podd J, Monro J. kiwifruit non-sugar components reduce glycaemic response to Co-ingested cereal in humans. Nutrients. (2017) 9:1195. doi: 10.3390/nu9111195
61. Hinshaw L, Schiavon M, Mallad A, Man CD, Basu R, Bharucha AE, et al. Effects of delayed gastric emptying on postprandial glucose kinetics, insulin sensitivity, and beta-cell function. Am J Physiol Endocrinol Metab. (2014) 307:E494–502. doi: 10.1152/ajpendo.00199.2014
62. Ranawana V, Clegg ME, Shafat A, Henry CJ. Postmastication digestion factors influence glycemic variability in humans. Nutr Res. (2011) 31:452–9. doi: 10.1016/j.nutres.2011.05.006
63. Meier JJ, Baller B, Menge BA, Gallwitz B, Schmidt WE, Nauck MA. Excess glycaemic excursions after an oral glucose tolerance test compared with a mixed meal challenge and self-measured home glucose profiles: is the OGTT a valid predictor of postprandial hyperglycaemia and vice versa? Diabetes Obes Metab. (2009) 11:213–22. doi: 10.1111/j.1463-1326.2008.00922.x
64. Ceriello A, Prattichizzo F, Phillip M, Hirsch IB, Mathieu C, Battelino T. Glycaemic management in diabetes: old and new approaches. Lancet Diabetes Endocrinol. (2022) 10:75–84. doi: 10.1016/S2213-8587(21)00245-X
65. Koessler T, Bobrov P, Strassburger K, Kuss O, Zaharia O, Karusheva Y, et al. Impact of mixed meal tolerance test composition on measures of beta-cell function in type 2 diabetes. Nutr Metab. (2021) 18:47. doi: 10.1186/s12986-021-00556-1
66. Hijikata, M, Higa M, Ichijo T, Hirose T. A comparison of meal tolerance test and oral glucose tolerance test for predicting insulin therapy in patients with gestational diabetes. Food Nutr Res. (2021) 65:5490. doi: 10.29219/fnr.v65.5490
67. Fujioka Y, Okura T, Sumi K, Matsumoto K, Shoji K, Nakamura R, et al. Normal meal tolerance test is preferable to the glucagon stimulation test in patients with type 2 diabetes that are not in a hyperglycemic state: comparison with the change of C-peptide immunoreactivity. J Diabetes Invest. (2018) 9:274–8. doi: 10.1111/jdi.12692
68. Rijkelijkhuizen JM, Girman CJ, Mari A, Alssema M, Rhodes T, Nijpels G, et al. Classical and model-based estimates of beta-cell function during a mixed meal vs. An OGTT in a population-based cohort. Diabetes Res Clin Pract. (2009) 83:280–8. doi: 10.1016/j.diabres.2008.11.017
69. Atkinson FS, Brand-Miller JC, Foster-Powell K, Buyken AE, Goletzke J. International tables of glycemic index and glycemic load values 2021: a systematic review. Am J Clin Nutr. (2021) 114:1625–32. doi: 10.1093/ajcn/nqab233
70. Yang YX, Wang HW, Cui HM, Wang Y, Yu LD, Xiang SX, et al. Glycemic index of cereals and tubers produced in China. World J Gastroentero. (2006) 12:3430–3. doi: 10.3748/wjg.v12.i21.3430
71. Reynolds A, Mann J, Cummings JH, Winter N, Mete E, Te Morenga L. Carbohydrate quality and human health: a series of systematic reviews and meta-analyses. Lancet. (2019) 393:434–45. doi: 10.1016/S0140-6736(18)31809-9
72. Brand-Miller JC, Stockmann K, Atkinson F, Petocz P, Denyer G. Glycemic index, postprandial glycemia, and the shape of the curve in healthy subjects: analysis of a database of more than 1000 foods. Am J Clin Nutr. (2009) 89:97–105. doi: 10.3945/ajcn.2008.26354
Keywords: clustering analysis, glycemic response pattern, white rice, glucose, glycemic index
Citation: Liu A-s, Fan Z-h, Lu X-j, Wu Y-x, Zhao W-q, Lou X-l, Hu J-h and Peng X-y-h (2022) The characteristics of postprandial glycemic response patterns to white rice and glucose in healthy adults: Identifying subgroups by clustering analysis. Front. Nutr. 9:977278. doi: 10.3389/fnut.2022.977278
Received: 30 June 2022; Accepted: 03 October 2022;
Published: 31 October 2022.
Edited by:
Rikard Landberg, Chalmers University of Technology, SwedenCopyright © 2022 Liu, Fan, Lu, Wu, Zhao, Lou, Hu and Peng. This is an open-access article distributed under the terms of the Creative Commons Attribution License (CC BY). The use, distribution or reproduction in other forums is permitted, provided the original author(s) and the copyright owner(s) are credited and that the original publication in this journal is cited, in accordance with accepted academic practice. No use, distribution or reproduction is permitted which does not comply with these terms.
*Correspondence: Zhi-hong Fan, ZGFpc3lmYW5AY2F1LmVkdS5jbg==
†These authors have contributed equally to this work and share last authorship
 An-shu Liu
 Zhi-hong Fan1,2*