- 1Department of Food Technology, Faculty of Science, Kyambogo University, Kampala, Uganda
- 2Clinical and Experimental Endocrinology, Department of Chronic Diseases and Metabolism, KU Leuven, Leuven, Belgium
- 3Nutrition Unit, Department of Health Sciences, School of Applied Sciences, Mildmay Institute of Health Sciences, Kampala, Uganda
- 4Mildmay Group, Mildmay Hospital, Kampala, Uganda
- 5Department of Endocrinology, University Hospitals Leuven, Leuven, Belgium
Introduction: Suboptimal diet and physical inactivity downgrade the putative benefits of Antiretroviral Therapy (ART) among People Living with HIV (PLWH). However, there is paucity of literature on dietary intake and cardiometabolic profiles of PLWH in Uganda.
Methods: A cross-sectional study among PLWH in Uganda was conducted. Dietary intake was assessed using a 24h recall method of 2 non-consecutive days. The short International Physical Activity Questionnaire assessed participants' physical activity. Fasted blood samples were analyzed for Fasting Blood Glucose (FBG), total cholesterol, LDL-c, HDL-c and triglycerides. Blood pressure and anthropometric measurements were performed following step 2 of the WHO STEPS.
Results: 253 patients completed in this study. A high prevalence of low HDL-c (31.9%), abdominal obesity (44.5%), high BMI (51.6%), raised FBG (45.3%), high SBP (31.5%), elevated triglycerides (26.4%) and metabolic syndrome (28%) was found. More women were identified with metabolic syndrome (31.5%) than men (19.2%). Low prevalence of high LDL-c (4.7%) and total cholesterol (9.8%) was found. Diets had a high carbohydrate (65.8 ± 10.4) E% and fiber intake (30.1 ± 12.7) g with minimal PUFA (6.1 ± 2.3) E%, fruits and vegetables (1.4 servings). High proportions were found of unmet intake for vitamin A (38.2%), B1(48.8%), B2 (29.6%), B12 (29%), folate (61.4%), Ca (76%), Zn (53.1%) and Mg (41.7%). Mean MET min was 6,700 ± 5,509 and over 68% of the participants had >3,000 MET min.
Conclusion: Our findings reveal a high prevalence of metabolic disturbances among PLWH in Uganda and further highlight that their diets are suboptimal with low fruits and vegetable intake
Introduction
By 2020, over 37.7 million people were living with HIV globally, with 67% of whom living in Sub Saharan Africa (SSA) (1). An estimated 1.4 million Ugandans are living with HIV and AIDS, with 38,000 new HIV infections recorded in 2020 while over 22,000 died of AIDS-related illnesses including non-communicable diseases (NCD) (2). Although the advent of Antiretroviral Therapy (ART) coincided with increased longevity and improvement in general quality of life of People Living with HIV (PLWH), sub-optimal cardiometabolic health among ART recipients are reported (3) and consequently increase the risk of age related NCD comorbidities (4). Moreover, the ART-associated cardiometabolic risks coupled with poor diet, physical inactivity, smoking and immoderate alcohol intake (5–8), now threaten to undo the earlier putative benefits of this therapy (9, 10). Subsequently, these factors can impose a cluster of negative metabolic changes collectively referred to as metabolic syndrome. Metabolic syndrome refers to a constellation of conditions that together increase the risk of heart disease, stroke and type 2 diabetes. Such metabolic conditions include high blood pressure, high blood sugar, excess body fat around the waist and dyslipidaemia. Metabolic syndrome heightens the risk of heart attack and stroke (11). A prevalence of metabolic syndrome of up to 21.5% has been noted in PLWH in sub-Saharan Africa (SSA) (12).
Although the cardio-metabolic profile of PLWH in Uganda has previously been reported to be suboptimal (13), the dietary intake of PLWH has not yet been adequately studied. Insights about the diet are a cornerstone in the optimisation of cardiometabolic health (14). However, presently there is a paucity of studies assessing cardiometabolic health and dietary intake of PLWH simultaneously. Therefore, this study aimed at characterizing the dietary intake and cardiometabolic profiles of PLWH in Community Drug Distribution Points (CDDPs) in Uganda.
Materials and methods
Study design and population
A cross-sectional study was conducted between May and July 2021 among PLWH in CDDPs in Wakiso district, central Uganda. Wakiso is one of the districts with the highest HIV and AIDS prevalence (7.3%) in Uganda (15). Study staff approached potential participants with verbal and written information about the study. Participants then provided signed informed consent in Luganda, the local language, or in English. In case of illiterate participants, a fingerprint was used to sign in the presence of a witness. Participants were requested to fast for at least 8 h and avoid strenuous activities on the day of measurement. The study protocol complied with the Helsinki declaration on human subjects (16) and was approved by Uganda National Council of Science and Technology (UNCST-HS1355ES).
Inclusion and exclusion criteria
Eligible participants were adults (≥18 years) living with HIV and AIDS, virally suppressed (HIV RNA <1,000 copies per mL of blood), not breastfeeding nor pregnant, with 95% ART adherence who had been on ART for at least 6 months in CDDPs. Patients co-infected with TB were excluded.
Outcome measures
Primary outcomes included dietary intake, and metabolic syndrome and its components (HDL-c, triglycerides, fasting blood glucose, waist circumference, body composition and blood pressure). Secondary outcome were BMI, total cholesterol and LDL-c.
Definitions
A reading ≥100 mg/dL was considered to be raised fasting plasma glucose, while ≥100 mg/dL to <126 mg/dL was categorized as prediabetes and ≥126 mg/dL was classified as diabetes (11). Low HDL-c was defined as <50 mg/dL in women or <40 mg/dL in men, readings ≥150 mg/dL were considered elevated triglycerides while blood pressure ≥130 ≥85 mm Hg was considered high (11). Cut points for fat mass were <25 kg for men or <35 kg in women (17) while waist circumference; <90 cm for men and <80 cm for women (18). Participants with BMI ranges (18.5–24.9 kg/m2) were considered normal, (≥25.0–29.9 kg/m2) overweight and (BMI ≥ 30 kg/m2) as living with obesity. Cut points for total cholesterol and LDL-c were <200 mg/dL and <140 mg/dL, respectively.
Metabolic syndrome was defined according to the NCEP/ATP III criteria (11), as existence of atleast three of the following CVD risk markers: raised fasting blood glucose (≥100 mg/dL); large waist circumference (>90 cm in men or >80 cm in women); high blood pressure (≥130 ≥85 mm Hg); elevated TG (≥150 mg/dL) and low HDL-C (<50 mg/dL in women or <40 mg/dL in men).
Data collection
Data collection followed the WHO STEPS instrument for collecting data and measuring chronic disease risk factors (19). In step 1, a socio-demographic questionnaire was administered to elicit data on age, education level, tribe, marital status, occupation, socioeconomic status and household size. A specially developed self-reporting questionnaire was administered to collect medical information such as participants' date of HIV diagnosis, current combination of ART, duration on ART, prior diagnosis of metabolic disorders and current use of cholesterol stabilizing or performance enhancing drugs as well as the use of non-conventional medicines e.g., local herbs. Regarding ART regimen, a distinction was made between Protease Inhibitors (PI) or integrase inhibitor and non-Protease Inhibitors (non-PI) regimens. This information was later verified by reviewing patient's medical charts of each participant.
Physical activity was measured using the short form of the International Physical Activity Questionnaire (20). Participants that did not reach at least 600 metabolic equivalents of task (MET) were classified as physically inactive while a range ≥600 to <3,000 MET was considered minimally active. Individuals exceeding 3,000 MET were defined as having health-enhancing-physical activity. Alcohol intake was assessed using the WHO developed Alcohol Use Disorder Identification Test (AUDIT). A score of 8 or more is considered hazardous or harmful alcohol use with potential physical or physiological harm (21). Smoking frequency was measured based on previously validated questions on tobacco use (22, 23).
Dietary assessment and energy intake
Dietary intake data was collected by a non-consecutive 2 day 24-h dietary recall interview-based method by trained nutritionists. A 2 non-consecutive days method allows to assess an individual's usual intake (24). The interview allowed for estimation of food quantities and sizes and probing whenever required to ensure that foods were not forgotten. Participants were required to recall the specific timing of food consumption on each consumption day. During the interviews, time periods of consumption were structured as follows: breakfast, midmorning snack, lunch, evening snack, dinner, and night snack. Estimations of meal portion sizes were done by use of a photographic food atlas and household utensils (25). These proxy measurements were later converted into their equivalent metric units (grams) to quantify meal portion sizes. For determination of nutrient intake, the actual food intake was converted into relevant nutrients by use of Food Composition DataBases (FCDB). Due to the lack of a Ugandan FCDB, a combination of the Harvest Plus FCDB for central and eastern Uganda (26), the Kenyan and USDA FCBB (27) were used. The usual dietary intake was calculated using the Multiple Source Method (MSM) (28). In the absence of Dietary Recommended Intakes (DRIs) specific to patients with HIV and/or AIDS, data was compared to the general US Institute of Medicine nutrient recommendations (29, 30). Energy intake was compared with the Average Requirements (AR) of adults aged 19 and above. AR was a range of energy intakes based on a wide scope of Physical Activity Levels (PAL). The PALs used in this calculation were obtained from the physical activity assessment of the participants in this study. The dietary guidelines of the Therapeutic Lifestyle Changes of Nation Cholesterol Education Programme Adult Treatment Panel III (NCEP-ATP III-TLC) were used for recommendations of cholesterol, SFA, MUFA, soluble and insoluble dietary fibers (31). We used the FAO Global Individual Food Composition Data Tool to classify food into 14 different food groups (32). Total polyphenols intake was estimated using phenol explorer database (33).
Blood pressure and anthropometry
Height, weight, and blood pressure were measured according to step 2 of WHO STEPS. Waist circumference (to the nearest 0.5 cm) was measured using Gulick measuring tape at the level of the iliac crest with the participant standing, at the end of gentle expiration (34). Body composition was measured using Bodystat 1,500 lite touch.
Biochemical measurements
In WHO STEPS (step 3), fasting blood samples were collected and analyzed for glucose, total cholesterol, HDL-c, LDL-c and triglycerides using a CardioChek Plus. A laboratory technician drew a fingerstick blood sample of 15 to 40 μL onto the test strips.
Statistical analysis
Considering the prevalence (21.5%) of metabolic syndrome among PLWH in SSA, a sample size calculation was performed, and 243 participants were required to give a statistical significance at 95% confidence interval. Data was analyzed by the Statistical Package for Social Science (SPSS) version 22 (IBM Corp, Armonk, NY, USA). We used the Shapiro-Wilk test to assess the normality of data. Possible associations between categorical data were analyzed using Pearson's Chi Square test. Gender differences in nutrient intake were determined by the student's t-test. Multiple logistic regression was used to determine the association between independent variables (ART duration and time lived with HIV energy and fiber intake) and metabolic syndrome and BMI at bivariate and multivariate levels. We could not assess the association between metabolic syndrome and ART regimen as 91% of the participants were on integrase inhibitor regimens. A p-value of < 0.05 was used for statistical significance.
Results
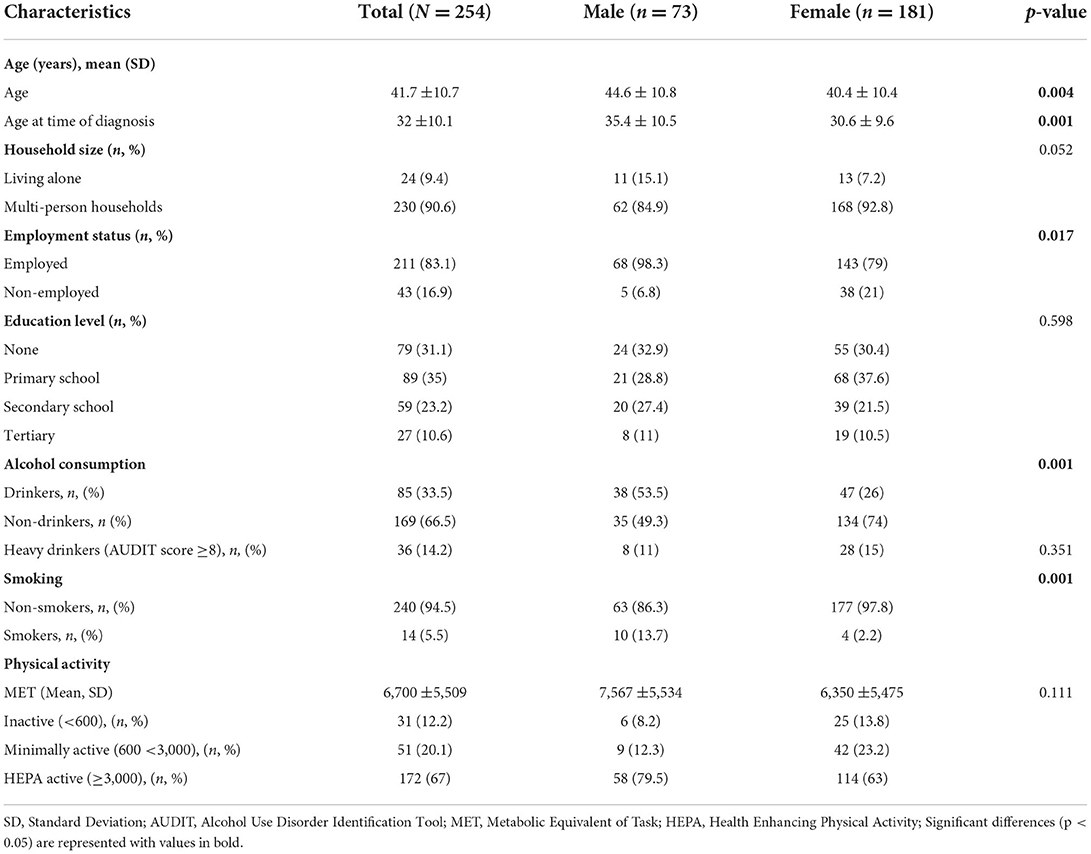
Overall, out of the 273 participants recruited, 254 completed the study. In Table 1, demographic characteristics and the prevalence of modifiable CVD risk factors are presented. Majority (71.3%) of the participants were women.
The time lived with HIV and AIDS among participants was on average 9.6 ± 7.3 years and participants had been on ART for an average duration of 8.5 ± 6.3 years. Of all participants, 91% reported to be taking Dolutegravir/Lamivudine/Tenofovir disoproxil (DTG/3TC/TDF) class of ART while 5.1% were being treated with Tenofovir disoproxil fumarate/Lamivudine/Efavirenz (TDF/3TC/EFV) ART combinations. Use of complementary and alternative medicine was reported in 40.6% of the participants. These included local herbs e.g., Aloe barbadensis miller, Hibiscus sabdariffa, Cassia obtusifolia and Tamarindus indica.
Over 33% of the participants consumed alcohol and the consumption ranged from 1 to 10 bottles of beer on a single drinking occasion. On average females had a higher AUDIT score than men. Cigarettes were the only form of tobacco use reported. The average number of cigarettes smoked per day was 7 and ranged from 1 to 20 cigarettes while the average number of cigarettes smoked on heaviest smoking days was 10. On average, participants began smoking at 22 years of age and had been smoking for 21 years. The MET min ranged from 150 to 22,932 with only 12.2% below the 600 MET threshold.
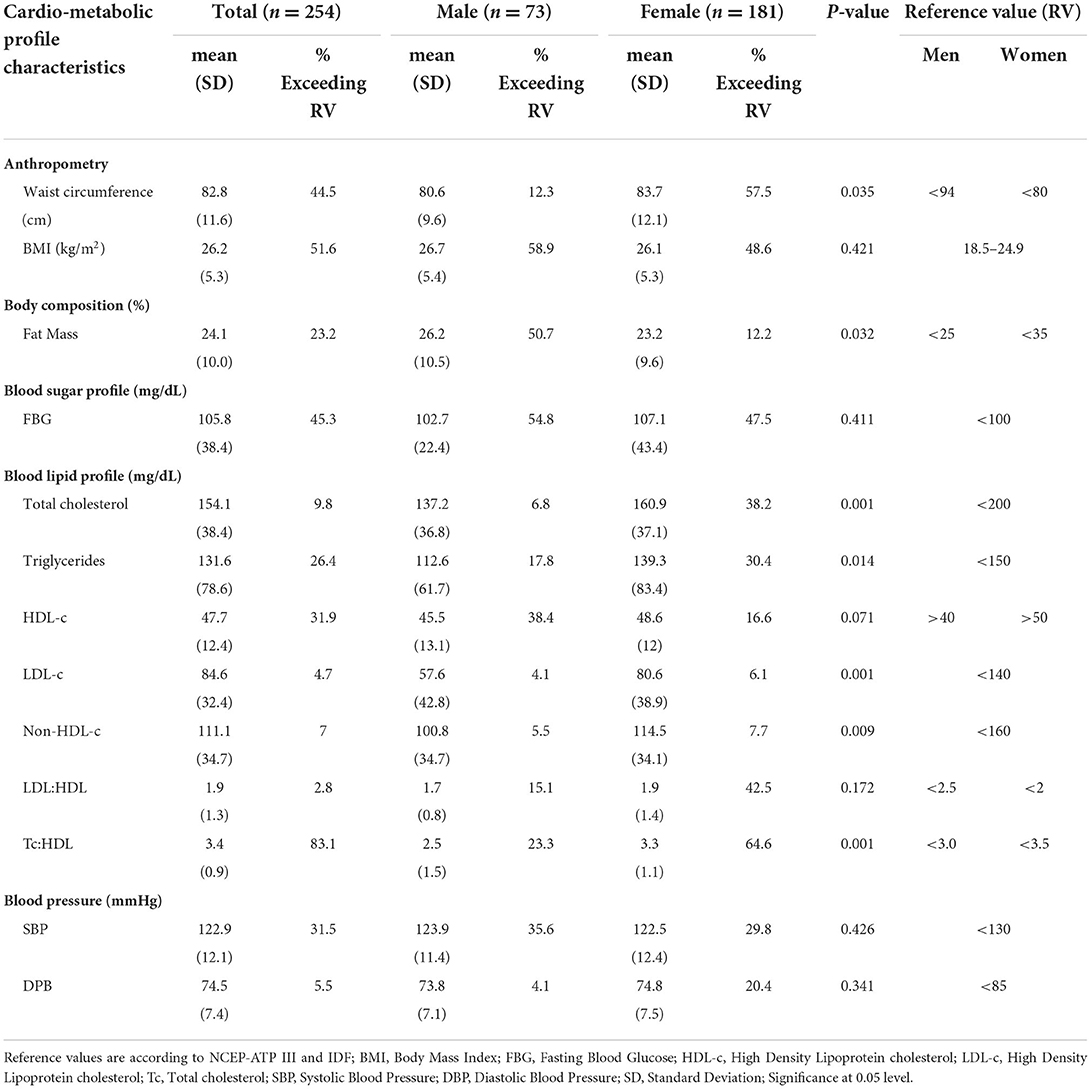
The prevalence of metabolic syndrome and its components are presented in Table 2 and Figure 1. In total, 28% of the participants met the criteria for metabolic syndrome and this was significantly higher in women (31.5%) than in men (19.2%), (p = 0.048). The prevalence of abdominal obesity, raised FBG, and low HDL-c was, respectively, 44.5, 49.6, and 56.7%. Women had significantly higher prevalence of central obesity (p=0.035) and hypertriglyceridemia (p = 0.014), respectively, than men. Of the 49.6% (n = 126) participants with FBG > 100 mg/dL, 20.6% (n = 26) participants had FBG exceeding 126 mg/dL. Although results did not reach statistical significance, hypertension was more prevalent in men than women. Other additional cardiometabolic risk factors; fat mass, BMI, LDL-c and total cholesterol are summarized in Table 2. Overall, all participants had low total cholesterol and LDL-c levels with <10% of the participants exceeding the upper reference value for both. More than half of the participants had a BMI higher than 24.9 kg/m2. Of these, 21.2% (n = 54) had a BMI higher than 29.9 kg/m2. Proportions of metabolic syndrome and its components and high BMI stratified by age, are shown in Supplementary Table 1. In terms of fat mass, the proportion of men exceeding the reference value was higher than women (50.7 vs. 12.2%, p = 0.032). In multivariate analysis, there was no significant association between duration of ART, years lived with HIV, energy or fiber intake with metabolic syndrome or a high BMI.
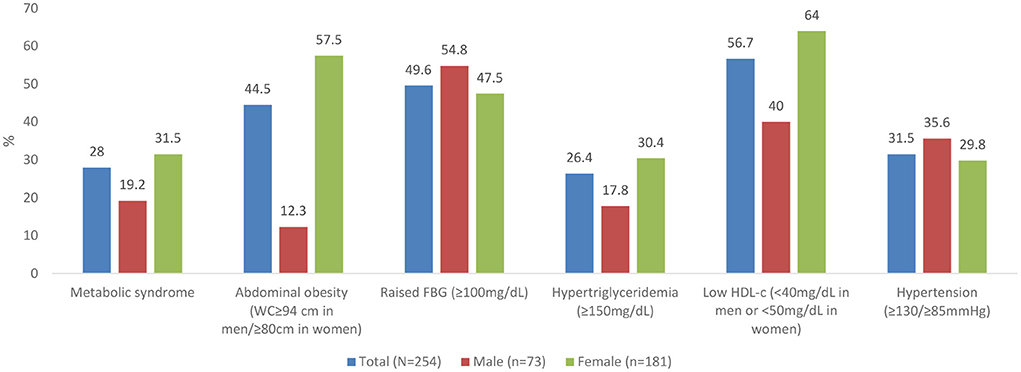
Figure 1. Prevalence of metabolic syndrome and its components. WC, waist circumference; FBG, Fasting Blood Glucose; HDL, High Density Lipoproteins.
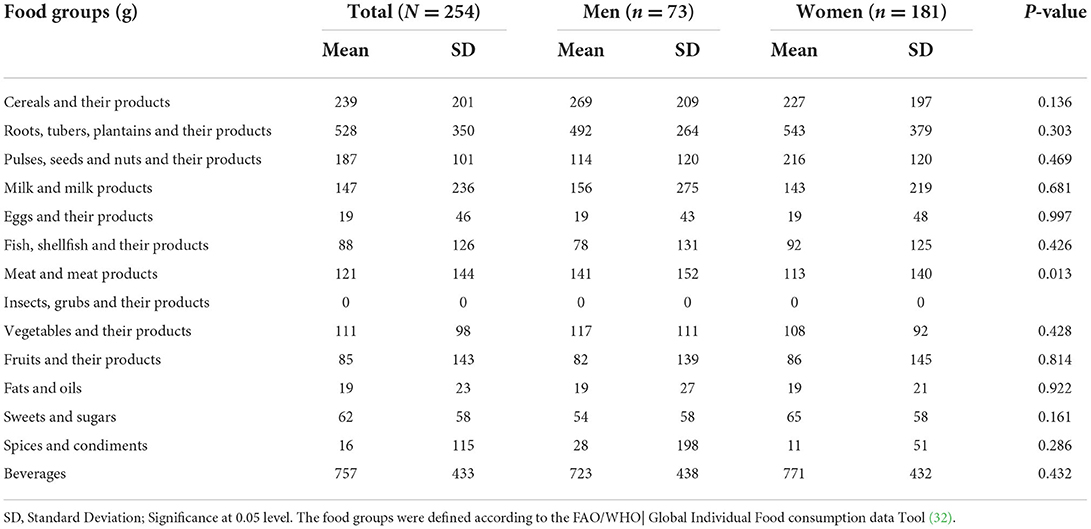
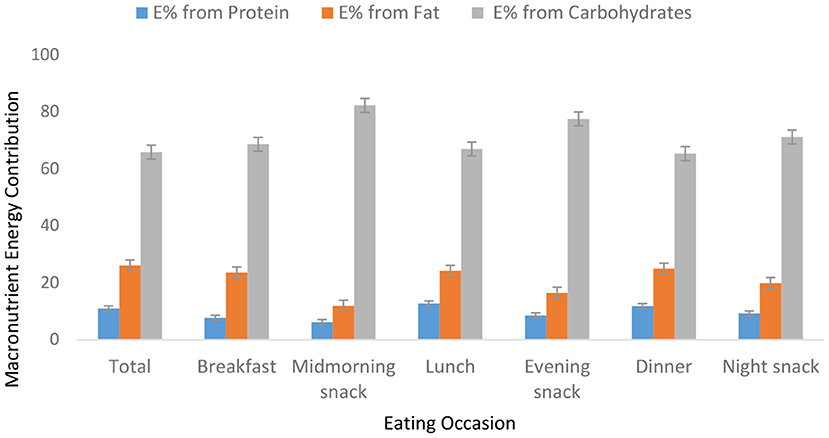
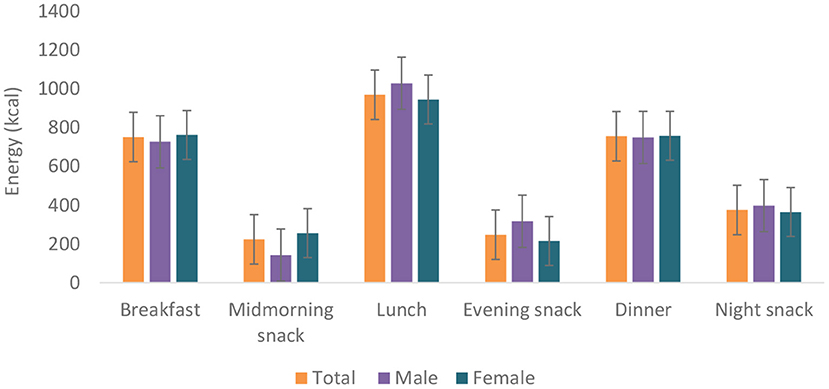
Food group consumption is presented in Table 3 and Supplementary Figure 1. Mean daily consumption was highest for roots, tubers, and plantains (528 g), followed by 239.4 and 186.5 g for cereals and legumes, respectively. The daily intake of fruits and vegetables was reported to be a serving or less. The mean daily energy intake was 2,389 (±768) kcal, and this came from breakfast (751 ± 459 kcal), lunch (969 ± 516 kcal) and dinner (755 ± 551 kcal). Over 19% of the participants had daily energy intake exceeding their Average Requirement. Energy and macronutrient intake for both sexes compared with the dietary recommendations are summarized in Table 4. There was a significant difference in protein intake across sex (men 72.6 vs. women 59%, p = 0.031). Our results show that in total, 76.8% of the participants had fat intake above 20 E%. A PUFA intake below the IOM recommendation of 5–10 E% was found in 36.6% of the participants. Most participants (80.7%) had a cholesterol intake of lower than 200 mg. There were significant differences (p = 0.029) in cholesterol intake across sexes (men 152.5 vs. women 122.8 mg). The energy and total dietary fiber distribution per eating occasion are shown in and Supplementary Table 2. Regarding energy contribution by macronutrients across all eating occasions (Figure 2), carbohydrates contributed the highest proportion of energy. None of the eating occasions had a carbohydrate-derived energy contribution lower than 65 E% with the largest E-intake of carbohydrates taken during midmorning snack (82 E%). Overall, lunch contributed the highest amount of energy of all the eating occasions (Figure 3).
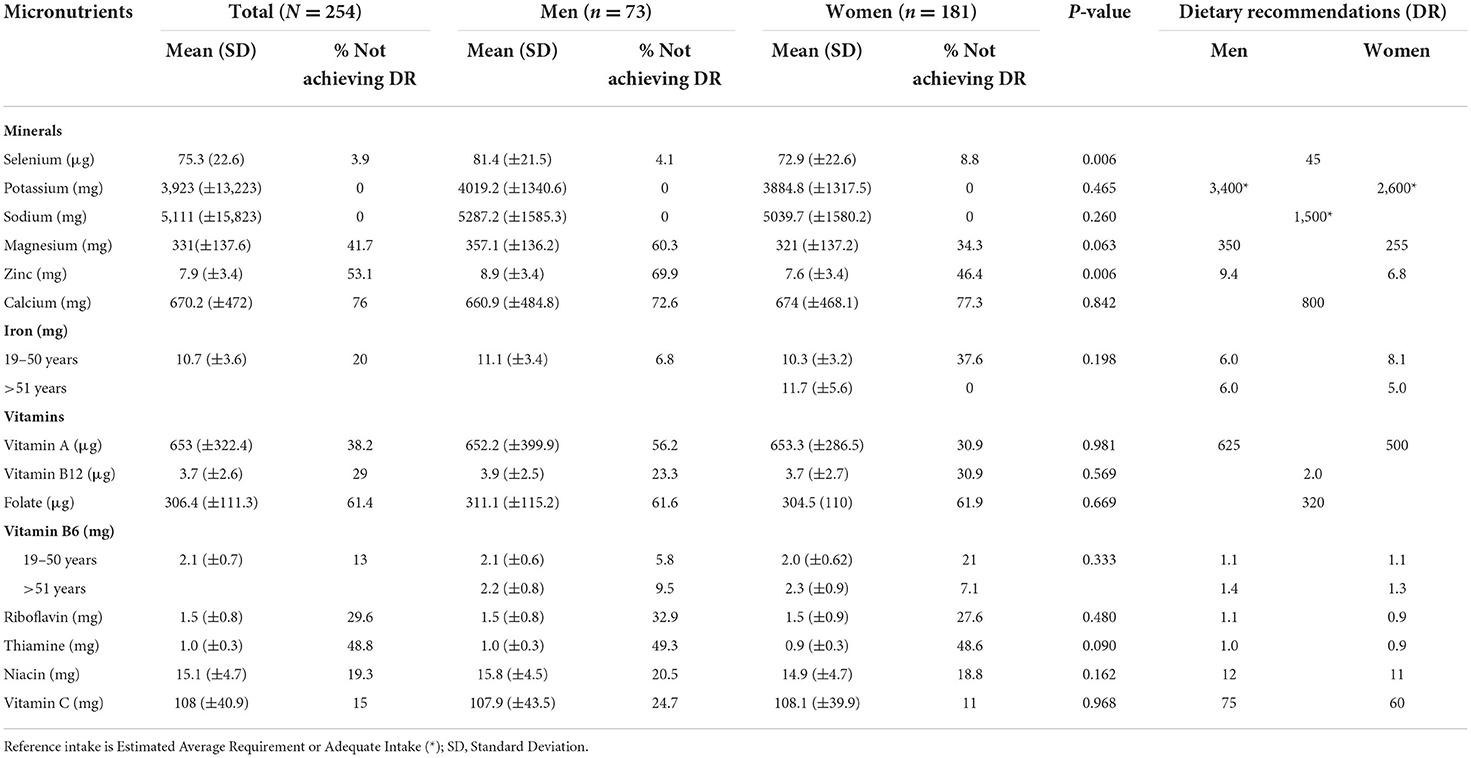
Ca, Mg, Zn and vitamins A, B1, B2 and folate had an intake below the recommendations (Table 5). None of the participants had an intake below the EAR or AI for sodium or potassium. Inadequate iron intake was found in over 37% of women.
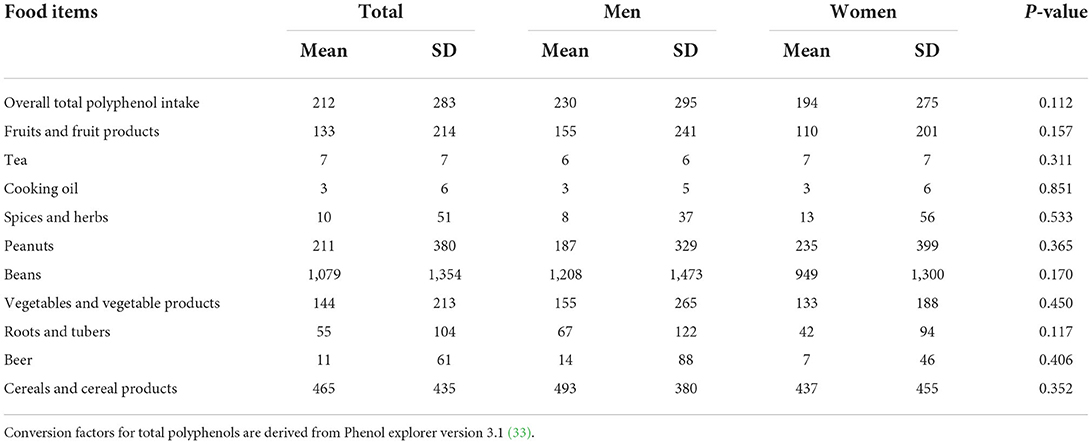
Our results Table 6 show that the usual intake of total polyphenols was 212 (±283) mg, beans contributed the highest amount of total polyphenols followed by cereals, peanuts, vegetables and fruits.
Discussion
The major findings were high prevalence of low HDL-c, abdominal obesity, raised FBG, hypertension and elevated triglycerides. These metabolic abnormalities ultimately culminated into a high prevalence of metabolic syndrome (28%). Significant sex differences were observed as more women identified with metabolic syndrome, abdominal obesity, low HDL-c and elevated triglycerides than men. Remarkably, majority of the study participants had optimal levels of LDL-c and total cholesterol. Generally, diets were characterized by a large intake of roots and tubers, whole cereals, legumes with minimal fruits and vegetables. As a result, diets were high in carbohydrate and fiber but deficient in several vitamins, minerals and PUFA.
Overall, half (51.6%) of the participants were either living with overweight or obesity while 44.4% had abdominal obesity. Women posted substantially higher rates of abdominal obesity than men. A similar trend has been reported in the general Ugandan population (35). There is strong evidence across SSA that obesity and abdominal obesity exist at high levels especially among women (13, 36–39). A lower prevalence of obesity has been reported in high income countries e.g., 38% in UK (40) and 20.4% in France (41). The cause for the observed overweight/obesity and abdominal obesity can be twofold. First, it could be due to the health-beauty paradox, a sociocultural misconception in SSA where a big body size has been misconstrued for wealth, beauty, respect and freedom from HIV (42–44). This paradox fosters unhealthy lifestyles and thwarts willingness to lose weight (45, 46). However, HIV and ART could equally contribute to obesity and abdominal obesity. ART reduces proinflammatory cytokines consequently resulting into mild to moderate insulin resistance. The decrease in insulin resistance in adipose tissue increases glucose uptake and lipid metabolism, a precursor for weight gain and visceral obesity (47). Different ART classes can confer negative metabolic response e.g., PIs, InSTI and NRTI are associated with weight gain and fat redistribution (48). DTG/3TC/TDF which is currently the most preferred first and second line of ART (49) has been found to increase body weight and BMI in even ART naïve PLWH (50). However, the weight gain under Dolutegravir as a monotherapy or when used as DTG/3TC/DTF combination is still lower than what is experienced in PIs and NNRTI based regimens (51).
Likewise, HIV etiology and ART have been shown to exacerbate metabolic syndrome. Although the pathophysiology remains rather elusive, HIV triggers glucose metabolism dysregulation and dyslipidaemia. In part, this is linked to the inflammation triggered by viral infection (52). The virus triggers chronic activation of the innate immune system with excessive production of inflammatory cytokines. These inflammatory mediators increase the risk of atherosclerosis (19) and insulin resistance (47). Additionally, ART affects cis-9-retinoic acid synthesis, resulting into dysregulation of adipocyte differentiation, apoptosis and increased hepatic triglyceride (53). The metabolic syndrome encountered in our study is higher than the 21.5% reported among PLWH in SSA (12). Metabolic syndrome arguably exists at high levels among PLWH in Uganda (5). Our findings on other components of metabolic syndrome are consistent with related studies investigating cardiometabolic risks among PLWH in Uganda (5, 13, 54). However, the reported prevalence of raised FBG is in stark contrast to findings from other SSA settings (5, 13, 37). This variation could stem from the differences in the analytical methods used, laboratory verses point of care testing (POCT), the latter often overestimates blood glucose (55). In addition, age, ART treatment regimen, duration on ART and time lived with HIV all of which have been shown to affect FBG differed considerably across these studies. High prevalence of low HDL-c among Ugandans appears to be a rather common occurrence. This is evidenced by the 2014 Uganda STEPS survey that reported a high prevalence (59.9% in men vs. 68.3% in women) of low HDL-c among the general Ugandan population (22). On the other hand, the observed low prevalence of LDL-c and total cholesterol may be linked to the high physical activity levels and fiber intake among our study participants. Both intensive and moderate exercises have been shown to significantly reduce total cholesterol and LDL-c in intervention studies (56). Likewise, dietary fibers particularly from whole grains have demonstrated beneficial cholesterol regulation functions (11). Noteworthy, the fiber intake in our study is generally higher than what is seen among Western populations (57).
Similar to other East African countries (58), diets in our study were predominantly carbohydrate-based and mainly roots, tubers, plantain and cereals and legumes. Intake of fruits and vegetables was four times lower than the WHO recommendation of at least 5 servings per day (59). The 2014 STEPS survey shows that consumption of fruits and vegetables among Ugandans is limited to just 1.4 servings a day with 88% of Ugandans not meeting the recommended fruits and vegetable intake while 27% do not eat fruit or vegetables a week (22). There is a sociocultural misconception toward fruit and vegetable intake among Ugandans where fruits are considered snacks for children and vegetables for poor people (42). In our study, women were at a higher risk of dietary protein inadequacy than men. The eating out of home tradition of men gives them access to foods of animal sources (60). The low intake of PUFA among our study participants could explain the high prevalence of low HDL-c observed (61).
Micronutrients have pivotal physiological functions in immune responses that influence HIV disease suppression consequently reducing viral load and overall mortality (60, 62). As such, quality of diet ameliorates micronutrient nutrition among PLWH (63). More than half of the participants had an intake below the EAR for Zn and Ca. On the other hand, adequate intake was met for vitamin C, K, Na and Se. Vitamin C and Se are potent antioxidants and enhance recovery of symptomatic PLWH (60). Specifically, vitamin C stimulates interferon production; a protein responsible for protecting cells against viral damage (60, 64). In regard to the B group vitamins, highest dietary deficiencies were observed for folate, B1, B2, B12 and B3. Adequate intake of B group vitamins is associated with improved clinical outcomes of HIV treatment and overall wellbeing of PLWH (65). In fact, vitamin B can reduce viral load and block the progression of HIV to AIDS (65–67). Inadequate dietary micronutrient intake especially vitamins A, C, riboflavin, folate and minerals Ca, Zn and Fe among PLWH is widely reported in SSA (58, 60, 68).
Study strengths
As far as we know, this is the first study in SSA to assess the dietary intake, cardiometabolic profiles and other related NCD risk factors simultaneously among PLWH. The use of MSM to obtain usual intake instead of the average intake as seen in most of the previous studies is an added strength of this study. Moreover, for comparison of energy and nutrient intake, we used more individual suited DRIs (EAR, AI and AR) instead of RDA. RDA may overestimate the nutrient requirements for an individual since its best suited as population-wide recommendation for nutrient intake (29, 30). The use of POCT for lipid profile is an invaluable rapid NCD risk finding technique especially in resource-constrained settings (69).
Study limitations
The 24-h dietary recall is prone to misreporting of the actual intake and food seasonality bias. As such the season of the study can have influence on the dietary intake of participants. Another potential drawback is that participants were recruited by a non-random sampling technique which introduces a sampling bias. Moreover, since participants were drawn from only Wakiso district which is composed of both urban and peri-urban settings, our results may not be representative of the general HIV community care model. There's still contention on dependability of total cholesterol POCT results (70). The use of IPAQ to assess physical activity has both intrinsic and extrinsic pitfalls such as recall bias and overestimation (71).
Conclusion
Our findings reveal that metabolic disturbances exist at high levels among ART-treated patients in Uganda. This study further highlights the inadequate intake of fruits and vegetables underlining the need for dietary optimisation to improve both macro and micronutrient intake.
Data availability statement
The original contributions presented in the study are included in the article/Supplementary material, further inquiries can be directed to the corresponding author.
Ethics statement
The studies involving human participants were reviewed and approved by Uganda National Council for Science and Technology. The patients/participants provided their written informed consent to participate in this study.
Author contributions
TK, CM, PO, BM, PY, and FK conceived and designed the study. TK and FK contributed to data collection and sample analysis. TK, PY, BV, and CM analyzed, interpreted the data, wrote, edited, and reviewed the manuscript. All authors read and approved the final version.
Funding
This study was funded by the Belgian Directorate General for Development Cooperation and Humanitarian Aid (DGD), for funding through the VLIR-UOS framework.
Acknowledgments
We would like to thank Susan Nakaayi, Katherine Nakatudde, Winnie Nabbanja and the study team for making participants' recruitment possible. We also thank the AIDS Support Organisation (TASO) for allowing us access to the patients in CDDPs of Wakiso district.
Conflict of interest
The authors declare that the research was conducted in the absence of any commercial or financial relationships that could be construed as a potential conflict of interest.
Publisher's note
All claims expressed in this article are solely those of the authors and do not necessarily represent those of their affiliated organizations, or those of the publisher, the editors and the reviewers. Any product that may be evaluated in this article, or claim that may be made by its manufacturer, is not guaranteed or endorsed by the publisher.
Supplementary material
The Supplementary Material for this article can be found online at: https://www.frontiersin.org/articles/10.3389/fnut.2022.976744/full#supplementary-material
References
1. UNAIDS. Fact sheet–World AIDS Day. (2021). Available online at: https://www.unaids.org/sites/default/files/media_asset/UNAIDS_FactSheet_en.pdf.
2. Avert Organisation. HIV and AIDS in Uganda. (2019). Available online at: https://wwwavertorg/printpdf/node/407 August
3. Karamchand S, Leisegang R, Schomaker M, Maartens G, Walters L, Hislop M, et al. Risk factors for incident diabetes in a cohort taking first-line nonnucleoside reverse transcriptase inhibitor-based antiretroviral therapy. Medicine. (2016) 95:e2844. doi: 10.1097/MD.0000000000002844
4. Crum-Cianflone N, Roediger MP, Eberly L, Headd M, Marconi V, Ganesan A, et al. Increasing rates of obesity among HIV-infected persons during the HIV epidemic. PLoS ONE. (2010) 5:e10106. doi: 10.1371/journal.pone.0010106
5. Muyanja D, Muzoora C, Muyingo A, Muyindike W, Siedner MJ. High prevalence of metabolic syndrome and cardiovascular disease risk among people with HIV on stable ART in southwestern Uganda. AIDS Patient Care STDS. (2016) 30:4–10. doi: 10.1089/apc.2015.0213
6. Nguyen KA, Peer N, Mills EJ, Kengne AP. A meta-analysis of the metabolic syndrome prevalence in the global HIV-infected population. PLoS OnE. (2016) 11:e0150970. doi: 10.1371/journal.pone.0150970
7. Schulte-Hermann K, Schalk H, Haider B, Hutterer J, Gmeinhart B, Pichler K, et al. Impaired lipid profile and insulin resistance in a cohort of Austrian HIV patients. J Infect Chemother. (2016) 22:248–53. doi: 10.1016/j.jiac.2016.01.007
8. Mondy K, Overton ET, Grubb J, Tong S, Seyfried W, Powderly W, et al. Metabolic syndrome in HIV-infected patients from an urban, midwestern US outpatient population. Clin Infect Dis. (2007) 44:726–34. doi: 10.1086/511679
9. Ddamulira C, Nsereko N, Musoke M, Kiyingi FP. Community based non communicable disease services as a predictor of improved quality of life of people living with HIV in Uganda: a randomized controlled trial. J Environ Sci Public Health. (2020) 4:304–17. doi: 10.26502/jesph.96120102
10. Jericó C, Knobel H, Montero M, Ordoñez-Llanos J, Guelar A, Gimeno JL, et al. Metabolic syndrome among HIV-infected patients: prevalence, characteristics, and related factors. Diabetes Care. (2005) 28:132–7. doi: 10.2337/diacare.28.1.132
11. National Cholesterol Education Program (US). Expert Panel on detection, evaluation, and treatment of high blood cholesterol in adults. Third report of the National Cholesterol Education Program (NCEP) Expert Panel on detection, evaluation, and treatment of high blood cholesterol in adults (Adult Treatment Panel III): The Program (2002).
12. Todowede OO, Mianda SZ, Sartorius B. Prevalence of metabolic syndrome among HIV-positive and HIV-negative populations in sub-Saharan Africa—a systematic review and meta-analysis. Syst Rev. (2019) 8:4. doi: 10.1186/s13643-018-0927-y
13. Kazooba P, Kasamba I, Mayanja BN, Lutaakome J, Namakoola I, Salome T, et al. Cardiometabolic risk among HIV-POSITIVE Ugandan adults: prevalence, predictors and effect of long-term antiretroviral therapy. Pan African Med J. (2017) 27:40. doi: 10.11604/pamj.2017.27.40.9840
15. Wakiso District Local Government District Health Profile 2020 17.12.2021 Available online at: https://wakiso.go.ug/wakiso-district-local-government-mild-may/ (accessed December 17, 2021).
16. World Medical Association Declaration of Helsinki: ethical principles for medical research involving human subjects. JAMA. (2013) 310:2191–4. doi: 10.1001/jama.2013.281053
17. Dickey RA, Bartuska D, Bray GW, Callaway CW, Davidson ET, Feld S, et al. AACE/ACE Position statement on the prevention, diagnosis, and treatment of obesity (1998 revision). Endocr Pract. (1998) 4:297–350.
19. World Health Organization. WHO STEPS Surveillance Manual: the WHO STEPwise Approach to Chronic Disease Risk Factor Surveillance. World Health Organization (2005). Report No.: 9241593830.
20. Hagströmer M, Oja P, Sjöström M. The international physical activity questionnaire (IPAQ): a study of concurrent and construct validity. Public Health Nutr. (2006) 9:755–62. doi: 10.1079/PHN2005898
21. Saunders JB, Aasland OG, Babor TF, De la Fuente JR, Grant M. Development of the alcohol use disorders identification test (AUDIT): WHO collaborative project on early detection of persons with harmful alcohol consumption-II. Addiction. (1993) 88:791–804. doi: 10.1111/j.1360-0443.1993.tb02093.x
22. Non-Communicable Disease Risk Factor Survey Uganda Report (2014). Available online at: https://www.who.int/ncds/surveillance/steps/Uganda_2014_STEPS_Report.pdf
23. Etter J-F, Le Houezec J, Perneger TV. A self-administered questionnaire to measure dependence on cigarettes: the cigarette dependence scale. Neuropsychopharmacology. (2003) 28:359–70. doi: 10.1038/sj.npp.1300030
25. Anono E, Walsh H, Kanerva N, Mubasu D, Okoth V, Clinton B, et al. Photographic Food Atlas for Kenyan Adolescents (9–14 Years). Kanerva, FN, Ed. Nairobi: KENFIN-EDURA (2018).
26. Harvest, Plus,. Available online at: https://www.harvestplus.org/node/562
27. Haytowitz D, Ahuja J, Wu X, Khan M, Somanchi M, Nickle M, et al. USDA National Nutrient Database for Standard Reference, Legacy. USDA National Nutrient Database for Standard Reference (2018).
28. Haubrock J, Nöthlings U, Volatier J-L, Dekkers A, Ocké M, Harttig U, et al. Estimating usual food intake distributions by using the multiple source method in the EPIC-Potsdam calibration study. J Nutr. (2011) 141:914–20. doi: 10.3945/jn.109.120394
29. Institute of Medicine Standing Committee on the Scientific Evaluation of Dietary Reference Intakes: Applications in Dietary Assessment (2000).
30. Trumbo P Schlicker S Yates A Poos M Food Food and Nutrition Board of the Institute of Medicine The The National Academies. Dietary reference intakes for energy, carbohydrate, fiber, fat, fatty acids, cholesterol, protein and amino acids. J Am Diet Assoc. (2002) 102:1621–30. doi: 10.1016/S0002-8223(02)90346-9
31. Lifestyle UT. Can Lifestyle Modifications Using Therapeutic Lifestyle Changes (TLC) Reduce Weight and the Risk for Chronic Disease?
32. FAO/WHO U. FAO/WHO GIFT. Global Individual Food consumption data Tool. Available online at: https://www.fao.org/gift-individual-food-consumption/methodology/food-groups-and-sub-groups/en/
33. Neveu V, Perez-Jiménez J, Vos F, Crespy V, du Chaffaut L, Mennen L, et al. Phenol-Explorer: an online comprehensive database on polyphenol contents in foods. Database. (2010) 2010:bap024. doi: 10.1093/database/bap024
34. Cornier M-A, Despres J-P, Davis N, Grossniklaus DA, Klein S, Lamarche B, et al. Assessing adiposity: a scientific statement from the American heart association. Circulation. (2011) 124:1996–2019. doi: 10.1161/CIR.0b013e318233bc6a
35. Uganda Demographic and Health Survey 2016. In: Kampala U, editor. Uganda Bureau of Statistics. Rockville, MD: The DHS Program ICF (2018).
36. Ben-Yacov L, Ainembabazi P, Stark AH, Kizito S, Bahendeka S. Prevalence and sex-specific patterns of metabolic syndrome in rural Uganda. BMJ Nut Prev Health. (2020) 3:11. doi: 10.1136/bmjnph-2019-000050
37. Clark SJ, Gómez-Olivé FX, Houle B, Thorogood M, Klipstein-Grobusch K, Angotti N, et al. Cardiometabolic disease risk and HIV status in rural South Africa: establishing a baseline. BMC Public Health. (2015) 15:1–9. doi: 10.1186/s12889-015-1467-1
38. Njelekela MA, Mpembeni R, Muhihi A, Mligiliche NL, Spiegelman D, Hertzmark E, et al. Gender-related differences in the prevalence of cardiovascular disease risk factors and their correlates in urban Tanzania. BMC Cardiovasc Disord. (2009) 9:1–8. doi: 10.1186/1471-2261-9-30
39. Sodjinou R, Agueh V, Fayomi B, Delisle H. Obesity and cardio-metabolic risk factors in urban adults of Benin: relationship with socio-economic status, urbanisation, and lifestyle patterns. BMC Public Health. (2008) 8:1–13. doi: 10.1186/1471-2458-8-84
40. Klassen K, Goff L. Dietary intakes of HIV-infected adults in urban UK. Eur J Clin Nutr. (2013) 67:890–3. doi: 10.1038/ejcn.2013.109
41. Pourcher G, Costagliola D, Martinez V. Obesity in HIV-infected patients in France: prevalence and surgical treatment options. J Visc Surg. (2015) 152:33–7. doi: 10.1016/j.jviscsurg.2014.12.001
42. Yiga P, Seghers J, Tafiire H, Tonny K, Muluta SN, Ogwok P, et al. Tackling the Health Beauty Paradox Through a Lifestyle Intervention Among Women of Reproductive Age in Urban Uganda, A Randomised Control Trial. unpublished.
43. Yiga P, Ogwok P, Achieng J, Auma MD, Seghers J, Matthys C. Determinants of dietary and physical activity behaviours among women of reproductive age in urban Uganda, a qualitative study. Public Health Nutr. (2021) 24:3624–36. doi: 10.1017/S1368980020003432
44. Gissing SC, Pradeilles R, Osei-Kwasi HA, Cohen E, Holdsworth M. Drivers of dietary behaviours in women living in urban Africa: a systematic mapping review. Public Health Nutr. (2017) 20:2104–13. doi: 10.1017/S1368980017000970
45. Okop KJ, Mukumbang FC, Mathole T, Levitt N, Puoane T. Perceptions of body size, obesity threat and the willingness to lose weight among black South African adults: a qualitative study. BMC Public Health. (2016) 16:1–13. doi: 10.1186/s12889-016-3028-7
46. Draper CE, Davidowitz KJ, Goedecke JH. Perceptions relating to body size, weight loss and weight-loss interventions in black South African women: a qualitative study. Public Health Nutr. (2016) 19:548–56. doi: 10.1017/S1368980015001688
47. Pedro MN, Rocha GZ, Guadagnini D, Santos A, Magro DO, Assalin HB, et al. Insulin resistance in HIV-patients: causes and consequences. Front Endocrinol. (2018) 9:514. doi: 10.3389/fendo.2018.00514
48. Dillon DG, Gurdasani D, Riha J, Ekoru K, Asiki G, Mayanja BN, et al. Association of HIV and ART with cardiometabolic traits in sub-Saharan Africa: a systematic review and meta-analysis. Int J Epidemiol. (2013) 42:1754–71. doi: 10.1093/ije/dyt198
49. WHO. Policy Brief: Update of Recommendations on First-And Second-Line Antiretroviral Regimens. World Health Organization (2019).
51. Keene CM, Griesel R, Zhao Y, Gcwabe Z, Sayed K, Hill A, et al. Virologic efficacy of tenofovir, lamivudine and dolutegravir as second-line antiretroviral therapy in adults failing a tenofovir-based first-line regimen. AIDS. (2021) 35:1423–32. doi: 10.1097/QAD.0000000000002936
52. Grinspoon S, Carr A. Cardiovascular risk and body-fat abnormalities in HIV-infected adults. N Engl J Med. (2005) 352:48–62. doi: 10.1056/NEJMra041811
53. Grunfeld C, Pang M, Doerrler W, Shigenaga J, Jensen P, Feingold K. Lipids, lipoproteins, triglyceride clearance, and cytokines in human immunodeficiency virus infection and the acquired immunodeficiency syndrome. J Clin Endocrinol Metabol. (1992) 74:1045–52.
54. Sander LD, Newell K, Ssebbowa P, Serwadda D, Quinn TC, Gray RH, et al. Hypertension, cardiovascular risk factors and antihypertensive medication utilisation among HIV-infected individuals in R akai, U ganda. Trop Med Int Health. (2015) 20:391–6. doi: 10.1111/tmi.12443
55. Szablowski CJ, Mercer KR, Manalang M, Suscha E, Moskowitz K, Anderson JH, et al. Differences between point-of-care blood glucose analyzers in identifying prediabetes. Diabetes. (2018) 67 (Supplement_1):2370–PUB. doi: 10.2337/db18-2370-PUB
56. Duvivier BM, Schaper NC, Bremers MA, Van Crombrugge G, Menheere PP, Kars M, et al. Minimal intensity physical activity (standing and walking) of longer duration improves insulin action and plasma lipids more than shorter periods of moderate to vigorous exercise (cycling) in sedentary subjects when energy expenditure is comparable. PLoS ONE. (2013) 8:e55542. doi: 10.1371/journal.pone.0055542
57. Stephen AM, Champ MM-J, Cloran SJ, Fleith M, van Lieshout L, Mejborn H, et al. Dietary fibre in Europe: current state of knowledge on definitions, sources, recommendations, intakes and relationships to health. Nutr Res Rev. (2017) 30:149–90. doi: 10.1017/S095442241700004X
58. Onyango AC, Walingo MK, Mbagaya G, Kakai R. Assessing nutrient intake and nutrient status of HIV seropositive patients attending clinic at Chulaimbo Sub-District Hospital, Kenya. J Nutr Metab. (2012) 2012:306530. doi: 10.1155/2012/306530
59. WHO Study Group on Diet Prevention of Noncommunicable Diseases World Health Organization. Diet, Nutrition, and the prevention of chronic diseases: report of a WHO study group. World Health Organ Tech Rep Ser. (1990) 797:1–204.
60. Isabirye N, Ezeamama AE, Kyeyune-Bakyayita R, Bagenda D, Fawzi WW, Guwatudde D. Dietary micronutrients and gender, body mass index and viral suppression among HIV-infected patients in Kampala, Uganda. Int J MCH AIDS. (2020) 9:337–49. doi: 10.21106/ijma.362
61. Lovegrove JA, Lovegrove SS, Lesauvage SV, Brady LM, Saini N, Minihane AM, et al. Moderate fish-oil supplementation reverses low-platelet, long-chain n– 3 polyunsaturated fatty acid status and reduces plasma triacylglycerol concentrations in British Indo-Asians. Am J Clin Nutr. (2004) 79:974–82. doi: 10.1093/ajcn/79.6.974
62. Jiamton S, Pepin J, Suttent R, Filteau S, Mahakkanukrauh B, Hanshaoworakul W, et al. A randomized trial of the impact of multiple micronutrient supplementation on mortality among HIV-infected individuals living in Bangkok. AIDS. (2003) 17:2461–9. doi: 10.1097/00002030-200311210-00008
63. Rawat R, McCoy SI, Kadiyala S. Poor diet quality is associated with low CD4 count and anemia and predicts mortality among antiretroviral therapy–naive HIV-positive adults in Uganda. J Acquir Immune Defic Syndr. (2013) 62:246–53. doi: 10.1097/QAI.0b013e3182797363
64. Lacey CJ, Murphy ME, Sanderson MJ, Monteiro EF, Vail A, Schorah CJ, et al. Antioxidant-micronutrients and HIV infection. Int J STD AIDS. (1996) 7:485–9. doi: 10.1258/0956462961918554
65. Kanter AS, Spencer DC, Steinberg MH, Soltysik R, Yarnold PR, Graham NM. Supplemental vitamin B and progression to AIDS and death in black South African patients infected with HIV. J Acquir Immune Defic Syndr. (1999) 21:252–3. doi: 10.1097/00126334-199907010-00011
66. Tang AM, Graham NM, Kirby AJ, McCall LD, Willett WC, Saah AJ. dietary micronutrient intake and risk of progression to acquired immunodeficiency Syndrome (AIDS) in human immunodeficiency virus type 1 (HlV-1)-infected homosexual men. Am J Epidemiol. (1993) 138:937–51. doi: 10.1093/oxfordjournals.aje.a116814
67. Abrams B, Duncan D, Hertz-Picciotto I. A prospective study of dietary intake and acquired immune deficiency syndrome in HIV-seropositive homosexual men. J Acquir Immune Defic Syndr. (1993) 6:949–58.
68. Audain KA, Zotor FB, Amuna P, Ellahi B. Food supplementation among HIV-infected adults in Sub-Saharan Africa: impact on treatment adherence and weight gain. Proc Nutr Soc. (2015) 74:517–25. doi: 10.1017/S0029665115000063
69. dos Santos Ferreira CE, França CN, Correr CJ, Zucker ML, Andriolo A, Scartezini M. Clinical correlation between a point-of-care testing system and laboratory automation for lipid profile. Clinica Chimica Acta. (2015) 446:263–6. doi: 10.1016/j.cca.2015.04.036
70. Akbar R, Khawaja KI, Mahmood S, Goon IY, Chambers JC, Sarwar S, et al editors. Use of point-of-care cholesterol testing in population based non-communicable disease surveillance: caveats and challenges. Proceedings. (2020). doi: 10.47489/p000s343z7541-9mc
Keywords: dietary intake, cardiometabolic, metabolic syndrome, HIV, AIDS, polyphenol
Citation: Kiyimba T, Kigozi F, Yiga P, Mukasa B, Ogwok P, Van der Schueren B and Matthys C (2022) The cardiometabolic profile and related dietary intake of Ugandans living with HIV and AIDS. Front. Nutr. 9:976744. doi: 10.3389/fnut.2022.976744
Received: 23 June 2022; Accepted: 25 July 2022;
Published: 11 August 2022.
Edited by:
Almudena Ortega-Gómez, Universidad de Málaga, SpainReviewed by:
Shailaja Patil, BLDE University, IndiaEmyr Reisha Isaura, Airlangga University, Indonesia
Ingrid Webster, Stellenbosch University, South Africa
Copyright © 2022 Kiyimba, Kigozi, Yiga, Mukasa, Ogwok, Van der Schueren and Matthys. This is an open-access article distributed under the terms of the Creative Commons Attribution License (CC BY). The use, distribution or reproduction in other forums is permitted, provided the original author(s) and the copyright owner(s) are credited and that the original publication in this journal is cited, in accordance with accepted academic practice. No use, distribution or reproduction is permitted which does not comply with these terms.
*Correspondence: Christophe Matthys, Y2hyaXN0b3BoZS5tYXR0aHlzQHV6bGV1dmVuLmJl
 Tonny Kiyimba
 Fred Kigozi
 Peter Yiga
 Barbara Mukasa
 Patrick Ogwok
 Bart Van der Schueren
 Christophe Matthys