
94% of researchers rate our articles as excellent or good
Learn more about the work of our research integrity team to safeguard the quality of each article we publish.
Find out more
REVIEW article
Front. Nutr., 12 October 2022
Sec. Food Chemistry
Volume 9 - 2022 | https://doi.org/10.3389/fnut.2022.973457
This article is part of the Research TopicSpectroscopic Applications for Quality Profiling and Authentication of Food ProductsView all 5 articles
 R. Pandiselvam1*
 V. Prithviraj2M. R. Manikantan1*
 Anjineyulu Kothakota3
 Alexandru Vasile Rusu4,5
 Monica Trif6*
 Amin Mousavi Khaneghah7
The qualitative and quantitative evaluation of agricultural products has often been carried out using traditional, i.e., destructive, techniques. Due to their inherent disadvantages, non-destructive methods that use near-infrared spectroscopy (NIRS) coupled with chemometrics could be useful for evaluating various agricultural products. Advancements in computational power, machine learning, regression models, artificial neural networks (ANN), and other predictive tools have made their way into NIRS, improving its potential to be a feasible alternative to destructive measurements. Moreover, the incorporation of suitable preprocessing techniques and wavelength selection methods has arguably proven its practical feasibility. This review focuses on the various computation methods used for processing the spectral data collected and discusses the potential applications of NIRS for evaluating the quality and safety of agricultural products. The challenges associated with this technology are also discussed, as well as potential future perspectives. We conclude that NIRS is a potentially useful tool for the rapid assessment of the quality and safety of agricultural products.
Agro-based processing industries are trending toward the production of fresh and minimally processed commodities. In this context, new processes and products are now available on the market, driven by consumer interest. Agricultural products are the main raw material for many food industries (1, 2). They are highly perishable in ambient conditions and thus have a limited shelf life, which can be extended under refrigerated storage conditions. Because fruits and vegetables cannot be stored for a long time due to their susceptibility to deterioration, particularly microbial and chemical spoilage, the various processes in the post-harvest supply chain, such as grading and sorting, should be completed immediately after harvesting.
The use of proper analytical methods to ensure the quality and safety of end products is necessary before processing and throughout the post-harvest supply chain (3). However, conventional methods for detecting defects in fruits and vegetables have several disadvantages: The evaluation of raw fruit quality, cultivar authenticity, and damage to the products pose challenges to The evaluation of the quality of the raw fruit and the authenticity of the cultivar, as well as the assessment of any damage to the product, pose challenges to collecting good quality inputs from farmers or wholesale dealers. Many kinds of damage cannot be detected with a visual inspection alone, thus rendering the process of selecting high-quality products insecure. Conventional testing methods, such as sampling from big lots, are time-consuming and expensive (4–7). Moreover, a significant amount of product is often destroyed during conventional testing and sampling.
Specific techniques are needed to, for example, detect sun scaling in apples and weed out the defectives, as such injuries do not have any chemical treatments (8). Apples can also have internal browning issues that are not visible on the surface (9), thus again ruling out the possibility of visual detection. Similarly, fruits are often kept in refrigerated conditions to extend shelf life, but this poses a risk of causing chilling injury, which cannot be detected by peel color or any other aspect of external appearance (10). Therefore, the standard practice of local markets is to determine the price of fruits and vegetables based on their physical attributes, estimated quantitatively and qualitatively (11).
Non-destructive analytical methods thus play a vital role in overcoming the challenges of conventional laboratory methods. In this aspect, near infrared spectroscopy (NIRS), combined with predictive algorithms, is best suited to assessing product quality and damage detection and for identifying cultivars (12).
A NIR spectroscopic system consists mainly of an interconnected light source, spectrometer, and computer, as shown in Figure 1. (This diagram shows the simplest representation possible, and does not account for a more practical NIRS system). The light source emits photons in the infrared region, which come into contact with the sample, and their further interactions create vibrations or stretching (13) in the molecules in the interior of the sample. These vibrations create a spectrum dependent on the properties of the molecule and their corresponding chemical bonds. These spectral profiles are dominant in specific parts of the spectrum. For instance, molecules like chlorophyll vibrate in the 500–750 nm region (8, 9) and O-H bonds in water in the 970–1,150 nm region (9). The spectra have to be analyzed with specific preprocessing techniques to eliminate noise and unwanted and redundant information. Later on, preprocessing techniques is implemented to find the effective wavelength, which spans certain portions of the spectrum in a way that can precisely classify the product, as shown in Figure 2. A properly built model can ably classify the product with little or no mistakes. Care should be taken when designing a NIR spectroscopic system to conduct a perfect analysis, using standard methods, with minimum time delay and high accuracy. The standard error in a laboratory (SEL) may lead to a standard error in prediction (SEP), which should be minimized during quantitative prediction with proper methods.
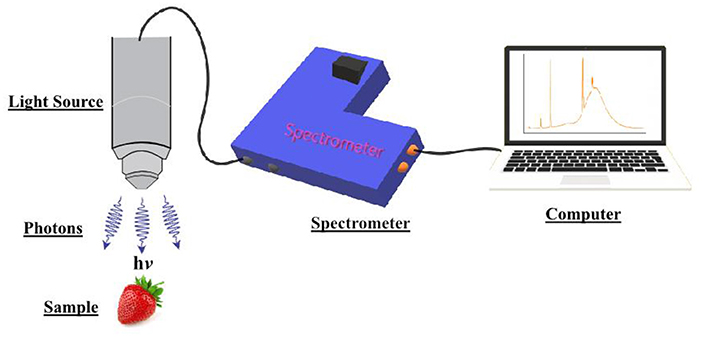
Figure 1. Spectral data collection unit.
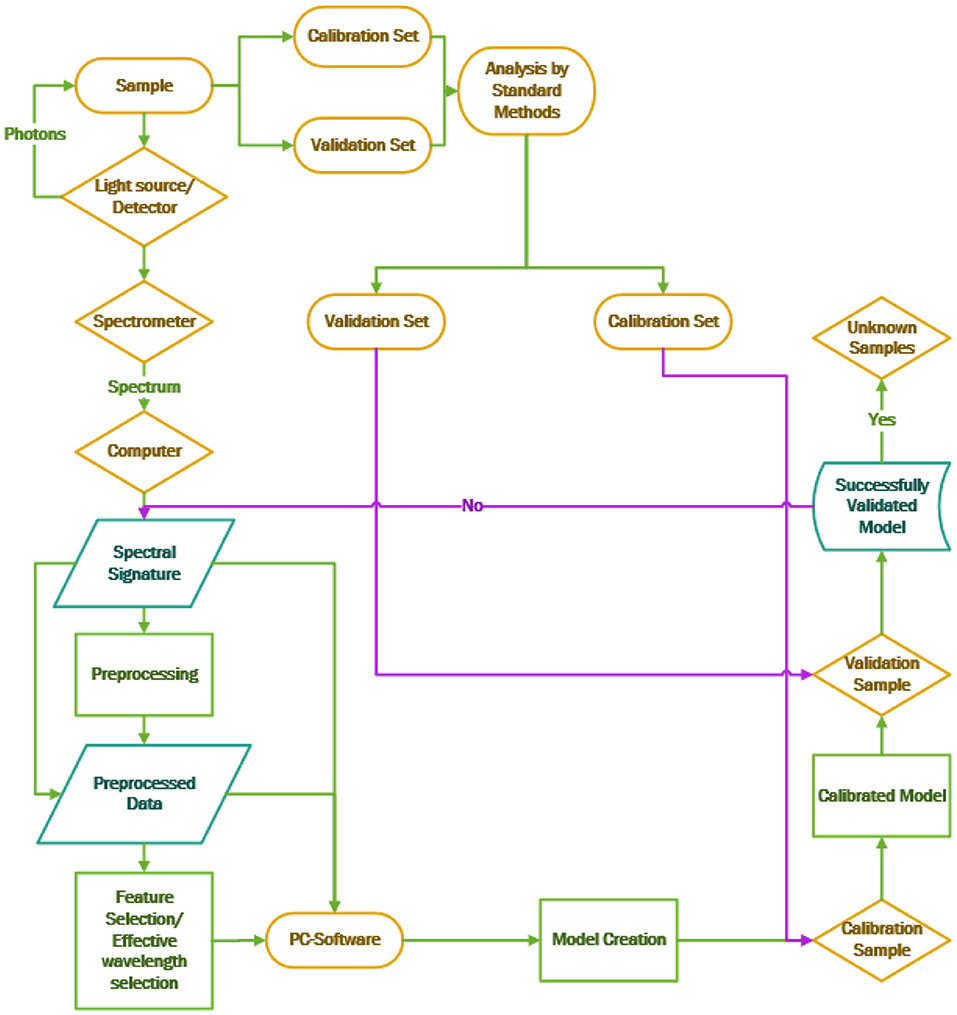
Figure 2. Flow chart depicting the NIRS modeling process.
NIR spectroscopy applications have been reviewed for the processing of cereals processing (14) and seafood (15), for various applications with dairy products (16), and for quality analysis of meat and spices (4, 17). Nevertheless, it is paramount to understand the various applications of NIRS for agricultural products, as these applications could pave the way to preparing high-quality end products from these raw materials. In this context, the present review discusses various NIR spectroscopy measurement techniques and optimization strategies used in agricultural products.
Food products, and their reliability, depend on the quality of the products from which they are derived. NIR spectroscopy is one of the best methods for predicting the primary characteristics of these products, viz. total soluble solids (TSS), soluble solids content (SSC), titratable acidity (TA), and pH, using spectral signatures and algorithms. The various applications of NIRS for determining the quality of agricultural products are shown in Table 1.
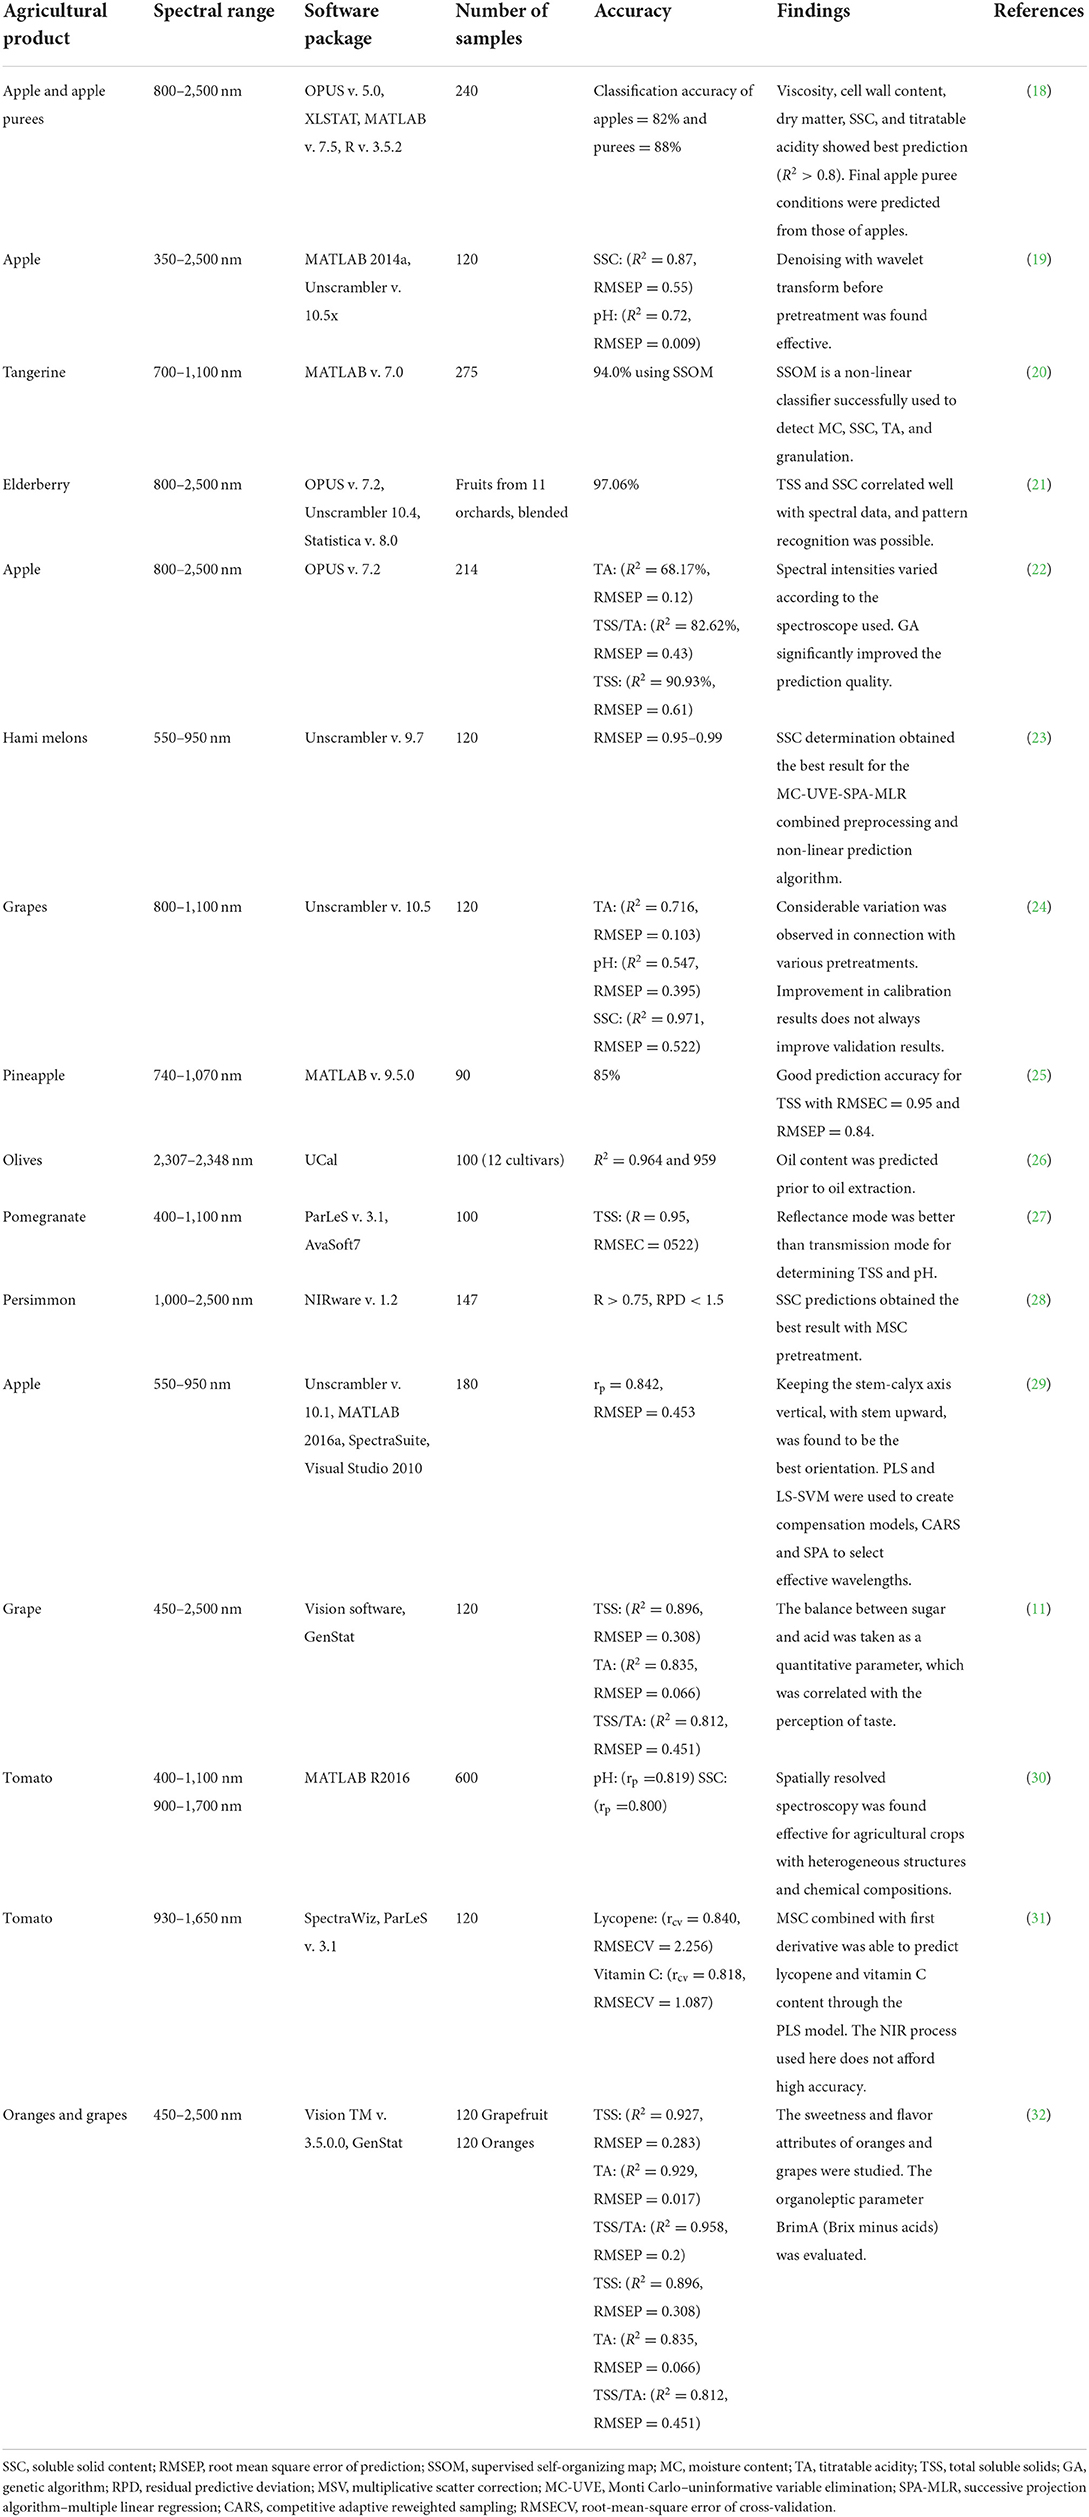
Table 1. Uses of NIRS to determine the quality aspects of various agricultural products.
A study conducted by Lan et al. on apple quality evaluated the characteristics of the puree produced from the same. The apples' spectral details were used to predict viscosity, cell wall content, dry matter, SSC, and puree product TA. The parameters mentioned above showed R2 values greater than 0.8, indicating the method's accuracy (18). The study's spectral measurements were carried out in a range of 800–2,500 nm using an automatic sampling wheel with 18 different positions. However, methods using six optical fibers (9) or manual positioning are more realistic and accurate. This may be due to the consistency of the sampling wheel setup. The SSC content determination resulted in an R2 value of 0.92 due to the homogeneity of the puree product (18).
The algorithms perform best when the product is homogeneous rather than inconsistent. Similar investigations were conducted on calçot onions and on apple purees, and also obtained accurate predictions for soluble solids, glucose, malic acid, and dry matter (33, 34). These studies indicate that the quality evaluation of purees can be successfully performed using spectral analysis.
In these scenarios, the use of partial least squares (PLS) models with TSS prediction resulted in R2 = 0.95, better than any other parameters (27). However, rheological constants and color values were found to underperform. This may be due to the non-linear nature of rheological variations or the overlapping of spectral bands (33). Prediction of puree characteristics by evaluating the quality of intact apples was challenging and semi-quantitative, suitable for the industrial process (33). NIRS works based on the chemical compositions and photon response; thus, processing commodities and converting raw produce to value-added end product will drastically alter the product's chemical nature. This may be why more latent variables and lower accuracy are obtained in predicting the quality characteristics of processed products.
Khodabakhshian et al. conducted internal quality studies on pomegranates using both transmittance and reflectance modes in the 400–1,100 nm range. Their study evaluated the model performance by using the predicted residual error sum of squares (PRESS) method as a cross-validation technique in the regression analysis. The usual pretreatments, particularly standard normal variate (SNV_ and multiplicative scatter correction (MSC), were carried out, thus accounting for the morphological variation in the pomegranate varieties (27).
Practical case scenarios always need to account for morphological variation. Therefore, while SNV and MSC preprocessing can be used, it may not be the same for all situations. The overall characteristics of both the reflectance and transmittance spectra were similar and formed peaks in the 750 and 970 nm ranges, though more noise was observed in the transmittance spectra (27). The spectra obtained with wavelength depicted irregular spikes all over the data, indicating the noise problems. Distinctive peaks for spectral signature are the preferred method for NIRS analysis. Interestingly, preprocessing techniques remained similar for most of the quality traits irrespective of the crop, demonstrating the potential for efficiency at the point of analysis. Both transmittance and reflectance methods performed similarly, though the latter had a slight upper hand due to its higher penetrating power (21, 35, 36) and more robust system. Thin-peeled fruits such as pomegranate obtained improved results in reflectance mode, suggesting that this method can be used for thick-walled fruits such as coconut, areca nut, and cocoa.
An extensive study on SSC determination conducted by Hu et al. studied various measuring configurations, variable selection algorithms, and classification models with Hami melons. In this context, the calyx model performed the best, which could be due to the higher SSC content in the calyx region (23). This result can be further interpolated to obtain the best prediction results after all preprocessing. The measurement should be taken at the most prominent part of the attribute.
A similar study performed on apples incorporated a greater number of orientations, which resulted in the selection of stem-calyx vertical, with stem upward, as the optimal direction (29). This suggests that whether one orientation performs better than others is due to the prominence of the factor in the oriented region. Various combinations of variable selections and prediction algorithms suggest that the Monte Carlo–uninformative variable elimination–successive projections algorithm (MC-UVE-SPA) attained the best results with all prediction algorithms for SSC determination (Rp>0.8) (23). Xia et al. found that CARS-SPA-PLS performed best for SSC prediction in apples, obtaining a low root mean square error of prediction (RMSEP) of < 0.573° brix. They also found that the determination of effective wavelength from a global model could help reduce the effect of orientation to a certain limit (29).
Selecting effective wavelengths that correspond well to the regions that classify samples can reduce equipment expenses, as demonstrated by a study on a banana quality evaluation where the lowest possible wavelength window was suggested (37). The effective wavelength of each agricultural product varies and therefore needs to be standardized during spectral analysis. In bananas and apples, this variation of change in the effective wavelength may be due to differences in color and overall composition. We can thus deduce that orientation, effective wavelength, products used, and equipment design should be considered while designing an online measuring system for optimum performance. Various studies have been able to predict SSC content with > 0.9, obtaining better results than with other factors, such as TA and pH (24). Similarly, the TSS content of pineapple was compared by combining various algorithms (25). This latter study, which used a handheld spectrometer, obtained an accuracy rate of 85% with an RMSEC of 0.95 and an RMSEP of 0.84 (25). This technology offers the best practical results in terms of feasibility and future perspectives, even with using handheld equipment.
Kanchanomai et al. (24) investigated potential rapid evaluation techniques by determining the quality of grapes using SSC, pH, and TA. The SSC prediction obtained an Rp value of 0.97, whereas TA (Rp = 0.71) and pH (Rp = 0.54) were comparatively less accurate. Firmness and seedlessness were also studied, but these factors also had low prediction accuracy. The researchers concluded that a NIR range of 800–1,100 nm could be suitable for predicting internal quality in grapes. Similarly, table grapes were analyzed using various preprocessing techniques and a NIR range of 400–1,000 nm (27, 38). The proper preprocessing technique improved the RPred from a range of 0.6 to 0.8052 and above when Savitzky-Golay's second derivative (SG2) was applied. This suggests that various factors such as pH, TSS, and firmness can be predicted by applying SG2 preprocessing in table grapes. The better results obtained can be justified using the proper wavelength range and preprocessing technique used on table grapes.
A combination of back propagation neural network (BPNN), generalized regression neural network (GRNN), and particle swarm optimization (PSO) was used in order to determine SSC and total acidic content (TAC) in apples (39). This study focused on developing a hybrid artificial neural network (ANN) model, as mentioned with earlier techniques; this was necessary to overcome the inherent limitations within ANN. The results showed that, during SSC prediction, the hybrid model and BPNN model had nearly the same RMSEC and RMSEP values (<0.6 and <0.7, respectively), whereas the GRNN did not perform well (values of >0.6 and >0.9, respectively). However, during TAC determination, the GRNN and hybrid models had low RMSEC and RMSEP values (<0.1), whereas BPNN did not perform well (>0.2). This confirms that an adaptation of hybrid models indeed increased the versatility of the algorithms to determine various quality attributes rather than having them to be changed with the parameter.
In terms of online determination methods, various systems have been explored for use with apples, mangoes, and bananas. Proper orientation of the product, as indicated in the previous finding, proved to be one of the key challenges facing the online system design. In an effort to address this challenge, the use of the CARS-SPA-PLS model after SGS was studied and was found to be effective in apples (29), with an rp > 0.8. A similar system of MCARS-SPA-PLS was suggested for online apple prediction with higher accuracy. These algorithms can handle biological variability and tackle orientation issues during prediction. Online systems were found highly suitable for squash (40) and juice products, irrespective of the orientation challenges. This is likely due to the inconsistency in the fruits and homogeneity in the value-added products.
Highly perishable produce such as banana needs rapid quality analysis measures. An online conveyor system for the same was designed that took TSS, pH, dry matter (DM), and acid-brix ratio (ABR) into account (37). During the validation phase, corresponding R2 values of 0.81, 0.78, 0.78, and 0.87 were found, indicating highly accurate prediction results. The study also selectively carried out preprocessing for both pH and ABR, which improved the prediction results. The accuracy of online detection was higher for apples, as the combination of algorithms 'successfully managed the difficulties of product orientation. Therefore, similar combination algorithms need to be adapted for online systems, given the challenges of performing these measurements with precise orientation.
Texture is one of the key factors influencing the quality, feel, and appearance of agricultural products. The most common parameters used to measure the textural quality of fresh produce are firmness and penetrometer readings (41, 42). Some studies have analyzed a wider variety of parameters, viz. fracture force, hardness, apparent modulus of elasticity, compressive energy (43), initial firmness, average firmness, rupture force of peel, rupture distance, penetration energy, and penetration force (42). These parameters can distinguish varieties (41), as different species and biological conditions have unique ranges. It is also worth noting that some studies have opted to use a universal testing machine (UTM) rather than a textural analyzer for evaluating the firmness and penetration depth of more oversized objects.
The summary of the various applications of NIRS for measuring the textural qualities of agricultural products is depicted in Table 2. Sánchez et al. (44) analyzed spinach texture using a handheld NIR device connected to a micro-electrical mechanical system (MEMS). The researchers used a simple handheld device for NIR measurement, thus demonstrating the utility of compact, practical technologies over more complex, high-cost instruments. The response of the NIR spectroscopy to CH, OH, and NH bonds and their absorbance patterns creates crests and troughs (41) in the spectral signature, which is the base of analysis. It was observed that the use of the handheld spectrometer resulted in an R2 value nearly equal to 1. The commodities used in the experiment were taken from different farms in Spain. Practices like this (i.e., that aggregate a greater amount of varieties and biological variations) allow for better calibration and data processing, which in turn contributes to the building of more robust prediction systems and, ultimately, yields better results.
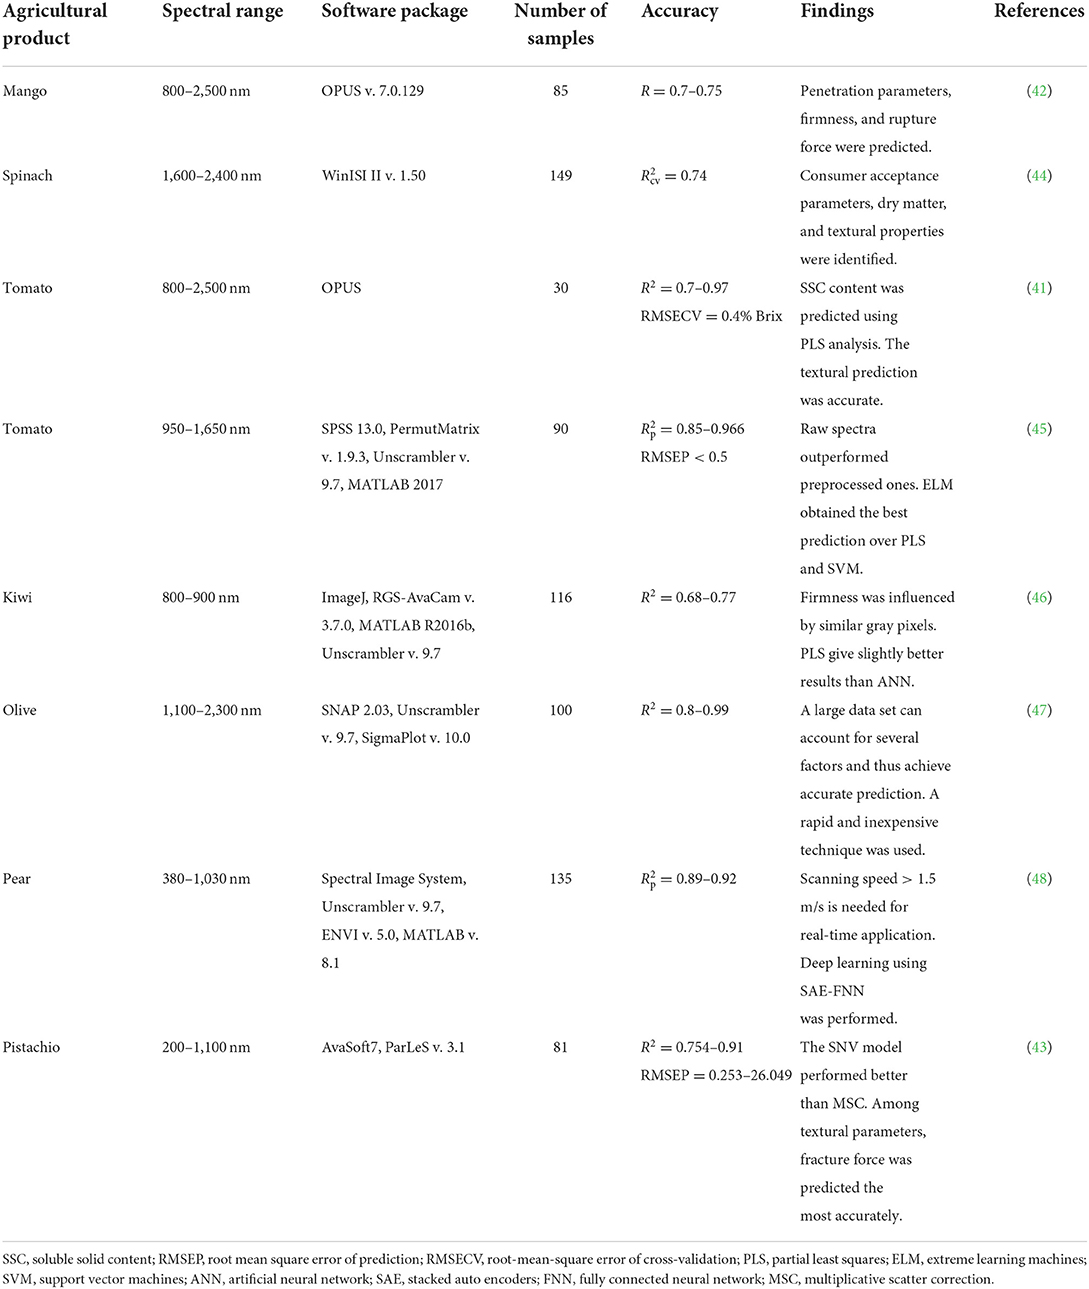
Table 2. Uses of NIRS to determine the textural properties of agricultural products.
This assertion is supported by findings from other studies, an investigation of methods for determining tomato texture in which tomatoes in similar maturity groups gave distinct clusters in a scatter plot (41). Distinct clusters will not account for the various maturity stages and varieties present in the sample; therefore, the sample size should be increased to create a better performing model. The textural tests were performed using a universal testing machine rather than a textural analyzer (44, 47). The food matrix tested for puncture force, toughness, stiffness, fracture point (44), and firmness (47). Maximum force to puncture the leaf (r2cv = 0.67; RPDcv = 1.72), toughness (r2cv = 0.62; RPDcv = 1.62), stiffness (r2cv = 0.69, RPDcv = 1.79) and the displacement of the probe necessary to fracture each leaf (r2cv = 0.62, RPDcv = 1.61) (44). Similarly, a firmness measurement performed on olives recorded a high R2 value of 0.997, indicating excellent-quality predictions of this parameter (47). There is a significant improvement in R2 value with suitable preprocessing, as illustrated by a study on pistachio kernels comparing raw data and various preprocessed data (43).
The selection of the preprocessing method to be used with textural analysis depends on the parameter under study and the instruments used in the measurement. A study conducted by Mohammadi-Moghaddam et al. (43) was able to model better-performing PLS models for textural analysis after various pretreatments. It is worth noting that pretreatment is not always necessary, and that better results were obtained in determining the firmness of pears (via PLS regression) without preprocessing (48). Direct comparison between different pretreatments to determine the best choice is not possible, as it depends on several factors.
In olives, firmness is understood to correlate with maturity and oil content (47) due to the relationship between oil and dry matter. As these factors are mechanically and structurally connected, defining the mouth feel via NIRS can offer a non-destructive method of measurement. Although firmness prediction is a bit complicated, one study on olives obtained readings of 1,248, 1,449, 1,758, 1,917, 1,990, and 2,238 nm at peak regions using PLS regression, thus delivering high correlation and low error rates (47). A similar study using cherry tomato resulted in a firmness prediction of R2 = 0.966 (45). The algorithm for the extreme learning machine used in this study works by optimizing the hidden layers in the cross-validation step, thus solving practical problems (45).
Compression and penetrometer tests were performed together on tomatoes by Camps and Gilli (41), with the compression test demonstrating better prediction performance (R2 = 0.85–0.97). This observation is further supported by a study conducted on juicy stone fruits that found that the compression test was significant as the fruit matured (49). A textural analysis on tomatoes revealed that there are about 7–10 latent variables for compression parameters and anywhere between 3 and 8 for penetrometer parameters (41), and that data clustering may be the reason behind better R2 results. However, although clustered data can improve R2 values, the RMSE values may not differ much.
Studies on the correlation between texture and quality in mango suggest that, based on the R2 value, the parameter should either be used for rough screening or for thorough evaluation. On this basis, one study found that the parameters of pulp penetration force, peel rupture force, and penetration energy in the pulp can be used for rough screening (42). The authors also discussed the relationship between textural parameters and other factors such as maturity, storage time, and processing stage. Processing operations such as roasting can also cause a decrease in moisture content, resulting in more reflectance (43); similarly, a difference in amplitude of peak has been observed in pistachio kernels after processing. Camps and Gilli (41) studied three tomato varieties with 90 samples outperformed this study on the same parameters, although the sample size was 80 on a single variety. These results confirm both the highly variable characteristics of tomatoes and the research gaps regarding these characteristics. Yu et al. (48) proposed a deep learning model with a stacked auto-encoder (SAE) and fully connected neural network (FNN), where SAE was used to extract the features which were given as FNN input. An investigation conducted on pear fruit compared the PLS regression with a deep learning algorithm, and significantly better results were obtained for SAE-FNN (48). Deep learning predicted the R2 value in the range of 0.9, whereas the PLS regression could only reach values near 0.8 (48). Experiments on firmness prediction in kiwi fruit found that, on average, PLS (R2 = 0.77) performed better than ANN (R2 = 0.72) (46).
Authentication and traceability throughout the supply chain are essential, especially where technologies such as block-chain methods are implemented. Today's consumers are focused on authenticity; they demand traceability and strict quality controls in production. In recent years, NIRS, along with classification algorithms, has been integrated into supply and production chains to meet these demands.
The development of models that can discriminate between different genotypes of apples (50–53), bell peppers, (54), mangoes (55), pears (56), potatoes (57), and mulberries (7) using the NIR spectrum is summarized in Table 3. In practical terms, the sorting of these commodities should be done on a fast-moving conveyor system, but designing a spectrum-collecting system for this environment is troublesome. Because even agricultural products of the same variety can have different surface properties, obtaining multiple spectral samples, as large as 250 readings (7, 55, 59), is necessary. The sample size and the number of measurements needed are determined by the heterogeneity and complexity of the sample, such as whether the product is sliced (59). The heterogeneous nature of the sample is accounted for by techniques such as taking three or four different types of measurements; by the use of 120 and 90-degree rotations (54, 58); and by the use of fabricated fruit holders (59, 61) or by using the arrangement in the spectrometer. Standard NIR models require whole fruit cover scanning using arrangements of diode-array instruments (44), the integration of the sphere around them to recover information that is otherwise lost (52), and methods to keep the distance from fruit to measurement probe constant, irrespective of the size (50).
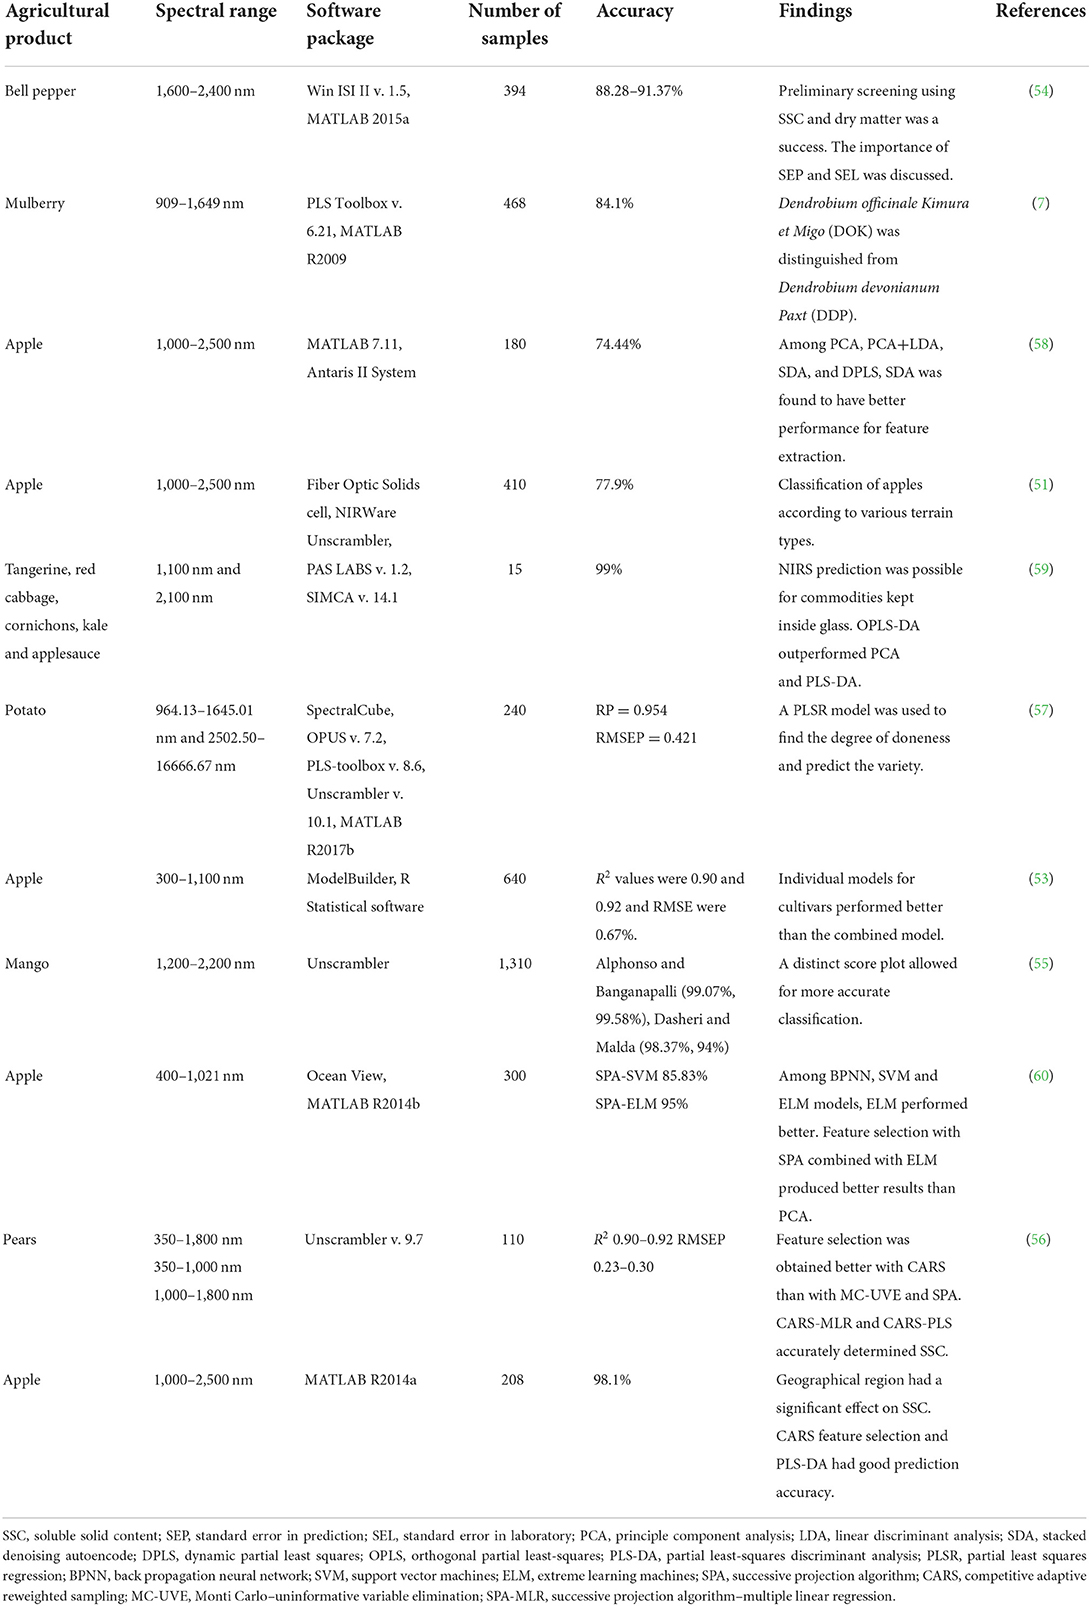
Table 3. Summary of variety and cultivar identification for various agricultural products using NIRS.
Most researchers are using the existing spectrometer system directly, and therefore more emphasis has been given to the classification methods. A broader range of photometers and a larger sample size can significantly improve the model (54). Broader models are useful for obtaining unique peaks in the spectrum that can discriminate between varieties. Because fluctuations in temperature and light play a vital role in creating the NIR model, care should be taken to keep the surrounding environment the same for all measurements (53).
For cultivar prediction, the input data are preprocessed using methods such as multiplicative scatter correction (MSC) (51, 55, 60), EMSC (50, 62), standard normal variate (SNV) (7, 51, 56), detrend (51, 55), normalization (58, 59), Savitzky-Golay (7, 50, 51, 61), and Norris gap (55). These are independent reference techniques for eliminating the unwanted effects of irrelevant information in the spectra (52). Without these techniques, the noise would be learned along with the true calibration data, causing over-fitting (53). The application of the various treatments is based on the corrections required by the scenario, and it is up to the researcher to decide which corrections are suitable. Preprocessing is a necessary step in variety detection because the produce being measured is in raw form, and the noise level can therefore be high. However, it should be kept in mind that the use of smoothing techniques, such as those listed above, to process raw data can result in the loss of valuable information.
The investigation of fruit and vegetable spectra using produce housed in glass containers during preprocessing did not yield better results than raw data, at least in a scenario where a reference-dependent orthogonal partial least squares (OPLS) model contained an integrated OSC filter (59). The filter's effectiveness was evaluated by a response permutation set and performance matrices, viz. sensitivity, specificity, efficiency, false negative, false positive, and true negative (59).
A direct spectral comparison may not always be possible due to crossovers and overlapping. Li et al. (60) measured 300 samples of apple and observed spectra between 400 and 1,021 nm, and all of which were largely similar to each other. The observed spectra consisted of various attributes, so dimension reduction techniques such as PCA and the score plot were later used for classification. Dimension reduction was necessary to eliminate irrelevant and redundant spectral variables (56). In the context of cultivar identification, PCA was able to retain 98% of the data for apple cultivation (51), which makes it an ideal feature extraction method.
Jha et al. (55) investigated the classification of apple varieties and obtained 99.07% and 99.58% accuracy for Alphonso and Banganapalli mangoes, respectively. Score plot variance typically decreases from PC1, PC2, and PC3; thus, most researchers use the first two (51) or the first three (50). The variety inherent within the identification process needs a score plot where similar results are grouped or clustered in one area. However, choosing PC2 and PC3 regardless of PC1 can result in better models with a better grouping (54). Variable selection should be made using the genetic algorithm (GA), the successive projection algorithm (SPA), Monte Carlo–uninformative variable elimination (MC-UVE), and competitive adaptive reweighted sampling (CARS), and these selected variables should be combined with PLS or multiple linear regression (MLR) in a later stage for predicting (7, 54, 61). Comparative evaluations of these techniques have suggested that CARS has the best performance, resulting in Rp values near 0.9 and RMSEP values near 0.5 (7, 52, 56). Pattern recognition can also be achieved using machine learning methods such as backpropagation neural networks (BPNN), support vector machines (SVM), and extreme learning machines (ELM). These methods are suitable for identifying the variety and geographical origin of fruits based on the spectrum. The number of factors and groups plays a substantial role in the performance of the model. Reducing the number of possible predictions increases the model's accuracy. In one study of apples from different orchard levels, for example, the models performed well only for classification between valley and mountain—i.e., a 2-variable model (51).
Individual models are more accurate than multivariate models (53), but multivariate models need to be developed in practical scenarios. In cases where individual models are deliberately selected for cultivar predictions, data overfitting and insufficient external validations are possible pitfalls (53). Model development requires a suitable training and testing set, and it is ideal to have the same number of training and testing sets for each of the varieties that need discrimination. If the number of elements is not equal between the training and testing sets, there can be a class imbalance, which can lead to biases within the model. Imbalances are usually dealt with by using under- and oversampling techniques, though other methods are possible; Zimmer and Schneider (59), for example, evaluated a well-handled model without treating class imbalance. Models are trained with data from destructive methods and laboratory evaluation. Therefore, the model's standard error in prediction (SEP) depends highly on the standard error in the laboratory (SEL). Sánchez et al. (54) suggested that SEP values greater than or equal to 5 times the SEL value indicate a model of unacceptable quality. For this reason, in a quantitative prediction, it is better to estimate the repeatability and reproducibility of measurements for better understanding. Most of the research comes with the significant caveat that external evaluation is lacking (53), but evaluation of this kind is necessary for a model used to predict cultivars and varieties from various places.
In the case of variety and cultivar identification, the models are used to classify qualitative data, and this automatically enables a quantitative classification (54), i.e., different cultivation locations confer a set of internal qualities that are unique to each variety (60). Eisenstecken et al. (51) and Li et al. (61) conducted experiments to determine varieties grown at different elevations, where quantitative factors (viz., carbohydrate, fructose, sucrose, glucose, sorbitol, and citric acid) displayed a predictable variation according to the elevation at which the fruit was cultivated. This knowledge, combined with a multi-origin regression model, can predict quality parameters such as pH, firmness, acidity, and moisture (52). Nevertheless, the models created during one season are not suitable for the next season due to natural variation in the environment, which in turn creates variation in crop attributes (53).
Maturity detection is one of the main uses of NIR in the context of agricultural products. Due to variations in biological factors, many crops do not have standard maturity indices (63). While there is no way to directly predict the maturity of the fruit, factors such as color, firmness, TSS, TA, and dry matter are often correlated with maturity. Among these parameters, color and the pigment component responsible for color are frequently used for maturity detection. This may be because the maturity of fruit was traditionally determined by analyzing the color with the naked eye. One NIR study of lipophilic antioxidants and firmness in tomatoes found a particular trend in the spectral lines as they approached maturity (64). Although this study is not directly related to maturity prediction, the results suggest the potential of NIR for maturity detection.
Fuzzy logic algorithms are among the most recent technologies introduced for maturity detection. Chen et al. (65) evaluated pomelo maturity using a least square support vector regression (LSSVR) model and PCA algorithm with “fuzzy-optimized” NIR data. Compared to ordinary PCA, the fuzzy transform PCA inhibits original data noise and emphasizes PC (65). The LSSVR model is represented by Equation 1.
where ω = matrix of regression weight; φ(x) = kernel function, which is taken as radial basis function (RBF); b = threshold.
The study divided the samples into three categories, viz. calibration, validation, and test. The test samples are not related to calibration or validation; therefore, they can be used to check whether the model is representative (65). The maturity parameter, which reflects color (L, a, b) values, is thus obtained using the model.
The various applications of NIRS for maturity detection are presented in Table 4. A study of maturity detection in grapes using PLS modeling included variable factors such as cultivar, location, ripeness level, and season (66). Compared with a study that considered only varieties collected from a single vendor for classification, validation, and testing, the former approach is more practical and industry-relevant. Creating the model on the 2016 variety and validating it with the 2017 variety (66) proved the model's long-term robustness. Obtaining the best possible prediction results for each of the parameters under study required the use of different preprocessing techniques; some examples are MSW+MSC for TSS and SNV for TA (66).
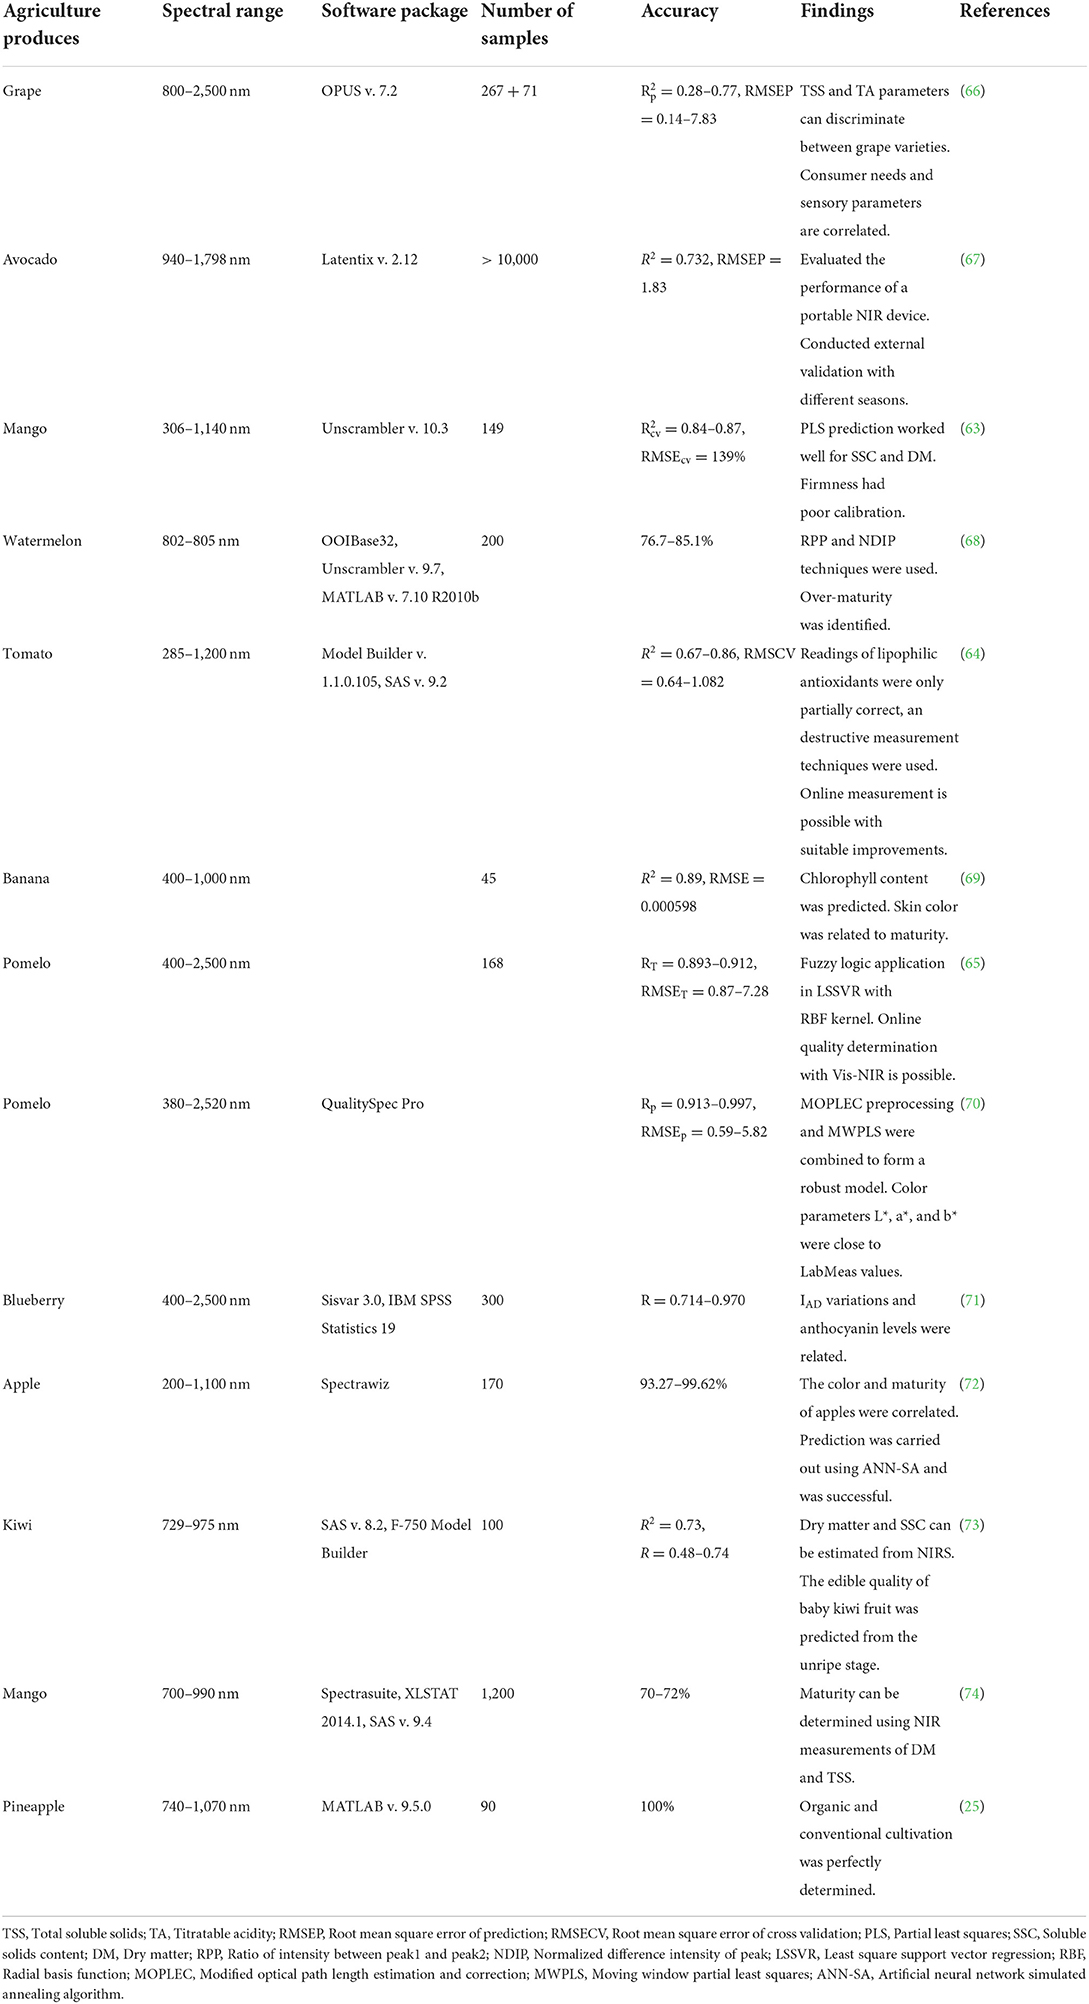
Table 4. Uses of NIRS for the maturity detection of various agricultural products.
The maturity of kiwi fruit and mango was predicted by measuring dry matter (DM) content and solid soluble content (SSC) (63, 73). Although SSC can be used for maturity detection by measuring the starch in the mesocarp converted to sugar, this method is not recommended in mangoes (63). An investigation of avocado fruits predicted their maturity by estimating moisture content (MC), but this method did not fit well due to the poor spectra obtained (67). The experiment underperformed at first due to poor peel penetration, but improved once the peel was removed. This suggests that NIR cannot be used for all purposes. Evaluations carried out with and without flesh had the same number of latent variables, but the former's R2 value was 0.6, which later improved to 0.8 (67). In light of these issues, the corresponding challenges in fruits with similar properties to avocado need to be addressed, and proper methods need to be formulated.
Temperature has a direct impact on spectral data due to the changing behavior of chemical compounds. Therefore, temperature should be stabilized before measurement, as has been done with kiwi fruit spectra (73). Kim et al. (73) also evaluated the use of Ca-Chitosan coating on kiwi fruit and its effect on maturity. The application of NIRS was able to increase SSC content due to a decrease in the ripening rate (73). The model was able to predict maturity, with R2 values of 0.73 (73), an acceptable result. Fascinatingly, these results show that applying coatings can change the spectral behavior due to the interaction between photons and the new chemical compounds. However, due to the use of algorithms and processing techniques, all coated fruits with the same compounds will show spectral differences only in other variables, such as SSC and DM, given that a uniform application is performed (Figure 3).
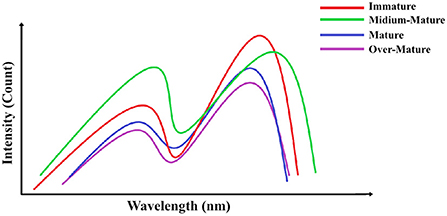
Figure 3. The spectral patterns of products at various stages of maturity.
Investigations of banana maturity by Saputro et al. (69) correlate chlorophyll content with maturity determination. A combination of PCA, PCR, and SVM achieved an RMSE value of 0.000598%, implying a good performance. The chlorophyll bands are situated in the 680–700 nm range, which was estimated with the help of NIRS (69). In mangoes, SSC determination was in the range of 699–999 nm and DM at 699–981 nm, which resulted in R2 = 0.874–0.87 in cross-validation (63).
Ribera-Fonseca et al. (71) evaluated the potential of a non-invasive tool to predict the fruit harvest date using maturity parameters. The device measures an index of absorbance difference (IAD), which has a high correlation with fruit quality parameters (71). This approach could not make use of any conventional algorithms; therefore, it relies on IAD values only. Maturation studies of mangoes by Polinar et al. (74) created a classification model that predicts mature and immature fruit. It was based on days after flower induction (DAFI) by setting the threshold as floaters <25%. Prediction of the ripe stage using these techniques was able to detect artificially ripened fruit with a bland taste (74). These innovations can be used to create auto sorting, identify higher-quality fruits, and prevent fraud in markets.
Watermelon maturity prediction was carried out using the ratio of peak (RP) method. The RP is used when two peaks have opposite intensity variation as the fruit matures. In watermelon, after calculating the ratio of the intensity of peak 1 and peak 2, the normalized difference intensity of peak (NDIP) was used to determine the maturity stage of the fruit (68). The SPA successive projection algorithm (SPA) was used for feature extraction, and least square support vector machines (LS-SVM) was used for classification purposes (68). The plot of the ratio of intensity between peak 1 and peak 2 (RPP) vs. maturity stages was able to distribute the fruit according to different maturity stages (68). Thus, the RPP alone distinguished various maturity stages, without performing PCA or LDA to plot with the highest variations. The correct classification rate (CCR) was highest for corrected RPP values (88.1%) with NDIP (85.1%) and lowest for LS-SVM (76.7%) (68). A high level of CCR is desirable, but at the same time, error parameters also need to be evaluated, which was not mentioned in this study.
Many studies rely on SSC and DM models that use PLS to predict maturity. Taking the spectral analysis to the next level requires the use of different applications, such as those that are used in robotics or that can process video. One study of Fuji apples applied NIR spectral analysis to video frames to detect maturation (72). Rather than the use of quantitative data and correlation, expert panelists were chosen to determine maturity. The processing computer used in the study had “entry-level” specifications by 2020 standards, thus demonstrating the affordability of the analysis, in contrast to “high-end” specifications. The classification model used was ANN combined with simulated annealing (SA). The SA sends out different vectors to ANN and finds the most suitable ANN structure (72). The method performed well, with accuracy rates above 90%, using the wavelength regions of 535–560 nm, 835–855 nm, or 950–975 nm (72).
Chen et al. (70) determined Shatian pomelo maturity by correlating color and maturity levels. Rather than conventional preprocessing methods, the multiplicative effect correction (MOPLEC), which corrects the change in optical path length, was used (70). This technique performed better in comparison to Savitzky-Golay smoothing and increased the signal-to-noise ratio (70). The preprocessing was followed by a moving window partial least square (MWPLS), which found a high signal wavelength combination for PLS modeling (70). MWPLS varies the location and number of adjacent wavelengths to find the optimum combination for PLS modeling (70). The study compared the raw data, SG- processed, and MOPLEC-processed data and found that Rv was highest for MOPLEC-processed data, showing on-par or better values than SG-processed data (70). The new techniques were able to perform better overall in predicting the maturity of pomelo from color. Therefore, these techniques need to be explored for other fruits to determine whether color prediction can be improved for them as well.
Fresh and minimally processed food commodities are in high demand these days, which raises the stakes on delivering commodities with minimal damage. Well sorted and less-damaged products increase consumer satisfaction, too. There is, however, a great deal of variation among horticultural products: Highly perishable commodities such as tomatoes can show the effects of bruises or damage within 48 h (75), whereas apples can take more than 50 days (8) to show any signs of damage on the outer surface. Harvested commodities should be promptly evaluated for damage to receive the commodity and then convert to any value-added products. Due to the short evaluation period, many food researchers and industries use non-destructive techniques such as NIR spectroscopy that can detect damage without any effects on the products (Table 5). Defects such as internal bruising in blueberries can be detected as soon as 30 min after mechanical impact, with an R2 of 0.7 (76). Because we can estimate the spoilage period and extent of damage, characterizing spectral signatures so as to detect damage or abnormalities could improve crop utilization (75).
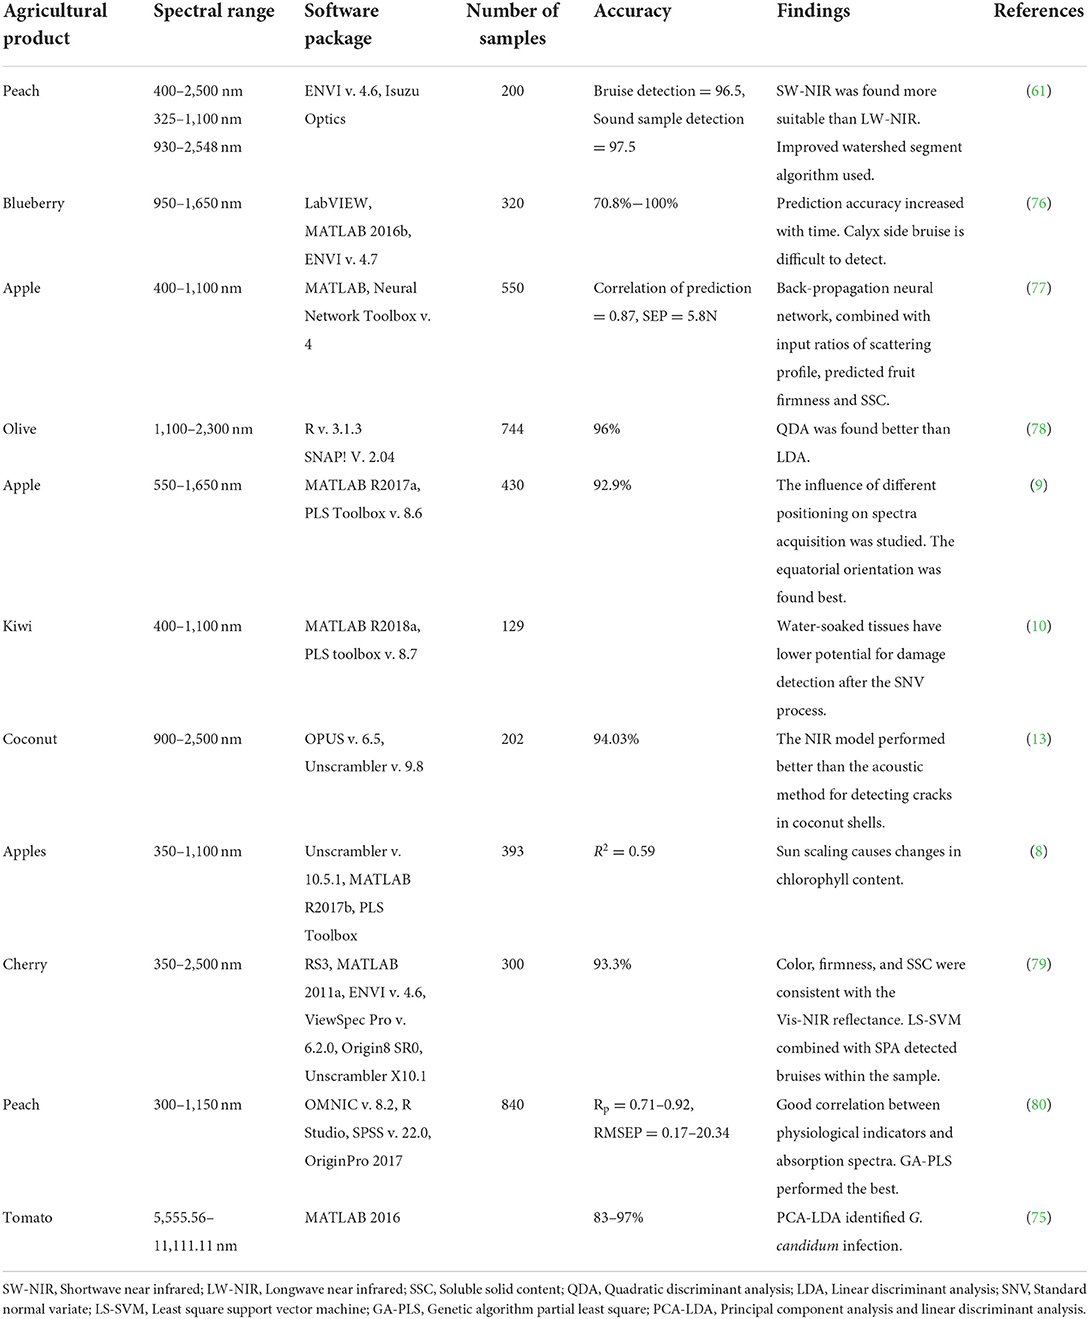
Table 5. Summary of NIRS applications for damage detection in agricultural products.
Damage predictions are conducted by spectral examination of the outer skin, known as the epidermis. Because the epidermis is the “interface” of the fruit structure, any unfavorable conditions can cause small changes (75) that may not be apparent in the 500–900 nm range (i.e., visible to the naked eye) (79). These changes can, however, be detected using NIR spectroscopy. However, some changes, such as oxidative browning, can be detected by the human eye due to the significant time lag involved (76).
In terms of collecting input for spectral processing, various configurations have been studied, viz. taking measurements in 90-degree rotations (10) or 120-degree rotations (13), contacting the epidermis (8), using 360-degree measurements (9), and taking multiple measurements at different points and averaging the values (75). In a comparison of apples held at different orientations for measurement, orienting apples along the equatorial region showed the highest potential for defect detection (9). This may be because this orientation exposes a greater amount of curved surface area, which allows for more sensitive measurements. However, the equatorial alignment yielded the worst results in detecting chilling injury in kiwifruit; in this context, results were better with alignment at the stylar end, likely because chilling symptoms begin at the end of the fruit (10). It was observed during a hyperspectral analysis of blueberries that the calyx end was misclassified as bruised; these data needed to be excluded to reduce the false positive rate and reduce the RMSEP of 0.1 to 0.13 (76). Therefore, the design of NIR systems to measure fruit characteristics should take into account both the defect to be detected and the algorithm used for analysis.
A 6-fiber individual measurement system performed better than the conventional single-point measurement system (9), as accuracy increased from 0.8% to 1.7% when average spectra were used. There is no single method best suited for measurement, because all measurements are post-processed using different methods. Re-orienting can take up a large amount of time needed for developing a commercial online system, which is not suitable. During the training, care should be taken to avoid any outliers, which can affect the classification accuracy by causing overfitting problems. Outliers, in the context of damage detection, refers to commodities that are severely damaged. These cause the PCA and LDA algorithms to underperform. An analysis of sunscald apples followed this procedure to avoid the highly damaged ones, thus increasing the classification accuracy (8). In practical terms, this is possible because severe defects are visible to the naked eye.
An experiment conducted to detect cracked coconut shells found that a PCA plot itself can be used to find the outliers in cases where it is impossible to observe the shell inside the husk (13). The PCA analysis will yield more relevant results once it is run only with effective wavelengths and with outliers eliminated. A PCA analysis of bruising on peaches, with effective wavelengths of 781, 816, 840, 945, and 1,000 nm, yielded a PC4 with high-contrast bruised area (60). When selecting the optimal wavelength, the successive projection algorithm (SPA) follows an iterative process, adding one more wavelength with each step, which reduces the complexity of dealing with the whole spectrum (79). During a bruise analysis of cherry, SPA with 3 variables had an accuracy rate of 96.6%, while the full spectra with 2 variables had a 96% accuracy rate with less computational load (79). A lower computational load, i.e., a shorter analysis time, is essential for the design of an inline system. During the bruising analysis, it was found that even slight damage to the control samples can cause a partiality in the classification model (76). One more caveat is the need to use an independent set of crops from a different region or season. The influences of spatial and temporal variability are still not accounted for by the usual classification algorithms, due to high biological variability. As seen in the detection of sunscald in apples from different years, the RMSEP for prediction was three times that of the calibration (8). The variability caused by biological variation, temperature fluctuation, and measurement positions can be accounted for, to an extent, by using classification models such as least square support vector machines (LS-SVM) (76).
The classification of defect detection is usually done subjectively, i.e., not quantitatively, meaning that human error can occur (10). When the spectra are used for chemometric or qualitative measurement, they should be immediately assessed after the spectral measurement to reduce errors caused by the increase of time (80).
The detection regions are explored by comparing the sound and damaged fruits using their spectral reflectance curves. These depict the reflectance vs. wavelength plot for both samples. Due to the changes caused by damage, there will be significant variation in some parts of the plot between sound and damaged produce, and these differing bands are used for classification. As far as the classification is considered, sound fruits are more homogeneous, and therefore easier to classify, than damaged ones (61). A consistent variation in the spectral sign is desirable for accurate separation (52). This approach also reduces redundant information and the time needed for processing. For SW-NIR and visible NIR, wavebands are selected instead of wave points, to reduce the complexity (80).
In an analysis of bruising on peaches, it was found that SW-NIR (7,801–1,000 nm) was more efficient than LW-NIR (1,000–2,500 nm) due to better contrast difference in the bruised area (60). During the analysis of HIS, wave points and regions of interest (ROI) are selected for analysis (61, 76), and they also provide the spatial distribution of the bruises. Upon correlating the significant effect of the epidermis and spectral curve on research, we observe that pigments such as carotenoids and chlorophyll bands provide promising regions of variation, viz. at around 670 nm for the chlorophyll band (8, 10, 52), 550 nm for the anthocyanin band (79), and 740 nm for the carotenoid band (8). Defects in fruits with lower chlorophyll content may not show significant chlorophyll band variation, as is the case with internal browning in apples (60). Evaluating specific chemical bonds and determining the wave points is significantly easier than characterizing TSS or SSC, each of which contains several compounds (80) and is thus tedious to identify on a spectral reflectance plot. The wavelength range of SSC for cherries was 900–2,500 nm, a large waveband that needs further analysis (79).
One study of bruising in blueberries followed the analysis of the cut piece's pixels to evaluate the degree of bruising (76), which was more accurate than a subjective human evaluation. Supplementary techniques such as inverse adding doubling (IAD) can also be conducted on the optical properties of water-soaked tissues (10). The water absorption peaks were found to be at the 970 nm and 1,200 nm regions. A bruise capable of causing cell membrane rupture will undoubtedly differ significantly in this region (76).
The traditional methods followed the PCA and PLS methods, which project all variables to reduce dimensions and increase separability, respectively. During PCA analysis, the first few PC are selected for classification due to their feature-rich plots. Nevertheless, an analysis of bruising on peaches found that PC4 had the best bruise distinction, with retention of effective wavelengths (61). Therefore, while performing a PCA, the resultant plot should be observed to check whether it fits the purpose. To further enhance the efficiency, non-linear optimizations should be carried out, such as the genetic algorithm (GA), where the feature selection follows the natural selection procedure (80). One study of an online system suggested that the band ratio method can be used as a real-time and cost-effective method, with accuracy rates above 90% (76).
Horticultural crops are prone to microbial contamination. Here, we explore early detection of microbial and fungal contamination using NIRS. Early non-destructive detection within 24 h, in the case of Botrytiscinerea and Colletotrichum acutatum, can stop cross-contamination and economic loss (81). Studies conducted by Matulaprungsan et al. (82) on cabbage contamination by E. coli and S. typhimurium created artificial conditions and inoculated samples of shredded cabbage for various time periods to explore the potential of NIR analysis (Table 6). During spectral analysis, this method showed a spectral shift due to the leaking from cabbage cells and the growth of bacteria (82). This shifting behavior was treated using the SG-derivative method (82), followed by tomato pathogen analysis (83). Spectral analysis revealed that the shredded samples had better separation between inoculation times than the ground samples (82), which makes the former the method of choice for analysis. Shredded cabbage, therefore, resulted in a higher r-value (r = 0.91–0.95), indicating reliable prediction (82). E. coli detection in lettuce also resulted in an accuracy rate of 100% in the validation set using NIR spectroscopy and partial least-squares discriminant analysis (PLS-DA) (36). Various concentrations of E. coli were able to be classified using five different techniques, viz. PLS-DA, SVM, PCA, hierarchical cluster analysis (HCA), and soft independent modeling by class analogy (SIMCA). PCA and HCA trended toward a coarser classification, whereas SIMCA and SVM produced finer classifications into subgroups. The E. coli analysis was carried out in baby spinach using the PLS method (35). For contamination studies, outliers need to be eliminated using feature selection techniques such as PCA. In studies carried out to detect E. coli and Z. rouxii, PCA used to remove outliers (6, 35). In the case of E. coli detection in spinach, Q-residual-Hotelling's T2 plot was used to find out the outliers (35). E. coli was detected using PLS-DA supervised learning in the 450–994 nm range, with a 100% accuracy rate in the prediction set (35). The model could not predict unsafe samples in the early stages. Therefore, when the cell concentration reached 6.67 log CFU/mL, it was detected as unsafe during statistical analysis (35).
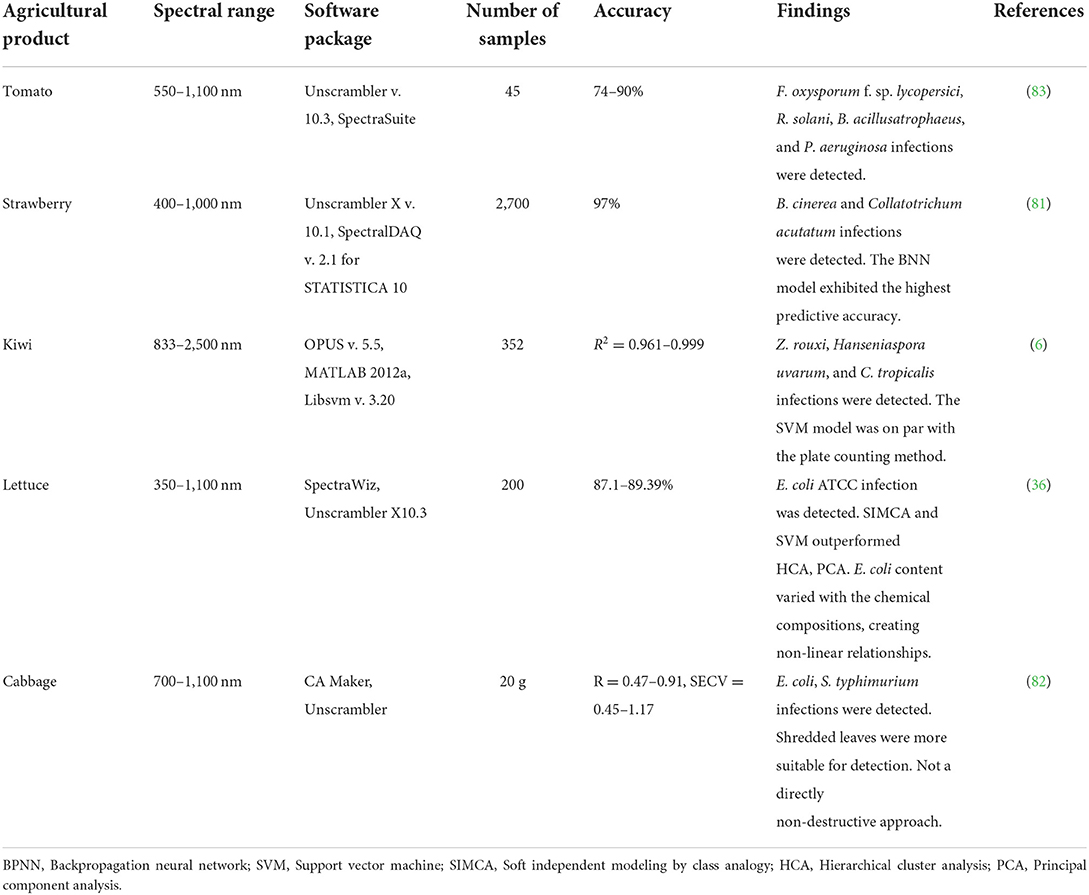
Table 6. Summary of NIRS applications for the detection of target microbial/fungus contamination in agricultural products.
A study on tomato pathogen analysis achieved a classification accuracy rate of 99.3% on the first and second day using PCA followed by an SVM classifier (83). Although higher classification rates were achieved as the mixing of samples began, the SVM classification could not handle multiple factors affecting the same. The high classification rates were able to detect F. oxysporum and R. solani fungi, as well as bacteria such as B. atrophaeus and P. aeruginosa (83).
The analysis of liquid samples created problems due to transparency (82). NIR essentially works through photons and their response to corresponding compounds, so as a solution becomes clear, it becomes non-homogeneous and therefore changes the spectral response. In this context, it is best to use the SW-NIR technique for analysis due to its higher penetration power and lesser interference from water bands (83). However, the study on microbial contamination in lettuce suggested that the water band corresponding to 970 nm O-H stretching needs to be accounted for (36). The differences in microbial cell count can cause molecular vibration patterns (36). In studies of solid lettuce samples, preprocessing techniques such as standard normal variate (SNV) and multiplicative scatter correction (MSC) were used to remove scatter effects (36). Elimination of end bands and spectral resolution enhancement can be performed in order to bring greater focus to prominent wavelengths (36). Preprocessing is carried out to avoid noise and the inclusion of unwanted information that does not add to prediction accuracy. A ratio of prediction of deviation between 1.5 and 2.0 indicates well-calibrated models (82).
Fungal infection caused by B. cinerea and C. acutatum in strawberry was analyzed using spectroscopy. The analysis extracted regions of interest (ROI) in the spectral range of 450–2,500 nm with 3500 pixels (81). The data were analyzed using four different classification methods, viz. backpropagation neural network (BPNN), random forest (RF), naïve Bayes (NB), and support vector machine (SVM) (81). The classification accuracy decreases once the fungal activity is reduced, which was observed after 4 days in C. acutatum–infected samples. However, this technology has its challenges, viz. problems with reproducibility, recovery, and the negative effects of humidity and temperature (81). The insight into the influencing factors was a new finding, and the results of this study can thus be used to improve techniques through control of the same.
Yeast species tend to cause deterioration of high-sugar products, particularly fruit products. The yeast species Zygosaccharomyces rouxii, which displays this behavior, was analyzed by Niu et al. (6) using NIR to perform non-destructive detection. During preprocessing, it was found that either SG smoothing or direct orthogonal signal correction (DOC) can be used (6). Terminologies such as the limit of detection (LOD) and limit of quantification (LOQ) were introduced in this study, and they varied along with various preprocessing and classification algorithms (6). These terms can be treated as the threshold values for performing detection using the model. The model was able to detect Z. rouxii according to the existing standards, with an accuracy rate >85% for both the calibration and prediction models (6).
NIR is one of the most researched non-destructive methods in the food processing industry due to its fast-paced analysis, minimal need for sample preparation, cost-effectiveness, and non-destructive nature (84). However, like all technological advancements, NIRS also comes with some disadvantages to be tackled, viz. standard error in the laboratory (SEL) causing standard error in prediction (SEP); variations in orientation (29); and performance issues due to biological variation (8). Apart from these challenges, which are related to spectral measurements, regression tools, machine learning, and ANN can also cause problems such as overfitting (53), low correlation values (making the method a primary sorter only), pattern recognition problems (39), and a lack of proper knowledge for choosing the best techniques among the plethora available.
Because these problems have been around since the beginning, some solutions have also been found for them. These include testing and optimizing orientation for parameters, like the testing done with SSC determination that determined that keeping the stem-calyx axis vertical, with stem upward, was best due to the presence of SSC in the stem region (29). During model preparation, the conditions need to be perfect to avoid SEL and SEP, because a single error can cause the model to underperform.
Biological variation remains a challenge, especially when testing with another sample of the same variety from the next season. This is primarily because machine learning works on pattern recognition, and every single year, a large number of biological variables change, which alters the parameters of the product. The way to solve this problem is to have a large training set from various seasons, which is, however, practically impossible.
In order to solve this issue, the techniques of the preprocessing and prediction phases need to be modified so as to adapt the pattern; otherwise, every year, the model must be taught from scratch. This is not possible, since perfect conditions would be needed to recreate a model with minimum errors. Neural network–related issues are being tackled using various techniques such as BPNN, GRNN, and PSO, which performed better when it was left individually (39). Although these methods seem to solve the problem to a certain extent, they can increase the computational load. Cloud computing–based models from various parts of the world may become the next solution, since most of the advanced systems are built around such a setup.
However, machine learning aided by ANN seems to be the foremost approach for NIR analysis, since it deals with biological commodities. The extensive variations in agricultural products can be accounted for using neural networks and pattern recognition algorithms. Predetermined algebraic equations and models created on exact mathematics can be expected to fail in this scenario due to their inability to account for complex phenomena underlying the products' life cycles. Whereas, NIRS got its start as a series of offline systems, today's researchers can create online rapid analysis prototypes, demonstrating the current pace of technology.
The research matrix shows that a significant portion of the studies to date have been conducted on apples, and a huge list of agricultural crops are waiting to be explored. Compact handheld systems have been shown to perform satisfactorily with NIRS, spurring hopes for the next era, when these technologies will hopefully be more widely available and more affordable. Many contemporary smartphones come with IR blasters, light detection and ranging (LIDAR) hardware, and many other sensors. Soon, we all might have NIRS scanners with cloud-based models that can also account for biological variations.
Spectroscopic techniques can create unique signatures for chemicals due to the particular behaviors of various molecular levels. This allows the quantitative and qualitative analysis of agricultural crops and the selection of those products with the most desirable characteristics. Spectrometer data are used to perform regression analysis and machine learning, by which the evaluation of agriculture crops is conducted. What began as offline test measurement is now capable of performing rapid online measurements without destroying the samples. Advances in computation have greatly improved the technology without much economic expenditure. Current methods involve the creation of hybrid models, which can address biological variations to a certain extent by taking the best parts of various techniques and combining them. Apart from this advancement, challenges remain on the technical side, i.e., the need to address the variation of products, data accusation, and model optimization. There is still an urgent need for a compact, non-destructive technology that can characterize a wide variety of horticultural commodities.
RP: conceptualization, methodology, data curation, formal analysis, and writing—review and editing. VP: visualization, writing original draft, and writing—review and editing. AK: visualization, methodology, writing original draft, investigation, writing—review and editing, supervision, and funding acquisition. MM: visualization, methodology, writing original draft, investigation, writing—review and editing, and funding acquisition. AR and MT: resources, writing—review and editing, and funding acquisition. AKh: conceptualization, methodology, validation, resources, and writing—review and editing. All authors contributed to the article and approved the submitted version.
This work is based upon the work from COST Action 18101 SOURDOMICS – Sourdough biotechnology network toward novel, healthier and sustainable food and bioprocesses (https://sourdomics.com/; https://www.cost.eu/actions/CA18101/), where the authors (AR, MT, and AKh) are members of the Working Group (1). SOURDOMICS supported by COST (European Cooperation in Science and Technology). COST is a funding agency for research and innovation networks. COST Actions help connect research initiatives across Europe and enable scientists to grow their ideas by sharing them with their peers – thus boosting their research, career and innovation. We would also like to acknowledge the funding received by AR from the Romanian National Authority for Scientific Research and Innovation, CNCS-UEFISCDI, project number PN-III-P2-2.1-PED-2019-1723 and PFE 14, within PNCDI III. RP was highly grateful to ICAR-AICRP on PHET for financial assistance.
We would like to acknowledge the funding received by AR from the Romanian National Authority for Scientific Research and Innovation, CNCS—UEFISCDI, project number PN-III-P2-2.1-PED-2019-1723 and PFE 14, within PNCDI III.
Author MT was employed by Centiv.
The remaining authors declare that the research was conducted in the absence of any commercial or financial relationships that could be construed as a potential conflict of interest.
All claims expressed in this article are solely those of the authors and do not necessarily represent those of their affiliated organizations, or those of the publisher, the editors and the reviewers. Any product that may be evaluated in this article, or claim that may be made by its manufacturer, is not guaranteed or endorsed by the publisher.
1. Madanayake NH, Hossain A, Adassooriya NM. Nanobiotechnology for agricultural sustainability, and food and environmental safety. Q Assurance Safety Crops Foods. (2021) 13:20–36. doi: 10.15586/qas.v13i1.838
2. Yadav A, Kumar N, Upadhyay A, Singh A, Anurag RK, Pandiselvam R. Effect of mango kernel seed starch-based active edible coating functionalized with lemongrass essential oil on the shelf-life of guava fruit. Q Assurance Safety Crops Foods. (2022) 14:103–115. doi: 10.15586/qas.v14i3.1094
3. Beegum PS, Pandiselvam R, Ramesh SV, Thube SH, Pandian TP, Khanashyam AC, et al. A critical appraisal on the antimicrobial, oral protective, and anti-diabetic functions of coconut and its derivatives. Q Assurance Safety Crops Foods. (2022) 14:86–100. doi: 10.15586/qas.v14i2.1040
4. Kaavya R, Pandiselvam R, Mohammed M, Dakshayani R, Kothakota A, Ramesh SV, et al. Application of infrared spectroscopy techniques for the assessment of quality and safety in spices: a review. Appl Spectrosc Rev. (2020) 55:593–611. doi: 10.1080/05704928.2020.1713801
5. Munawar AA, von Hörsten D, Wegener JK, Pawelzik E, Mörlein D. Rapid and non-destructive prediction of mango quality attributes using Fourier transform near infrared spectroscopy and chemometrics. Eng Agric Environ Food. (2016) 9:208–15. doi: 10.1016/j.eaef.2015.12.004
6. Niu C, Guo H, Wei J, Sajid M, Yuan Y, Yue T. Fourier transform near-Infrared spectroscopy and chemometrics to predict zygosacchromyces rouxii in apple and kiwi fruit juices. J Food Prot. (2018) 81:1379–85. doi: 10.4315/0362-028X.JFP-17-512
7. Yan H, Xu YC, Siesler HW, Han BX, Zhang GZ. Hand-Held Near-Infrared Spectroscopy for authentication of fengdous and quantitative analysis of mulberry fruits. Front Plant Sci. (2019) 10:1–15. doi: 10.3389/fpls.2019.01548
8. Grandón S, Sanchez-Contreras J, Torres CA. Prediction models for sunscald on apples (Malus domestica Borkh.) cv. Granny Smith using Vis-NIR reflectance. Postharvest Biol Technol. (2019) 151:36–44. doi: 10.1016/j.postharvbio.2019.01.012
9. Huang Y, Lu R, Chen K. Detection of internal defect of apples by a multichannel Vis/NIR spectroscopic system. Postharvest Biol Technol. (2020) 161:111065. doi: 10.1016/j.postharvbio.2019.111065
10. Wang Z, Künnemeyer R, McGlone A, Burdon J. Potential of Vis-NIR spectroscopy for detection of chilling injury in kiwifruit. Postharvest Biol Technol. (2020) 164:111160. doi: 10.1016/j.postharvbio.2020.111160
11. Ncama K, Tesfay SZ, Opara UL, Fawole OA, Magwaza LS. Non-destructive prediction of ‘Valencia' orange (Citrus sinensis) and ‘Star Ruby' grapefruit (Citrus × paradisi Macfad) internal quality parameters using Vis/NIRS. Acta Hortic. (2018) 1194:1119–25. doi: 10.17660/ActaHortic.2018.1194.160
12. Tan J, Li MF. Rapid and nondestructive identification of Belgian and Netherlandish trappist beers by front-face synchronous fluorescence spectroscopy coupled with multiple statistical analysis. Q Assurance Safety Crops Foods. (2021) 13:83–92. doi: 10.15586/qas.v13i1.839
13. Noypitak S, Imsabai W, Noknoi W, Karoojee S, Terdwongworakul A, Kobori H. Detection of cracked shell in intact aromatic young coconut using near infrared spectroscopy and acoustic response methods. J Food Meas Charact. (2019) 13:1991–9. doi: 10.1007/s11694-019-00119-2
14. Cortés V, Blasco J, Aleixos N, Cubero S, Talens P. Monitoring strategies for quality control of agricultural products using visible and near-infrared spectroscopy: A review. Trends Food Sci Tech. (2019) 85:138–48. doi: 10.1016/j.tifs.2019.01.015
15. Power A, Cozzolino D. How fishy is your fish? Authentication, provenance and traceability in fish and seafood by means of vibrational spectroscopy. Appl Sci. (2020) 10:1–13. doi: 10.3390/app10124150
16. Pu YY, O'Donnell C, Tobin JT, O'Shea N. Review of near-infrared spectroscopy as a process analytical technology for real-time product monitoring in dairy processing. Int. Dairy J. (2020) 103:104623. doi: 10.1016/j.idairyj.2019.104623
17. Dixit Y, Casado-Gavalda MP, Cama-Moncunill R, Cama-Moncunill X, Markiewicz-Keszycka M, Cullen PJ, et al. Developments and challenges in online NIR spectroscopy for meat processing. Compr Rev Food Sci Food Saf. (2017) 16:1172–87. doi: 10.1111/1541-4337.12295
18. Lan W, Jaillais B, Leca A, Renard CMGC, Bureau S. A new application of NIR spectroscopy to describe and predict purees quality from the non-destructive apple measurements. Food Chem. (2020) 310:125944. doi: 10.1016/j.foodchem.2019.125944
19. Abasi S, Minaei S, Jamshidi B, Fathi D, Khoshtaghaza MH. Rapid measurement of apple quality parameters using wavelet de-noising transform with Vis/NIR analysis. Sci Hortic. (2019) 252:7–13. doi: 10.1016/j.scienta.2019.02.085
20. Theanjumpol P, Wongzeewasakun K, Muenmanee N, Wongsaipun S, Krongchai C, Changrue V, et al. Non-destructive identification and estimation of granulation in 'sai Num Pung' tangerine fruit using near infrared spectroscopy and chemometrics. Postharvest Biol Technol. (2019) 153:13–20. doi: 10.1016/j.postharvbio.2019.03.009
21. Csorba V, Fodor M, Kovács S, Tóth M. Potential of fourier transformed near-infrared (FT-NIR) spectroscopy for rapid analysis of elderberry (Sambucus nigra L.) fruits. Czech J Food Sci. (2019) 37:21–8. doi: 10.17221/144/2018-CJFS
22. Nturambirwe JFI, Nieuwoudt HH, Perold WJ, Opara UL. Non-destructive measurement of internal quality of apple fruit by a contactless NIR spectrometer with genetic algorithm model optimization. Sci African. (2019) 3:e0051. doi: 10.1016/j.sciaf.2019.e00051
23. Hu R, Zhang L, Yu Z, Zhai Z, Zhang R. Optimization of soluble solids content prediction models in ‘Hami' melons by means of Vis-NIR spectroscopy and chemometric tools. Infrared Phys Technol. (2019) 102:102999. doi: 10.1016/j.infrared.2019.102999
24. Kanchanomai C, Naphrom D, Ohashi S, Nakano K, Theanjumpol P, Maniwara P. Nondestructive determination of quality management in table grapes using Near Infrared Spectroscopy (NIRS) technique. ETP Int J Food Eng. (2019) 5:63–7. doi: 10.18178/ijfe.5.1.63-67
25. Amuah CLY, Teye E, Lamptey FP, Nyandey K, Opoku-Ansah J, Adueming POW. Feasibility study of the use of handheld NIR spectrometer for simultaneous authentication and quantification of quality parameters in intact pineapple fruits. J Spectrosc. (2019) 2019:e5975461. doi: 10.1155/2019/5975461
26. Kashiwagi A, Kominami R, Nakayama S, Kishimoto N. Nondestructive prediction of oil yield through direct Near Infrared Spectroscopy measurements of fresh olives. in 2019 IEEE International Symposium on Olfaction and Electronic Nose (ISOEN). IEEE (2019). doi: 10.1109/ISOEN.2019.8823467
27. Khodabakhshian R, Emadi B, Khojastehpour M, Golzarian MR. A comparative study of reflectance and transmittance modes of Vis/NIR spectroscopy used in determining internal quality attributes in pomegranate fruits. J Food Meas Charact. (2019) 13:3130–9. doi: 10.1007/s11694-019-00235-z
28. Hasnah Ar N, Purwanto YA, Budiastra IW, Sobir S. Prediction of soluble solid content, vitamin C total acid and firmness in astringent persimmon (Diospyros kaki L.) cv. Rendeu using NIR spectroscopy. IOP Conf Ser Mater Sci Eng. (2019) 557:e012086. doi: 10.1088/1757-899X/557/1/012086
29. Xia Y, Huang W, Fan S, Li J, Chen L. Effect of spectral measurement orientation on online prediction of soluble solids content of apple using Vis/NIR diffuse reflectance. Infrared Phys Technol. (2019) 97:467–77. doi: 10.1016/j.infrared.2019.01.012
30. Huang Y, Lu R, Chen K. Assessment of tomato soluble solids content and pH by spatially-resolved and conventional Vis/NIR spectroscopy. J Food Eng. (2018) 236:19–28. doi: 10.1016/j.jfoodeng.2018.05.008
31. Azadshahraki F, Jamshidi B, Rasooli Sharabiani V. Non-destructive determination of vitamin C and lycopene contents of intact cv. Newton tomatoes using NIR spectroscopy. Yuz Yil Univ J Agric Sci. (2018) 28:389–97. doi: 10.29133/yyutbd.423458
32. Ncama K, Opara UL, Tesfay SZ, Fawole OA, Magwaza LS. Application of Vis/NIR spectroscopy for predicting sweetness and flavour parameters of ‘Valencia' orange (Citrus sinensis) and ‘Star Ruby' grapefruit (Citrus x paradisi Macfad). J Food Eng. (2017) 193:86–94. doi: 10.1016/j.jfoodeng.2016.08.015
33. Lan W, Bureau S, Chen S, Leca A, Renard CMGC. Visible, near- and mid-infrared spectroscopy coupled with an innovative chemometric strategy to control apple puree quality. Food Cont. (2021) 120:107546. doi: 10.1016/j.foodcont.2020.107546
34. Sans S, Ferré J, Boqué R, Sabaté J, Casals J, Simó J. Determination of chemical properties in ‘calçot' (Allium cepa L.) by near infrared spectroscopy and multivariate calibration. Food Chem. (2018) 262:178–83. doi: 10.1016/j.foodchem.2018.04.102
35. Rahi S, Mobli H, Jamshidi B, Azizi A, Sharifi M. Visible/near-infrared spectroscopy as a novel technology for nondestructive detection of Escherichia coli ATCC 8739 in lettuce samples. (2019) 24–6. doi: 10.33422/worldcet.2019.10.285
36. Rahi S, Mobli H, Jamshidi B, Azizi A, Sharifi M. Different supervised and unsupervised classification approaches based on visible/near infrared spectral analysis for discrimination of microbial contaminated lettuce samples: Case study on E. coli ATCC. Infrared Phys Technol. (2020) 108:103355. doi: 10.1016/j.infrared.2020.103355
37. Jaiswal P, Jha SN, Bharadwaj R. Non-destructive prediction of quality of intact banana using spectroscopy. Sci Hortic. (2012) 135:14–22. doi: 10.1016/j.scienta.2011.11.021
38. Kanchanomai C, Ohashi S, Naphrom D, Nemoto W, Maniwara P, Nakano K. Non-destructive analysis of Japanese table grape qualities using near-infrared spectroscopy. Hortic Environ Biotechnol. (2020) 61:725–33. doi: 10.1007/s13580-020-00256-4
39. Wu Y, Li L, Liu L, Liu Y. Nondestructive measurement of internal quality attributes of apple fruit by using NIR spectroscopy. Multimed Tools Appl. (2019) 78:4179–95. doi: 10.1007/s11042-017-5388-0
40. Torres I, Sánchez MT, Entrenas JA, Garrido-Varo A, Pérez-Marín D. Monitoring quality and safety assessment of summer squashes along the food supply chain using near infrared sensors. Postharvest Biol Technol. (2019) 154:21–30. doi: 10.1016/j.postharvbio.2019.04.015
41. Camps C, Gilli C. Prediction of local and global tomato texture and quality by FT-NIR spectroscopy and chemometric. Eur J Hortic. Sci. (2017) 82:126–33. doi: 10.17660/eJHS.2017/82.3.2
42. Sharma S, Sirisoomboon P. Feasibility on using NIR spectroscopy for the measurement of the textural parameters in mango. IOP Conf Ser Earth Environ Sci. (2019) 301:e012064. doi: 10.1088/1755-1315/301/1/012064
43. Mohammadi-Moghaddam T, Razavi SMA, Sazgarnia A, Taghizadeh M. Predicting the moisture content and textural characteristics of roasted pistachio kernels using Vis/NIR reflectance spectroscopy and PLSR analysis. J Food Meas Charact. (2018) 12:346–55. doi: 10.1007/s11694-017-9646-7
44. Sánchez MT, Entrenas JA, Torres I, Vega M, Pérez-Marín D. Monitoring texture and other quality parameters in spinach plants using NIR spectroscopy. Comput Electron Agric. (2018) 155:446–52. doi: 10.1016/j.compag.2018.11.004
45. Feng L, Zhang M, Adhikari B, Guo Z. Nondestructive detection of postharvest quality of cherry tomatoes using a portable NIR spectrometer and chemometric algorithms. Food Anal Methods. (2019) 12:914–25. doi: 10.1007/s12161-018-01429-9
46. Berardinelli A, Benelli A, Tartagni M, Ragni L. Kiwifruit flesh firmness determination by a NIR sensitive device and image multivariate data analyses. Sensors Actuators A Phys. (2019) 296:265–71. doi: 10.1016/j.sna.2019.07.027
47. Cirilli M, Bellincontro A, Urbani S, Servili M, Esposto S, Mencarelli F, et al. On-field monitoring of fruit ripening evolution and quality parameters in olive mutants using a portable NIR-AOTF device. Food Chem. (2016) 199:96–104. doi: 10.1016/j.foodchem.2015.11.129
48. Yu X, Lu H, Wu D. Development of deep learning method for predicting firmness and soluble solid content of postharvest Korla fragrant pear using Vis/NIR hyperspectral reflectance imaging. Postharvest Biol Technol. (2018) 141:39–49. doi: 10.1016/j.postharvbio.2018.02.013
49. Labaky P, Grosmaire L, Ricci J, Wisniewski C, Louka N, Dahdouh L. Innovative non-destructive sorting technique for juicy stone fruits: textural properties of fresh mangos and purees. Food Bioprod Process. (2020) 123:188–98. doi: 10.1016/j.fbp.2020.06.013
50. Cortés V, Cubero S, Blasco J, Aleixos N, Talens P. In-line application of visible and near-Infrared diffuse reflectance spectroscopy to identify apple varieties. Food Bioprocess Tech. (2019) 12:1021–30. doi: 10.1007/s11947-019-02268-0
51. Eisenstecken D, Stürz B, Robatscher P, Lozano L, Zanella A, Oberhuber M. The potential of near infrared spectroscopy (NIRS) to trace apple origin: Study on different cultivars and orchard elevations. Postharvest Biol Technol. (2019) 147:123–31. doi: 10.1016/j.postharvbio.2018.08.019
52. Li X, Huang J, Xiong Y, Zhou J, Tan X, Zhang B. Determination of soluble solid content in multi-origin ‘Fuji' apples by using FT-NIR spectroscopy and an origin discriminant strategy. Comput Electron Agric. (2018) 155:23–31. doi: 10.1016/j.compag.2018.10.003
53. Zhang Y, Nock JF, Al Shoffe Y, Watkins CB. Non-destructive prediction of soluble solids and dry matter contents in eight apple cultivars using near-infrared spectroscopy. Postharvest Biol Technol. (2019) 151:111–8. doi: 10.1016/j.postharvbio.2019.01.009
54. Sánchez MT, Torres I, de la Haba MJ, Chamorro A, Garrido-Varo A, Pérez-Marín D. Rapid, simultaneous, and in situ authentication and quality assessment of intact bell peppers using near-infrared spectroscopy technology. J Sci Food Agric. (2019) 99:1613–22. doi: 10.1002/jsfa.9342
55. Jha SN, Jaiswal P, Narsaiah K, Kumar R, Sharma R, Gupta M, et al. Authentication of mango varieties using Near-Infrared Spectroscopy. Agric Res. (2013) 2:229–35. doi: 10.1007/s40003-013-0068-4
56. Li J, Zhang H, Zhan B, Wang Z, Jiang Y. Determination of SSC in pears by establishing the multi-cultivar models based on visible-NIR spectroscopy. Infrared Phys Technol. (2019) 102:103066. doi: 10.1016/j.infrared.2019.103066
57. Su WH, Bakalis S, Sun DW. NIR/MIR spectroscopy in tandem with chemometrics for rapid identification and evaluation of potato variety and doneness degree. in 2019 ASABE Annual International Meeting. (2019). doi: 10.13031/aim.201900120
58. Wu X, Wu B, Sun J, Li M, Du H. Discrimination of apples using near infrared spectroscopy and sorting discriminant analysis. Int J Food Prop. (2016) 19:1016–28. doi: 10.1080/10942912.2014.971181
59. Zimmer M, Schneider J. Near-infrared diffuse reflectance spectroscopy for discriminating fruit and vegetable products preserved in glass containers. Croat J Food Sci Technol. (2019) 11:104–12. doi: 10.17508/CJFST.2019.11.1.15
60. Li C, Li L, Wu Y, Lu M, Yang Y. Li L. Apple variety identification using Near-Infrared Spectroscopy. J Spectrosc. (2018) 2018:1–6. doi: 10.1155/2018/6935197
61. Li J, Chen L, Huang W. Detection of early bruises on peaches (Amygdalus persica L.) using hyperspectral imaging coupled with improved watershed segmentation algorithm. Postharvest Biol Technol. (2018) 135:104–13. doi: 10.1016/j.postharvbio.2017.09.007
62. Wu G, Wang C. Investigating the effects of simulated transport vibration on tomato tissue damage based on vis/NIR spectroscopy. Postharvest Biol Technol. (2014) 98:41–7. doi: 10.1016/j.postharvbio.2014.06.016
63. dos Santos Neto JP, de Assis MWD, Casagrande IP, Cunha Júnior LC, de Almeida Teixeira GH. Determination of ‘Palmer' mango maturity indices using portable near infrared (VIS-NIR) spectrometer. Postharvest Biol Technol. (2017) 130:75–80. doi: 10.1016/j.postharvbio.2017.03.009
64. Alenazi MM, Shafiq M, Alsadon AA, Alhelal IM, Alhamdan AM, Solieman THI, et al. Non-destructive assessment of flesh firmness and dietary antioxidants of greenhouse-grown tomato (Solanum lycopersicum L.) at different fruit maturity stages. Saudi J Biol Sci. (2020) 27:2839–46. doi: 10.1016/j.sjbs.2020.07.004
65. Chen H, Qiao H, Xu L, Feng Q, Cai K. A Fuzzy optimization strategy for the implementation of RBF LSSVR model in Vis-NIR analysis of pomelo maturity. IEEE Trans Ind Informatics. (2019) 15:5971–9. doi: 10.1109/TII.2019.2933582
66. Daniels AJ, Poblete-Echeverría C, Opara UL, Nieuwoudt HH. Measuring internal maturity parameters contactless on intact table grape bunches using NIR spectroscopy. Front Plant Sci. (2019) 10:1–14. doi: 10.3389/fpls.2019.01517
67. Blakey RJ. Evaluation of avocado fruit maturity with a portable near-infrared spectrometer. Postharvest Biol Technol. (2016) 121:101–5. doi: 10.1016/j.postharvbio.2016.06.016
68. Jie D, Zhou W, Wei X. Nondestructive detection of maturity of watermelon by spectral characteristic using NIR diffuse transmittance technique. Sci Hortic. (2019) 257:108718. doi: 10.1016/j.scienta.2019.108718
69. Saputro AH, Juansyah SD, Handayani W. Banana (Musa sp.) maturity prediction system based on chlorophyll content using visible-NIR imaging. Int Conf Signals Syst. (2018) 2018:64–68. doi: 10.1109/ICSIGSYS.2018.8373569
70. Chen HZ, Xu LL, Tang GQ, Song QQ, Feng QX. Rapid detection of surface color of shatian pomelo using Vis-NIR Spectrometry for the identification of maturity. Food Anal Met. (2016) 9:192–201. doi: 10.1007/s12161-015-0188-5
71. Ribera-Fonseca A, Noferini M, Rombolá AD. Non-destructive assessment of highbush blueberry fruit maturity parameters and anthocyanins by using a visible/ near infrared (Vis/NIR) spectroscopy device: A preliminary approach. J Soil Sci Plant Nutr. (2016) 16:174–86. doi: 10.4067/S0718-95162016005000014
72. Pourdarbani R, Sabzi S, Kalantari D, Karimzadeh R, Ilbeygi E, Arribas JI. Automatic non-destructive video estimation of maturation levels in Fuji apple (Malus Malus pumila) fruit in orchard based on colour (Vis) and spectral (NIR) data. Biosyst Eng. (2020) 195:136–51. doi: 10.1016/j.biosystemseng.2020.04.015
73. Kim JG, Park Y, Shin MH, Muneer S, Lerud R, Michelson C, et al. Application of NIR-Spectroscopy to predict the harvesting maturity, fruit ripening and storage ability of Ca-chitosan treated baby kiwifruit. J Stored Prod Postharvest Res. (2018) 9:44–53. doi: 10.5897/JSPPR2018.0257
74. Polinar YQ, Yaptenco KF, Peralta EK, Agravante JU. Near-infrared spectroscopy for non-destructive prediction of maturity and eating quality of ‘carabao' mango (Mangifera indica L.) fruit. Agric Eng Int CIGR J. (2019) 21:209–19.
75. Skolik P, McAinsh MR, Martin FL. ATR-FTIR spectroscopy non-destructively detects damage-induced sour rot infection in whole tomato fruit. Planta. (2019) 249:925–39. doi: 10.1007/s00425-018-3060-1
76. Fan S, Li C, Huang W, Chen L. Detection of blueberry internal bruising over time using NIR hyperspectral reflectance imaging with optimum wavelengths. Postharvest Biol Technol. (2017) 134:55–66. doi: 10.1016/j.postharvbio.2017.08.012
77. Lu R. Multispectral imaging for predicting firmness and soluble solids content of apple fruit. Postharvest Biol Technol. (2004) 31:147–57. doi: 10.1016/j.postharvbio.2003.08.006
78. Moscetti R, Haff RP, Monarca D, Cecchini M, Massantini R. Near-infrared spectroscopy for detection of hailstorm damage on olive fruit. Postharvest Biol Technol. (2016) 120:204–12. doi: 10.1016/j.postharvbio.2016.06.011
79. Shao Y, Xuan G, Hu Z, Gao Z, Liu L. Determination of the bruise degree for cherry using Vis-NIR reflection spectroscopy coupled with multivariate analysis. PLoS ONE. (2019) 14:1–13. doi: 10.1371/journal.pone.0222633
80. Du X, Long, L X, Yu, L Y, Zhou W. Hong, et al. Genetic algorithm optimized non-destructive prediction on property of mechanically injured peaches during postharvest storage by portable visible/shortwave near-infrared spectroscopy. Sci Hortic. (2019) 249:240–9. doi: 10.1016/j.scienta.2019.01.057
81. Siedliska A, Baranowski P, Zubik M, Mazurek W, Sosnowska B. Detection of fungal infections in strawberry fruit by VNIR/SWIR hyperspectral imaging. Postharvest Biol Technol. (2018) 139:115–26. doi: 10.1016/j.postharvbio.2018.01.018
82. Matulaprungsan B, Wongs-Aree C, Penchaiya P, Maniwara P, Kanlayanarat S, Ohashi S, et al. Feasibility of determination of foodborne microbe contamination of fresh-cut shredded cabbage using SW-NIR. Agri Engi. (2019) 1:246–56. doi: 10.3390/agriengineering1020018
83. Abu-Khalaf N. Sensing tomato's pathogen using Visible/Near infrared (VIS/NIR) spectroscopy and multivariate data analysis (MVDA). Palest Tech Univ Res J. (2015) 3:12–22. doi: 10.53671/pturj.v3i1.35
Keywords: cultivar authentications, damage detection, maturity, rapid method, spectroscopy, texture
Citation: Pandiselvam R, Prithviraj V, Manikantan MR, Kothakota A, Rusu AV, Trif M and Mousavi Khaneghah A (2022) Recent advancements in NIR spectroscopy for assessing the quality and safety of horticultural products: A comprehensive review. Front. Nutr. 9:973457. doi: 10.3389/fnut.2022.973457
Received: 20 June 2022; Accepted: 02 August 2022;
Published: 12 October 2022.
Edited by:
Miguel Angel Prieto Lage, University of Vigo, SpainReviewed by:
Marta Barral Martínez, University of Vigo, SpainCopyright © 2022 Pandiselvam, Prithviraj, Manikantan, Kothakota, Rusu, Trif and Mousavi Khaneghah. This is an open-access article distributed under the terms of the Creative Commons Attribution License (CC BY). The use, distribution or reproduction in other forums is permitted, provided the original author(s) and the copyright owner(s) are credited and that the original publication in this journal is cited, in accordance with accepted academic practice. No use, distribution or reproduction is permitted which does not comply with these terms.
*Correspondence: R. Pandiselvam, YW5idXBhbmRpMTk4OUB5YWhvby5jby5pbg==; M. R. Manikantan, bWFuaWNwY3JpQGdtYWlsLmNvbQ==; Monica Trif, bW9uaWNhX3RyaWZAaG90bWFpbC5jb20=
Disclaimer: All claims expressed in this article are solely those of the authors and do not necessarily represent those of their affiliated organizations, or those of the publisher, the editors and the reviewers. Any product that may be evaluated in this article or claim that may be made by its manufacturer is not guaranteed or endorsed by the publisher.
Research integrity at Frontiers
Learn more about the work of our research integrity team to safeguard the quality of each article we publish.