 Tianfei Hou1
 Aaron N. Chacon
 Zhenheng Guo
 Ming C. Gong
94% of researchers rate our articles as excellent or good
Learn more about the work of our research integrity team to safeguard the quality of each article we publish.
Find out more
ORIGINAL RESEARCH article
Front. Nutr., 08 September 2022
Sec. Nutrition, Psychology and Brain Health
Volume 9 - 2022 | https://doi.org/10.3389/fnut.2022.969345
This article is part of the Research TopicThe Present and Future of Chrono-nutrition StudiesView all 15 articles
Disruption of blood pressure (BP) circadian rhythm, independent of hypertension, is emerging as an index for future target organ damage and is associated with a higher risk of cardiovascular events. Previous studies showed that changing food availability time alters BP rhythm in several mammalian species. However, the underlying mechanisms remain largely unknown. To address this, the current study specifically investigates (1) the relationship between rhythms of food intake and BP in wild-type mice; (2) effects of light-phase time-restricted feeding (TRF, food only available during light-phase) on BP circadian rhythm in wild-type and diabetic db/db mice; (3) the roles of the autonomic system and clock gene in light-phase TRF induced changes in BP circadian rhythm. Food intake and BP of C57BL/6J and db/db mice were simultaneously and continuously recorded using BioDAQ and telemetry systems under ad libitum or light-phase TRF. Per2 protein daily oscillation was recorded in vivo by IVIS spectrum in mPer2Luc mice. Autonomic nerve activity was evaluated by heart rate variability, baroreflex, urinary norepinephrine (NE) and epinephrine (Epi) excretion, and mRNA expressions of catecholamines biosynthetic and catabolic enzymes, and alpha-adrenergic receptors in mesenteric resistance arteries. We found that in wild-type mice, the BP level was correlated with the food intake temporally across the 24 h. Reversing the feeding time by imposing light-phase TRF resulted in reverse or inverted BP dipping. Interestingly, the net changes in food intake were correlated with the net alteration in BP temporally under light-phase TRF. In db/db mice, light-phase TRF worsened the existing non-dipping BP. The food intake and BP circadian rhythm changes were associated with alterations in Per2 protein daily oscillation and the time-of-day variations in heart rate variability, baroreflex, and urinary excretion of NE and Epi, and increased mRNA expression of Slc6a2 (encoding NE transporter) and Adra1d (encoding alpha-adrenergic receptor 1d) in the mesenteric resistance arteries, indicating the sympathetic nervous system (SNS) was modulated after light-phase TRF. Collectively, our results demonstrated that light-phase TRF results in reverse dipping of BP in wild-type and diabetic db/db mice and revealed the potential role of the sympathetic pathway in light-phase TRF-induced BP circadian rhythm alteration.
Normal blood pressure (BP) exhibits a circadian rhythm that rises in the morning and decreases 10–20% during the night, known as dipping BP. Disruptions of BP circadian rhythm, which often manifest as non-dipping BP (less than 10% decrease of nighttime BP from daytime BP) or reverse or inverted dipping BP (higher nighttime than daytime BP), are highly prevalent in patients with hypertension, type 2 diabetes, chronic kidney disease, and sleep apnea syndrome (1, 2). Clinical studies demonstrate that non-dipping and reverse dipping BP is associated with target organ damages and increased detrimental cardiovascular events (1, 3, 4). Thus, understanding the mechanisms that control normal BP circadian rhythm has high clinical relevance.
Experimentally limiting food availability only to the inactive phase alters BP rhythm markedly in several mammalian species (5–8), suggesting that the timing of food intake plays a critical role in regulating BP circadian rhythm. However, these studies did not simultaneously monitor the food intake and BP circadian rhythm. Hence, whether or not food intake temporally correlates with BP circadian rhythm and directly triggers BP change under altered feeding schedule remains unclear. Nocturnal animals consume most food during the dark phase when they are active under normal conditions. The current study alters the feeding schedule to the light phase, the inactive phase of nocturnal mice, termed as light-phase time-restricted feeding (light-phase TRF) and aims to address these important issues and investigate whether food intake temporarily correlates with BP alteration by simultaneously monitoring the episodic feeding activity by the BioDAQ system and the beat-to-beat BP by telemetry in singly housed mice under ad libitum feeding (ALF) or light-phase TRF.
Among the multiple mechanisms regulating BP homeostasis, the critical role of the sympathetic nervous system (SNS) is well recognized. SNS activity, measured by plasma or urine catecholamine levels, exhibits circadian rhythms that parallel BP rhythm (9, 10). Previous studies demonstrated that SNS activity is suppressed during fasting and enhanced after feeding (11–15). Consistent with these studies, we recently reported that the non-dipping BP is associated with diminished rhythms of food intake and SNS activity in diabetic db/db mice (16). Importantly, we demonstrated that aligning food availability with the standard light-dark cycle by dark-phase TRF, which limits food availability only to the active dark phase, restores BP and SNS activity rhythms in db/db mice (16). However, whether SNS activity rhythm serves as the mechanistic linkage between light-phase TRF and BP circadian rhythm alteration has not been investigated. The current study tested if the modulation of SNS activity mediates, at least in part, the light-phase TRF-induced BP circadian rhythm alterations in wild-type mice. In addition, we recently reported that dark-phase TRF protects BP circadian rhythm in diabetic db/db mice (16). However, the effect of light-phase TRF on BP circadian rhythm in diabetic db/db mice remains to be illustrated. The current study also investigated whether, in contrast to the dark-phase TRF-induced protection of BP circadian rhythm (16), light-phase TRF worsens the non-dipping BP in diabetic db/db mice.
The molecular basis of circadian rhythm is the endogenous autonomous clocks present in the central suprachiasmatic nucleus and nearly all peripheral tissues. The intrinsic clocks, comprised of a group of transcription factors that form a feedback loop, are entrained by the environment and thus maintained in a ∼24-h rhythm (17). While light is the most potent environmental cue to entrain the central clock, accumulating evidence indicates that food intake is a major factor in entraining peripheral clocks (17). Mouse models harboring clock gene mutation or knockout suggest that clocks play a critical role in regulating BP circadian rhythms (18). To investigate the potential involvement of clocks in light-phase TRF-induced alteration of BP circadian rhythm, we, therefore, examined the oscillation of Period 2 (per2), one of the core clock genes, in response to light-phase TRF using luciferase knock-in mice (Per2luc) (19).
Collectively, the current study aims to elucidate (1) the temporal relationships between food intake and BP circadian rhythm in wild-type mice fed ad libitum and light-phase TRF; (2) the responses of the SNS and Per2 oscillation to light-phase TRF in wild-type mice; (3) the effects of light-phase TRF on BP circadian rhythm in db/db mice.
C57BL/6J (Stock No.: 000664), homozygous mPer2Luc (Stock No: 006852), and db/db (Stock No.: 000642) mice were purchased from the Jackson Laboratory (Bar Harbor, ME, United States). Only male mice were used in the current study. The mice were housed under a 12:12 light: dark cycle in a light-tight box and fed with a standard rodent diet with free water access. All animal procedures were approved by the Institutional Animal Care and Use Committee of the University of Kentucky.
Food intake of 17-week-old wild-type mice (n = 7) or 21-week-old db/db mice (n = 10) were recorded under ALF (ad libitum) for 3 days, followed by 7 days’ of light-phase TRF (10 h of food access from zeitgeber time (ZT) 2 to ZT12). The time of food availability and the amount of food consumed were recorded by a BioDAQ system (Research Diet, New Brunswick, NJ) (16). The BioDAQ system has a feeding module fitted with an electronic sensor and an automated gate controller, allowing food access at a designated time and continuous accurate monitoring of food intake. Mice were acclimated to the system for at least 7 days before the experiment, and food intake at different time intervals was analyzed as indicated in the figures.
The same wild-type and db/db mice used in the food intake monitoring experiment were implanted with a telemetry probe (TA11PA-C10, Data Sciences International, St. Paul, MN, United States) into the left common carotid artery to continuously record BP, heart rate, and locomotor activity in free-moving mice at a sampling rate of 1,000 Hz (16, 20, 21). Mice were allowed 7–10 days of recovery from surgery before measurement.
Seventeen-week-old mPer2luc mice (n = 17) under ALF were imaged at zeitgeber time ZT5, ZT11, ZT17, and ZT23 and then subjected to light-phase TRF and imaged again on day 3 and day 7 using the IVIS system (IVIS Spectrum in vivo imaging system, PerkinElmer, Waltham, MA, United States) as previously described (22). Briefly, mice were anesthetized with 2.5–4% isoflurane and subcutaneously injected with D-luciferin (15 mg/kg body weight in PBS). The mice were imaged 7 min later for dorsal side up and 10 min later for ventral side up for 5 s using the IVIS spectrum. Total bioluminescence (photon/s/cm2/sr) was quantified by setting the region of interest to the same shape and size using Living Image software (IVIS Imaging System). To eliminate individual mouse and measurement variation and to better quantify the phase of Per2 oscillation, relative bioluminescence intensity was calculated by normalizing absolute bioluminescence to the average bioluminescence of the four-time points (22).
Heart rate variability was analyzed using frequency and time domain methods by Ponemah Software (Data Sciences International; St. Paul, MN) as previously described (16). Briefly, for frequency domain determination, 2-min artifacts-free beat-by-beat BP waveform segments were selected from every 20 min across the 72 h of recordings for the final analysis. Each segment was then interpolated to 20Hz using the quadratic method, followed by Fast Fourier Transformation using hanning window method. The cut-off frequency ranges for low-frequency (LF) and high-frequency (HF) were 0.15–0.6 Hz and 1.5–4 Hz, respectively. For time-domain analysis, 5-min beat-by-beat BP waveform segments over 72 h were calculated, and the root-mean-square successive beat-to-beat difference (rMSSD) was plotted as the parasympathetic heart rate control marker. Systolic pressure was used as the trigger for frequency domain and time domain analysis. The heart rate variability was averaged in each correspondent hour over 3 days for both the frequency and time domain data to generate a 24-h heart rate variability profile.
Cardiac baroreflex sensitivity (referred to as baroreflex sensitivity in the manuscript for simplicity) was analyzed using sequence techniques by Hemolab software1 as previously described (16, 21). For each hour, the software searches sequences in which the systolic arterial pressure and pulse interval were positively correlated (r2 > 0.80) to identify valid sequences with at least four consecutive changes as an effective Baroreflex. The average slope of the systolic pressure-pulse interval relationships is calculated as baroreflex sensitivity. For each mouse, 72 hourly baroreflex sensitivity data points were calculated from the three consecutive days of BP data and then averaged to generate one 24-h profile.
Urine was collected using metabolic cages (Tecniplast, West Chester, PA). To prevent mice from dehydration and urine contamination by food crumbs, the mice were fed a gel diet (DietGel76A, ClearH2O, Portland, ME) during the urine collection period. The mice were acclimated to the metabolic cage and gel diet for 3 days before actual urine collection. The 12-h light- and dark-phase urine samples were first collected in 15- to 16-week-old mPer2Luc mice (n = 11) under ALF. Then the mice were subjected to light-phase TRF for 7 days, and the 12-h light- and dark-phase urine samples were collected again on the last day of light-phase TRF. We used mPer2Luc mice because mPer2Luc mice have been backcrossed to C57BL/6J inbred mice for 11 generations, and mPer2Luc mice exhibited a similar normal food intake and BP rhythm as C57BL/6J mice (22). Urinary norepinephrine (NE) and epinephrine (Epi) were determined by the ELISA kits (Abnova, Taipei, Taiwan). Total contents of NE and Epi were calculated by concentrations × urine volumes (16).
Twenty-week-old male Per2Luc mice were randomly divided into ALF (n = 5) or light-phase TRF (n = 6) groups.7 days later, mice were euthanized between ZT9 and ZT11, and mesenteric arteries were collected in RNAlater solution (ThermoFisher Scientific, United States). The fat surrounding the mesenteric arteries was carefully removed under a dissecting microscope. As previously described (16, 21, 23–25), the mRNA levels of various genes were quantified by real-time PCR. The real-time PCR primers for each gene were described in Supplementary Table 1.
The sample size was determined based on previous publications (16, 26). All data were expressed as mean ± standard error of the mean (SEM). For comparison of 1 parameter in the same mice, a paired t-test was performed. For analysis of 1 parameter in different mice, an unpaired t-test was used. Repeated two-way ANOVA with matching conditions between light vs. dark phase and between ALF vs. light-phase TRF with Tukey’s post-test was conducted to compare two parameters in the same mice. The main factors for two-way ANOVA were feeding (ALF vs. light-phase TRF) and time (light phase vs. dark phase or feeding vs. fasting). Correlations between food intake and BP and between Δfood intake/Δlocomotor activity and ΔBP were calculated using linear regression. An ANCOVA was performed where feeding method (ALF vs. light-phase TRF) and light condition (light vs. dark) were used as factors, and BP and locomotor activity under ALF or light-phase TRF were used as dependent variable and covariant respectively. All statistical analyses, expect ANCOVA, were performed by Prism 9 software (GraphPad Software, San Diego, CA). ANCOVA was performed by IBM SPSS Statistics. P < 0.05 was defined as statistically significant.
To determine the temporal relationship between food intake and BP under ALF and light-phase TRF, 16-week-old male wild-type C57BL/6J mice were implanted with telemetry and acclimated in BioDAQ cages under ALF for 10 days, followed by light-phase TRF for 7 days. During light-phase TRF, food was available from ZT2 to ZT12 (ZT0: lights-on and ZT12: lights-off). Food intake and BP were monitored simultaneously and continuously in the same single-housed mouse using BioDAQ and telemetry systems during the last 3 days of ALF and 7 days of light-phase TRF.
Under ALF, wild-type mice consumed more food during the dark phase than during the light phase (Figure 1A), and their mean arterial pressure (MAP) was higher during the dark phase than during the light phase (Figure 1B). The two parameters showed a highly similar pattern when 2 h-average MAP was plotted with 2 h-sum food intake during the corresponding time on the same graph (Figure 1C). There was a significant correlation between food intake and MAP, with a linear correlation coefficient of r = 0.75 (Figure 1D).
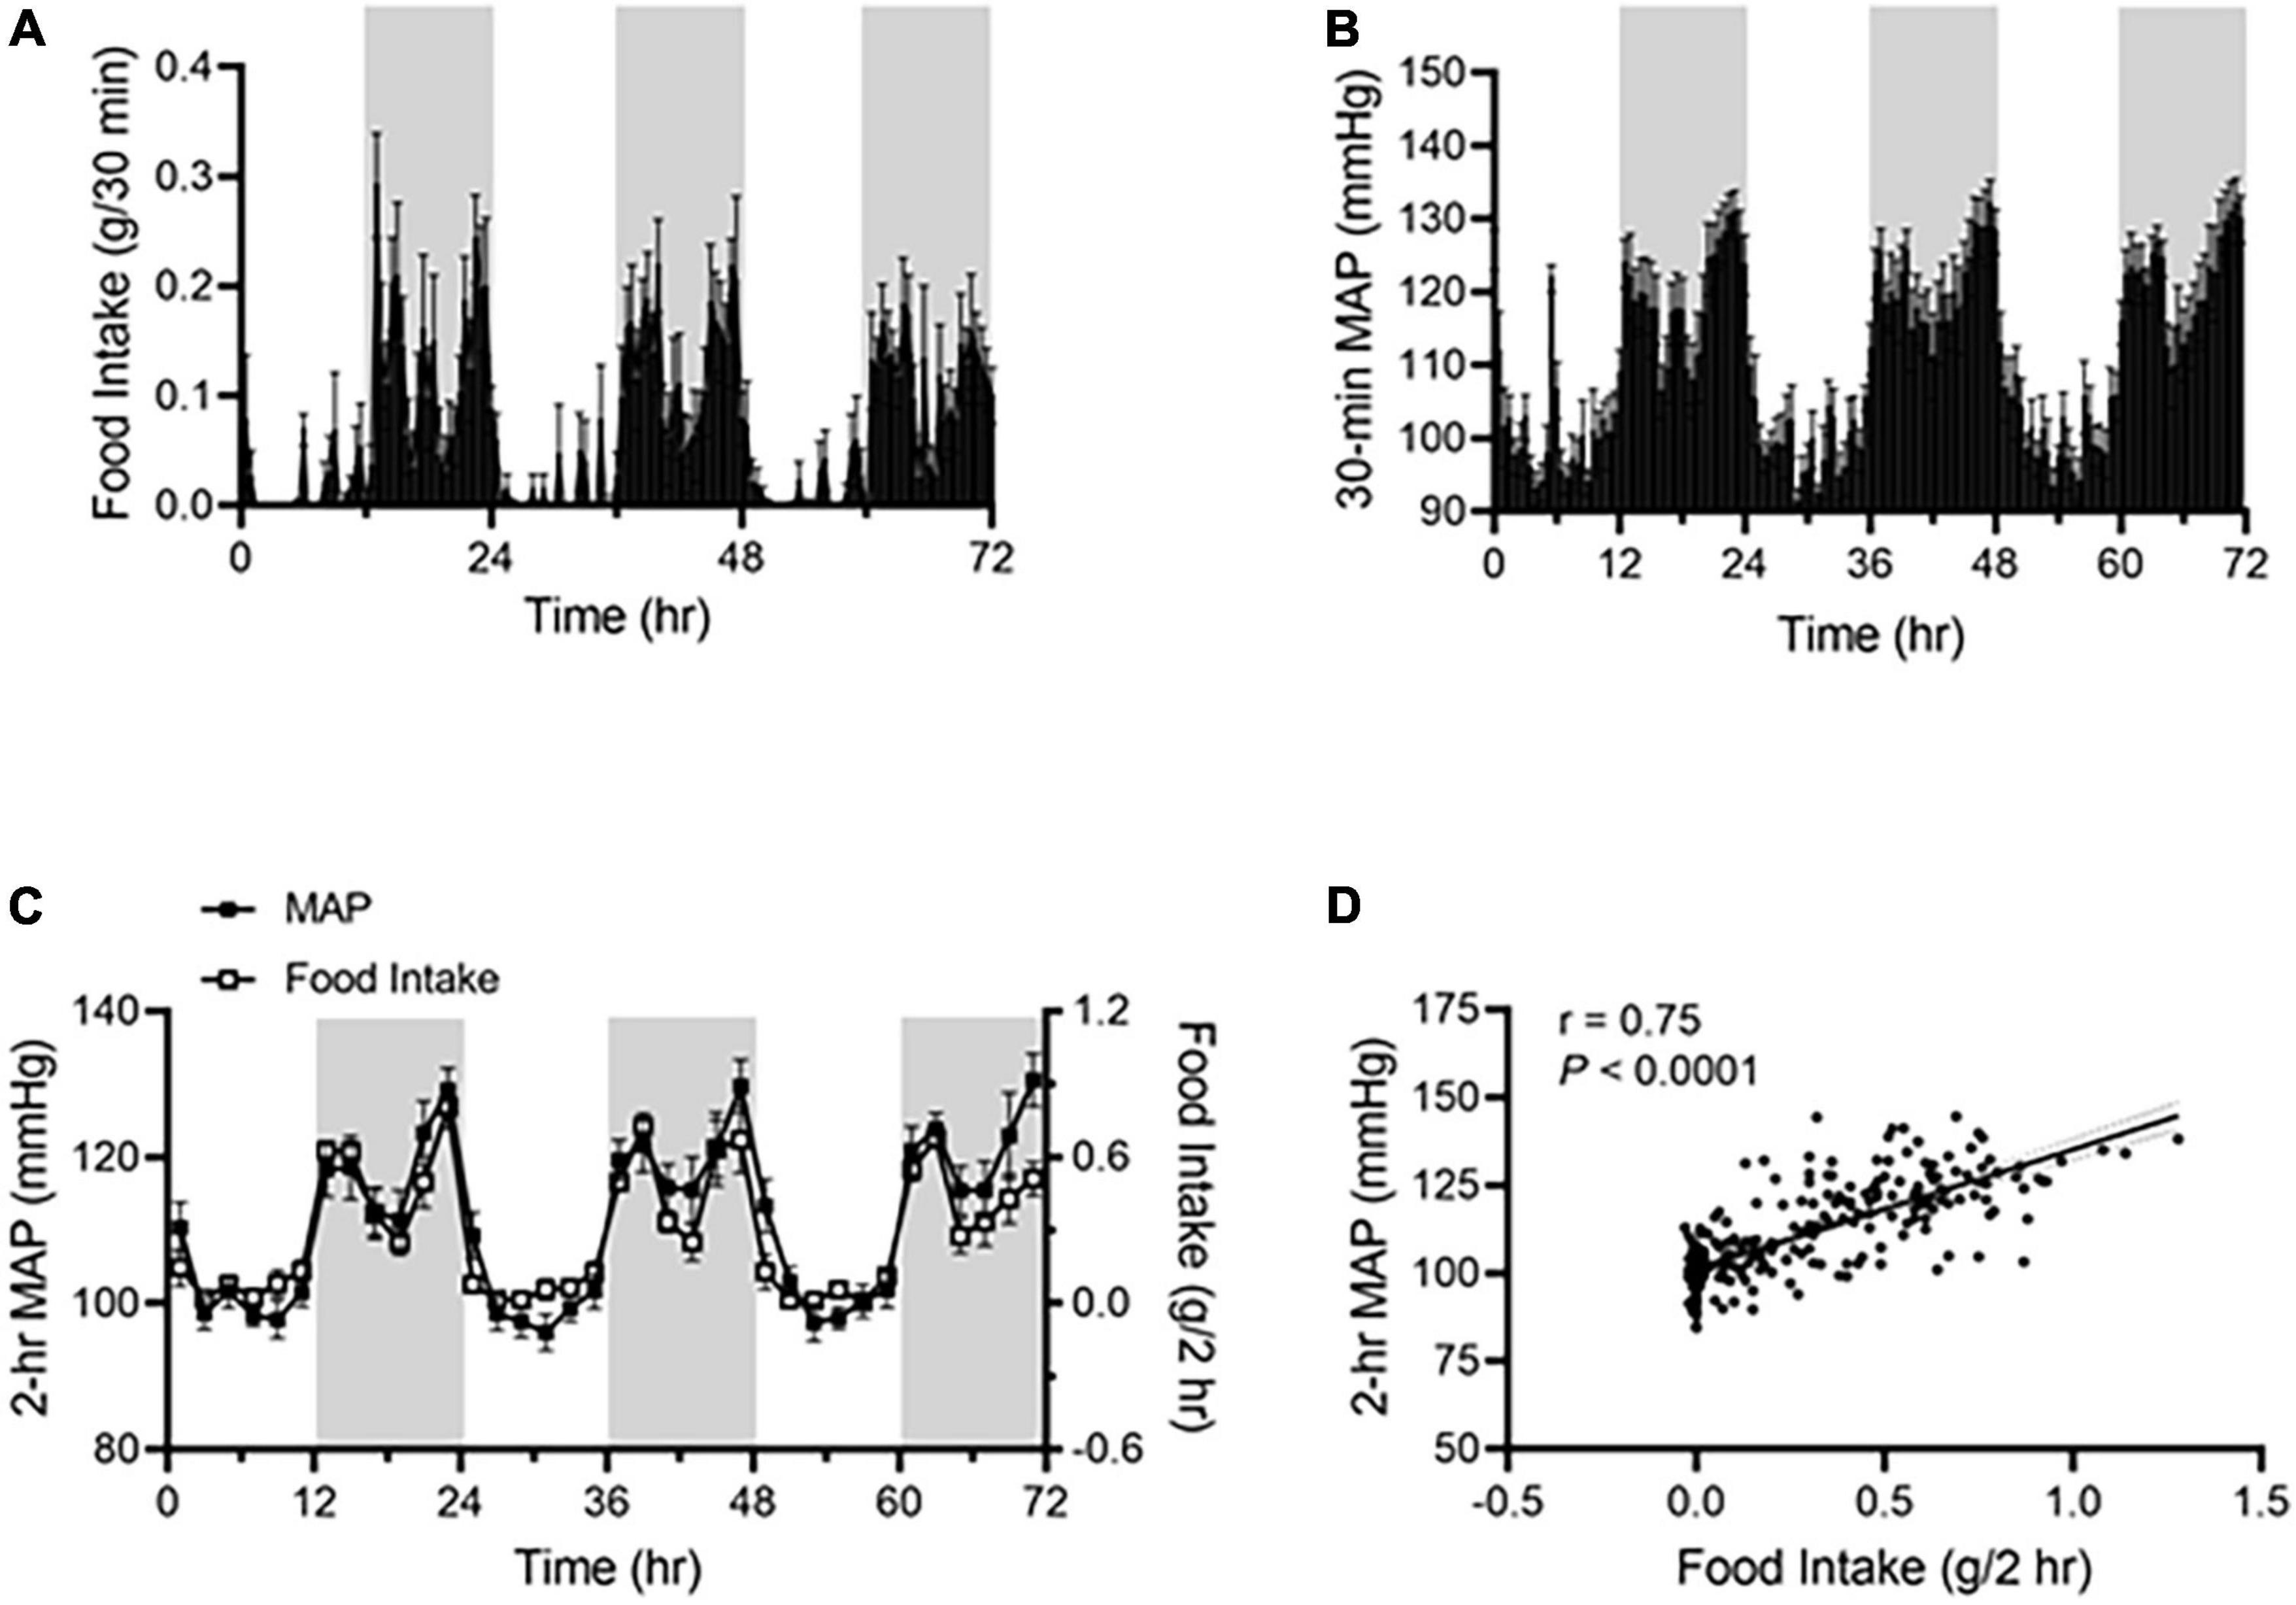
Figure 1. Food intake correlates with BP rhythm in ad libitum-fed mice. Food intake and BP were recorded by BioDAQ and telemetry in 17-week-old male C57BL/6J mice (N = 7). (A,B) Daily profiles of accumulated food intake (A) and average mean arterial pressure [MAP; (B)] in 30-min (min) intervals over 72-h during the light and dark phases, shown in white and gray, respectively. (C) Average MAP (left axis) and accumulated food intake (right axis) in 2-h intervals over 72-h during the light and dark phases. (D) Linear regression analysis of average MAP and accumulated food intake in 2-h intervals. Data were expressed as the mean ± standard error of the mean (SEM).
As shown in Figure 2A, light-phase TRF started with food withdrawal on day 4 during the dark phase, leading to the shift of food consumption mostly during the dark phase (day 1-3) to exclusively during the light phase (day 4-10). In parallel with the shift in food intake, a rapid decrease in the dark-phase MAP occurred during the first day of light-phase TRF (day 4; Figure 2B) and nearly reached a steady state by the second day of light-phase TRF (day 5; Figure 2B). In contrast, an increase in the light-phase food intake and MAP was observed on the second day of light-phase TRF and reached a steady state on the fourth day of light-phase TRF (day 7; Figures 2A,B).
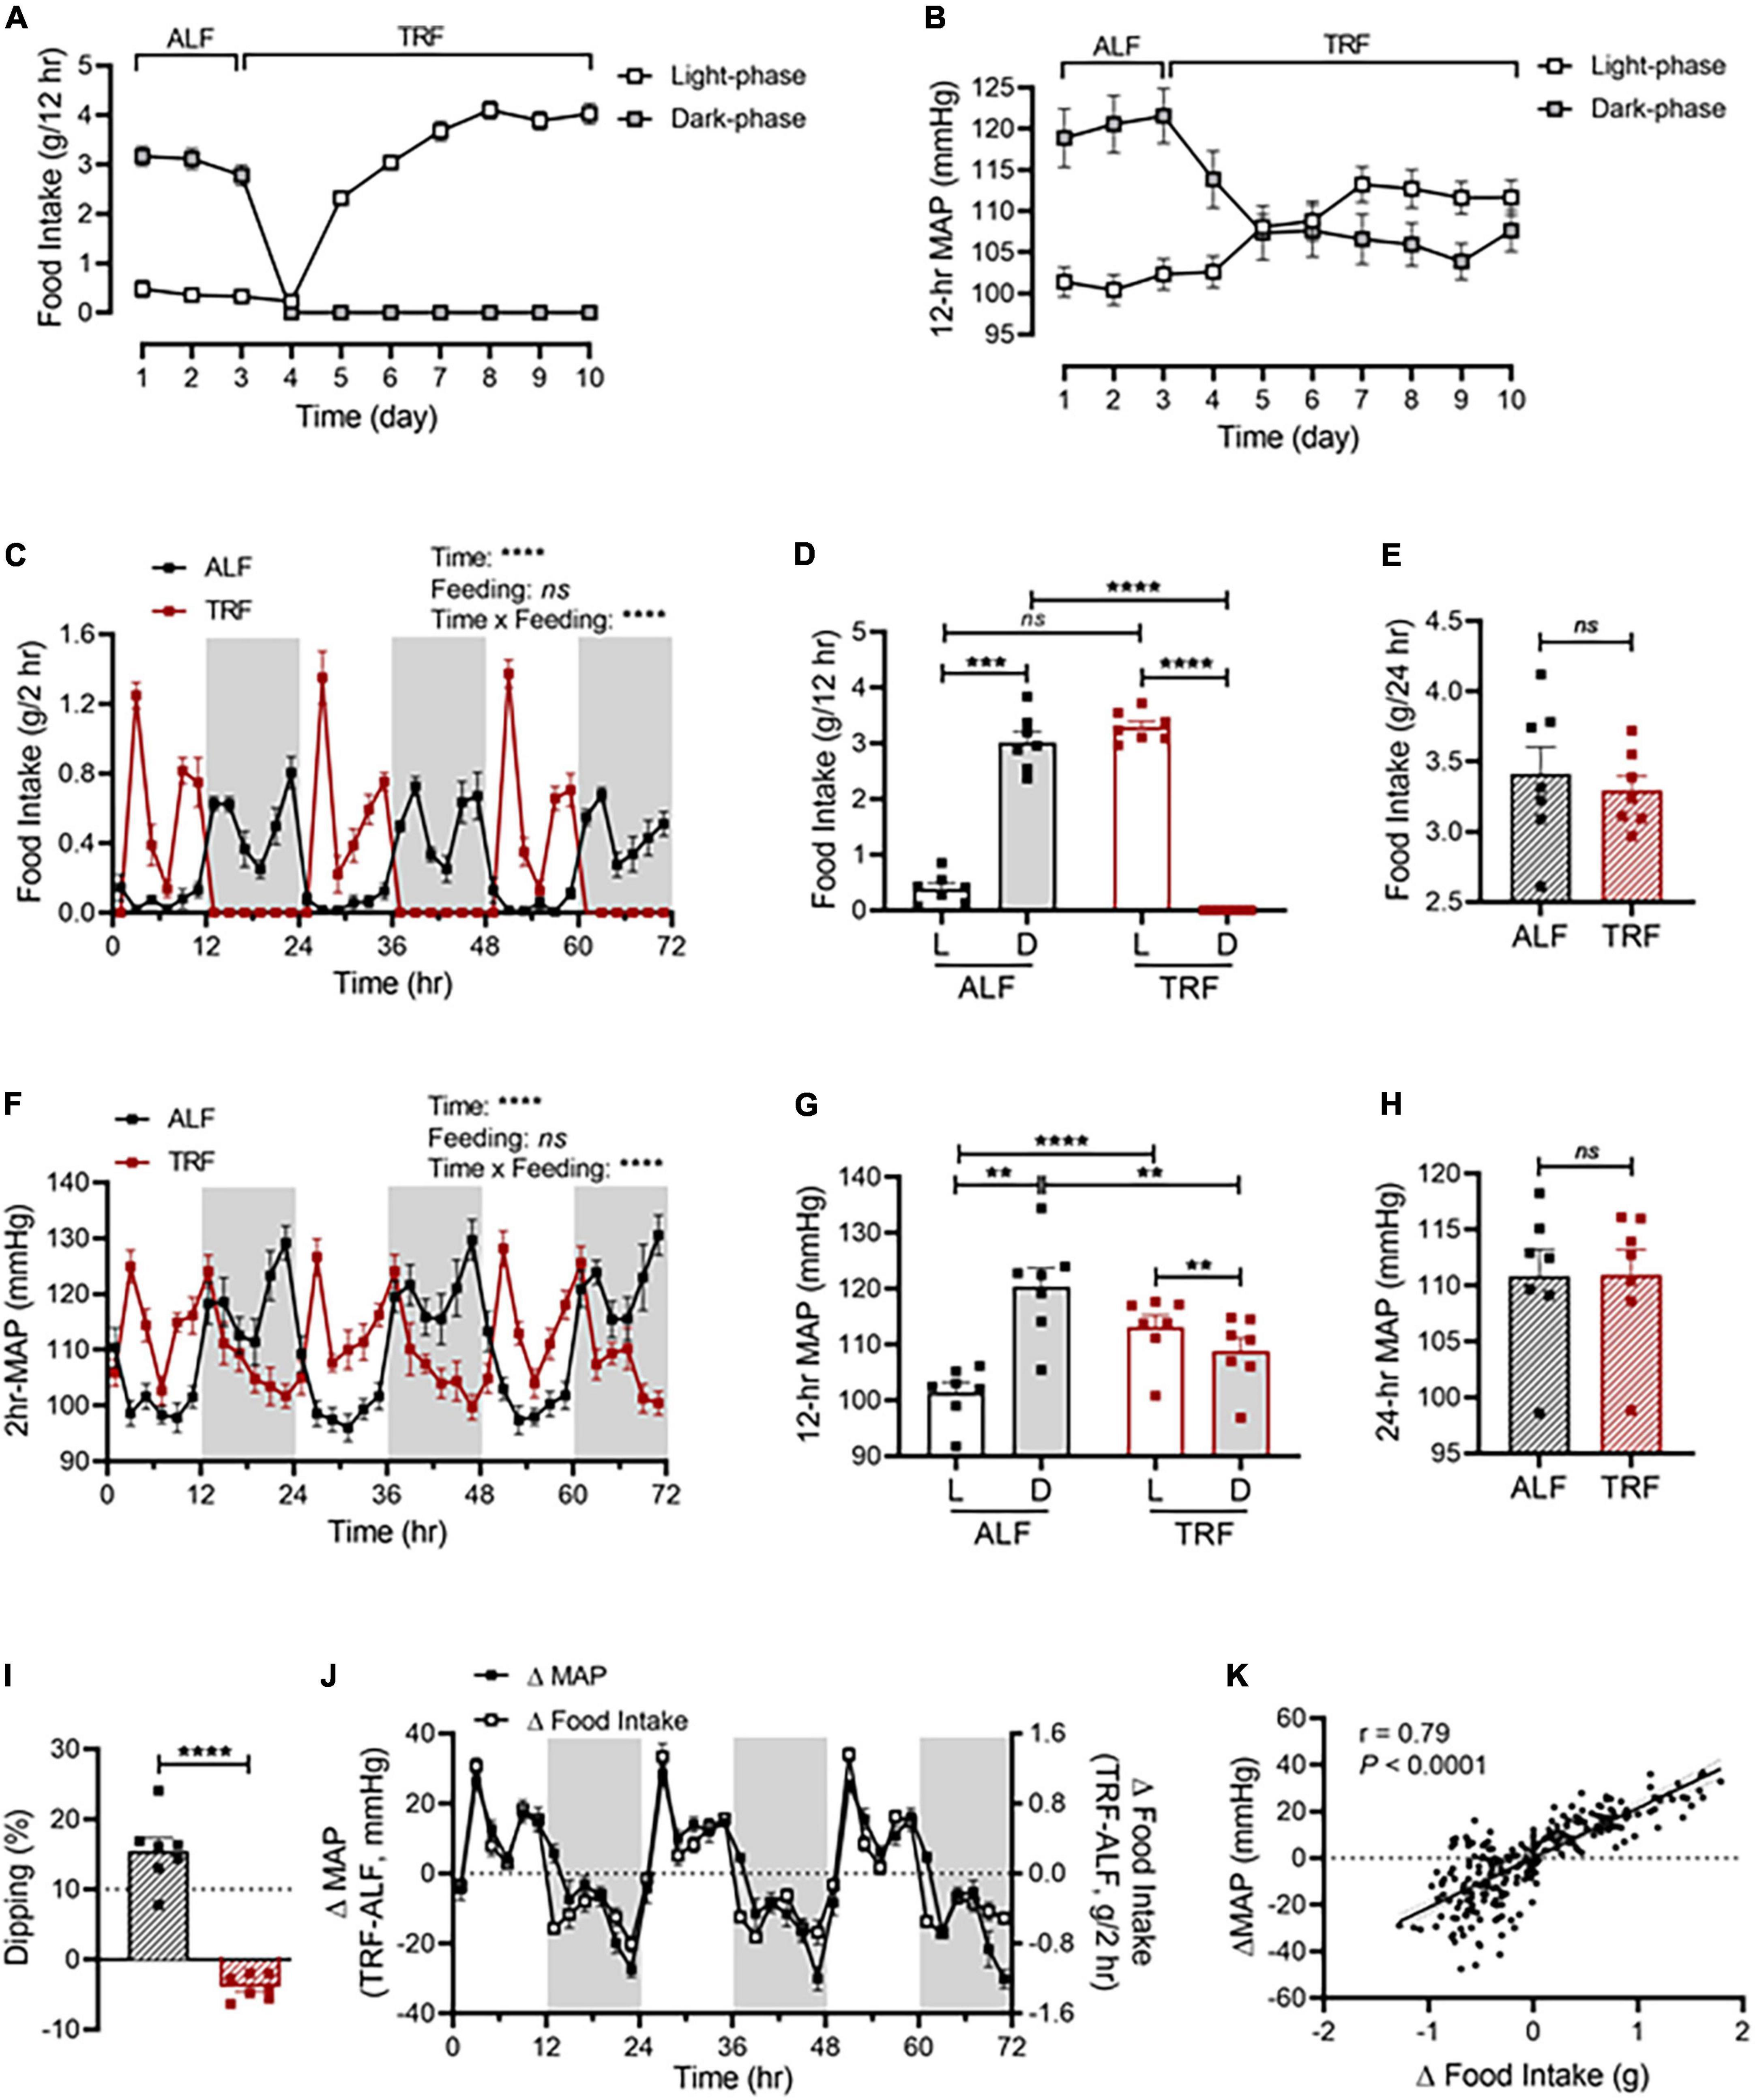
Figure 2. Light-phase TRF rapidly alters BP rhythm. (A,B) Accumulated food intake (A) and average MAP (B) during the light and dark phase in 17-week-old male C57BL/6J mice (N = 7) under 3 days of ALF, followed by 7 days of TRF. (C–E) Accumulated food intake in 2-h (C), 12-h (D), and 24-h (E) intervals over 3 days under ALF and during the last 3 days under light-phase TRF. (F–H) Average MAP in 2-h (F), 12-h (G), and 24-h (H) intervals over 3 days of ALF and the last 3 days under light-phase TRF. (I) MAP dipping with ALF and reverse dipping with light-phase TRF. (J) Net changes in accumulated food intake (Δfood intake) and average MAP (ΔMAP) in 2-h intervals over 72 h. (K) Linear regression of Δfood intake and ΔMAP. Data were expressed as the mean ± SEM and analyzed by repeated two-way ANOVA with matching conditions between light vs. dark phase and between ALF vs. light-phase TRF with Tucky’s post-hoc analysis (C,D,F,G), paired t-test (E,H,I), and simple linear regression (K).**P < 0.01; ***P < 0.001; ****P < 0.0001; ns, not significant.
Light-phase TRF induced a phase shift of food intake and MAP from the dark phase to the light phase (Figures 2C,F). Cosinor analysis showed that the acrophase of MAP was shifted from ZT19.2 ± 0.2 with ALF to ZT9.7 ± 0.3 after light-phase TRF (Supplementary Table 2). Consequently, there was a significant increase in the food intake and MAP during the light phase and a significant decrease in the food intake and MAP during the dark phase, respectively (Figures 2D,G). As a result, the light-dark phase MAP difference under ALF was reversed under light-phase TRF (Figure 2G) and the amplitude of MAP oscillation was decreased after light-phase TRF compared to ALF (Supplementary Table 2). When analyzing the dipping status, light-phase TRF resulted in reverse-dipping of BP (Figure 2I). In contrast, light-phase TRF did not affect 24-h average MAP (Figure 2H). Interestingly, the 24-h daily food intake was comparable between ALF and light-phase TRF (Figure 2E).
To further define whether changes in MAP during light-phase TRF temporally correlate with the changes in food intake, we calculated the net differences in food intake and MAP between ALF and light-phase TRF by subtracting food intake or MAP during ALF from light-phase TRF. We found that the net differences in food intake were almost completely parallel to the net difference in MAP (Figure 2J), indicating a change in food intake can timely trigger a change in MAP. Linear regression analysis revealed a significant correlation between Δfood intake and ΔMAP (Figure 2K). Light-phase TRF also induced similar changes in SBP (Supplementary Figures 1A–D) and DBP (Supplementary Figures 1E–H).
Telemetry also recorded heart rate and locomotor activity in mice under ALF or light-phase TRF. Similar to its effects on BP, light-phase TRF also induced similar changes in locomotor activity (Supplementary Figures 2A-C) and heart rate (Supplementary Figures 2D-F). Notebly, the net changes in locomotor activity also parallel to the net differences in MAP (Supplementary Figure 2G) and linear regression analysis showed a significant correlation between Δlocomotor activity and ΔMAP (r = 0.79, Supplementary Figure 2H). To further evaluate whether alterations in locomoter activity mediates light-phase TRF induced BP changes, we analyzed the effects of light-phase TRF on MAP after adjusting for locomotor activity using ANCOVA. The result showed that locomotor activity is a covariate [F (1,23) = 6.618, p = 0.017], however, the feeding method (ALF vs. TRF) still has a significant effect on BP even after adjusted for locomotor activity [F (1,23) = 4.64, p = 0.042].
To explore whether clocks are involved in light-phase TRF-induced BP circadian rhythm alteration, we determined Per2 protein expression by in vivo imaging in the liver and kidney in 17-week-old male mPer2Luc mice at ZT5, ZT11, ZT17, and ZT23 under ALF and on day 3 and day 7 of light-phase TRF using IVIS Spectrum. Under ALF, Per2 bioluminescence peaked at ZT17 during the dark phase in the liver and kidney (Figures 3A-C). Light-phase TRF for 3 days advanced Per2 bioluminescence for 6 h in the liver and kidney, with the highest at ZT11 during the light phase (Figures 3A-C). Prolonged light-phase TRF from 3 to 7 days did not further shift the Per2 bioluminescence phase in the liver and kidney since no difference was observed in Per2 protein diurnal variations between day 3 and day 7 under light-phase TRF (Figures 3A-C).
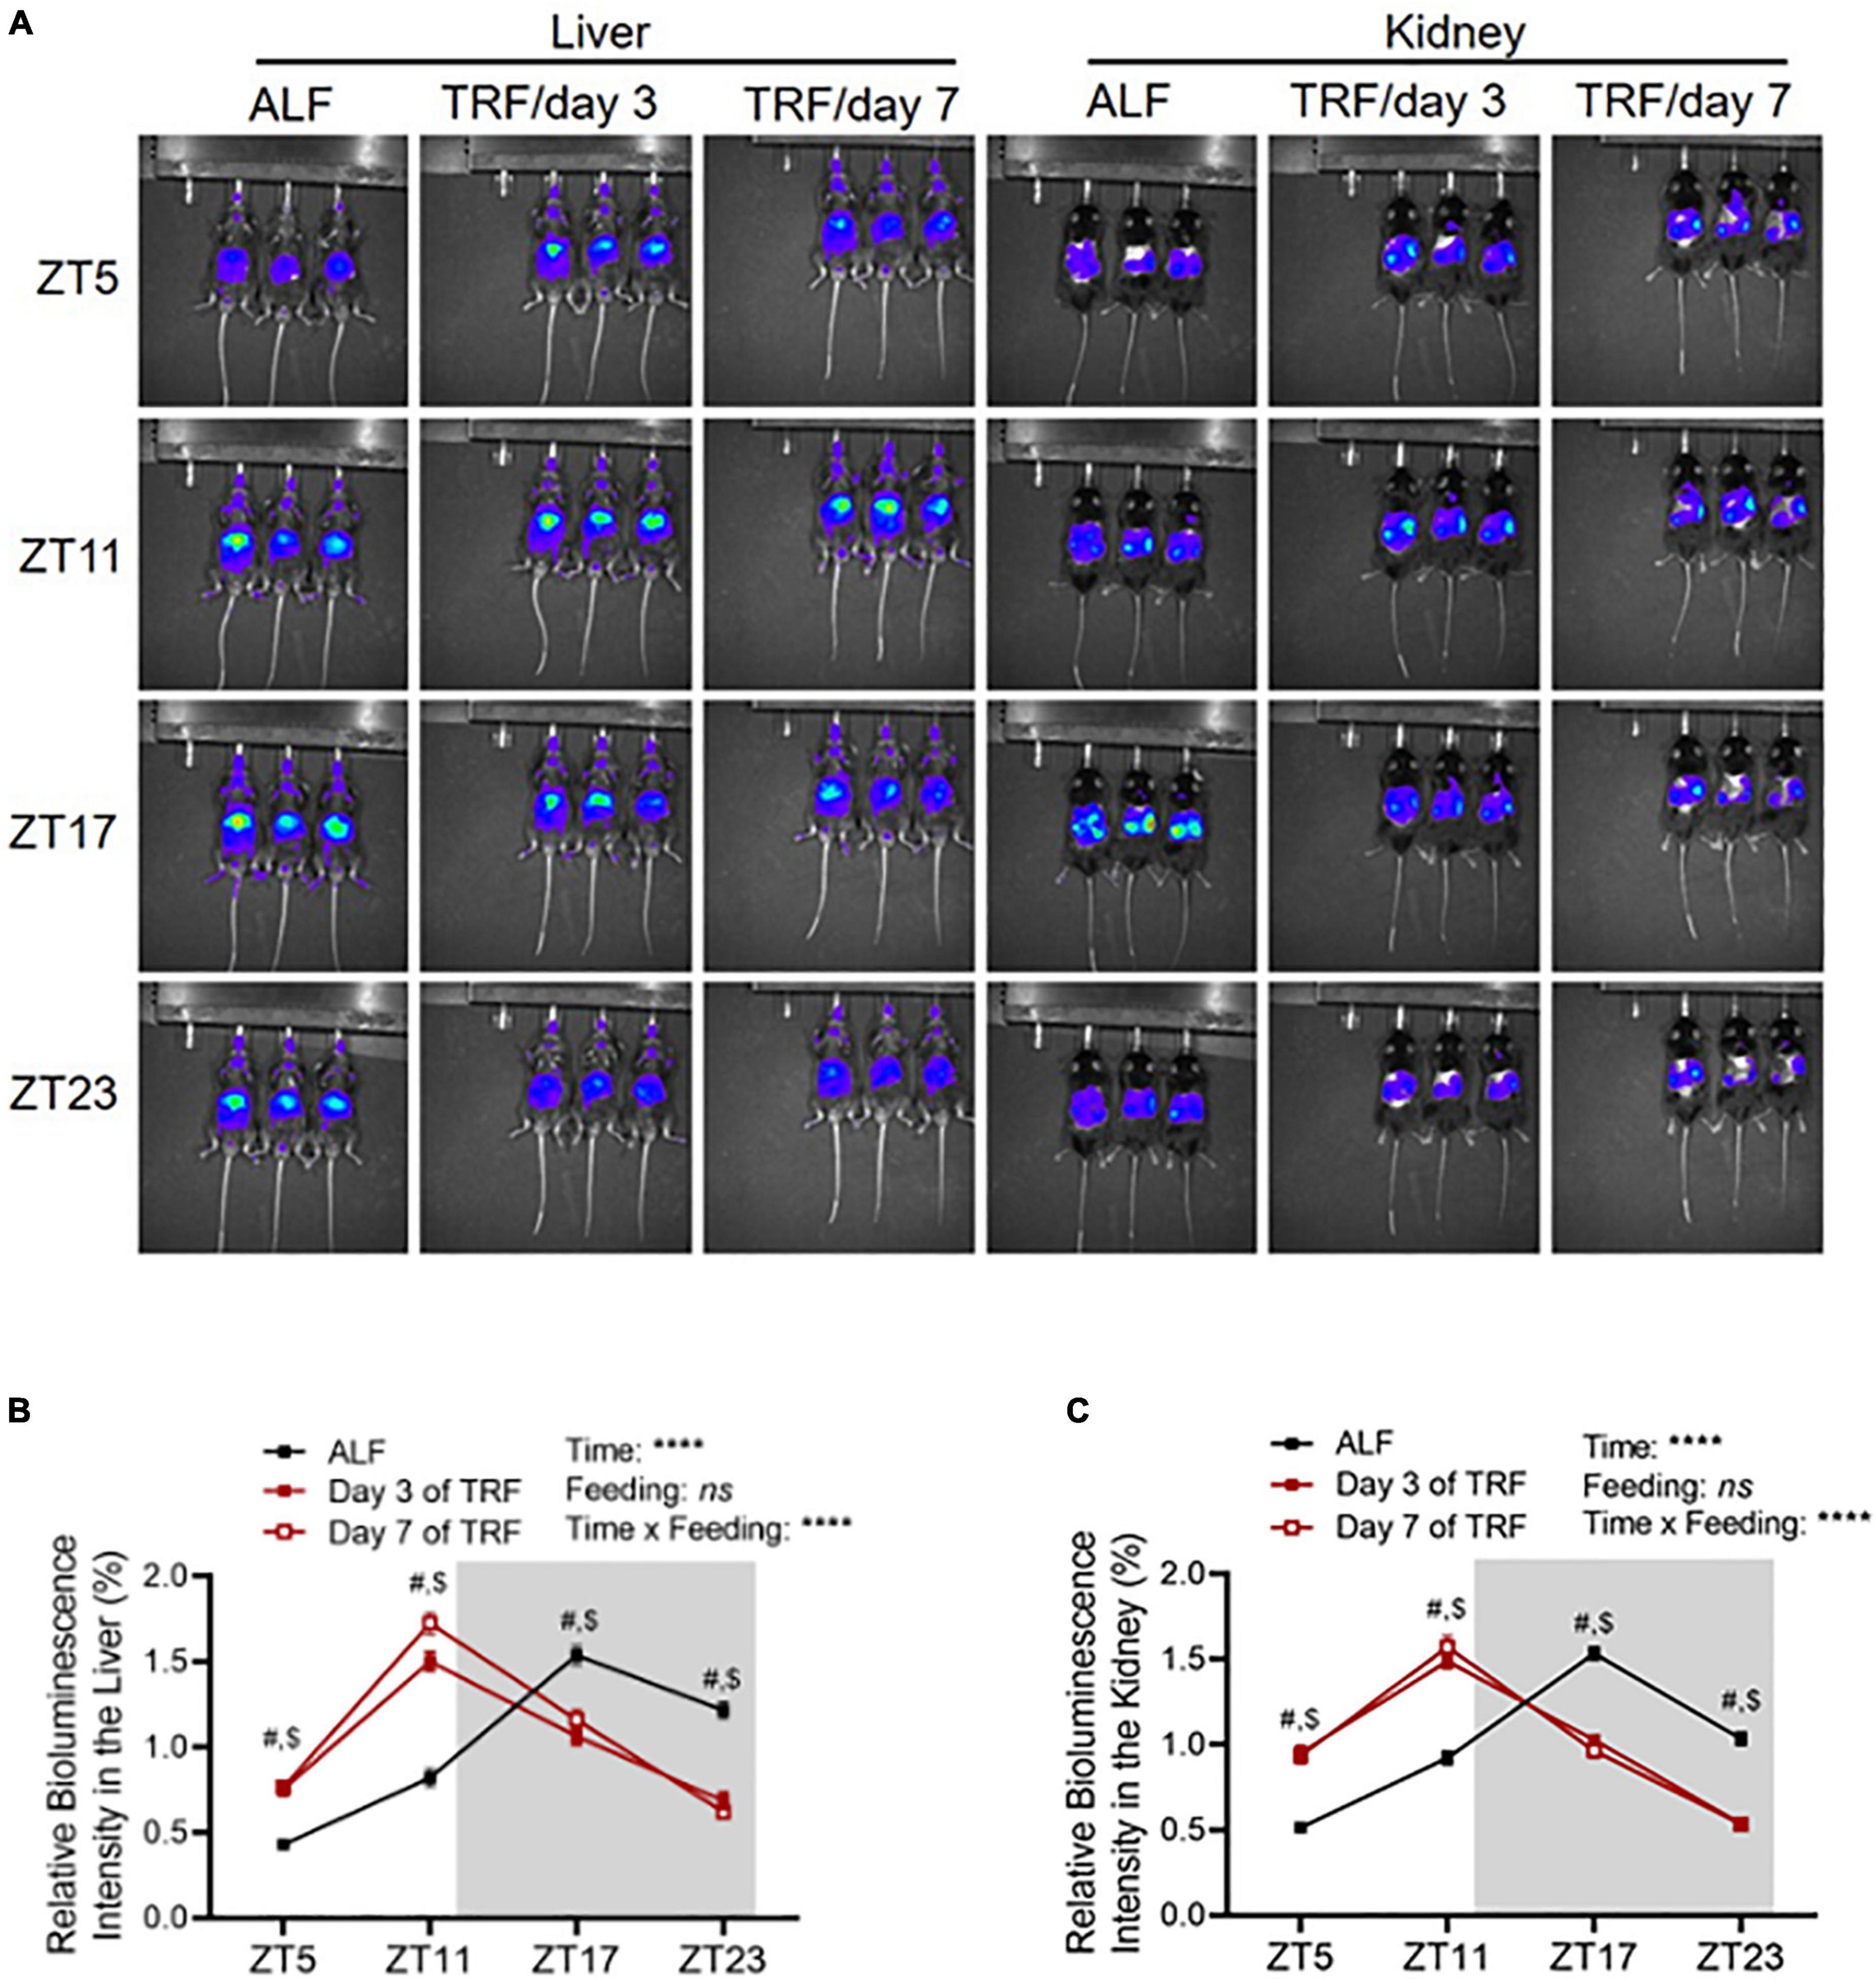
Figure 3. Light-phase TRF shifts Per2 protein daily oscillation. (A) Representative images of Per2 bioluminescence in the liver and kidney in 17-week-old male mPer2Luc mice under ALF and at day 3 and day 7 after light-phase TRF. (B,C) Relative Per2 bioluminescence intensity in the liver (B) and kidney (C) under ALF and day 3 and day 7 after light-phase TRF. Data were expressed as the mean ± SEM (N = 17) and analyzed by repeated two-way ANOVA with matching conditions between ZT and between ALF vs. light-phase TRF with Tucky’s post–hoc analysis (B,C). #, ALF vs. day 3 after TRF, P < 0.0001. $, ALF vs. day 7 after TRF, P < 0.0001.
To explore whether light-phase TRF might modify the sympathetic nervous system (SNS), thus altering BP circadian rhythm in wild-type mice, we first calculated the heart rate variability (HRV) in the same groups of ALF- and light-phase TRF-fed 17-week-old wild-type C57BL/6J mice described above. HRV was calculated by frequency and time domain measurements as the low-frequency spectral power (LFSP), high-frequency spectral power (HFSP), and root means square of successive RR interval differences (rMSSD). Under ALF, LFSP was lower in the dark phase than in the light phase (Figures 4A,B). Light-phase TRF did not change the average LFSP during the 12-h light phase but significantly increased LFSP during the 12-h dark phase (Figure 4B). Because food was available only for 10 h during the 12-h light phase under light-phase TRF, we also analyzed the HRV during the fasting (ZT2 to ZT12) vs. feeding (ZT13 to ZT2) period in mice under ALF and light-phase TRF to depict food intake-induced LFSP changes accurately. Interestingly, light-phase TRF vs. ALF significantly decreased the LFSP during the feeding period but increased the LFSP during the fasting period (Figure 4C). A similar result was also obtained from the HRV analysis of HFSP and rMSSD during the dark/fasting phase but not during the light/feeding period (Figures 4D-I).
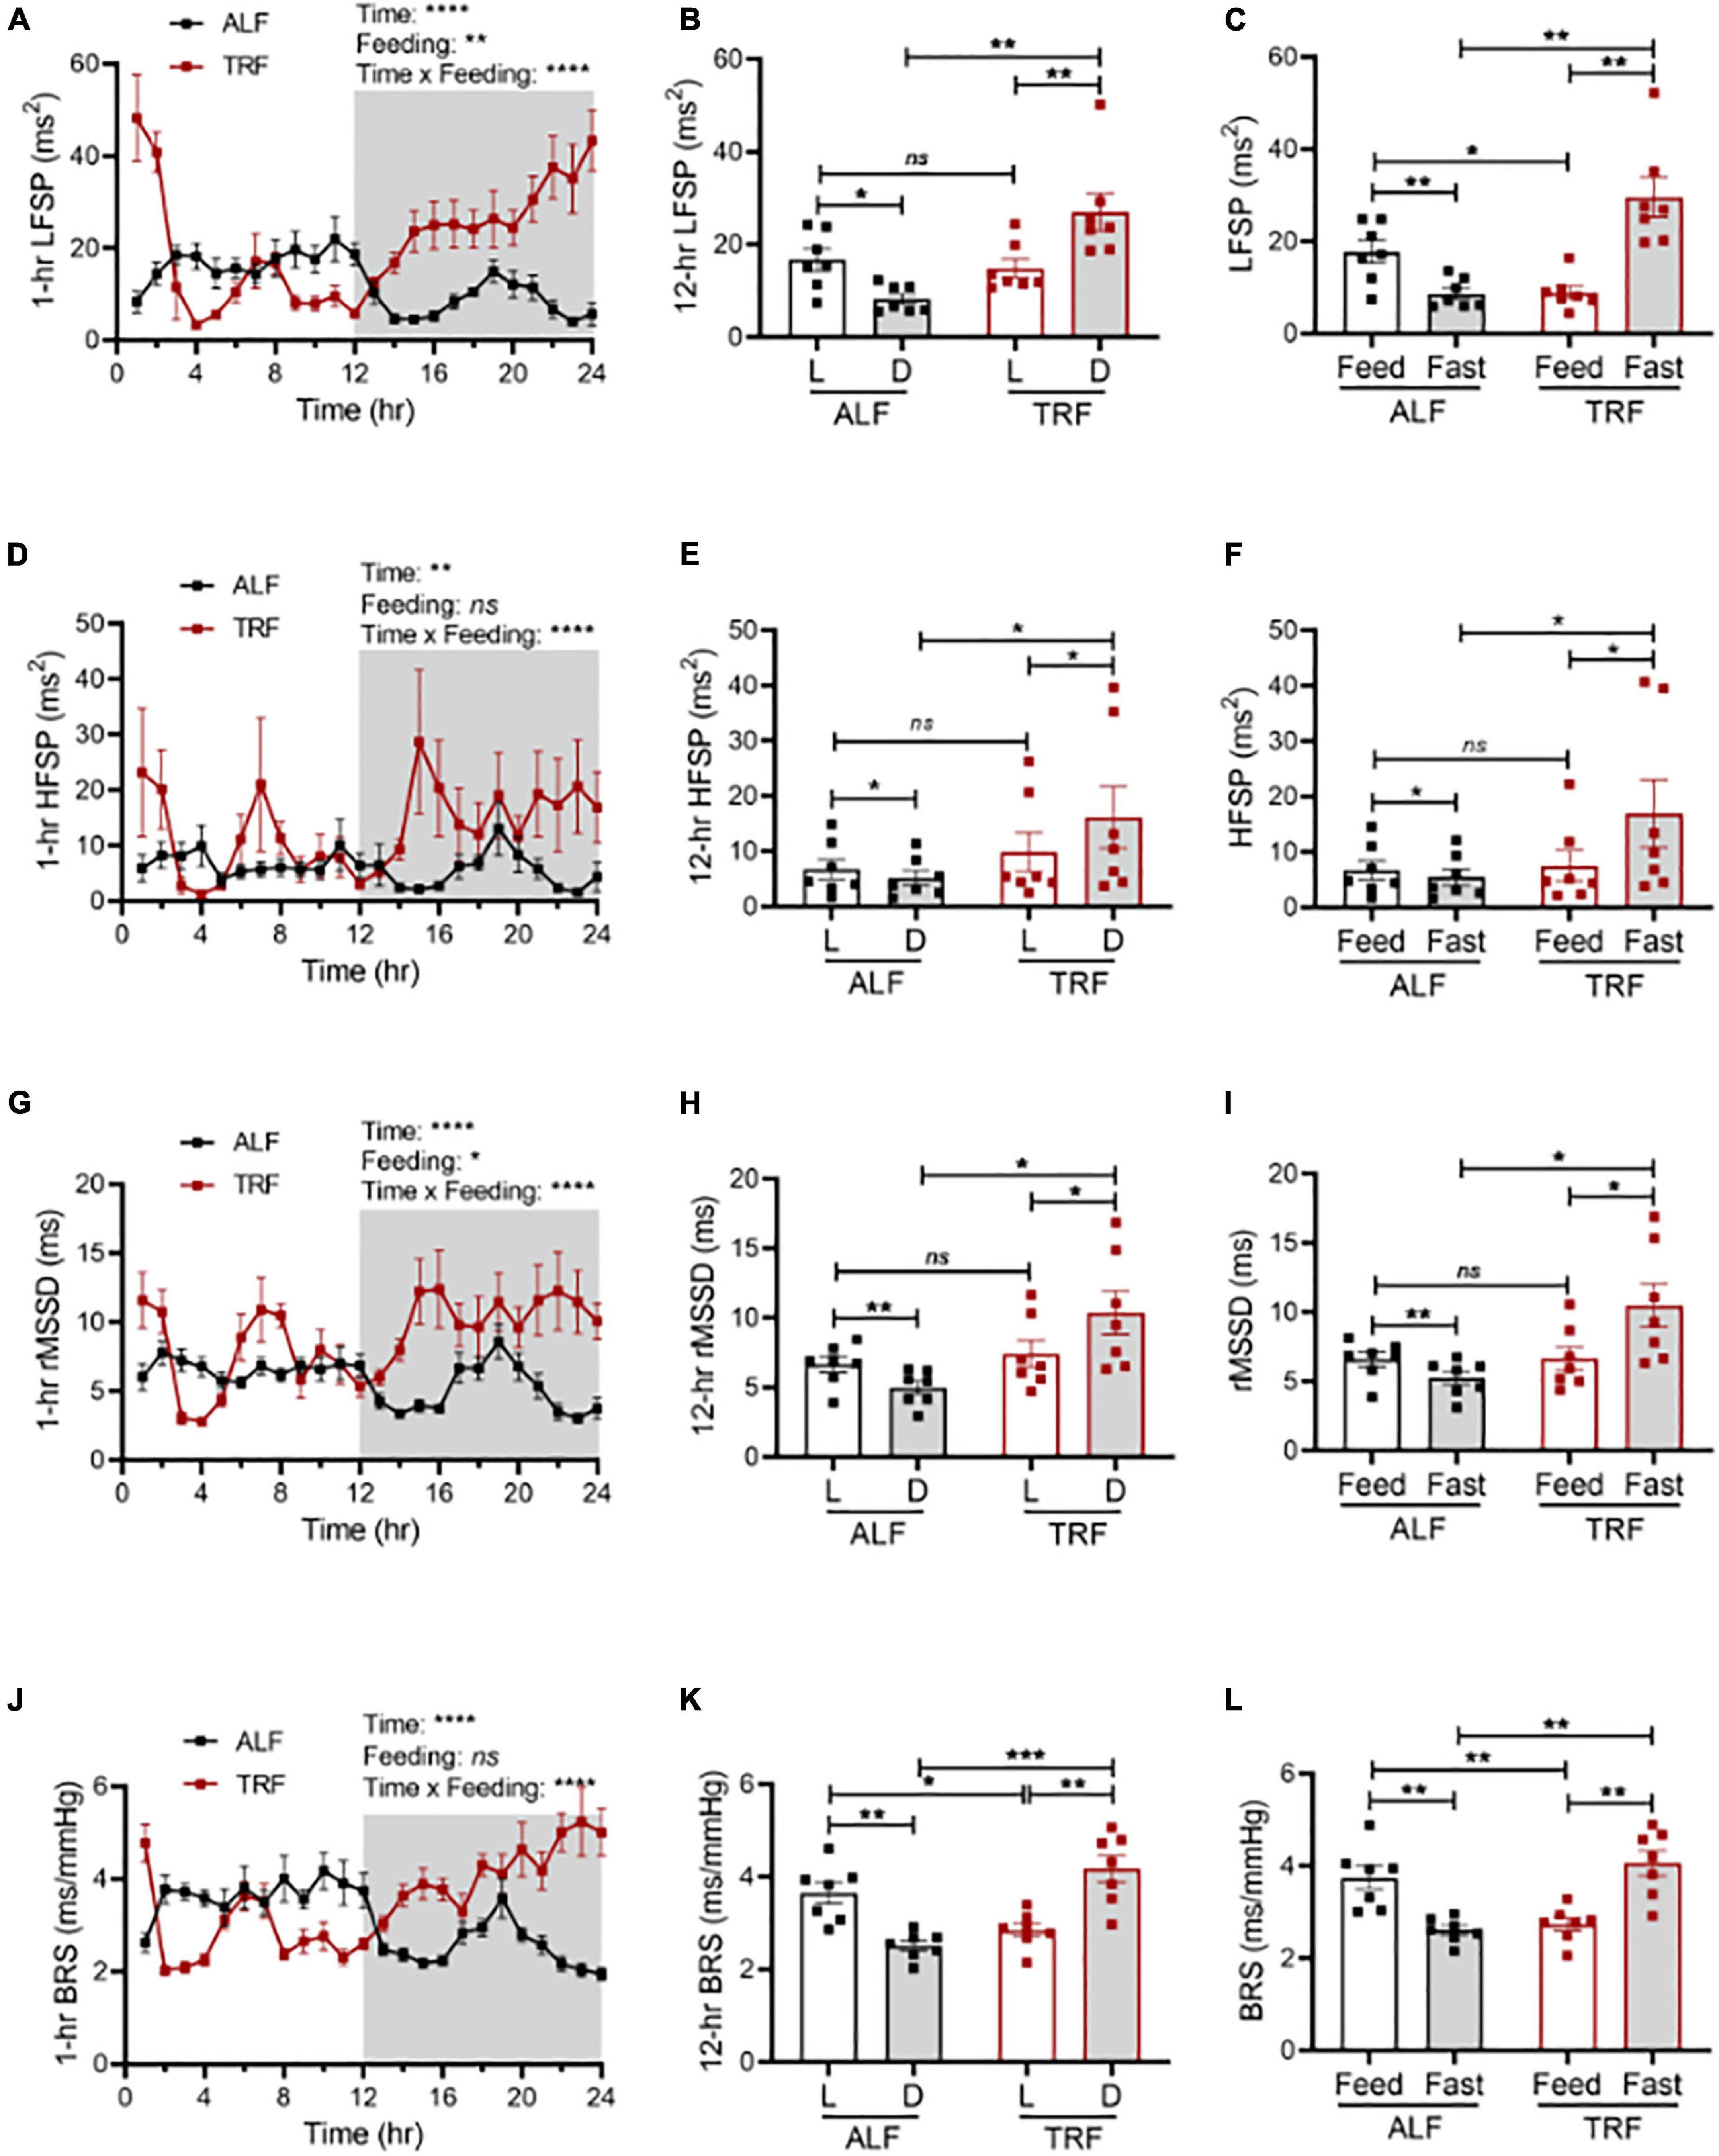
Figure 4. Light-phase TRF modulates autonomic nervous activity. Heart rate variability and cardiac baroreflex sensitivity (BRS) were calculated from BP data recorded 3 days under ALF and the last 3 days of TRF. N = 7. (A,B) Low-frequency spectral power (LFSP) in 1-h (A) and 12-h (B) intervals. (C) LFSP during feeding and fasting period. (D,E) High-frequency spectral power (HFSP) in 1-h (D) and 12-h (E) intervals. (F) HFSP during feeding and fasting period. (G,H) Root mean square of successive differences between normal heartbeats (rMSSD) in 1-h (G) and 12-h (H) intervals. (I) The rMSSD during the feeding and fasting period. (J,K) BRS in 1-h (J) and 12-h (K) intervals. (L) BRS during feeding and fasting period. Data were expressed as the mean ± SEM and analyzed by repeated two-way ANOVA with matching conditions between light vs. dark phase or feed vs. fast and between ALF vs. light-phase TRF with Tucky’s post–hoc analysis (A–L). *P < 0.05; **P < 0.01; ***P < 0.001; ****P < 0.0001; ns, not significant.
We next determined spontaneous cardiac baroreflex sensitivity (BRS) in the same groups of ALF- and light-phase TRF-fed 17-week-old wild-type C57BL/6J mice described above. Results showed that mice have higher BRS during the light phase than during the dark phase under ALF (Figures 4J,K). Light-phase TRF significantly decreased BRS during the light phase (Figure 4K) or the feeding period (Figure 4L) but increased BRS during the dark phase (Figure 4K) or the fasting period (Figure 4L).
To more directly evaluate the role of the SNS in light-phase TRF-induced BP circadian rhythm alteration, we analyzed urinary norepinephrine (NE) and epinephrine (Epi) excretion during the light and dark phases in 15- to 16-week-old male mPer2Luc mice under ALF and light-phase TRF. The 12-h light- and dark-phase urine samples were collected in metabolic cages on day 4 of ALF and day 7 of light-phase TRF. Results showed that urinary NE and Epi exhibited a diurnal variation that is significantly lower during the light phase than during the dark phase in mice under ALF (Figures 5A,B), which coincided with BP rhythm (i.e., Figure 2G). Also, in line with its effect on BP circadian rhythm alteration, light-phase TRF significantly suppressed urinary NE and Epi during the dark phase (Figures 5A,B). In addition, light-phase TRF also had a trend of increased urinary NE and a significant increased urinary Epi excretion during the light phase (Figures 5A,B). As a result, diurnal variations of urinary NE and Epi excretion were abolished in mice under light-phase TRF (Figures 5A,B).
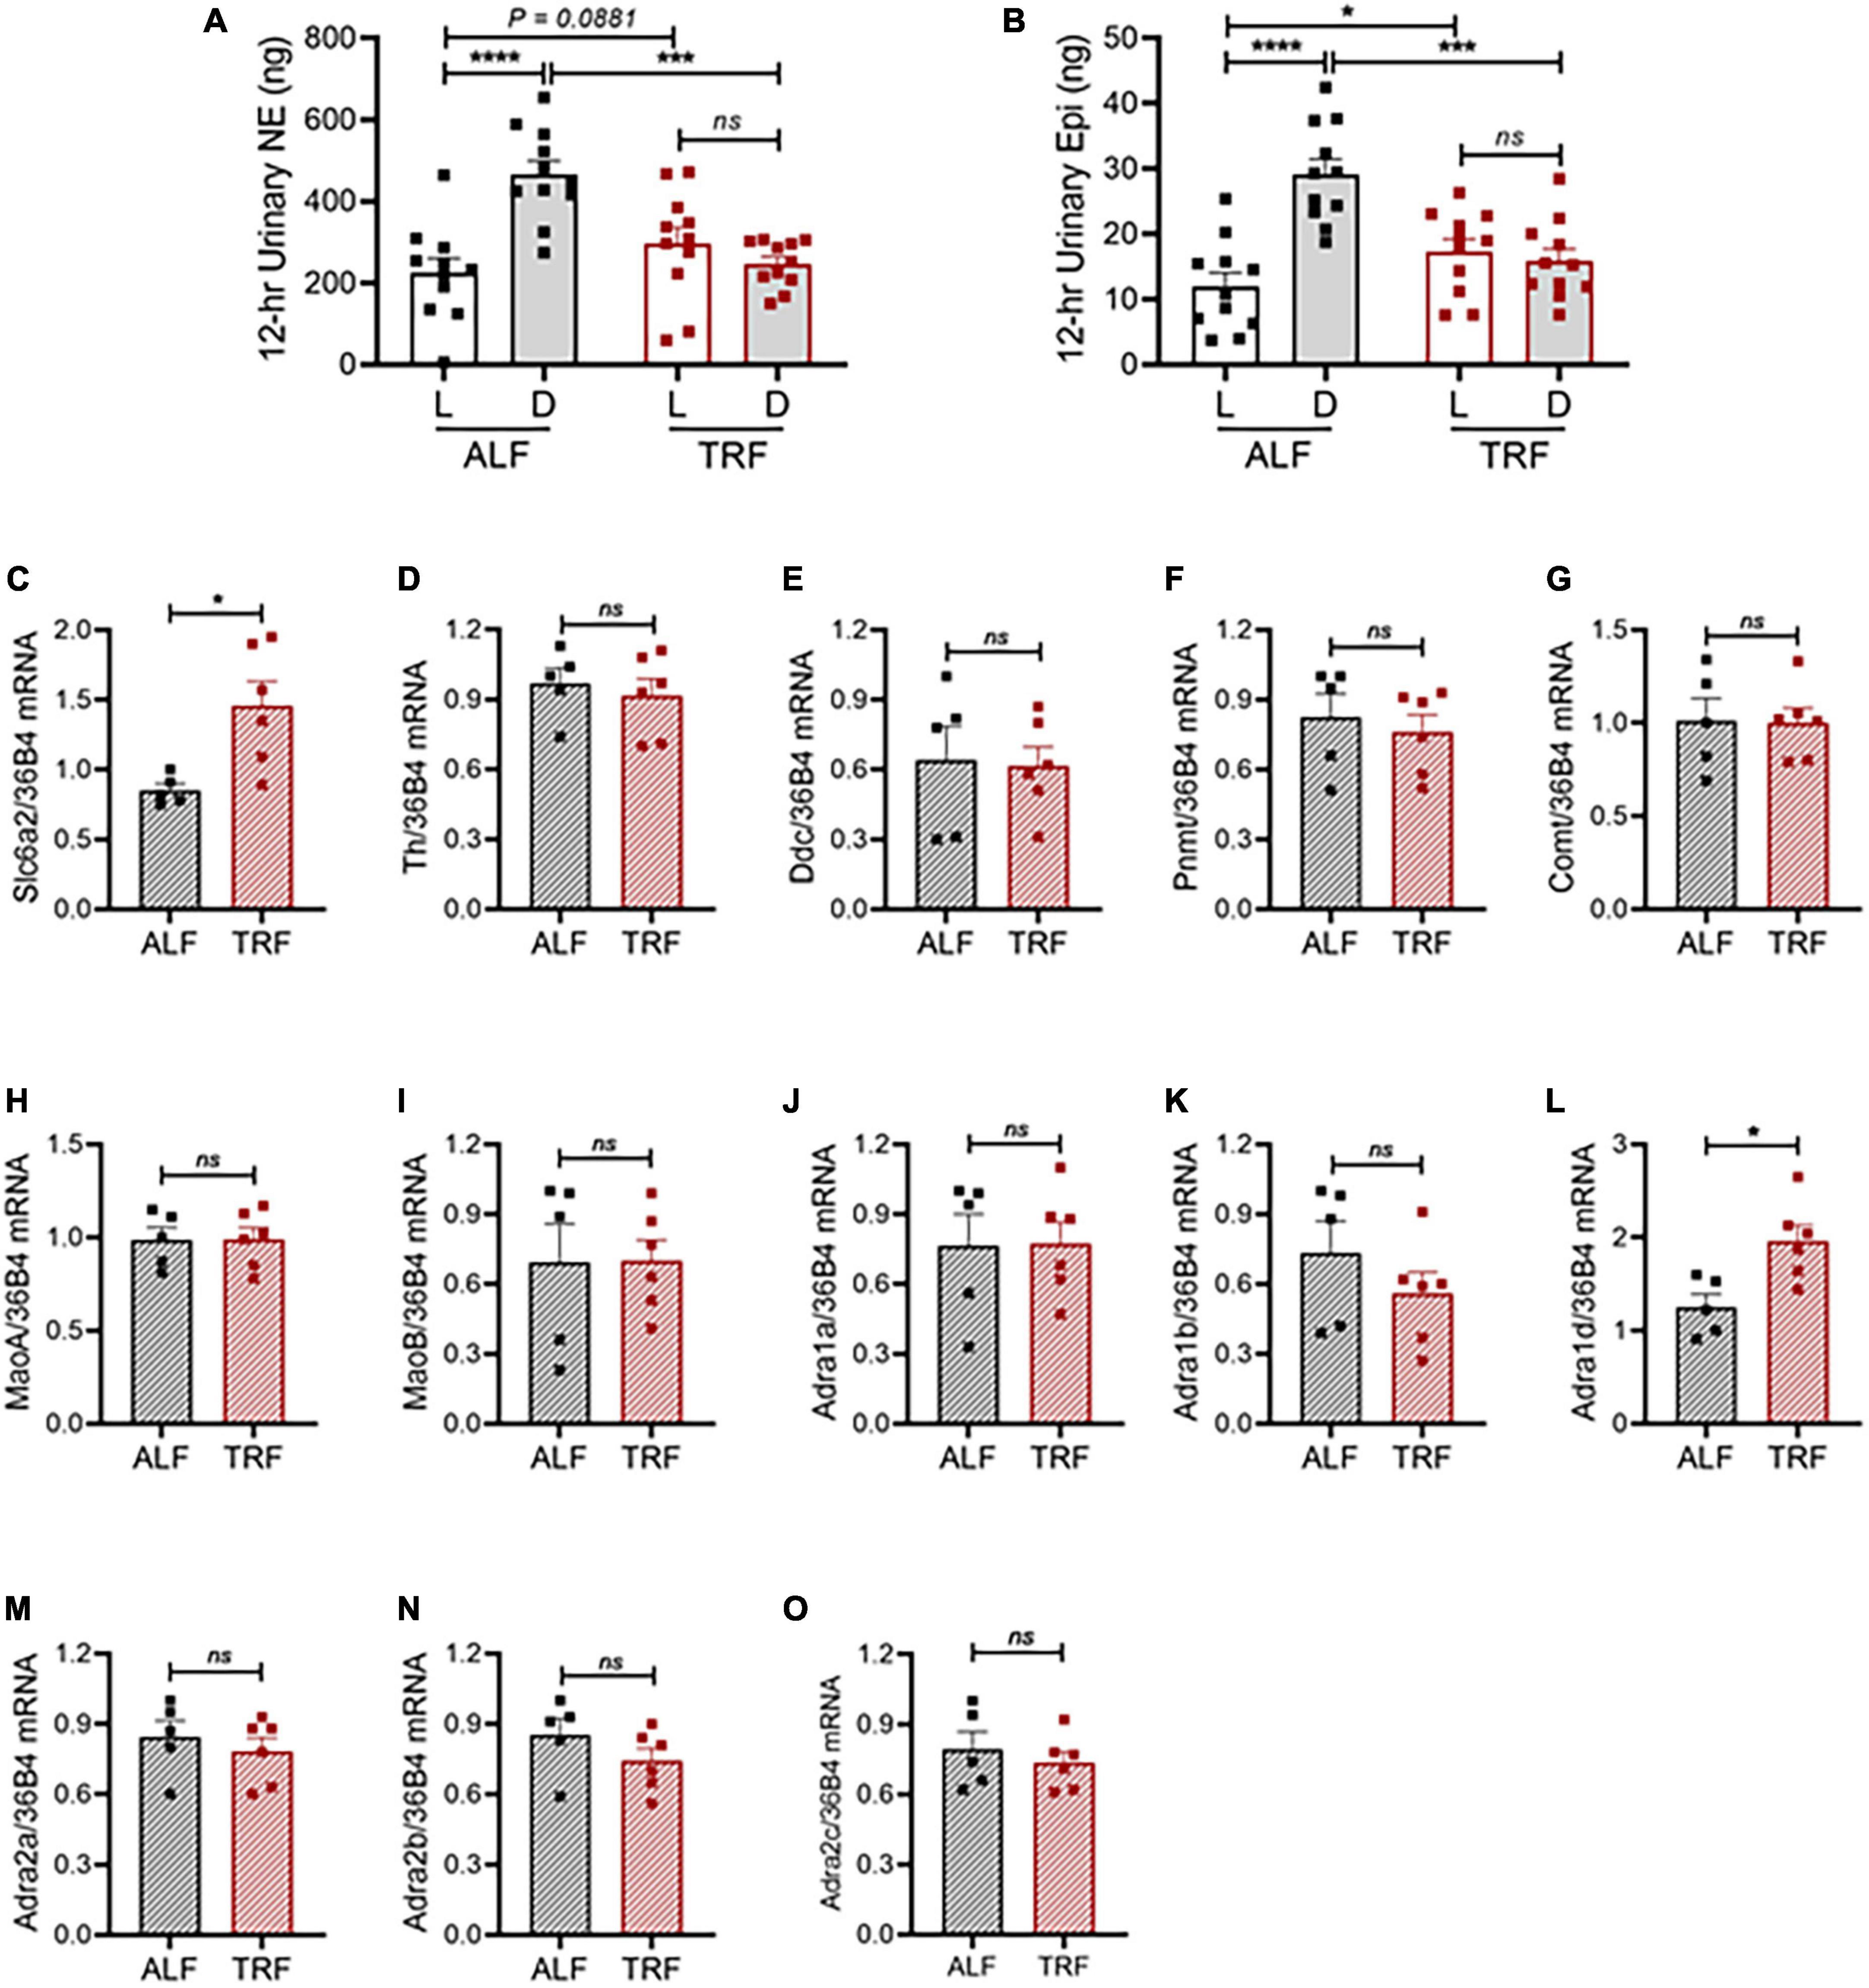
Figure 5. Light-phase TRF alters the sympathetic pathway. (A,B) Urinary norepinephrine [NE; (A)] and epinephrine [Epi; (B)] during the light and dark phases in 15- to 16-week-old male mPer2Luc mice (N = 11) under ALF and the 7th day of light-phase TRF. (C–O) mRNA expression of solute carrier family 6 member 2 [(Slc6a2, (C)], tyrosine hydroxylase [Th, (D)], dopa decarboxylase [Ddc, (E)], phenylethanolamine N-methyltransferase [Pnmt, (F)], catechol-O-methyltransferase [Comt, (G)], monoamine oxidase A [MaoA, (H)], monoamine oxidase B [MaoB, (I)], alpha-1a adrenergic receptor [Adra1a, (J)], alpha-1b adrenergic receptor [Adra1b, (K)], alpha-1d adrenergic receptor [Adra1d, (L)], alpha-2a adrenergic receptor [Adra2a, (M)], alpha-2b adrenergic receptor [Adra2b, (N)], and alpha-2c adrenergic receptor [Adra2c, (O)] in mesenteric arteries isolated during ZT9 to ZT11 from 20-week-old male mPer2Luc mice under ALF and 7 days after light-phase TRF. N = 5 or 6 in each group. Data were expressed as the mean ± SEM and analyzed by repeated two-way ANOVA with matching conditions between light vs. dark phase and between ALF vs. light-phase TRF with Tucky’s post hoc analysis (A,B) or unpaired t-test (C–O). *P < 0.05; ***P < 0.001; ****P < 0.0001; ns, not significant.
To investigate the molecular mechanism by which light-phase TRF induces BP circadian rhythm alteration, we determined mRNA expressions of the genes responsible for catecholamine biosynthesis, catabolism, and function in mesenteric resistant arteries in 20-week-old male mPer2Luc mice under ALF and 7 days after light-phase TRF. To rule out the potential effect of the timing on the gene expression, mice were euthanized at the same time (ZT9-ZT11). Interestingly, light-phase TRF significantly increased the expression of carrier family 6 member 2 (Slc6a2), a NE transporter (NET) gene, but did not affect expressions of tyrosine hydroxylase (Th) and dopa decarboxylase (Ddc), two NE biosynthesis enzyme genes, and phenylethanolamine N-methyltransferase (Pnmt), catechol-O-methyltransferase (Comt), and monoamine oxidase A and B (MaoA and MaoB), three NE catabolism genes (Figures 5C–I). Also of interest is the light-phase TRF upregulated alpha 1d adrenergic receptor (Adra1d) gene but not other subtype adrenergic receptors, including alpha 1a adrenergic receptor (Adra1a), alpha 1b adrenergic receptor (Adra1b), alpha 2a adrenergic receptor (Adra2a), alpha 2b adrenergic receptor (Adra2b), and alpha 2c adrenergic receptor (Adra2c) (Figures 5J–O).
Given that light-phase TRF reverses BP circadian rhythm in non-diabetic C57BL/6J mice (Figure 2), we hypothesized that light-phaseTRF was detrimental rather than beneficial to BP circadian rhythm in db/db mice. To test this hypothesis, 21-week-old wild-type male db/db mice were implanted with telemetry and acclimated in BioDAQ cages under ALF for 10 days, followed by light-phase TRF for 7 days. Food intake and BP were monitored simultaneously and continuously during the last 3 days of ALF and 7 days of light-phase TRF.
Compared with non-diabetic C57BL/6J mice, diabetic db/db mice under ALF exhibit dampened circadian rhythms in food intake (Figures 6A vs. 2C) and MAP (Figures 6D vs. 2F), lost the diurnal difference in food intake (Figures 6B vs. 2D) and MAP (Figures 6E vs. 2G), and were non-dippers (Figures 6G vs. 2I). Importantly, light-phase TRF significantly increased the food intake (Figures 6A,B) and MAP (Figures 6D,E) during the light phase while decreasing them during the dark phase in db/db mice (Figures 6A,B,D,E), resulting in reverse dipping BP (Figure 6G). Similar to its effect on MAP, light-phase TRF also induced a similar detrimental impact on SBP (Supplementary Figures 3A-D), DBP (Supplementary Figures 3E-H), locomotor activity (Supplementary Figures 4A-C), and heart rate (Supplementary Figures 4D-F). In contrast to its little effect on 24-h total food intake and average MAP in non-diabetic C57BL/6J mice (Figures 2E,H), light-phase TRF significantly reduced 24-h total food intake and average MAP in diabetic db/db mice (Figures 6C,F). Interestingly, despite its reduced food intake and daily MAP, light-phase TRF did not affect the body weight of db/db mice (Figure 6H), but significantly elevated blood glucose level in diabetic db/db mice (Figure 6I).
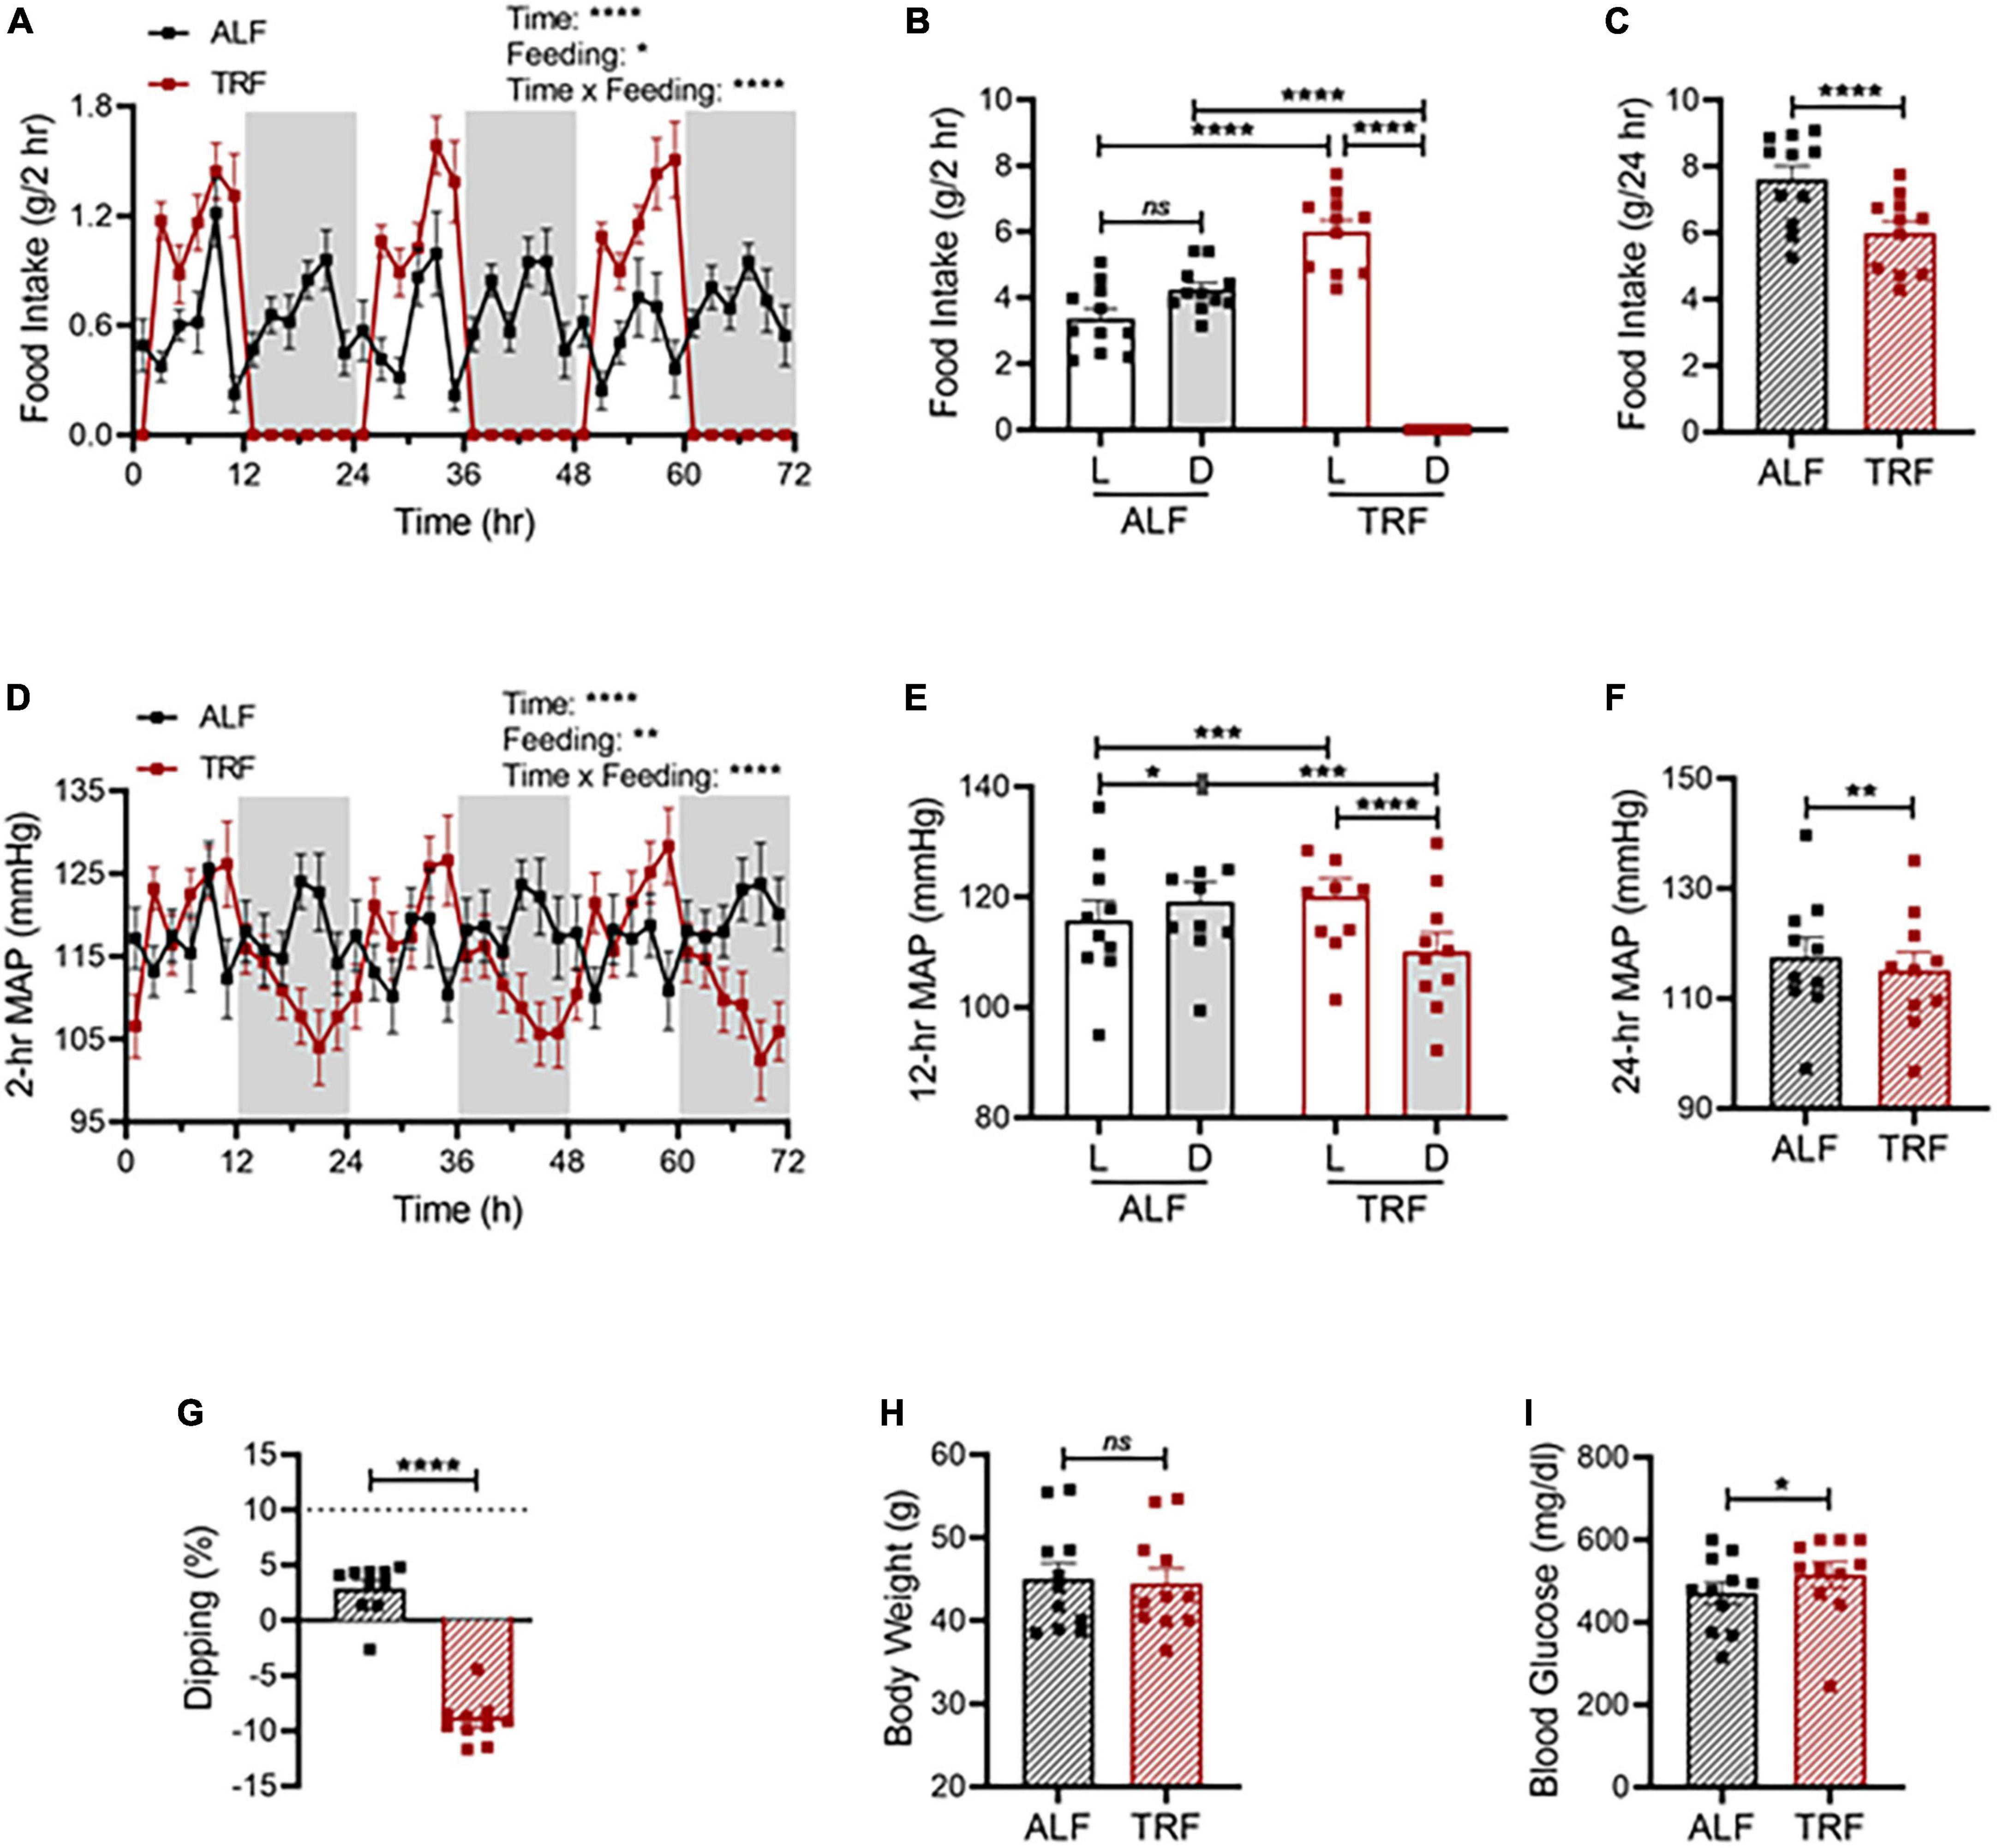
Figure 6. Light-phase TRF worsens BP rhythm and blood glucose in db/db mice. (A–C) Accumulated food intake in 2-h (A), 12-h (B), and 24-h (C) intervals in 21-week-old male db/db mice (N = 10) over 3 days of ALF and during the last 3 days of TRF. (D–F) Average MAP in 2-h (D), 12-h (E), and 24-h (F) intervals over 3 days with ALF or during the last 3 days of TRF. (G) Non-dipping MAP (less than 10%) with ALF and reverse dipping with light-phase TRF. (H,I) Body weight (H) and blood glucose (I) were determined at ZT1 under ALF and after 7 days of TRF. Data were expressed as the mean ± SEM and analyzed by repeated two-way ANOVA with matching conditions between light vs. dark phase and between ALF vs. light-phase TRF with Tucky’s post hoc analysis (A,B,D,E) or paired t-test (C,F,G–I). *P < 0.05; **P < 0.01; ****P < 0.0001; ns, not significant.
The current study demonstrated that (1) the BP level correlated with the food intake temporally across the 24 h in C57BL/6J mice under ALF; (2) light-phase TRF rapidly reverted BP circadian rhythm, leading to reverse dipping; (3) light-phase TRF-induced net changes in food intake temporally correlated with the net changes in BP; (4) light-phase TRF-induced BP rhythm alteration was associated with alterations in the time-of-day variations in Per2 protein expression, heart rate variability, baroreflex sensitivity, and urinary excretion of NE and Epi; (5) light-phase TRF increased mRNA expression of Slc6a2 and Adra1d during the light phase in mesenteric arteries; and (6) light-phase TRF worsened BP dipping and increased blood glucose in diabetic db/db mice.
In contrast to the extensive studies linking TRF to metabolic health, there are limited studies that examined the effect of TRF on BP circadian rhythm. A few publications on this topic suggest the timing of food intake is critical for BP circadian rhythm. In nocturnal rats and mice, a higher BP during the dark phase than during the light phase parallels higher food consumption during the dark phase. Experimentally restricting food availability to a period during the normal fasting/inactive phase is associated with an increase in BP during the fasting/inactive phase in rabbits (5), dogs (6), rats (7), and mice (8). However, these studies measured the total food intake during the entire feeding period or the 12-h light and dark phase. Thus, whether food intake temporally correlates with BP change is unclear. In the current study, we simultaneously monitored food intake every 1-min using BioDAQ and BP continuously using telemetry in a single housed mouse. These state-of-art technologies allow us to define the temporal relationship between food intake and BP in a single-housed mouse. Our results demonstrated for the first time that the BP level correlated with the food intake temporally across the 24 h in C57BL/6J mice under ALF (Figure 1).
We recently reported restricting food availability to 8 or 12 h during the dark/active phase (dark-phase TRF) protected the BP circadian rhythm in diabetic db/db mice (16). However, whether the light-phase TRF has similar protection for diabetic db/db mice has not been investigated. In contrast to dark-phase TRF (16), the current study illustrated that light-phaseTRF rapidly exacerbated rather than protected db/db mice from disruption of BP circadian rhythm (Figure 6 and Supplementary Figures 3, 4). Also, in contrast to the dark-phase TRF that did not influence BP circadian rhythm in non-diabetic wild-type mice (16), the current study demonstrated that light-phase TRF rapidly reversed BP circadian rhythm in C57BL/6J mice, leading to reverse or inverted dipping (Figure 2 and Supplementary Figure 1). Moreover, the current study also showed light-phase TRF-induced net changes in food intake are temporally correlated with net changes in BP in C57BL/6J mice (Figure 2K), indicating a causal role of food intake in regulating BP circadian rhythm in mice. In line with the previous reports (5–8, 16), these results suggest that TRF could be beneficial or detrimental to BP circadian rhythm depending upon the timing of food intake.
The potent influence of the timing of food intake on BP circadian rhythm could have significant relevance to human health. In modern society, more and more people consume food during the entire 16 h of awake time, including night hours (27). This erratic eating rhythm is associated with increased metabolic syndrome/diabetes and non-dipping or reversed dipping BP (28). In these patients, the reverse dipping BP is often caused by an increase in dark-phase/nighttime BP (29–39). However, some patients have a decline in active-phase/daytime BP in addition to a rise in inactive-phase/nighttime BP (40–46). The reverse dipping BP caused by light-phase TRF in wild-type mice described in the current study seems to resemble more of the latter group of patients. Further investigation is warranted to verify this. In addition, postprandial hypotension, a common cause of falls, syncope, and stroke is common among the elderly, reaching a prevalence of 25–67% in institutionalized elders (47). Impaired regulation of eating associated BP changes likely contribute to the cause. It will be interesting to test whether old mice would develop postprandial hypotension and serve as a model to dissect the underlying mechanism.
How does TRF trigger alterations in BP circadian rhythm? While complex mechanisms are likely underlying light-phase TRF-induced alteration in BP circadian rhythm, the current study provides several lines of evidence for a potentially important role of the SNS. The results are in line with our previous study showed that dark-phase TRF protects BP circadian rhythm via suppressing sympathetic nervous activity during fasting in diabetic db/db mice (16).
Firstly, our power spectral analysis of HRV, an index of the autonomic activity (48, 49), demonstrated that light-phase TRF increased LFSP, HFSP, and rMSSD during the dark/fasting phase but decreased LFSP or did not affect HFSP and rMSSD during the light/feeding period (Figures 4A-I). It is generally accepted that HFSP and rMSSD reflect parasympathetic activity (50). In contrast, the interpretation of LFSP is inconsistent. Some considered it a sympathetic modulation marker, whereas others considered it a parameter of sympathetic and parasympathetic activity (51). There were also studies claiming that during resting conditions, LFSP primarily reflects baroreflex activity but not sympathetic innervation (50, 52, 53). Regardless of these different interpretations, the current study is consistent with our recent report (16), light- or dark-phase TRF modulates BP circadian rhythm, at least in part, through the auto autonomic nervous system, including the SNS.
Secondly, the baroreceptor reflex system plays a predominant role in preventing BP fluctuations by modulating both SNS and PNS activities and therefore reflects the overall integrity of the autonomic nervous system (54). Under physiological conditions, baroreceptors are constantly active and continuously inhibit SNS activity. Under pathological conditions, such as hypertension, coronary artery disease, myocardial infarction, and heart failure, baroreflex control is impaired, with an imbalance of sympathetic−vagal outflow (55). Our results that BRS decreased during the light/feeding phase but increased during the dark/fasting phase after light-phase TRF (Figures 4J-L) indicates feeding, in addition to light, modulate sympathetic-vagal outflow thus can contribute to the changes in BP rhythm.
Thirdly, the current study showed that urinary NE and Epi were increased during the light phase but decreased during the dark phase after light-phase TRF, abolishing the day-to-night NE and Epi variations (Figures 5A,B). These results are commensurate with our recent report in db/db mice (16) and other studies that SNS activity, measured by sympathetic firing rate in brown adipose tissue in rats fed a high-fat diet (11), NE turnover in the heart in normal rats (12), renal sympathetic nerve activity in cats (14), urinary catecholamines and their metabolites excretion in humans (13), indicating that eating or feeding enhances SNS activity whereas fasting reduces it.
Fourthly, the current study revealed that light-phase TRF increased the mRNA expression of Slc6a2 without affecting NE synthesis or catabolic enzymes in mesenteric resistant arteries (Figures 5C-I). Slc6a2 encodes a NET protein responsible for removing NE from synapses by uptaking NE back into the presynaptic nerve terminal, the rate-limiting step to terminate NE function (56). It has been shown that increasing catecholamines by chronic depolarization (57) or stimulating TH activity (58) are associated with NET mRNA upregulation. Thus, enhanced mRNA expression of NET after light-phase TRF suggests that catecholamine synthesis/release may be increased. Nevertheless, the lack of change in NE metabolic enzymes at the mRNA level does not exclude possible alterations in catecholamine synthesis because acute stimulation of NE synthesis is mostly achieved by regulating TH activity through post-translational phosphorylation (59). Further experiments are needed to test these possibilities.
Lastly, one of the intriguing findings from the current study is that light-phase TRF selectively increased the mRNA expression of Adra1d among six subtypes of αARs (α1A-, α1B-, α1D-, α2A-, α2B-, and α2C-AR) in mesenteric resistant arteries (Figures 5J-O). Adra1d encodes an αAR protein responsible for regulating physiopathological responses mediated by NE and Epi, particularly in cardiovascular diseases, including hypertension (60). Mice deficient in Adra1a and Adra1d are hypotensive (61, 62), whereas mice deficient in Adra1b are normotensive (63). All three subtypes of α1ARs knockout mice have decreased vasopressor response (61–63), but only Adra1a or Adra1d knockout mice have reduced aortic vascular contractility to NE and Epi (61, 62). Consistent with these genetic studies, pharmacological studies showed that α1D-AR selective antagonist BMY7378 inhibits phenylephrine-induced vasoconstriction in rat aorta (64–66) and decreases BP (64). Therefore, it is tempting to speculate that the finding that increased Adra1d mRNA expression in mesenteric resistant arteries in response to light-phase TRF may indicate that light-phase TRF alters BP circadian rhythm, at least in part, through Adra1d. Further experiments are also needed to explore this possibility.
In addition to the SNS, other mechanisms may also participate in light-phase TRF-induced BP circadian rhythm alteration. Locomotor activity is a well-known factor for BP regulation. Our data showed that light-phase TRF promoted significant alterations in locomotor activity, which is highly correlated with the net changes in BP and locomotor activity acts as a covariant in light-phase TRF-induced BP alteration. Clocks, including period circadian regulator 2 (Per2), are well recognized for regulating BP homeostasis and circadian rhythms (16, 20, 67–69). To determine the timeline changes of Per2 expression, in vivo Per2Luc bioluminescence was determined in mPer2Luc mice because mPer2Luc mice have a luciferase reporter gene fused to the endogenous mPer2 gene, thus allowing in vivo monitoring of the Per2 clock protein oscillation in response to light-phase TRF (19). A previous study showed that mPer2Luc mice are viable and fertile, with no developmental or morphological differences compared to wild-type littermates (19). We found that light-phase TRF-induced BP circadian rhythm alteration was associated with Per2Luc bioluminescence in the liver and kidney (Figure 3). Consistent with this notion, it has been reported that mice with Per2 mutation exhibited impaired endothelium-dependent relaxations in the aorta and non-dipping BP in mice with stimulated renin-angiotensin signaling by Ang II infusion (70–72). However, it is worth mentioning that a recent study showed that light-phase TRF altered BP circadian rhythm in mice independent of Bmal1 (8), indicating that the clock gene is not involved. Thus, whether Per2 is involved in light-phase TRF-induced BP alteration remains elusive.
In conclusion, the current study demonstrated that light-phase TRF results in reverse dipping of BP in both wild-type and diabetic db/db mice, and the SNS pathway plays a potential role in mediating light-phase TRF-induced BP circadian rhythm alterations.
The original contributions presented in this study are included in the article/Supplementary material, further inquiries can be directed to the corresponding authors.
The animal study was reviewed and approved by Institutional Animal Care and Use Committee of the University of Kentucky.
TH, AC, and WS performed the experiments. TH analyzed the data. YK evaluated statistical analysis of the data. TH, ZG, and MG contributed to the idea, experimental design, and writing and editing of the manuscript. AC contributed to the editing of the manuscript. All authors contributed to the article and approved the submitted version.
This work was supported by National Heart, Lung, and Blood Institute, United States (HL106843, HL141103, and HL142973 to MG and ZG).
The authors declare that the research was conducted in the absence of any commercial or financial relationships that could be construed as a potential conflict of interest.
All claims expressed in this article are solely those of the authors and do not necessarily represent those of their affiliated organizations, or those of the publisher, the editors and the reviewers. Any product that may be evaluated in this article, or claim that may be made by its manufacturer, is not guaranteed or endorsed by the publisher.
The Supplementary Material for this article can be found online at: https://www.frontiersin.org/articles/10.3389/fnut.2022.969345/full#supplementary-material
1. Cuspidi C, Sala C, Tadic M, Gherbesi E, De Giorgi A, Grassi G, et al. Clinical and prognostic significance of a reverse dipping pattern on ambulatory monitoring: An updated review. J Clin Hypertens (Greenwich). (2017) 19:713–21. doi: 10.1111/jch.13023
2. Kanbay M, Turgut F, Uyar ME, Akcay A, Covic A. Causes and mechanisms of nondipping hypertension. Clin Exp Hypertens. (2008) 30:585–97. doi: 10.1080/10641960802251974
3. Routledge FS, McFetridge-Durdle JA, Dean CR, Canadian Hypertension S. Night-time blood pressure patterns and target organ damage: A review. Can J Cardiol. (2007) 23:132–8. doi: 10.1016/S0828-282X(07)70733-X
4. Salles GF, Reboldi G, Fagard RH, Cardoso CR, Pierdomenico SD, Verdecchia P, et al. Prognostic effect of the nocturnal blood pressure fall in hypertensive patients: The ambulatory blood pressure collaboration in patients with hypertension (ABC-H) meta-analysis. Hypertension. (2016) 67:693–700. doi: 10.1161/HYPERTENSIONAHA.115.06981
5. van den Buuse M, Malpas SC. 24-hour recordings of blood pressure, heart rate and behavioural activity in rabbits by radio-telemetry: Effects of feeding and hypertension. Physiol Behav. (1997) 62:83–9. doi: 10.1016/S0031-9384(97)00145-5
6. Mochel JP, Fink M, Bon C, Peyrou M, Bieth B, Desevaux C, et al. Influence of feeding schedules on the chronobiology of renin activity, urinary electrolytes and blood pressure in dogs. Chronobiol Int. (2014) 31:715–30. doi: 10.3109/07420528.2014.897711
7. van den Buuse M. Circadian rhythms of blood pressure and heart rate in conscious rats: Effects of light cycle shift and timed feeding. Physiol Behav. (1999) 68:9–15. doi: 10.1016/S0031-9384(99)00148-1
8. Zhang D, Colson JC, Jin C, Becker BK, Rhoads MK, Pati P, et al. Timing of food intake drives the circadian rhythm of blood pressure. Function (Oxf). (2021) 2:zqaa034. doi: 10.1093/function/zqaa034
9. Sauerbier I, von Mayersbach H. Circadian variation of catecholamines in human blood. Horm Metab Res. (1977) 9:529–30. doi: 10.1055/s-0028-1095589
10. Faucheux B, Kuchel O, Cuche JL, Messerli FH, Buu NT, Barbeau A, et al. Circadian variations of the urinary excretion of catecholamines and electrolytes. Endocr Res Commun. (1976) 3:257–72. doi: 10.1080/07435807609052931
11. Sakaguchi T, Arase K, Fisler JS, Bray GA. Effect of starvation and food intake on sympathetic activity. Am J Physiol. (1988) 255(Pt 2):R284–8. doi: 10.1152/ajpregu.1988.255.2.R284
12. Young JB, Landsberg L. Suppression of sympathetic nervous system during fasting. Obes Res. (1997) 5:646–9. doi: 10.1002/j.1550-8528.1997.tb00590.x
13. Koppeschaar HP, Meinders AE, Schwarz F. The effect of modified fasting on blood pressure and sympathetic activity: A correlation? Int J Obes. (1983) 7:569–74.
14. Matsukawa K, Ninomiya I. Changes in renal sympathetic nerve activity, heart rate and arterial blood pressure associated with eating in cats. J Physiol. (1987) 390:229–42. doi: 10.1113/jphysiol.1987.sp016696
15. Fagius J, Berne C. Increase in muscle nerve sympathetic activity in humans after food intake. Clin Sci (Lond). (1994) 86:159–67. doi: 10.1042/cs0860159
16. Hou T, Su W, Duncan MJ, Olga VA, Guo Z, Gong MC. Time-restricted feeding protects the blood pressure circadian rhythm in diabetic mice. Proc Natl Acad Sci U S A. (2021) 118:e2015873118. doi: 10.1073/pnas.2015873118
17. Green CB, Takahashi JS, Bass J. The meter of metabolism. Cell. (2008) 134:728–42. doi: 10.1016/j.cell.2008.08.022
18. Douma LG, Gumz ML. Circadian clock-mediated regulation of blood pressure. Free Radic Biol Med. (2018) 119:108–14. doi: 10.1016/j.freeradbiomed.2017.11.024
19. Yoo SH, Yamazaki S, Lowrey PL, Shimomura K, Ko CH, Buhr ED, et al. PERIOD2::LUCIFERASE real-time reporting of circadian dynamics reveals persistent circadian oscillations in mouse peripheral tissues. Proc Natl Acad Sci U S A. (2004) 101:5339–46. doi: 10.1073/pnas.0308709101
20. Su W, Guo Z, Randall DC, Cassis L, Brown DR, Gong MC. Hypertension and disrupted blood pressure circadian rhythm in Type 2 diabetic db/db mice. Am J Physiol Heart Circ Physiol. (2008) 295:H1634–41. doi: 10.1152/ajpheart.00257.2008
21. Xie Z, Su W, Liu S, Zhao G, Esser K, Schroder EA, et al. Smooth-muscle BMAL1 participates in blood pressure circadian rhythm regulation. J Clin Invest. (2015) 125:324–36. doi: 10.1172/JCI76881
22. Hou T, Su W, Guo Z, Gong MC. A novel diabetic mouse model for real-time monitoring of clock gene oscillation and blood pressure circadian rhythm. J Biol Rhythms. (2019) 34:51–68. doi: 10.1177/0748730418803719
23. Su W, Xie Z, Guo Z, Duncan MJ, Lutshumba J, Gong MC. Altered clock gene expression and vascular smooth muscle diurnal contractile variations in type 2 diabetic db/db mice. Am J Physiol Heart Circ Physiol. (2012) 302:H621–33. doi: 10.1152/ajpheart.00825.2011
24. Xie Z, Liu D, Liu S, Calderon L, Zhao G, Turk J, et al. Identification of a cAMP-response element in the regulator of G-protein signaling-2 (RGS2) promoter as a key cis-regulatory element for RGS2 transcriptional regulation by angiotensin II in cultured vascular smooth muscles. J Biol Chem. (2011) 286:44646–58. doi: 10.1074/jbc.M111.265462
25. Zhao G, Zhong Y, Su W, Liu S, Song X, Hou T, et al. Transcriptional suppression of CPI-17 gene expression in vascular smooth muscle cells by tumor necrosis factor, kruppel-like factor 4, and Sp1 is associated with lipopolysaccharide-induced vascular hypocontractility, hypotension, and mortality. Mol Cell Biol. (2019) 39:e70–19. doi: 10.1128/MCB.00070-19
26. Tahara Y, Kuroda H, Saito K, Nakajima Y, Kubo Y, Ohnishi N, et al. In vivo monitoring of peripheral circadian clocks in the mouse. Curr Biol. (2012) 22:1029–34. doi: 10.1016/j.cub.2012.04.009
27. Gill S, Panda S. A smartphone app reveals erratic diurnal eating patterns in humans that can be modulated for health benefits. Cell Metab. (2015) 22:789–98. doi: 10.1016/j.cmet.2015.09.005
28. Cuspidi C, Vaccarella A, Leonetti G, Sala C. Ambulatory blood pressure and diabetes: Targeting nondipping. Curr Diabetes Rev. (2010) 6:111–5. doi: 10.2174/157339910790909378
29. Pogue V, Rahman M, Lipkowitz M, Toto R, Miller E, Faulkner M, et al. Disparate estimates of hypertension control from ambulatory and clinic blood pressure measurements in hypertensive kidney disease. Hypertension. (2009) 53:20–7. doi: 10.1161/HYPERTENSIONAHA.108.115154
30. Eguchi K, Pickering TG, Hoshide S, Ishikawa J, Ishikawa S, Schwartz JE, et al. Ambulatory blood pressure is a better marker than clinic blood pressure in predicting cardiovascular events in patients with/without type 2 diabetes. Am J Hypertens. (2008) 21:443–50. doi: 10.1038/ajh.2008.4
31. Bouhanick B, Bongard V, Amar J, Bousquel S, Chamontin BJD. Prognostic value of nocturnal blood pressure and reverse-dipping status on the occurrence of cardiovascular events in hypertensive diabetic patients. Diabetes Metab. (2008) 34:560–7. doi: 10.1016/j.diabet.2008.05.005
32. Kim BK, Kim Y-M, Lee Y, Lim Y-H, Shin J. A reverse dipping pattern predicts cardiovascular mortality in a clinical cohort. J Korean Med Sci. (2013) 28:1468–73. doi: 10.3346/jkms.2013.28.10.1468
33. Ivanovic BA, Tadic MV, Celic VP. To dip or not to dip? The unique relationship between different blood pressure patterns and cardiac function and structure. J Hum Hypertens. (2013) 27:62–70. doi: 10.1038/jhh.2011.83
34. Wang C, Zhang J, Liu X, Li C, Ye Z, Peng H, et al. Reversed dipper blood-pressure pattern is closely related to severe renal and cardiovascular damage in patients with chronic kidney disease. PLoS One. (2013) 8:e55419. doi: 10.1371/journal.pone.0055419
35. Komori T, Eguchi K, Saito T, Nishimura Y, Hoshide S, Kario K. Riser blood pressure pattern is associated with mild cognitive impairment in heart failure patients. Am J Hypertens. (2016) 29:194–201. doi: 10.1093/ajh/hpv086
36. Mvunzi T, Lubenga Y, Lepira F, Makulo J, Nkodila A, Kuntonda D, et al. Prevalence of circadian blood pressure patterns and factors associated with non-dipping among black patients with untreated and treated hypertension: A cross-sectional study. World J Cardiovasc Dis. (2017) 7:399. doi: 10.4236/wjcd.2017.711038
37. Woodiwiss AJ, Libhaber CD, Sareli P, Norton GR. Impact of blunted nocturnal blood pressure dipping on cardiac systolic function in community participants not receiving antihypertensive therapy. Am J Hypertens. (2018) 31:1002–12. doi: 10.1093/ajh/hpy075
38. Marinakis AG, Vyssoulis GP, Michaelides AP, Karpanou EA, Cokkinos DV, Toutouzas PK. Impact of abnormal nocturnal blood pressure fall on vascular function. Am J Hypertens. (2003) 16:209–13. doi: 10.1016/S0895-7061(02)03262-4
39. Yan B, Peng L, Dong Q, Zheng F, Yang P, Sun L, et al. Reverse−dipper pattern of blood pressure may predict lacunar infarction in patients with essential hypertension. Eur J Neurol. (2015) 22:1022–5. doi: 10.1111/ene.12659
40. Ohkubo T, Imai Y, Tsuji I, Nagai K, Watanabe N, Minami N, et al. Relation between nocturnal decline in blood pressure and mortality*: The Ohasama study. Am J Hypertens. (1997) 10:1201–7. doi: 10.1016/S0895-7061(97)00274-4
41. Fagard R, Thijs L, Staessen JA, Clement D, De Buyzere M, De Bacquer D. Night–day blood pressure ratio and dipping pattern as predictors of death and cardiovascular events in hypertension. J Hum Hypertens. (2009) 23:645–53. doi: 10.1038/jhh.2009.9
42. Lee S, Thomas RJ, Kim H, Seo HS, Baik I, Yoon DW, et al. Association between high nocturnal blood pressure and white matter change and its interaction by obstructive sleep apnoea among normotensive adults. J Hypertens. (2014) 32:2005–12. doi: 10.1097/HJH.0000000000000290
43. Abdalla M, Caughey MC, Tanner RM, Booth JN III, Diaz KM, Anstey DE, et al. Associations of blood pressure dipping patterns with left ventricular mass and left ventricular hypertrophy in blacks: The Jackson heart study. J Am Heart Assoc. (2017) 6:e004847. doi: 10.1161/JAHA.116.004847
44. Di Stefano C, Sobrero G, Milazzo V, Vallelonga F, Romagnolo A, Zibetti M, et al. Cardiac organ damage in patients with Parkinson’s disease and reverse dipping. J Hypertens. (2020) 38:289–94. doi: 10.1097/HJH.0000000000002249
45. Yan B, Peng L, Han D, Sun L, Dong Q, Yang P, et al. Blood pressure reverse-dipping is associated with early formation of carotid plaque in senior hypertensive patients. Medicine. (2015) 94:e604. doi: 10.1097/MD.0000000000000604
46. Su D, Guo Q, Gao Y, Han J, Yan B, Peng L, et al. The relationship between red blood cell distribution width and blood pressure abnormal dipping in patients with essential hypertension: A cross-sectional study. BMJ Open. (2016) 6:e010456. doi: 10.1136/bmjopen-2015-010456
47. Luciano GL, Brennan MJ, Rothberg MB. Postprandial hypotension. Am J Med. (2010) 123:281.e1–6. doi: 10.1016/j.amjmed.2009.06.026
48. Baudrie V, Laude D, Elghozi JL. Optimal frequency ranges for extracting information on cardiovascular autonomic control from the blood pressure and pulse interval spectrograms in mice. Am J Physiol Regul Integr Comp Physiol. (2007) 292:R904–12. doi: 10.1152/ajpregu.00488.2006
49. Thireau J, Zhang BL, Poisson D, Babuty D. Heart rate variability in mice: A theoretical and practical guide. Exp Physiol. (2008) 93:83–94. doi: 10.1113/expphysiol.2007.040733
50. Shaffer F, Ginsberg JP. An overview of heart rate variability metrics and norms. Front Public Health. (2017) 5:258. doi: 10.3389/fpubh.2017.00258
51. Circulation. Heart rate variability: Standards of measurement, physiological interpretation and clinical use. Task Force of the European Society of Cardiology and the North American Society of Pacing and Electrophysiology. Circulation. (1996) 93:1043–65.
52. Shaffer F, McCraty R, Zerr CL. A healthy heart is not a metronome: An integrative review of the heart’s anatomy and heart rate variability. Front Psychol. (2014) 5:1040. doi: 10.3389/fpsyg.2014.01040
53. Goldstein DS, Bentho O, Park MY, Sharabi Y. Low-frequency power of heart rate variability is not a measure of cardiac sympathetic tone but may be a measure of modulation of cardiac autonomic outflows by baroreflexes. Exp Physiol. (2011) 96:1255–61. doi: 10.1113/expphysiol.2010.056259
54. Di Rienzo M, Parati G, Castiglioni P, Tordi R, Mancia G, Pedotti A. Baroreflex effectiveness index: An additional measure of baroreflex control of heart rate in daily life. Am J Physiol Regul Integr Comp Physiol. (2001) 280:R744–51. doi: 10.1152/ajpregu.2001.280.3.R744
55. La Rovere MT, Pinna GD, Raczak G. Baroreflex sensitivity: Measurement and clinical implications. Ann Noninvasive Electrocardiol. (2008) 13:191–207. doi: 10.1111/j.1542-474X.2008.00219.x
56. Zhou J. Norepinephrine transporter inhibitors and their therapeutic potential. Drugs Future. (2004) 29:1235–44. doi: 10.1358/dof.2004.029.12.855246
57. Li W, Knowlton D, Woodward WR, Habecker BA. Regulation of noradrenergic function by inflammatory cytokines and depolarization. J Neurochem. (2003) 86:774–83. doi: 10.1046/j.1471-4159.2003.01890.x
58. Habecker BA, Willison BD, Shi X, Woodward WR. Chronic depolarization stimulates norepinephrine transporter expression via catecholamines. J Neurochem. (2006) 97:1044–51. doi: 10.1111/j.1471-4159.2006.03792.x
59. Daubner SC, Le T, Wang S. Tyrosine hydroxylase and regulation of dopamine synthesis. Arch Biochem Biophys. (2011) 508:1–12. doi: 10.1016/j.abb.2010.12.017
60. Michel MC, Brodde OE, Insel PA. Peripheral adrenergic receptors in hypertension. Hypertension. (1990) 16:107–20. doi: 10.1161/01.HYP.16.2.107
61. Rokosh DG, Simpson PC. Knockout of the alpha 1A/C-adrenergic receptor subtype: The alpha 1A/C is expressed in resistance arteries and is required to maintain arterial blood pressure. Proc Natl Acad Sci U S A. (2002) 99:9474–9. doi: 10.1073/pnas.132552699
62. Tanoue A, Nasa Y, Koshimizu T, Shinoura H, Oshikawa S, Kawai T, et al. The alpha(1D)-adrenergic receptor directly regulates arterial blood pressure via vasoconstriction. J Clin Invest. (2002) 109:765–75. doi: 10.1172/JCI200214001
63. Cavalli A, Lattion AL, Hummler E, Nenniger M, Pedrazzini T, Aubert JF, et al. Decreased blood pressure response in mice deficient of the alpha1b-adrenergic receptor. Proc Natl Acad Sci U S A. (1997) 94:11589–94. doi: 10.1073/pnas.94.21.11589
64. Deng XF, Chemtob S, Varma DR. Characterization of alpha 1 D-adrenoceptor subtype in rat myocardium, aorta and other tissues. Br J Pharmacol. (1996) 119:269–76. doi: 10.1111/j.1476-5381.1996.tb15981.x
65. Piascik MT, Guarino RD, Smith MS, Soltis EE, Saussy DL Jr., Perez DM. The specific contribution of the novel alpha-1D adrenoceptor to the contraction of vascular smooth muscle. J Pharmacol Exp Ther. (1995) 275:1583–9.
66. Kenny BA, Chalmers DH, Philpott PC, Naylor AM. Characterization of an alpha 1D-adrenoceptor mediating the contractile response of rat aorta to noradrenaline. Br J Pharmacol. (1995) 115:981–6. doi: 10.1111/j.1476-5381.1995.tb15907.x
67. Vukolic A, Antic V, Van Vliet BN, Yang Z, Albrecht U, Montani JP. Role of mutation of the circadian clock gene Per2 in cardiovascular circadian rhythms. Am J Physiol Regul Integr Comp Physiol. (2010) 298:R627–34. doi: 10.1152/ajpregu.00404.2009
68. Hou T, Guo Z, Gong MC. Circadian variations of vasoconstriction and blood pressure in physiology and diabetes. Curr Opin Pharmacol. (2021) 57:125–31. doi: 10.1016/j.coph.2021.02.001
69. Xie Z, Gong MC, Su W, Turk J, Guo Z. Group VIA phospholipase A2 (iPLA2beta) participates in angiotensin II-induced transcriptional up-regulation of regulator of g-protein signaling-2 in vascular smooth muscle cells. J Biol Chem. (2007) 282:25278–89. doi: 10.1074/jbc.M611206200
70. Pati P, Fulton DJ, Bagi Z, Chen F, Wang Y, Kitchens J, et al. Low-salt diet and circadian dysfunction synergize to induce angiotensin II-dependent hypertension in mice. Hypertension. (2016) 67:661–8. doi: 10.1161/HYPERTENSIONAHA.115.06194
71. Viswambharan H, Carvas JM, Antic V, Marecic A, Jud C, Zaugg CE, et al. Mutation of the circadian clock gene Per2 alters vascular endothelial function. Circulation. (2007) 115:2188–95. doi: 10.1161/CIRCULATIONAHA.106.653303
Keywords: blood pressure circadian rhythm, time-restricted feeding, sympathetic nervous system, heart rate variability, baroreflex, norepinephrine, alpha-adrenergic
Citation: Hou T, Chacon AN, Su W, Katsumata Y, Guo Z and Gong MC (2022) Role of sympathetic pathway in light-phase time-restricted feeding-induced blood pressure circadian rhythm alteration. Front. Nutr. 9:969345. doi: 10.3389/fnut.2022.969345
Received: 14 June 2022; Accepted: 01 August 2022;
Published: 08 September 2022.
Edited by:
Jingyi Qian, Brigham and Women’s Hospital and Harvard Medical School, United StatesReviewed by:
Leandro Campos De Brito, Oregon Health & Science University, United StatesCopyright © 2022 Hou, Chacon, Su, Katsumata, Guo and Gong. This is an open-access article distributed under the terms of the Creative Commons Attribution License (CC BY). The use, distribution or reproduction in other forums is permitted, provided the original author(s) and the copyright owner(s) are credited and that the original publication in this journal is cited, in accordance with accepted academic practice. No use, distribution or reproduction is permitted which does not comply with these terms.
*Correspondence: Zhenheng Guo, emd1bzJAdWt5LmVkdQ==; Ming C. Gong, bWNnb25nMkB1a3kuZWR1
†These authors share senior authorship
Disclaimer: All claims expressed in this article are solely those of the authors and do not necessarily represent those of their affiliated organizations, or those of the publisher, the editors and the reviewers. Any product that may be evaluated in this article or claim that may be made by its manufacturer is not guaranteed or endorsed by the publisher.
Research integrity at Frontiers
Learn more about the work of our research integrity team to safeguard the quality of each article we publish.