- 1School of Public Health, Lanzhou University, Lanzhou, China
- 2Lanzhou University Second Hospital, Lanzhou, China
- 3Gansu Provincial Maternity and Child-care Hospital, Lanzhou, China
- 4Department of Public Health, Robbins College of Health and Human Sciences, Baylor University, Waco, TX, United States
Introduction: This study aimed to evaluate the status of dietary diversity, nutrient adequacy, blood biomarkers of nutrients, and anthropometric status, as well as to determine the predictors of dietary diversity score (DDS) and mean adequacy ratio (MAR) among preschool children in poor ethnic minority areas of northwest China.
Methods: A total of 578 healthy preschool children aged 3–6 from 17 kindergartens were selected to assess dietary intake, anthropometric status (height-for-age z-score (HAZ), weight-for-age z-score (WAZ), weight-for-height z-score (WHZ), and blood biomarkers. DDS and nutrient adequacy ratio (NAR) were adopted to assess dietary diversity and micronutrient adequacy, respectively.
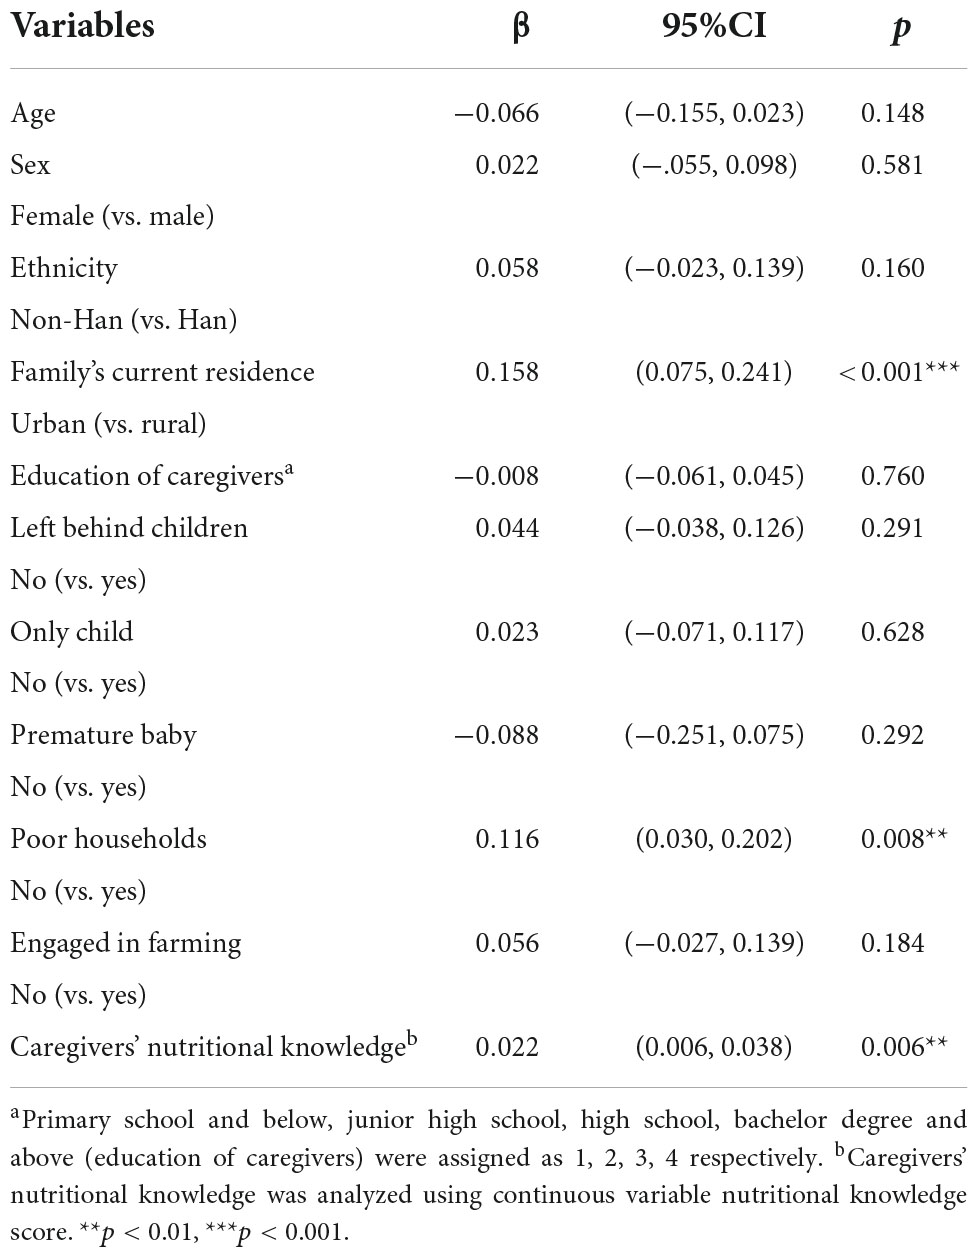
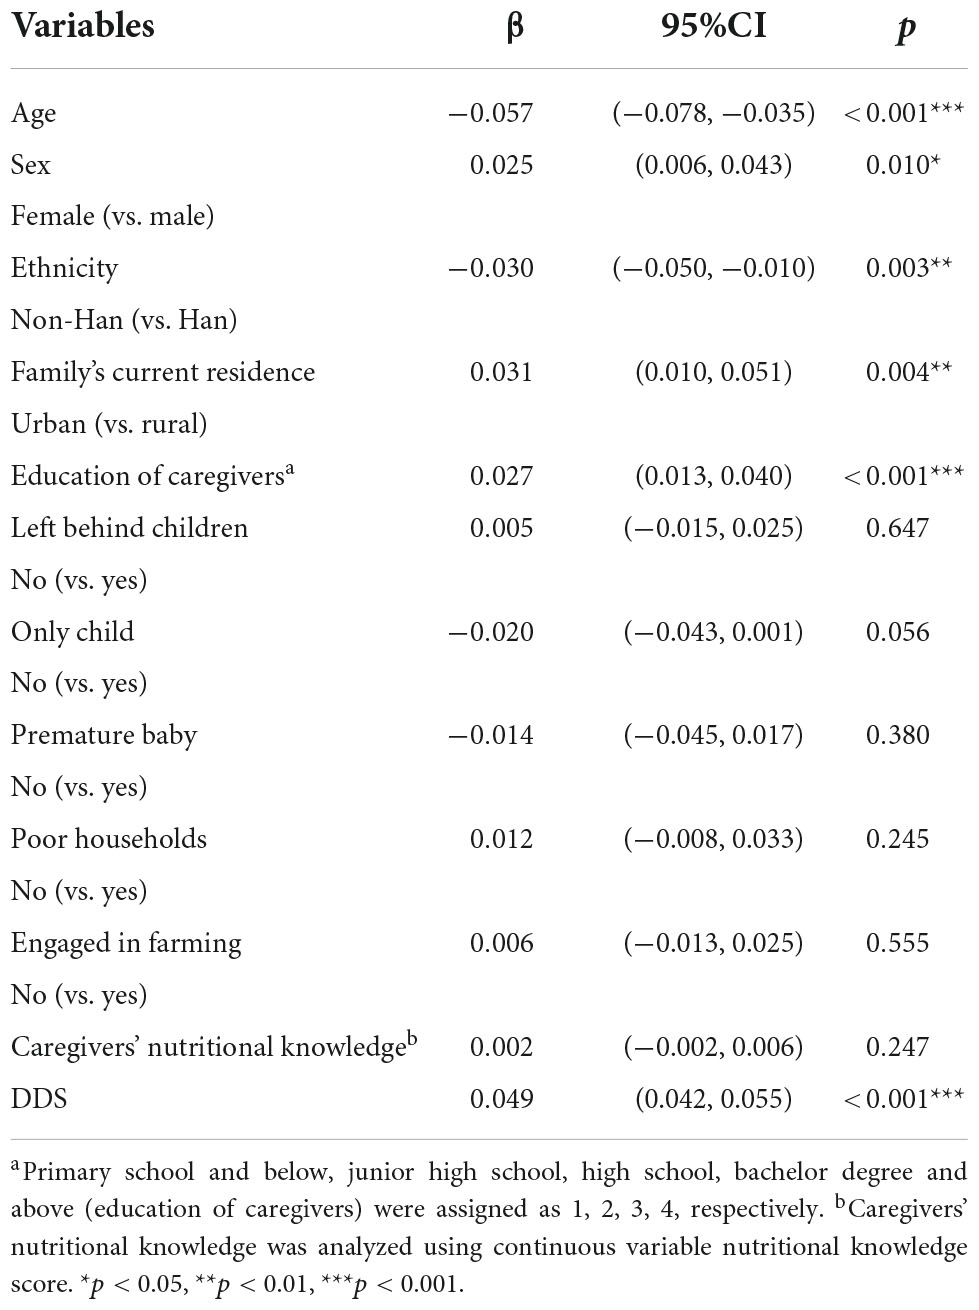
Results: The mean DDS (ranging from 1 to 9) was relatively low (4.67 ± 1.56). Most participants consumed starchy staples, but few participants consumed organ meat. DDS was associated with serum potassium, serum iron, WAZ, HAZ, all NARs, and MAR (all p < 0.05). Living in urban areas (β = 0.158), higher household wealth (β = 0.116), and more caregivers’ nutritional knowledge (β = 0.022) were positively associated with DDS (all p < 0.01), while living in urban areas (β = 0.031), higher education of caregivers (β = 0.0.027), and higher DDS (β = 0.049) were positively associated with MAR (all p < 0.01).
Discussion: In conclusion, dietary diversity was associated with nutrient adequacy and other health outcomes. Nutritional education and poverty alleviation are integral to improving the nutritional status of preschool children.
Introduction
Dietary diversity score (DDS) is an indicator to evaluate whether the respondents have a diverse diet, which is defined as the number of different food groups consumed during a reference period (1). It is a widely used tool to assess dietary quality rapidly, especially nutrition and food security, because investigators can collect enough information to calculate it with only a brief questionnaire (2). Inadequate dietary diversity is a global problem, and is a prevalent concern among low-income individuals and families (3). In addition, the lack of dietary diversity is one of the leading causes of malnutrition in preschool children (4).
Preschool children are in a critical period of growth, cognitive, social, and psychological development creating a high demand for various nutrients in their life (5, 6). However, malnutrition and dietary imbalance in the preschool period will not only cause severe growth problems but also adversely affect their health in adulthood, such as intellectual disability and increased risk of chronic diseases (7, 8). Chinese children’s nutritional status has greatly improved in the past two decades. But like many developing countries, China is also facing dual challenges of overnutrition and undernutrition (9, 10). According to the China Health and Nutrition Survey 2010–2013, the prevalence of stunting was 8.1% nationwide and 11.3% in rural areas for children aged 0–5 years (11). Preschool children’s dietary pattern in some poor ethnic minority areas of northwest China differs from that in other areas, such as Linxia County and Gansu Province. The nutritional status of preschool children was worse than the national level in this area (12). For a long time, the government has issued many policies and made many positive attempts to improve children’s dietary intake. However, currently there is no corresponding nutrition improvement plan specifically for preschool children aged 3–6 years (13, 14). Additionally, China’s inherent urban-rural gap of economy and education, which makes families in rural low-income areas and ethnic minority areas cannot obtain enough diversified food, has led to the nutritional problems of preschool children (15, 16).
Many studies have shown that dietary diversity has beneficial effects on nutritional status at different ages, especially in children (3, 17–19). For instance, dietary diversity has been proven to be related to micronutrient adequacy in multiple age groups in both developing and developed countries (1, 2, 20–23). Some other studies have shown significant correlations between dietary diversity and anthropometric status [e.g., height-for-age z-score (HAZ) and weight-for-age z-score (WAZ)] or blood biomarkers (e.g., Plasma vitamin B12 and folate) in children (20, 24). In northwest China, it is difficult to carry out nutritional surveys among preschool children for many reasons, such as the underdevelopment of the economy and the lack of scientific researchers in the region. Additionally, the caregivers of preschool children are more traditional and unwilling to cooperate with completing the survey (for example, they believe that blood collection will hurt their children), which can also present difficulties in the research process. Therefore, as an intuitive and food-based indicator, maybe it is a good way to evaluate preschool children’s nutritional status. However, research on dietary diversity among preschool children in China has primarily been conducted in the eastern and central regions (19, 25), and few studies have been conducted in the northwest region, where preschool children historically have a poorer nutritional status. Additionally, DDS is influenced by various sociodemographic factors and the correlation between DDS and nutrient adequacy in poor ethnic minority areas of northwest China has not been verified yet; thus, confirming this association could be helpful to simplify the dietary surveys from complicated 24-h dietary recalls to only grasp the food groups they consumed (26). Therefore, this study aimed to (1) evaluate the status of dietary diversity, nutrient adequacy, blood biomarkers of nutrients, and anthropometric status among preschool children in poor ethnic minority areas of northwest China, (2) examine the association between dietary diversity and nutrient adequacy or other health outcomes; and (3) determine the predictors of dietary diversity and nutrient adequacy, especially local-specific predictors. It could provide some theoretical support for nutrition intervention, nutritional education, and poverty alleviation as integral aspects to improve the nutritional status of preschool children.
Materials and methods
Study design and study population
We used baseline data from the GSPNIP study, a preschool nutrition improvement pilot program launched by the Gansu Provincial government and the World Food Program in November 2020 in Linxia County, Gansu Province in northwest China, which aimed to improve the nutritional status of preschool children by supplying breakfast to them. Linxia County is a region with the most underdeveloped economy and complex ethnic minority situation in China. The majority of ethnic minorities were Hui and Dongxiang and observe Islam as their primary religion. The enrollment number of preschool children in the kindergartens was 758. Preschool children aged 3–6 and their caregivers agreed to participate in this study and were included in this cross-sectional study. However, the following participants were excluded from the cohort study: (1) No history of acute or chronic illness (cancer, kidney disease, liver disease, etc.). (2) No gastrointestinal symptoms (constipation, diarrhea, etc.) and fever symptoms in the past three months. (3) No infectious diseases (AIDS, hepatitis B, syphilis, etc.). (4) No history of intake of antibiotics, antiviral, antifungal, or analgesic drugs in the past three months. Caregivers of preschool children were invited to the classroom for a questionnaire (mainly includes sociodemographic information and 24-h dietary recall) while the child(ren) had an anthropometric measurement and blood collection in another classroom. To ensure that the investigators can understand the dialects of the participants, the government and kindergarten staff assisted in the translation and explanation of the responses for the investigators. Since the government and kindergartens introduced our study to the caregivers before the research began, almost all of the caregivers were willing to take their children to participate in this study. In this way, we could easily obtain the written informed consent from children’s legal guardians. The study was approved by the Medical Ethics Committee of School of Public Health, Lanzhou University, China (No. GW-20200910-1) and registered on the WHO International Clinical Trials Registry Platform (protocol code ChiCTR2200056916).
We used cluster sampling to select a representative sample of kindergartens from a sample pool of 150 kindergartens. A power analysis was conducted to ensure optimum power was achieved, resulting in a minimum sample size of 17. A total of 608 healthy preschool children aged 3–6 years from 17 kindergartens were randomly selected. All questionnaires were responded to with a response rate of 100%. Children who were ill (diseases mentioned in the exclusion criteria, n = 5) and had too many missing measurements (sociodemographic data had more than 3 missing blanks or dietary/anthropometric/blood biomarkers data was incomplete, n = 25) were excluded from the study, leading to the final sample size of 578 for analysis in this study with a valid questionnaire rate of 95.07%.
Sociodemographic data
Sociodemographic data were collected by interviewing preschoolers’ caregivers with questionnaires. This questionnaire was adapted from the previous questionnaire of our group (3). The Cronbach test and the Kaiser-Meyer-Olkin (KMO) test were used for reliability and validity (Cronbach’s α = 0.735 and KMO = 0.802), respectively. Study variables included preschoolers’ sex, ethnicity, family’s current residence, education of caregivers, left-behind children, an only child, premature baby, feeding method, poor households, whether caregivers were engaged in farming, caregivers’ nutritional knowledge, and picky eating behavior. Left-behind children were defined as at least one parent who had gone out to work for more than 3 months, a common phenomenon in poor areas of China (27). Whether they were poor households was determined after government investigations, which avoided the bias caused by people in the region who generally like to conceal their income. Feeding methods included breastfeeding, artificial feeding, and mixed feeding, while caregivers who answered 9 questions correctly (60%) and above were considered to pass the nutritional knowledge test. Picky eating behavior was evaluated by the caregivers themselves.
Dietary data
Throughout the study, we collected dietary intakes using face-to-face 24-h dietary recall. Participants were asked to report all foods and beverages they had consumed during the preceding 24 h. Considering many children had meals in kindergarten, we used two questionnaires to collect dietary information. One questionnaire was completed with the help of kindergartens chefs to collect information related to children’s food consumption at schools. The other questionnaire was conducted by investigators interviewing the caregivers of preschool children and aimed to collect information on what the children ate away from kindergarten. Trained investigators from Lanzhou University were responsible for collecting information on the recipes, types, and brands of all reported food items. During the interview, standard serving bowls, plates, and glasses were used to help respondents estimate the portion sizes of foods and beverages as accurately as possible. More than 50 food models for foods commonly consumed by local people were provided to help clarify the dietary intakes. Additionally, a food photo book containing photos of 135 common food and beverage items, marked with their name and its weight, was used to improve dietary recall. Nutrient analysis software (Nutrition Calculator version 2.8.0.8, Beijing, China), based on the continuously updated in-house nutrient database (China food composition), was used to calculate daily nutrient intakes and food weights from 24 h recall. Currently, the database contains information on energy and 36 nutrients for 2,876 entries. Values of energy intake and nutrient intake were used in the analysis.
Measurement of dietary diversity and nutrient adequacy
Dietary diversity score was used to evaluate children’s dietary diversity based on the consumption of nine food groups [starchy staples (comprised of cereals and white roots and tubers); dark green leafy vegetables; other vitamin A-rich fruits and vegetables (comprised of vitamin A-rich vegetables and tubers and vitamin A rich fruit); other fruits and vegetables; organ meat; meat and fish; eggs; legumes, nuts, and seeds; milk and milk products] in the 24-h dietary recall, which was according to the guidelines of the Food and Agriculture Organization of the United Nations (28). Each food group consumed was scored 1 point and DDS was the sum of the scores (ranging from 1 to 9). The scoring did not include other food groups such as beverages, sugars, and preserves. In this study, DDS < 5 was defined as low DDS, and DDS ≥ 5 was defined as high DDS (20).
Nutrient adequacy ratios for the intake of energy, calcium, potassium, sodium, magnesium, iron, zinc, phosphorus, selenium, vitamin A, vitamin B1, vitamin B2, vitamin C, vitamin D, vitamin E, and niacin were calculated by dividing the daily intake of the nutrient by the recommended daily intake (EAR) for that nutrient according to the Chinese Dietary Reference Intakes (DRIs) (29). Because adequate intake of one nutrient cannot compensate for the lack of other nutrients, the maximum value of NAR was set to 1. MAR was used to assess the average condition of children’s nutrient adequacy and was calculated by dividing the sum of all micronutrient NARs by the quantities of nutrients evaluated.
Anthropometric status and blood biomarkers
Height was measured to the nearest 0.1 cm using a height and sitting height measuring instrument (model SZ-200, Suheng, Shanghai, China). In contrast, weight was measured to the nearest 0.1 kg using a digital scale (model HD382, TANITA, Tokyo, Japan). WHO Anthro and WHO AnthroPlus, which the WHO officially recommended, were used to calculate the anthropometric status [HAZ, WAZ, weight-for-height z-score (WHZ)] of preschool children under 5 years old and over 5 years old, respectively. Based on this, the prevalence of stunting, wasting, and being underweight were calculated to understand the undernutrition status of preschool children (30).
To measure blood routine, 200 μl of the child’s peripheral blood sample was collected into EDTA vacutainers by automated hematology analyzer (model XS-500i, SYSMEX, Tokyo, Japan) and 500μL of the child’s peripheral blood sample was collected into lithium heparin evacuated blood collection tube to measure blood elements by atomic absorption spectrometer (model BH7100S, Bohui, Beijing, China). Hemoglobin (HGB), calcium, potassium, sodium, magnesium, iron, and zinc were measured in this study.
The following cutoffs were applied to derive binary outcomes:
• Stunting, wasting, and underweight: HAZ < −2, WHZ < −2, and WAZ < −2, respectively.
• Anemia: HGB <118 g/L (children younger than 5 years old) and HGB < 123 g/L (children aged 5 years and older) based on the standards of Gansu Provincial Maternity and Child-care Hospital (altitude-adjusted).
• Blood trace elements deficiency: Low serum calcium (<1.5 μmol/L), low serum potassium (<30 μmol/L), low serum sodium (<64 μmol/L), low serum magnesium (<1.12 μmol/L), low serum iron (<7.5 μmol/L), low serum zinc (<55.9 μmol/L) based on the standards of Gansu Provincial Maternity and Child-care Hospital.
Statistical analysis
The database was established with EpiData version 3.1 (EpiData Association, Odense, Denmark). Descriptive statistics were taken to count the basic information of the participants. The Shapiro–Wilk test was conducted to verify the normality of the distribution of data. For normally distributed data, they were presented as mean and standard deviation (SD); For non-normally distributed data, they were presented as medians (25th and 75th percentile). To analyze the difference in DDS among different sociodemographic factors, Student’s t-test and one-way ANOVA were used for two-group comparisons and multiple comparisons, respectively. Differences in other variables between the high DDS and low DDS groups were tested using Student’s t-test for normally distributed continuous variables and Mann–Whitney U-test for not normally distributed continuous variables, respectively. Furthermore, to measure the correlation between DDS and other variables, Spearman’s correlation coefficients were used. Finally, Poisson regression was used to determine the predictors of DDS since it was the count data; and multiple linear regression was used to determine the predictors of MAR since it was the continuous data. Statistical significance was determined at p < 0.05 (two-tailed tests). All analyses were conducted with IBM SPSS (predictive analytics software and solutions) version 22.0 (International Business Machines Corporation, New York, State of New York, USA).
Results
Dietary diversity score based on basic characteristics
A total of 578 children (about 46.89% are ethnic minorities) aged 3–6 years old were included for analysis with a response rate of 100% and a valid questionnaire rate of 95.07% and the mean DDS was 4.67 ± 1.56. In this study, 62.28% of the caregivers had education at primary school or below, and 89.62% of them did not pass the nutritional knowledge test, while nearly two-thirds of the children were left-behind children and 79.41% of them were not an only child. Preschool children who lived in rural areas, whose parents had lower education, who were left-behind children, whose households were poor, whose caregivers’ nutritional knowledge was lacking, who were anemic, and who had low serum iron had significantly lower DDS (p < 0.05). However, children who had ever been a premature baby had a higher DDS (Table 1).
Consumption of each food group
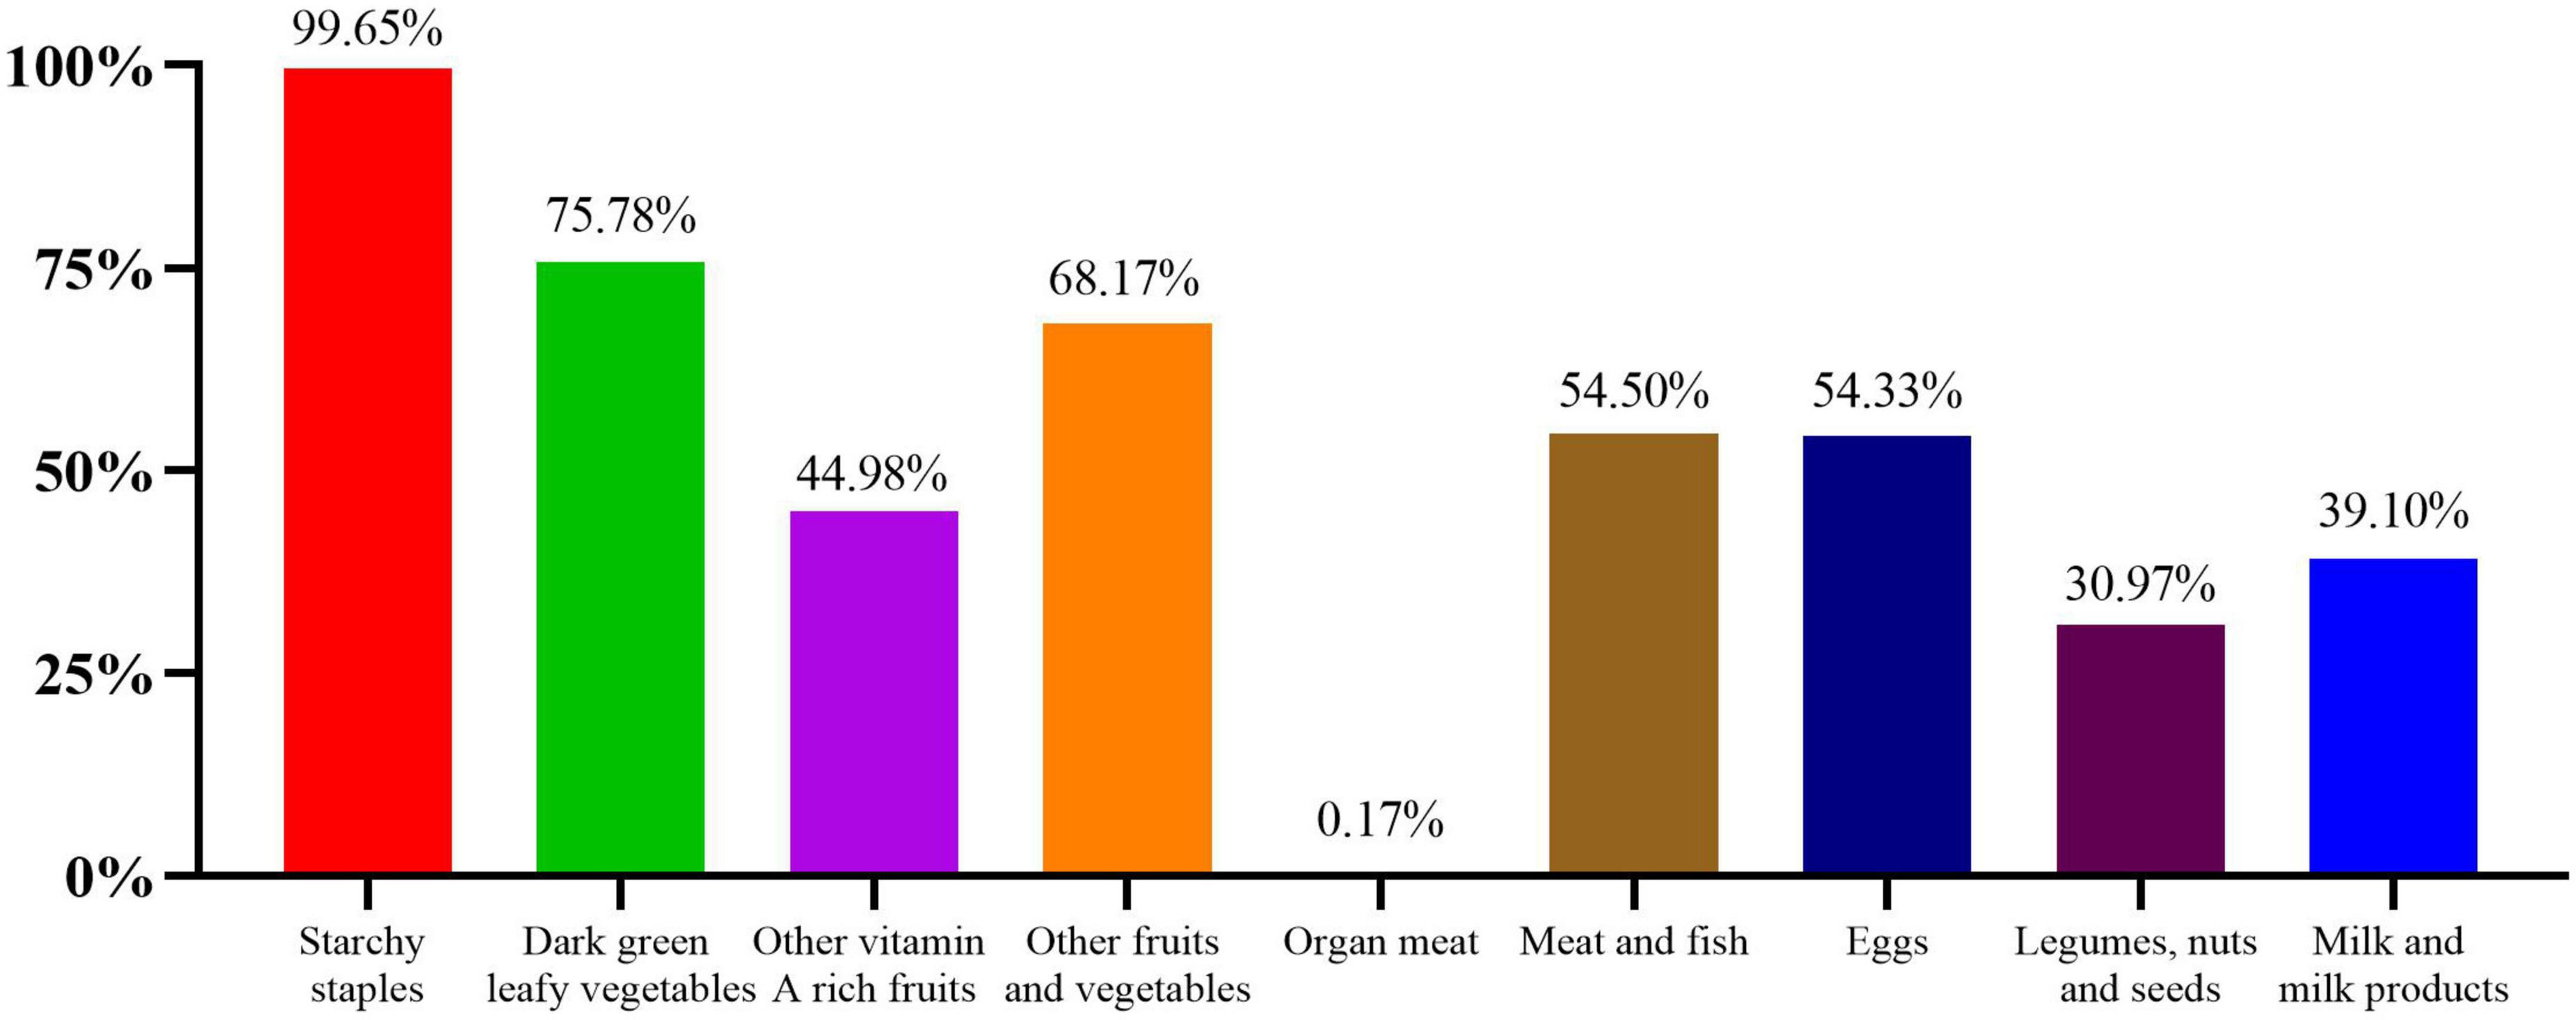
The most frequently consumed food groups were starchy staples (99.65%), followed by dark green leafy vegetables (75.78%), other fruits and vegetables (68.17%), meat and fish (54.50%), and eggs (54.33%). In comparison, the groups of other vitamin A-rich fruits and vegetables (44.98%); milk and milk products (39.10%); legumes, nuts, and seeds (30.97%) were less likely to be consumed. The least consumed food group was organ meat, with only 0.17% of participants consumed (Figure 1).
With the exception of starchy staples and organ meat, the percentage of participants consuming each food group in the high DDS group was significantly higher than the low DDS groups (p < 0.05) (Figure 2).
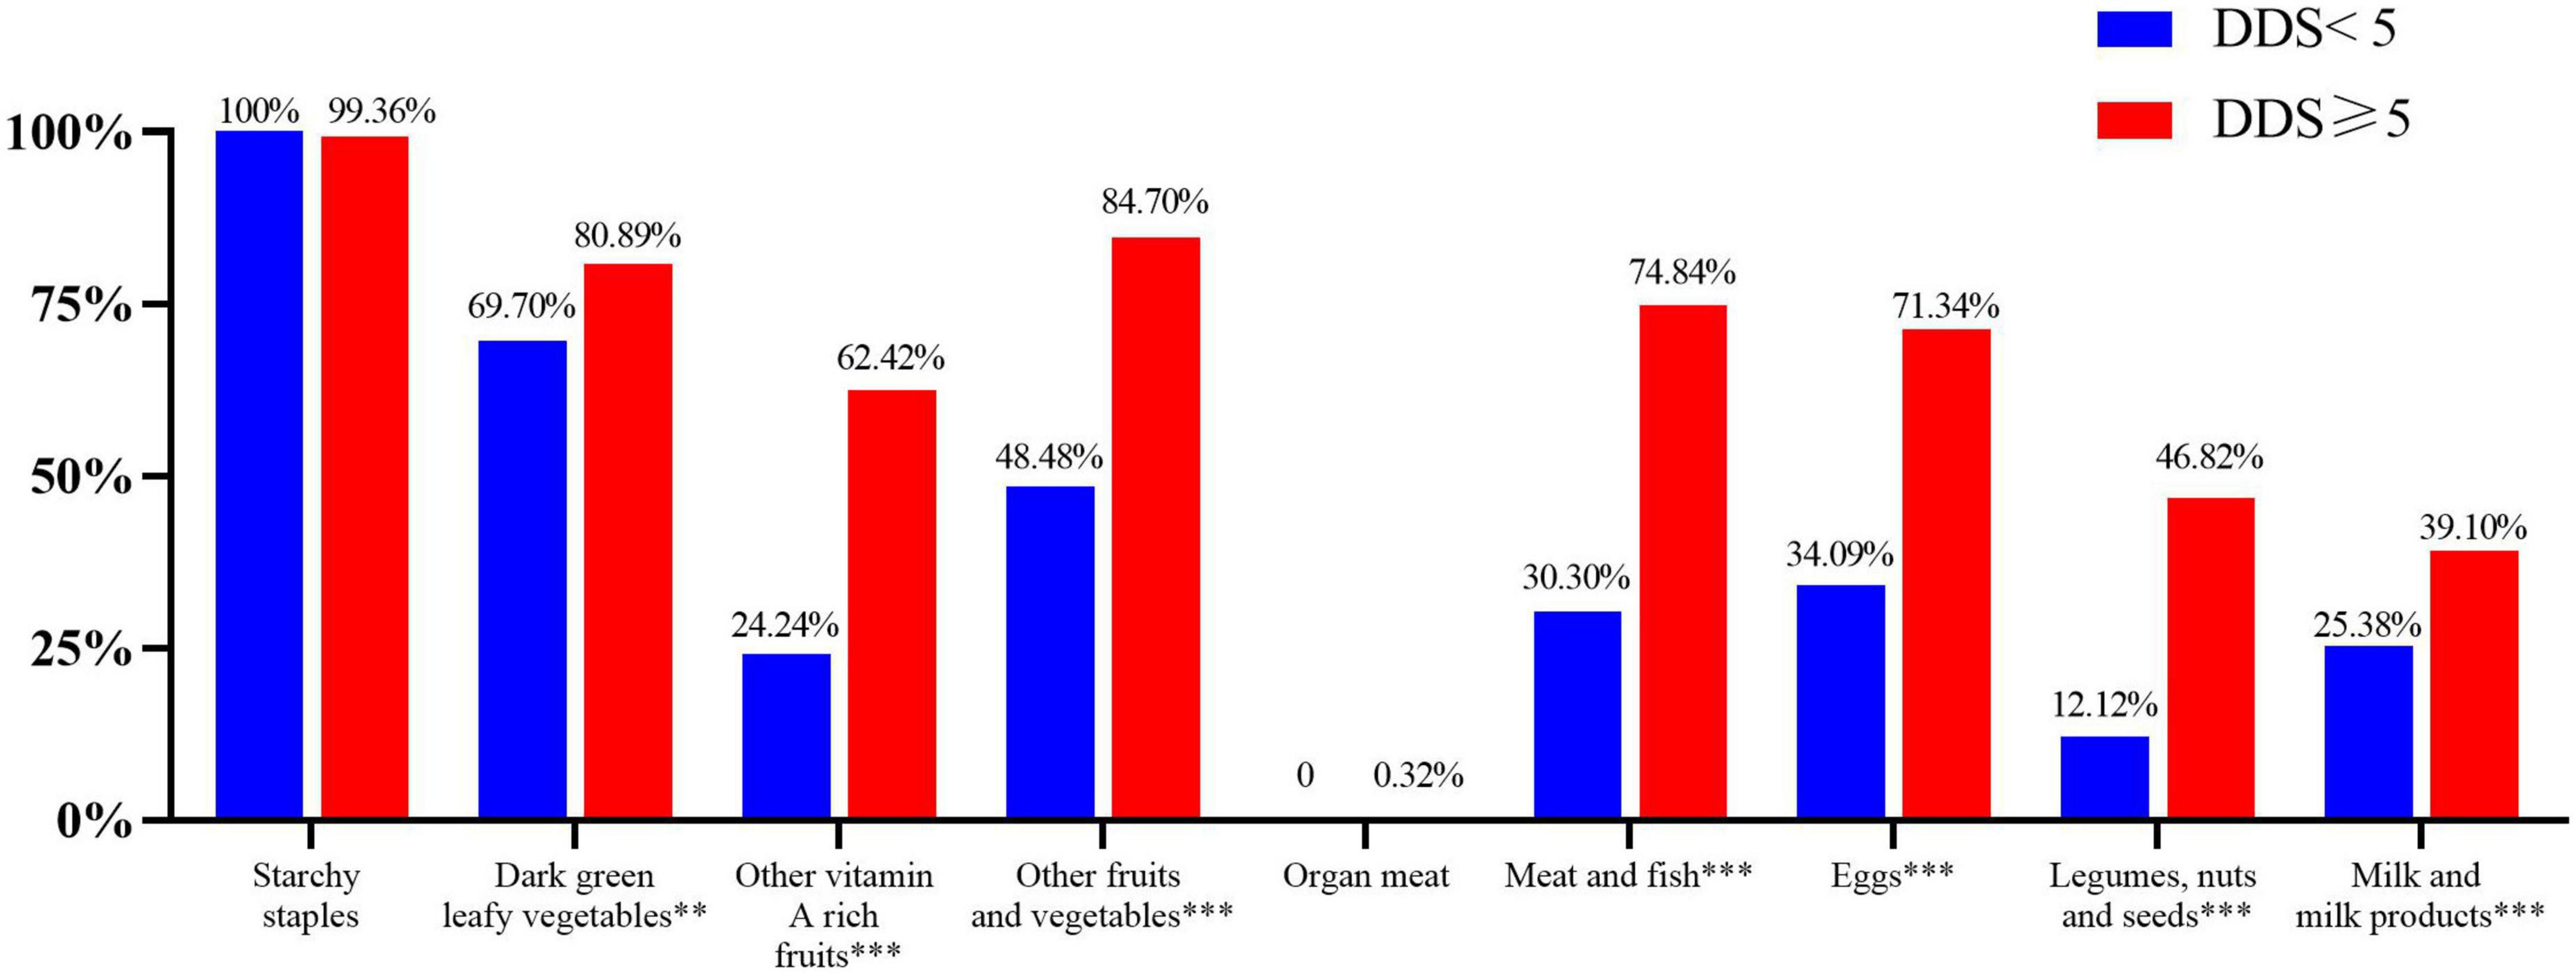
Figure 2. Percentage of participants consuming each food group in low and high DDS groups. **p < 0.01, ***p < 0.001.
Blood biomarkers, anthropometric measures, and nutrient adequacy ratios in low and high dietary diversity score groups
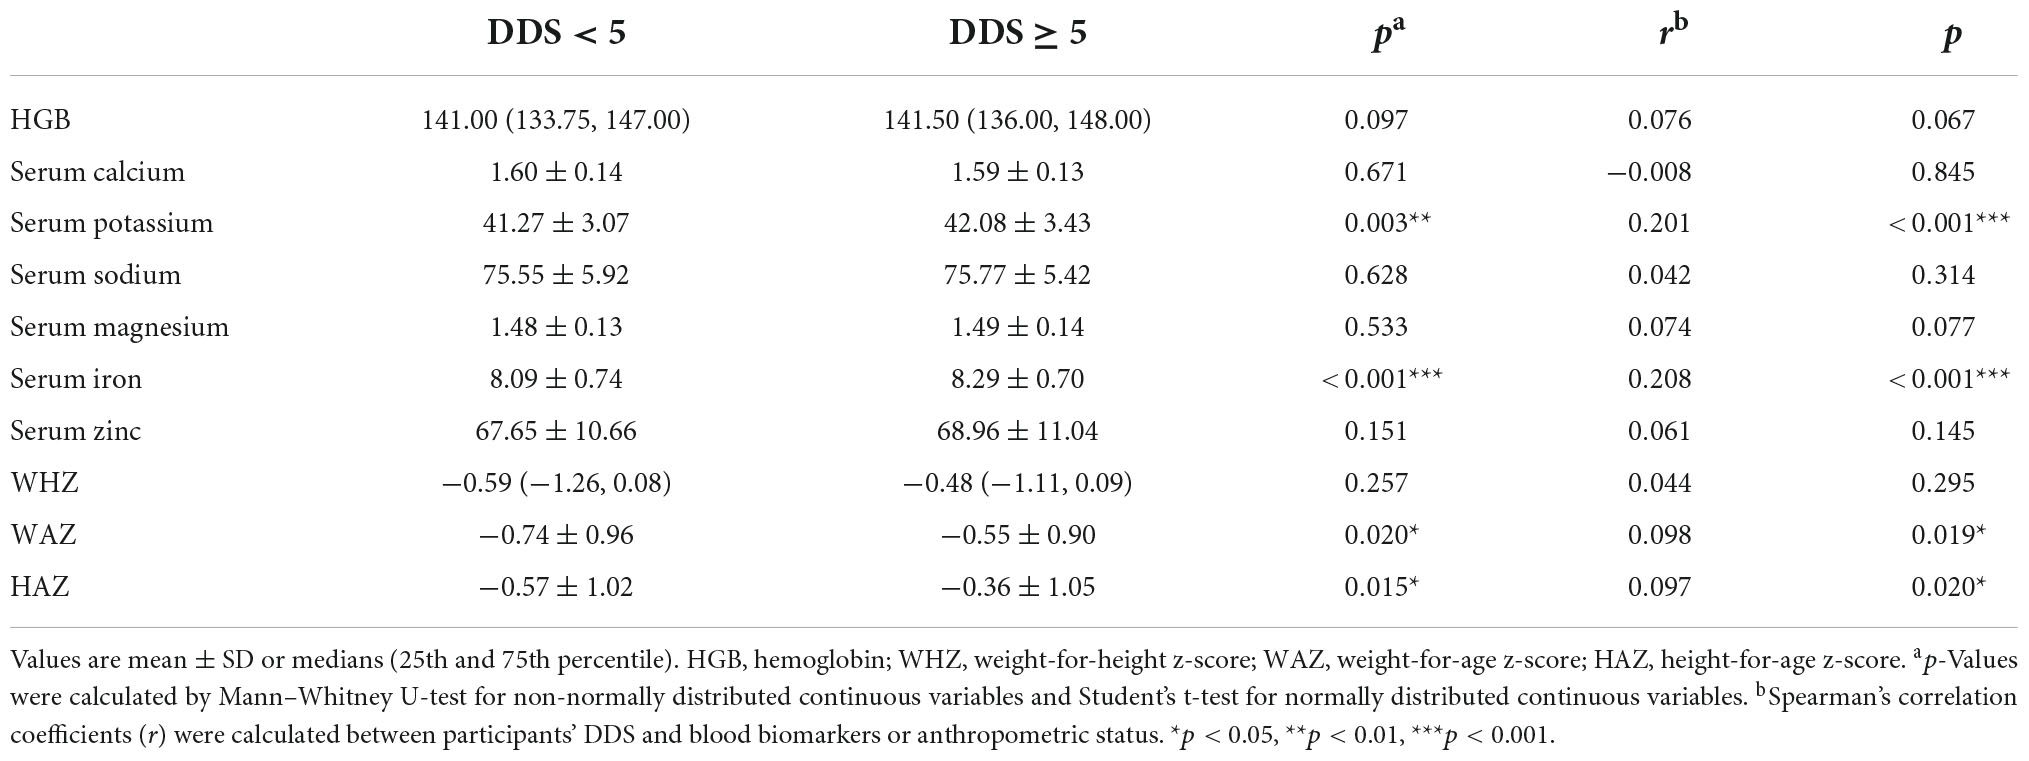
Blood biomarkers and anthropometric status in low and high DDS groups are shown in Table 2. Serum potassium, serum iron, WAZ, and HAZ were higher in high-DDS participants than those in low-DDS participants (p < 0.05). Spearman correlation coefficients for blood biomarkers and anthropometric status associated with DDS were determined for all participants. Serum potassium (r = 0.201, p = 0.001), serum iron (r = 0.208, p = 0.001), WAZ (r = 0.098, p = 0.019) and HAZ (r = 0.097, p = 0.020) were significantly positively correlated with DDS.
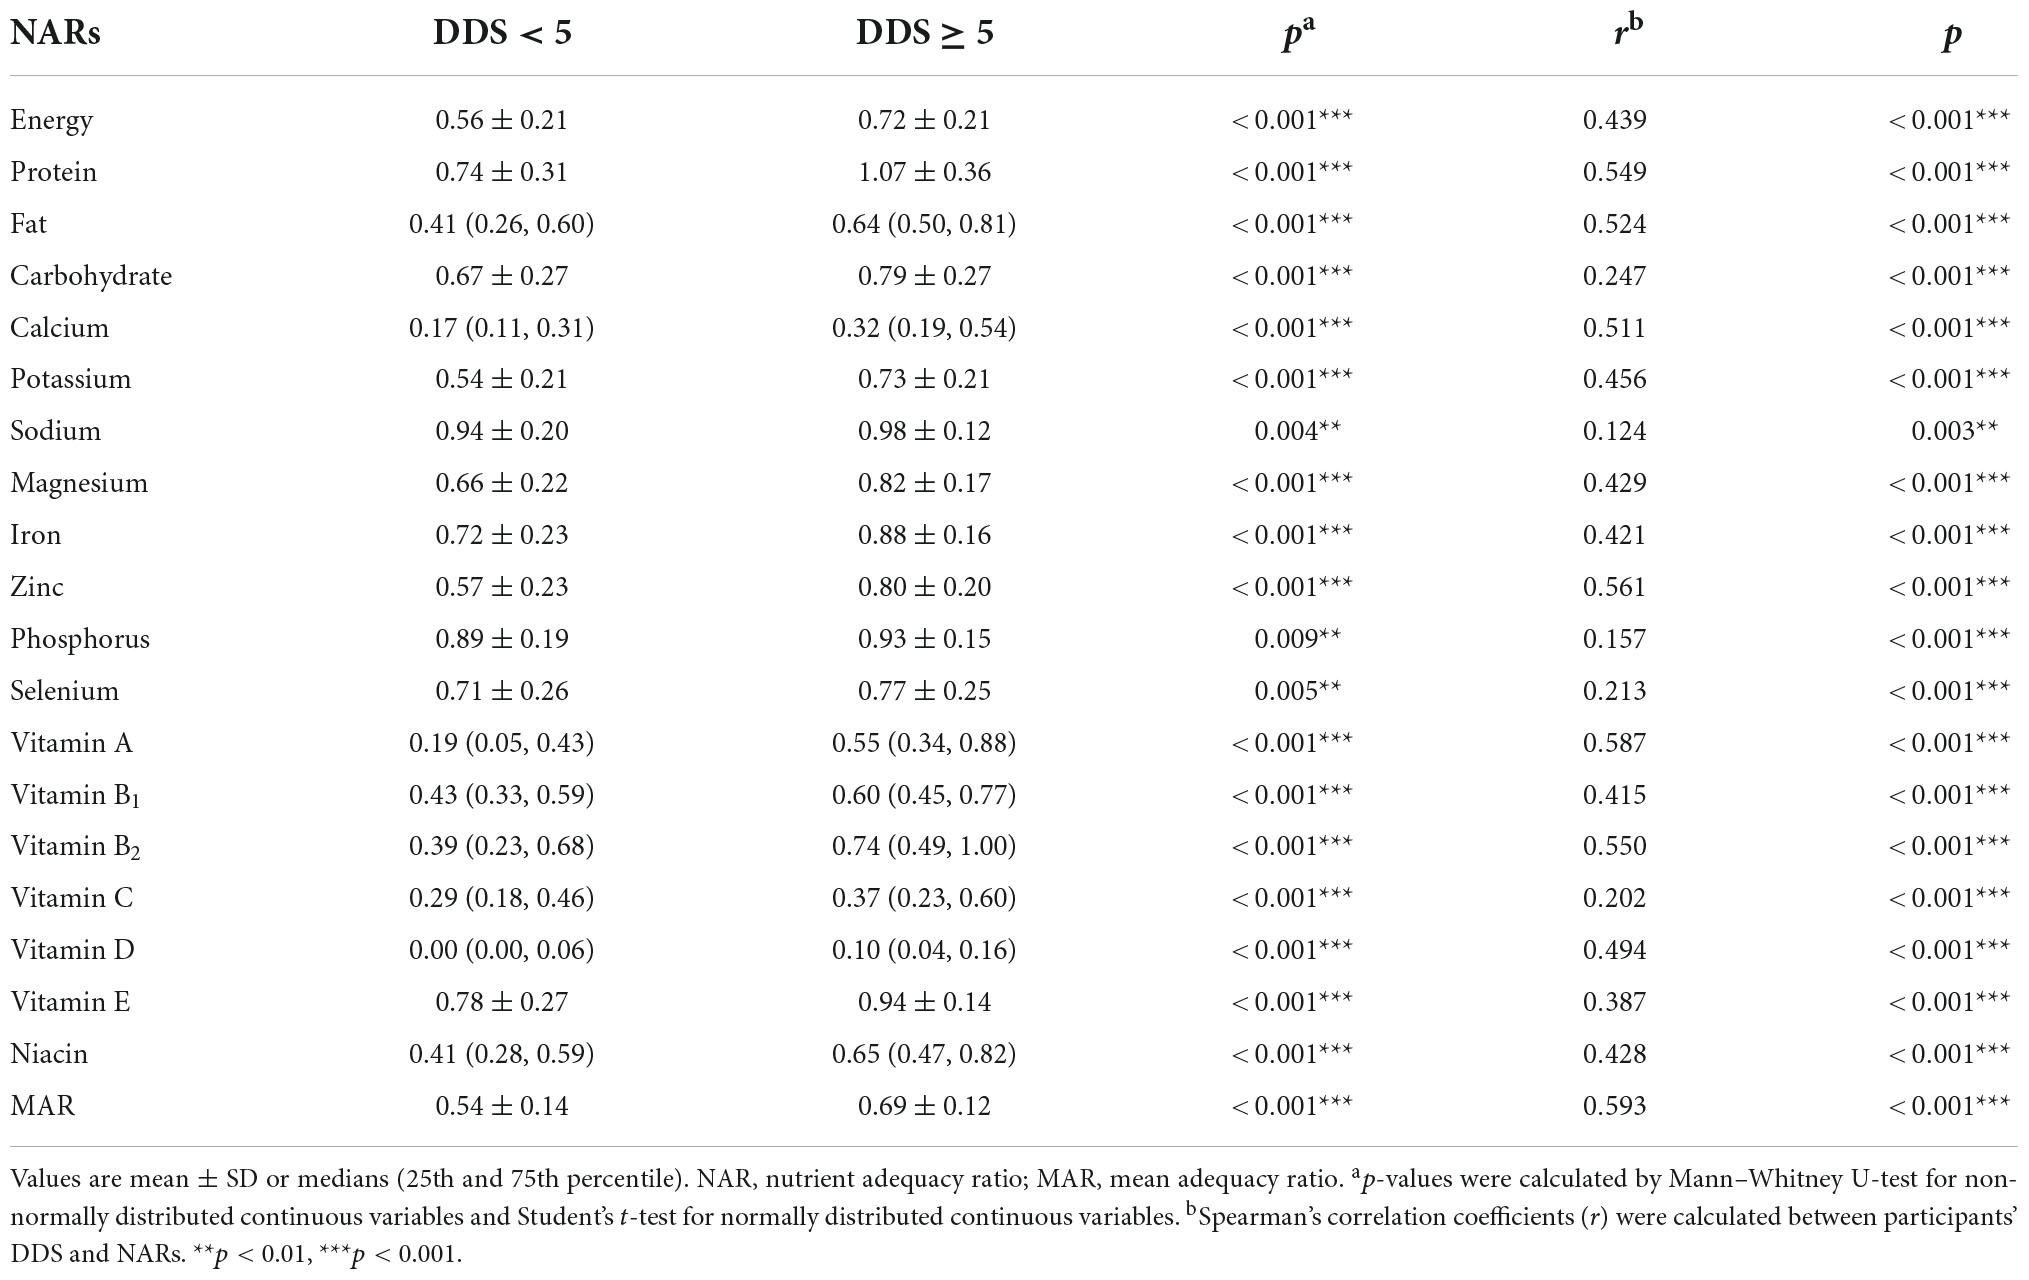
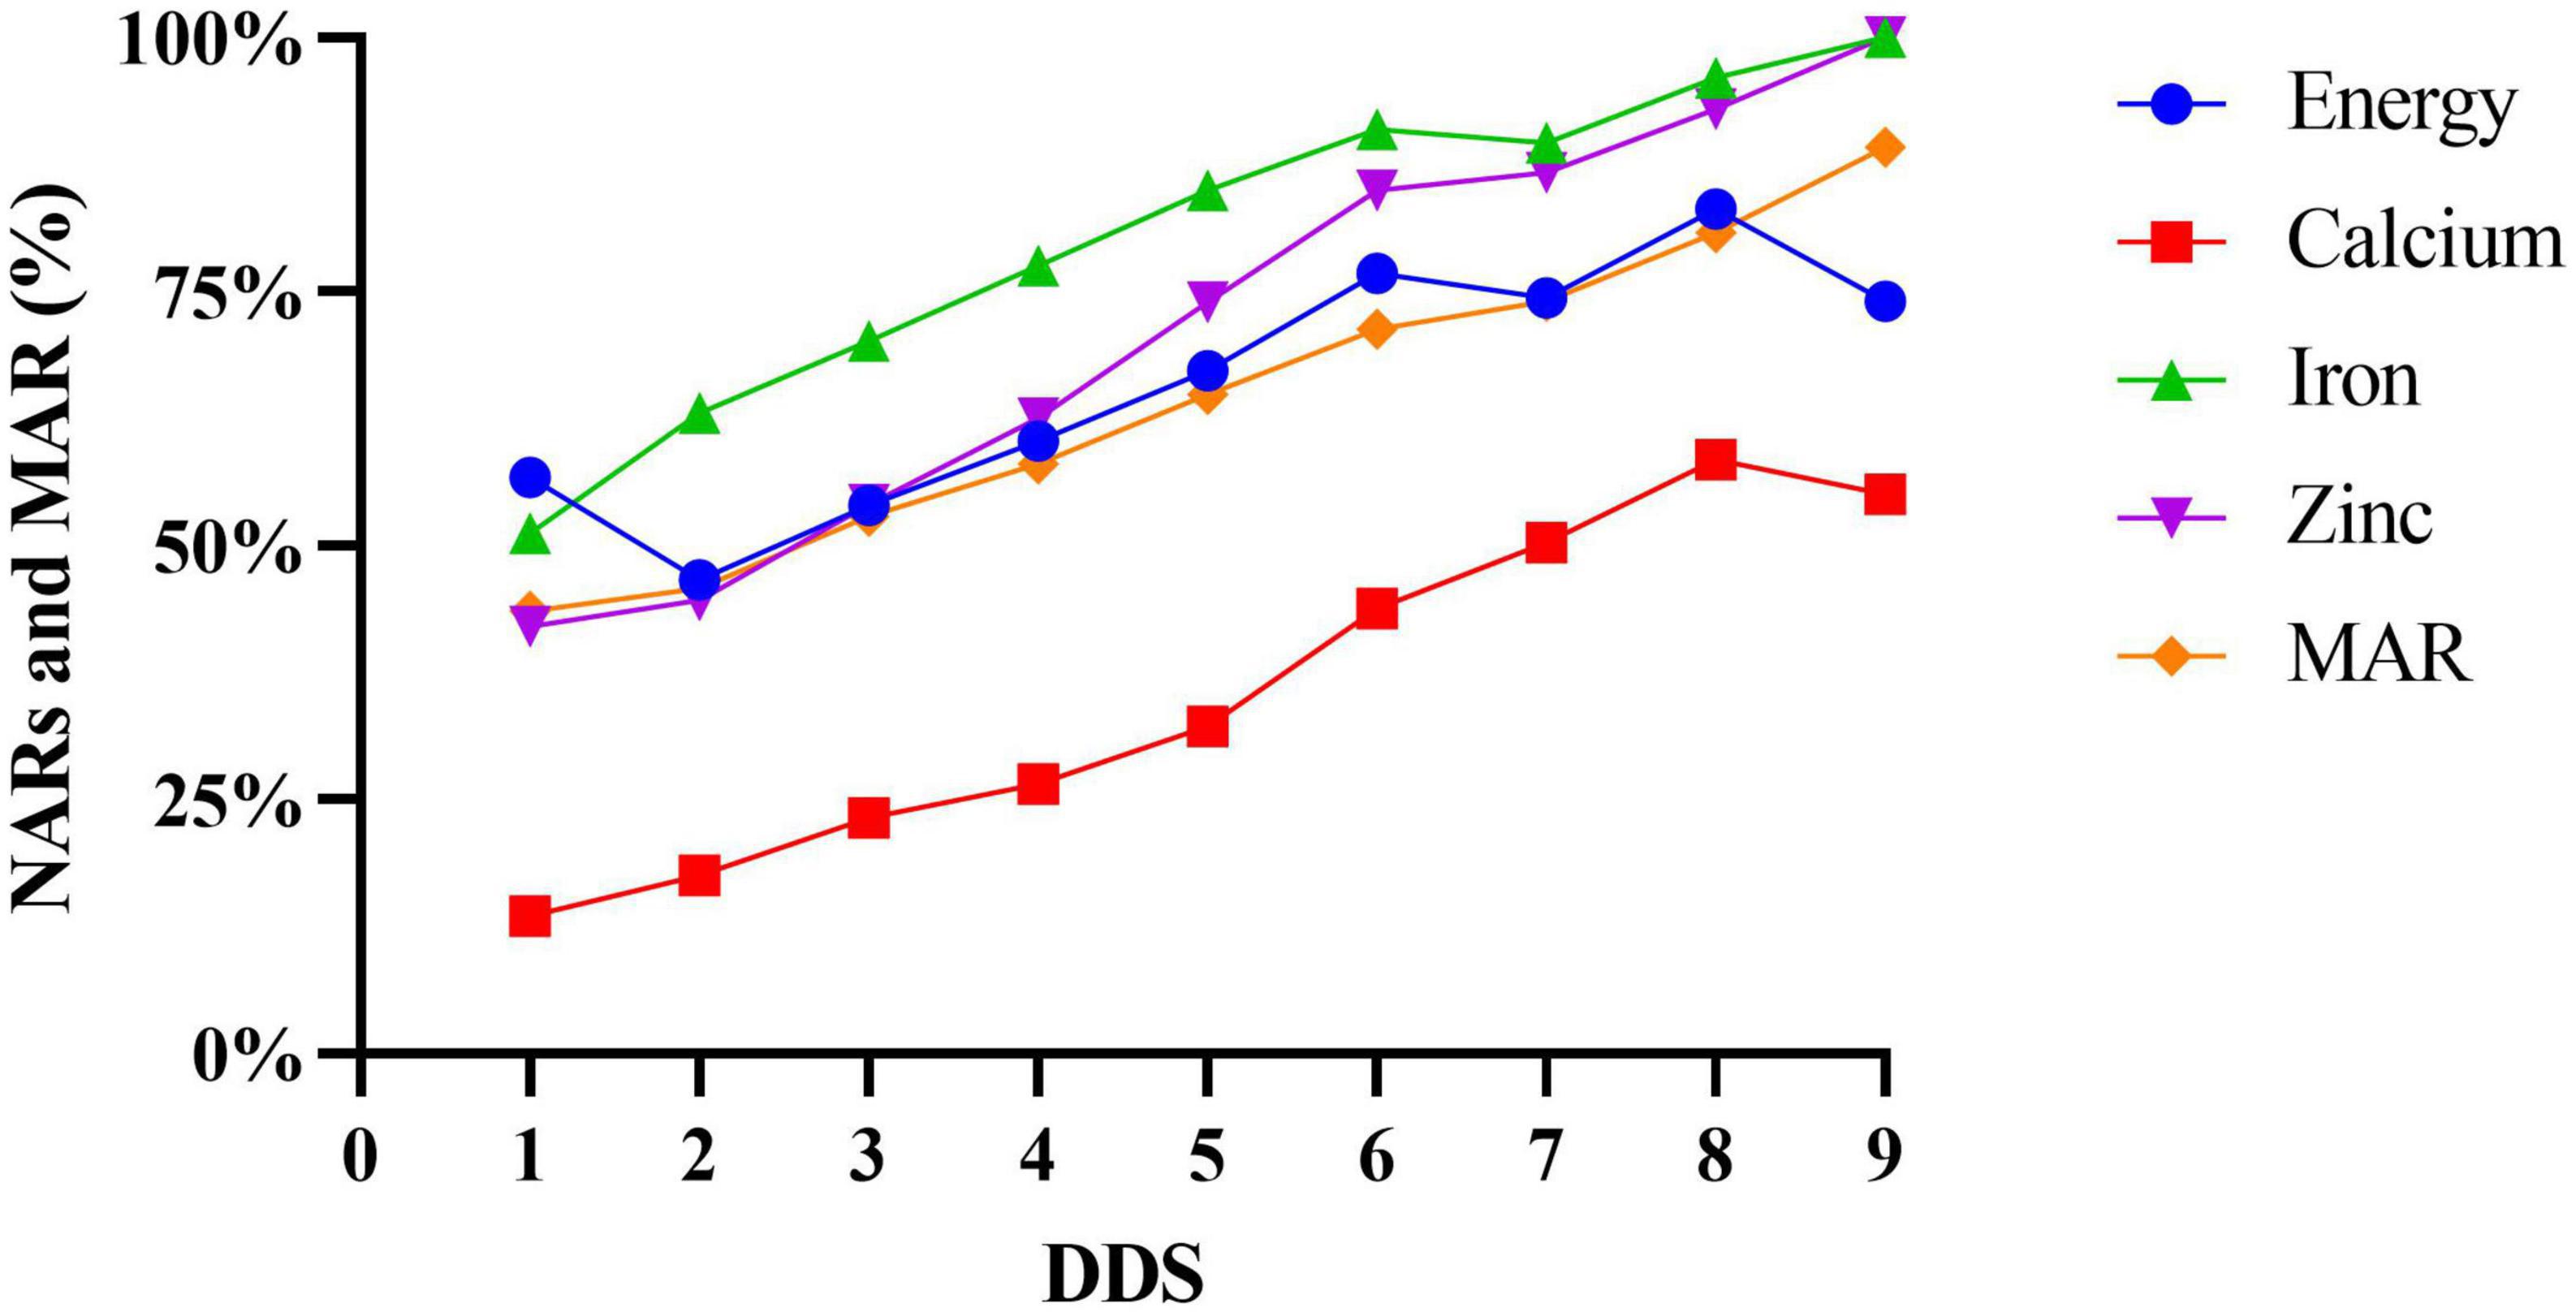
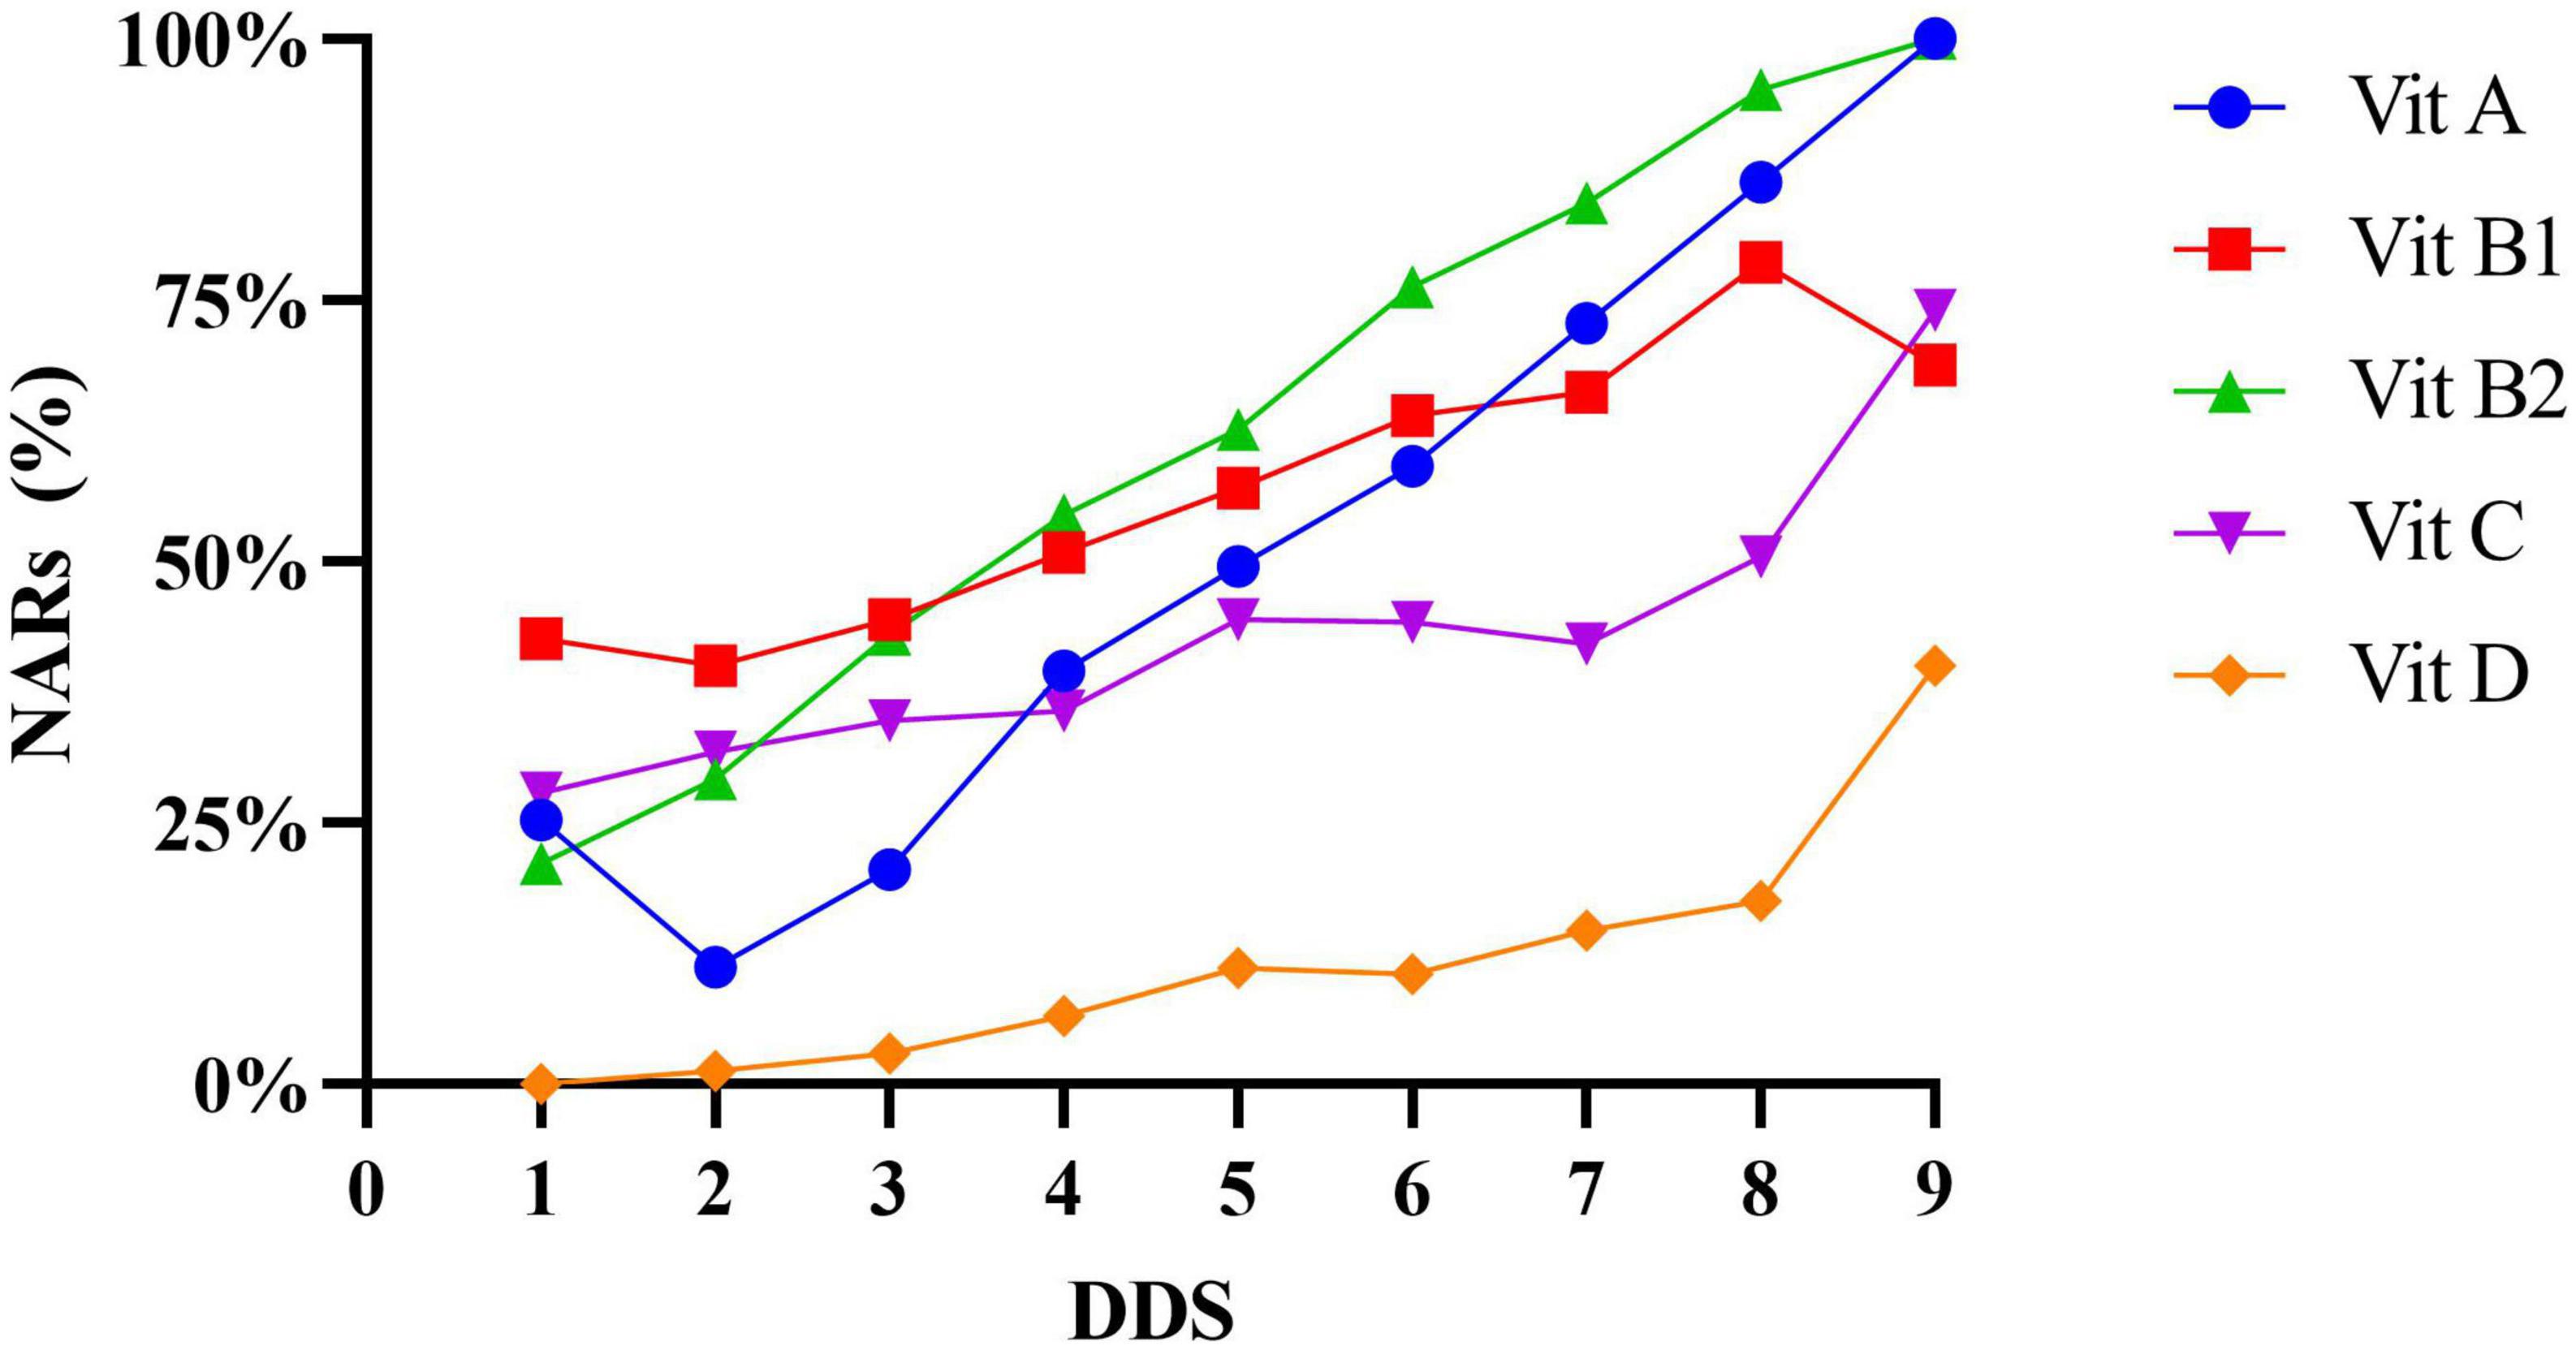
In the same way, of the 15 micronutrients NAR values assessed, all of them and MAR were higher in the high-DDS participants than in the low-DDS participants (p < 0.01). Moreover, energy and macronutrients NAR values were significantly higher in the high DDS group than those in the low DDS group (p < 0.01). In the correlation study, the NARs of all micronutrients and MAR were significantly positively correlated with DDS (r value range = 0.124–0.593, p < 0.001). Similar results also occurred in energy and macronutrients NAR values (Table 3). In this study, the relationship between DDS and the NARs of energy, selected minerals, and vitamins showed an increase in NARs for all these nutrients as DDS increased (Figures 3, 4). When DDS reached its maximum value of 9, NARs of iron, zinc, vitamin A and vitamin B2 reached 100%. However, NARs of the other nutrients did not meet 100% whatever the DDS was. In addition, the most common nutrients were calcium and vitamin D, which were only 40% at the highest.
Predictors of dietary diversity score and mean adequacy ratio
In the Poisson regression model (Table 4), living in urban areas [β = 0.158, 95%CI: (0.075, 0.241)], higher household wealth [β = 0.116, 95%CI: (0.030, 0.202)], and more caregivers’ nutritional knowledge [β = 0.022, 95%CI: (0.006, 0.038)] were positively associated with DDS. Similarly, in the multivariable linear regression models (Table 5), being female [β = 0.025, 95%CI: (0.006, 0.043)], living in urban areas [β = 0.031, 95%CI: (0.010, 0.051)], higher education of caregivers [β = 0.027, 95%CI: (0.013, 0.040)] and higher DDS [β = 0.049, 95%CI: (0.042, 0.055)] were positively associated with MAR, while preschool children’s age [β = −0.057, 95%CI: (−0.078, −0.035)] and being non-Han Chinese [β = 0.030, 95%CI: (−0.050, −0.010)] were negatively associated with MAR.
Discussion
This study assessed the status of anthropometric status, blood biomarkers of nutrients, nutrient adequacy, and dietary diversity, as well as their relationships and the possible influencing factors of DDS and NAR among preschool children in poor ethnic minority areas of northwest China. The present study demonstrated that dietary diversity was positively associated with all nutrients (both macro- and micro- nutrients) and several other health outcomes.
The results showed that the mean DDS of preschool children was 4.67 ± 1.56, which was lower than the DDS reported in other areas of Chinese studies [5.77 in Chen et al., 6.10 in Meng et al., 6.80 in Zhao et al., 7.4 in Jiang et al. (19, 25, 31, 32)]. Compared to other developing countries, their DDS was higher than the preschool children in South Africa [3.60 in Steyn et al. (33)] and Zambia [4.39 in Caswell et al. (2)] but lower than those in the Philippines [5.62 in Modjadji et al. (34)] and Sri Lanka [5.4 in Perkins et al. (24)]. DDS has been used for many years, but the scoring standard of DDS is still not uniform. Different food groupings, 1-day or 3-day dietary recall, and whether there was a threshold of food intake when calculating DDS all affected the DDS value. Similarly, the prevalence of stunting, underweight, and wasting were 6.75, 6.92, and 4.15%, respectively, which were higher than in other studies conducted in Guangdong Province [1.31, 1.03, and 2.06% in Mu et al. (35)] or Shaanxi Province [1.24, 0.06, and 0.07% in Ding et al. (36)]. One possible explanation is that previous studies have concentrated on the central or eastern regions, where people have better access to higher socioeconomic status and nutritional concepts, which may contribute to the observed gap between this study and other studies. Additionally, the prevalence of low serum zinc, calcium, and iron were 12.63, 22.32, and 15.57%, respectively. Conversely, the prevalence of anemia was only 5.71%. The results of this study are generally similar to other studies, the iron deficiency rate is higher than that of Zhejiang Province (one of the most economically developed provinces in southeast China) but lower than that of Qinghai Province (in northwest China) (37, 38). Furthermore, the prevalence of anemia is quite low compared to other studies [19% in Wang et al., 11.19% in Zeng (39, 40)]. As of 2020, the “Nutrition Package” program of “1,000 days in early life” had been implemented in impoverished areas in China for many years. With the help of the “Nutrition Package,” Chinese preschool children could supplement more micronutrients in their early life, as one of the reasons for the low prevalence of anemia in local children (13).
We also found that participants with key different characteristics had varying DDS. Specifically, participants who lived in rural areas had lower DDS than those living in urban areas, which was consistent with many studies (18, 19, 24, 31, 32). This is probably due to reduced access to diverse foods and can be more costly compared to individuals living in urban areas (18, 41). Studies also reported that participants with caregivers’ that had a higher education level and family economic status in turn, had a higher DDS (18, 26, 42–44). Our present study also supports this finding. Left-behind children were a common phenomenon in impoverished areas in China, where at least one parent had gone out to work for more than 3 months. This may lead to children’s lack of dietary diversity, as evidenced by the findings of this study and other similar studies (45). Additionally, we also found that caregivers with more nutritional knowledge could contribute to higher DDS of preschool children, as other studies pointed out (25). In our study, participants who had anemia and low serum iron had a lower DDS, which has not been investigated in many studies. However, contrary to our hypothesis, preschool children who were born prematurely had a higher DDS. One possible explanation is that caregivers of premature babies used to give them more care and better food due to the poor condition when they were born.
Many reasons have been proposed to explain why people consume certain food groups instead of others (46). Two important reasons may include costs and accessibility (25, 38, 46). In our study, most of the food preschool children ate was planted by their own families, such as potatoes, Chinese cabbage, spinach, and tomatoes. This is the reason why the consumption of starchy staples, dark green leafy vegetables, and other fruits and vegetables were high. In addition, animal foods can provide various nutrients such as iron, calcium, and vitamin D, which cannot be replaced by plant-based foods (47). However, animal product consumption in preschool children was lower than plant-based foods consumption, especially organ meat, which was minimally consumed by anyone. Ethnic differences could explain this result, as half of the participants were ethnic minorities and Muslims, which prevented them from consuming organ meats. Thus, these foods were rare in local markets (48). After grouping according to DDS, the proportion of participants consuming all food groups except starchy staples and organ meat in the high DDS group was higher than that in low DDS group, which was also similar to other studies (23, 49).
To our knowledge, the present study is the first to assess the relationship between dietary diversity and blood biomarkers or anthropometric status among preschool children in a poor ethnic minority area of China. DDS is positively associated with serum potassium, serum iron, WAZ, and HAZ. For blood biomarkers, Vyncke et al. found that Diet Quality Index (similar to DDS) was positively associated with 25-hydroxyvitamin D, holo-transcobalamin and n-3 fatty acid serum levels in European adolescents (50), while Ganpule-Rao et al. found that DDS was positively associated with vitamin B12, folate, and Hb in Indian rural youth (20). For anthropometric status, only a positive association between DDS and HAZ in Sri Lankan young children was observed by Perkins et al. (24). Compared with dietary intake, blood biomarkers or anthropometric status were medium and long-term indicators that reflected the nutritional status of preschool children, so the link with DDS is not too strong. However, the results of this study suggested that DDS could also assess blood biomarkers or anthropometric status in preschool children to some extent.
Simultaneously, a positive correlation was also found between DDS and NARs in all macro- and micronutrients, which was in accordance with but much stronger than previous findings (1, 3, 19, 21, 49). Although there were very few participants with a DDS of 1 and 9 (only 4 and 1, respectively) and random errors would be introduced in studying the relationship between DDS and NARs and MAR, we can generally infer that even when the DDS was 9, part of NARs and MAR were still less than 100% (2, 18, 33, 51). However, many NARs (such as calcium and vitamin D) were quite low in both high DDS and low DDS groups, suggesting that preschool children were at risk of hidden hunger. In our study, both the number of consumers and the consumption of milk and dairy products, as well as meat and fish, were very limited, which was undoubtedly a key factor in the observed low NARs.
According to the Poisson regression model of predictors of DDS, living in urban areas, higher household wealth and more caregivers’ nutritional knowledge were positive influential factors of DDS, which was consistent with many studies (25, 32). Similarly, living in urban areas, higher education of caregivers, and higher DDS were positively associated with MAR, illustrating the positive association between DDS and NAR. Thanks to the grassroots poverty alleviation work vigorously promoted by the Chinese government, we can expect that the nutritional status of preschool children will be improved accordingly. Also, in part with the help of the constantly increasing level of economic development and living quality of individuals in poor ethnic minority areas dietary intake will be improved in the near future. In addition, nutritional education for caregivers could also be given attention to improve the nutritional status of preschool children.
China is an expansive country with diverse lifestyles and nutrition intake. To the best of our knowledge, our study is the first survey focused on the association between dietary diversity and nutrient adequacy, blood biomarkers, anthropometric status as well as exploring the predictors of DDS and MAR in preschool children in poor ethnic minority area of northwest China. The findings could help evaluate the nutritional status of preschool children via an alternative approach that could simplify the workload of dietary surveys and provide preschool children with much more balanced diets, particularly making up for the lack of using only one type of indicator (e.g., blood trace element) in such poor areas. There were also several limitations to this study. First, the study design was a cross-sectional investigation and it could not infer a causal relationship. Second, it was conducted only in one county of one province, and the data might be not representative. Third, due to the local caregivers’ traditional thinking and religious beliefs, only peripheral blood was collected instead of venous blood, which was a limitation that we could not analyze biomarkers such as plasma vitamins. Fourth, it is difficult to control some confounders such as biological variations.
Conclusion
In conclusion, this study indicated that the dietary diversity was relatively low with starchy staples being the most consumed food group and the intakes of many nutrients were inadequate. While the prevalence of stunting, wasting, and underweight was high among preschool children in poor ethnic minority area of Northwest China. Additionally, DDS was associated with serum potassium, serum iron, WAZ, HAZ, all NARs, and MAR. Efforts are warranted to increase the dietary diversity of preschool children in such areas to improve their nutritional status. Furthermore, living in urban areas, higher household wealth, not engaging in farming, and more caregivers’ nutritional knowledge were positively associated with DDS while living in urban areas, higher education of caregivers, and higher DDS were positively associated with MAR. Nutritional education for caregivers and policies such as poverty alleviation and nutrition improvement to promote the dietary diversity of preschool children are necessary.
Data availability statement
The raw data supporting the conclusions of this article will be made available by the authors, without undue reservation.
Ethics statement
The studies involving human participants were reviewed and approved by the Medical Ethics Committee of School of Public Health, Lanzhou University. Written informed consent to participate in this study was provided by the participants’ legal guardian/next of kin.
Author contributions
BH and YZ designed research. BH, ZW, ST, YC, YJ, QZ, XC, MS, and CZ conducted research. BH analyzed data and wrote the manuscript. BH and CK edited the manuscript. LW and YZ had primary responsibility for final content. All authors read and approved the final manuscript.
Funding
This research was supported by the Pilot Project for Nutritional Improvement of Preschool Children in Gansu Province (grant number: WFPGSPNIP, funded by the World Food Program) and the Fundamental Research Funds for the Central Universities (grant number: lzujbky-2021-ct20).
Acknowledgments
We thank all the preschool children, caregivers, preschool staff, and relevant government departments who participated in this study.
Conflict of interest
The authors declare that the research was conducted in the absence of any commercial or financial relationships that could be construed as a potential conflict of interest.
Publisher’s note
All claims expressed in this article are solely those of the authors and do not necessarily represent those of their affiliated organizations, or those of the publisher, the editors and the reviewers. Any product that may be evaluated in this article, or claim that may be made by its manufacturer, is not guaranteed or endorsed by the publisher.
References
1. Moursi MM, Arimond M, Dewey KG, Trèche S, Ruel MT, Delpeuch F, et al. Dietary diversity is a good predictor of the micronutrient density of the diet of 6- to 23-month-old children in Madagascar. J Nutr. (2008) 138:2448–53. doi: 10.3945/jn.108.093971
2. Caswell BL, Talegawkar SA, Siamusantu W, West KP Jr, Palmer AC. A 10-food group dietary diversity score outperforms a 7-food group score in characterizing seasonal variability and micronutrient adequacy in rural Zambian children. J Nutr. (2018) 148:131–9. doi: 10.1093/jn/nxx011
3. Wang Z, Chen Y, Tang S, Chen S, Gong S, Jiang X, et al. Dietary diversity and nutrient intake of han and dongxiang smallholder farmers in poverty areas of Northwest China. Nutrients. (2021) 13:3908–21. doi: 10.3390/nu13113908
4. Chakona G, Shackleton C. Minimum dietary diversity scores for women indicate micronutrient adequacy and food insecurity status in South African towns. Nutrients. (2017) 9:812–27. doi: 10.3390/nu9080812
5. Li S, Chen K, Liu C, Bi J, He Z, Luo R, et al. Dietary diversity and mental health in preschoolers in rural China. Public Health Nutr. (2021) 24:1869–76. doi: 10.1017/S1368980020003237
6. Physicians Committee for Responsible Medicine. Nutrition Requirements Throughout the Lifecycle. (2020). Available online at: https://nutritionguide.pcrm.org/nutritionguide/view/Nutrition_Guide_for_Clinicians/1342043/all/Nutritional_Requirements_throughout_the_Life_Cycle (accessed on Jan 19 2022).
7. Jarman M, Ogden J, Inskip H, Lawrence W, Baird J, Cooper C, et al. How do mothers manage their preschool children’s eating habits and does this change as children grow older? A longitudinal analysis. Appetite. (2015) 95:466–74. doi: 10.1016/j.appet.2015.08.008
8. Kaikkonen JE, Mikkilä V, Magnussen CG, Juonala M, Viikari JS, Raitakari OT, et al. Does childhood nutrition influence adult cardiovascular disease risk?–insights from the young finns study. Ann Med. (2013) 45:120–8. doi: 10.3109/07853890.2012.671537
9. Tzioumis E, Adair LS. Childhood dual burden of under- and overnutrition in low- and middle-income countries: a critical review. Food Nutr Bull. (2014) 35:230–43. doi: 10.1177/156482651403500210
10. Dearth-Wesley T, Wang H, Popkin BM. Under- and overnutrition dynamics in Chinese children and adults (1991-2004). Eur J Clin Nutr. (2008) 62:1302–7. doi: 10.1038/sj.ejcn.1602853
11. Chang J, Wang Y. Comprehensive Report of 2010–2013 Chinese Nutrition and Health Surveillance. Beijing: Peking University Medical Press. (2016).
12. Cao Y, Ding G. Analysis on the nutritional status of children under 5 years in poor rural area of Linxia county. Matern Child Health Care China. (2011) 26:4211–4.
13. National Health Commission of the People’s Republic of China. Information Disclosure. (2013) Available online at: http://www.nhc.gov.cn/cms-search/xxgk/getManuscriptXxgk.htm?id=25bcc2db06774177bd30e0bcc516c67e (accessed on Jan 9 2022).
14. General Office of the State Council of the People’s Republic of China. Notice of the General Office of the State Council on Issuing the National Nutrition Plan (2017-2030) (2017) Available online at: http://www.gov.cn/zhengce/content/2017-07/13/content_5210134.htm (accessed on Jan 19 2022).
15. McGuire S. WHO, world food programme, and international fund for agricultural development. 2012. the state of food insecurity in the world 2012. economic growth is necessary but not sufficient to accelerate reduction of hunger and malnutrition. Rome, FAO. Adv Nutr. (2013) 4:126–7. doi: 10.3945/an.112.003343
16. Arimond M, Wiesmann D, Becquey E, Carriquiry A, Daniels MC, Deitchler M, et al. Simple food group diversity indicators predict micronutrient adequacy of women’s diets in 5 diverse, resource-poor settings. J Nutr. (2010) 140:2059S–69S. doi: 10.3945/jn.110.123414
17. Isa F, Xie LP, Hu Z, Zhong Z, Hemelt M, Reulen RC, et al. Dietary consumption and diet diversity and risk of developing bladder cancer: results from the South and East China case–control study. Cancer Causes Control. (2013) 24:885–95. doi: 10.1007/s10552-013-0165-5
18. Mak TN, Angeles-Agdeppa I, Lenighan YM, Capanzana MV, Montoliu I. Diet diversity and micronutrient adequacy among filipino school-age children. Nutrients. (2019) 11:2197–209. doi: 10.3390/nu11092197
19. Meng L, Wang Y, Li T, Loo-Bouwman CAV, Zhang Y, Man-Yau Szeto I, et al. Dietary diversity and food variety in Chinese children aged 3(-)17 years: are they negatively associated with dietary micronutrient inadequacy? Nutrients. (2018) 10:1674–87. doi: 10.3390/nu10111674
20. Ganpule-Rao AV, Bhat D, Yajnik CS, Rush E. Dietary diversity scores, nutrient intakes and biomarkers vitamin B12, folate and Hb in rural youth from the pune maternal nutrition study. Br J Nutr. (2021) 126:236–43. doi: 10.1017/S0007114520004018
21. Cano-Ibáñez N, Gea A, Martínez-González MA, Salas-Salvadó J, Corella D, Zomeño MD, et al. Dietary diversity and nutritional adequacy among an older spanish population with metabolic syndrome in the PREDIMED-plus study: a cross-sectional analysis. Nutrients. (2019) 11:958–74. doi: 10.3390/nu11050958
22. Nguyen PH, Huybregts L, Sanghvi TG, Tran LM, Frongillo EA, Menon P, et al. Dietary diversity predicts the adequacy of micronutrient intake in pregnant adolescent girls and women in Bangladesh, but use of the 5-group cutoff poorly identifies individuals with inadequate intake. J Nutr. (2018) 148:790–7. doi: 10.1093/jn/nxy045
23. Bianchi CM, Egnell M, Huneau JF, Mariotti F. Plant protein intake and dietary diversity are independently associated with nutrient adequacy in french adults. J Nutr. (2016) 146:2351–60. doi: 10.3945/jn.116.236869
24. Perkins JM, Jayatissa R, Subramanian SV. Dietary diversity and anthropometric status and failure among infants and young children in Sri Lanka. Nutrition. (2018) 55-56:76–83. doi: 10.1016/j.nut.2018.03.049
25. Bi J, Liu C, Li S, He Z, Chen K, Luo R, et al. Dietary diversity among preschoolers: a cross-sectional study in poor, rural, and ethnic minority areas of Central South China. Nutrients. (2019) 11:558–70. doi: 10.3390/nu11030558
26. Anane I, Nie F, Huang J. Socioeconomic and geographic pattern of food consumption and dietary diversity among children aged 6-23 months old in Ghana. Nutrients. (2021) 13:603–26. doi: 10.3390/nu13020603
27. Ministry of Education of the People’s Republic of China. The Ministry of Education released the 2013 National Education Development Statistical Bulletin. (2014). Available online at: http://www.moe.gov.cn/srcsite/A03/s180/moe_633/201407/t20140704_171144.html (accessed on Jan 19 2022).
28. Kennedy G, Ballard T, Dop MC. Guidelines for Measuring Household and Individual Dietary Diversity. Rome: Food and Agriculture Organization of the United Nation (2013).
29. Chinese Nutrition Society [CNS]. Chinese Dietary Reference Intakes (2013). Beijing: Chinese Nutrition Society (2014).
30. World Health Organization [WHO]. WHO Child Growth Standards: Length/Heightfor-Age, Weight-For-Age, Weight-For-Length, Weight-For-Height And Body Mass Index-For-Age: Methods And Development. (2006). Available online at: https://www.who.int/publications/i/item/924154693X (accessed on Jan19 2022).
31. Zhao W, Yu K, Tan S, Zheng Y, Zhao A, Wang P, et al. Dietary diversity scores: an indicator of micronutrient inadequacy instead of obesity for Chinese children. BMC Public Health. (2017) 17:440. doi: 10.1186/s12889-017-4381-x
32. Jiang H, Zhao A, Zhao W, Tan S, Zhang J, Zhang Y, et al. Do Chinese preschool children eat a sufficiently diverse diet? A cross-sectional study in China. Nutrients. (2018) 10:794–804. doi: 10.3390/nu10060794
33. Steyn NP, Nel JH, Nantel G, Kennedy G, Labadarios D. Food variety and dietary diversity scores in children: are they good indicators of dietary adequacy? Public Health Nutr. (2006) 9:644–50. doi: 10.1079/PHN2005912
34. Modjadji P, Molokwane D, Ukegbu PO. Dietary diversity and nutritional status of preschool children in north west province, South Africa: a cross sectional study. Children. (2020) 7:174. doi: 10.3390/children7100174
35. Mu Y, Ren X, Tang S. Analysis on status of physical growth and nutrition among preschool children in Baoji city. Chin J Health Educ. (2021) 36:854–7.
36. Yu D, Fang H, Xu X. Prevalence of undernutrition among 0 – 5 years old children in China in 2013. Chin J Public Health. (2019) 35:1339–44.
37. Xu X. Analysis of trace elements in whole blood of 3668 preschool children. Chin J Rural Med Pharm. (2015) 22:69–70.
38. Liu H. Analysis of trace element test results in 646 preschool children in Datong county. Contemp Med Symp. (2016) 14:145.
39. Wang L, Li M, Dill SE, Hu Y, Rozelle S. Dynamic anemia status from infancy to preschool-age: evidence from rural China. Int J Environ Res Public Health. (2019) 16:2761–83. doi: 10.3390/ijerph16152761
40. Zeng S. Study on Nutritional Status and Intervention of Preschool Children in Moyu County, Hetian Area, Xinjiang, in; School of Public Health. Nanjing: Xinjiang Medical University (2020) p. 59.
41. Liu J, Shively GE, Binkley JK. Access to variety contributes to dietary diversity in China. Food Policy. (2014) 49:323–31. doi: 10.1016/j.foodpol.2014.09.007
42. Slam MR, Rahman SM, Tarafder C, Rahman MM, Rahman A, Ekström EC, et al. Exploring rural adolescents’ dietary diversity and its socioeconomic correlates: a cross-sectional study from matlab, Bangladesh. Nutrients. (2020) 12:2230–48. doi: 10.3390/nu12082230
43. Zhang Q, Chen X, Liu Z, Varma DS, Wan R, Zhao S, et al. Diet diversity and nutritional status among adults in southwest China. PLoS One. (2017) 12:e0172406. doi: 10.1371/journal.pone.0172406
44. Ochieng J, Afari-Sefa V, Lukumay PJ, Dubois T. Determinants of dietary diversity and the potential role of men in improving household nutrition in Tanzania. PLoS One. (2017) 12:e0189022. doi: 10.1371/journal.pone.0189022
45. Tian X, Wang H The impact of having one parent absent on children’. food consumption and nutrition in China. Nutrients. (2019) 12:3077–94. doi: 10.3390/nu11123077
46. Glanz K, Basil M, Maibach E, Goldberg J, Snyder D. Why Americans eat what they do: taste, nutrition, cost, convenience, and weight control concerns as influences on food consumption. J Am Diet Assoc. (1998) 98:1118–26. doi: 10.1016/S0002-8223(98)00260-0
47. Gavelle E, Huneau JF, Mariotti F. Patterns of protein food intake are associated with nutrient adequacy in the general french adult population. Nutrients. (2018) 10:226–40. doi: 10.3390/nu10020226
48. Rozelle S, Huang J, Benziger V. Continuity and change in China’s rural periodic markets. China J. (2003) 49:89–115. doi: 10.2307/3182196
49. Gómez G, Nogueira Previdelli Á, Fisberg RM, Kovalskys I, Fisberg M, Herrera-Cuenca M, et al. Dietary diversity and micronutrients adequacy in women of childbearing age: results from ELANS study. Nutrients. (2020) 12:1994–2010. doi: 10.3390/nu12071994
50. Vyncke K, Cruz Fernandez E, Fajó-Pascual M, Cuenca-García M, De Keyzer W, Gonzalez-Gross M, et al. Validation of the diet quality index for adolescents by comparison with biomarkers, nutrient and food intakes: the HELENA study. Br J Nutr. (2013) 109:2067–78. doi: 10.1017/S000711451200414X
Keywords: preschool children, dietary diversity, nutrient adequacy, blood biomarkers, anthropometric status
Citation: Hu B, Tang S, Wang Z, Chen Y, Chen X, Zhao Q, Jiang Y, Shen M, Zhang C, Kaliszewski C, Wang L and Zhang Y (2022) Dietary diversity is associated with nutrient adequacy, blood biomarkers and anthropometric status among preschool children in poor ethnic minority area of Northwest China. Front. Nutr. 9:948555. doi: 10.3389/fnut.2022.948555
Received: 20 May 2022; Accepted: 08 November 2022;
Published: 24 November 2022.
Edited by:
Tuyen Van Duong, Taipei Medical University, TaiwanReviewed by:
Fentaw Feleke, Woldia University, EthiopiaPerpetua Modjadji, South African Medical Research Council, South Africa
Copyright © 2022 Hu, Tang, Wang, Chen, Chen, Zhao, Jiang, Shen, Zhang, Kaliszewski, Wang and Zhang. This is an open-access article distributed under the terms of the Creative Commons Attribution License (CC BY). The use, distribution or reproduction in other forums is permitted, provided the original author(s) and the copyright owner(s) are credited and that the original publication in this journal is cited, in accordance with accepted academic practice. No use, distribution or reproduction is permitted which does not comply with these terms.
*Correspondence: Liang Wang, bGlhbmdfd2FuZzFAYmF5bG9yLmVkdQ==; Ying Zhang, eWluZ3pAbHp1LmVkdS5jbg==
 Binshuo Hu
 Shihua Tang1
 Xiaohui Chen
 Yu Jiang
 Liang Wang
 Ying Zhang
