
94% of researchers rate our articles as excellent or good
Learn more about the work of our research integrity team to safeguard the quality of each article we publish.
Find out more
ORIGINAL RESEARCH article
Front. Nutr., 28 July 2022
Sec. Nutrition and Metabolism
Volume 9 - 2022 | https://doi.org/10.3389/fnut.2022.940183
This article is part of the Research TopicThe Role of Vitamin D in Metabolic and Cardiovascular HealthView all 14 articles
 Yi-Chuan Chen1†
 Wen-Cheng Li1,2,3†Pin-Hsuan Ke1I-Chun Chen1Wei Yu3Hsiung-Ying Huang4Xue-Jie Xiong5
 Jau-Yuan Chen1,2*
This study aimed to investigate the risk of vitamin D deficiency in a relatively healthy Asian population, with (i) metabolically healthy normal weight (MHNW) (homeostasis model assessment-insulin resistance [HOMA-IR] < 2. 5 without metabolic syndrome [MS], body mass index [BMI] < 25), (ii) metabolically healthy obesity (MHO) (HOMA-IR < 2.5, without MS, BMI ≥ 25), (iii) metabolically unhealthy normal weight (MUNW) (HOMA-IR ≥ 2.5, or with MS, BMI < 25), and (iv) metabolically unhealthy obesity (MUO) (HOMA-IR ≥ 2.5, or with MS, BMI ≥ 25) stratified by age and sex. This cross-sectional study involved 6,655 participants aged ≥ 18 years who underwent health checkups between 2013 and 2016 at the Chang Gung Memorial Hospital. Cardiometabolic and inflammatory markers including anthropometric variables, glycemic indices, lipid profiles, high-sensitivity C-reactive protein (hs-CRP), and serum 25-hydroxy vitamin D levels, were retrospectively investigated. Compared to the MHNW group, the MHO group showed a higher odds ratio (OR) [1.35, 95% confidence interval (CI) 1.05–1.73] for vitamin D deficiency in men aged < 50 years. By contrast, in men aged > 50 years, the risk of vitamin D deficiency was higher in the MUO group (OR 1.44, 95% CI 1.05–1.97). Among women aged < and ≥ 50 years, the MUO group demonstrated the highest risk for vitamin D deficiency, OR 2.33 vs. 1.54, respectively. Our study revealed that in women of all ages and men aged > 50 years, MUO is associated with vitamin D deficiency and elevated levels of metabolic biomarkers. Among men aged < 50 years, MHO had the highest OR for vitamin D deficiency.
The prevalence of obesity has been increasing worldwide. Obesity-related disorders have been widely studied. Research has focused on visceral fat accumulation, which is recognized as a cardiometabolic risk factor (1). Adipocyte hypertrophy results in unbalanced blood flow, local hypoxia, inflammatory macrophage infiltration, increased synthesis, and release of pro-inflammatory mediators [such as tumor necrosis factor-alpha [TNF-α], interleukin [IL]-6, and IL-8], and tissue inflammation (2, 3). Adipokines such as TNF and IL-6, which are secreted from visceral fat, may contribute to the development of atherosclerosis (4, 5). Body mass index (BMI) is a convenient tool for assessing the extent of overweight and obesity. However, BMI has limitations in the evaluation of body composition and metabolic status (6–8).
Some obese individuals appear to be protected from the development of metabolic disturbances or complications; thus, they are referred to as metabolically healthy obesity (MHO) (9). Individuals with MHO have lower visceral fat values than individuals with a similar body fat percentage (10). In addition, despite having excessive body weight, individuals with MHO demonstrate normal blood pressure, lipid profile, insulin sensitivity, inflammatory markers such as C-reactive protein (CRP) (11–13), and favorable levels of liver enzymes, which may reflect lower liver fat content (14) without significantly increased risks of diabetes and cardiovascular diseases (15, 16). Several mechanisms have been hypothesized to explain MHO. For example, high mitochondrial transcription and low inflammation levels in subcutaneous adipose tissue are associated with lower liver fat and MHO levels (17). In addition, differences in visceral fat accumulation, birth weight, adipose cell size, gene expression encoding markers of adipose cell differentiation (11) and lipolysis (18) were suggestive of MHO phenotype development.
By contrast, some individuals with normal weight but metabolic disturbances or complications were defined as metabolically unhealthy normal weight (MUNW) groups. Such individuals might be characterized by higher body fat percentage, visceral fat and insulin levels, increased adipocyte size, and predisposition to type 2 diabetes mellitus (T2DM), hyperlipidemia, and cardiovascular diseases compared with patients with a similar BMI (19–24). Central fat distribution, lower physical activity energy expenditure, and lower peak oxygen uptake appeared to be predisposing factors for MUNW. In addition, a cognitive attitude toward food and lifestyle plays a role in insulin sensitivity in MUNW (25).
Vitamin D involves in a variety of processes in human body. In addition to calcium (Ca) homeostasis and bone metabolism, vitamin D plays an important role in multiple organs and has many physiological functions (26). Recent studies suggest that low vitamin D levels are a risk factor not only for osteoporosis, sarcopenia, and frailty, but also for infection, autoimmune diseases, and other cardiometabolic diseases, such as hypertension (27, 28), diabetes (29) and metabolic syndrome (30–37). Vitamin D is mediated by the vitamin D receptor (VDR), which regulates the transcription of several target genes (38). VDR has been identified in a large variety of cell types, including monocytes, cardiomyocytes, pancreatic beta cells, vascular endothelial cells, neurons, immune cells, and osteoblasts (39). Recent studies have demonstrated that VDR and vitamin D-metabolizing enzymes are expressed in adipocytes (40).
Evidence has shown that vitamin D inhibits the expression of adipogenic transcription factor genes, leading to a significant reduction in lipid accumulation and adipocyte apoptosis (2, 41). Obese individuals tend to have lower vitamin D levels (42–46), predisposing them to the development of comorbidities. Increased sequestration by the white adipose tissue reduces vitamin D bioavailability (47, 48). Vitamin D deficiency is also associated with the dysregulation of white adipose tissue and blood levels of inflammatory factors, including CRP and IL-10 (2). Several cross-sectional and cohort studies have found a positive correlation between vitamin D levels, beta cell function (49), and insulin sensitivity. Patients with low vitamin D levels appear to have a high risk of insulin resistance. The potential role of vitamin D deficiency in insulin resistance has been associated with inherited gene polymorphisms, including vitamin D-binding protein, vitamin D receptor, and the vitamin D 1 alpha-hydroxylase gene (30, 50–54).
After a thorough literature search, we found that the association between vitamin D deficiency and metabolic body composition status remains controversial. Furthermore, little has been reported about cardiometabolic markers among the different metabolic phenotypes with respect to sex and age (55). Since male and female have different features of adiposity distribution, which may affect vitamin D bioavailability, coupled with changes in metabolism due to the loss of protection from hormones after menopause, we aimed to compare the impact of metabolic phenotypes on the risk of vitamin D deficiency stratified by sex and age. We hypothesized that (i) metabolically unhealthy obesity (MUO) is an independent risk factor for vitamin D deficiency; (ii) in male participants of all ages and female participants aged > 50 years, cardiometabolic markers have incremental trends among the healthy, MHO, MUNW, and MUO groups.
We retrospectively obtained data from adult participants (age ≥ 18 years) who underwent health checkups between 2013 and 2016 at Chang Gung Memorial Hospital. The exclusion criteria were as follows: (i) fasting < 12 h; (ii) pregnancy; (iii) conditions that may affect the metabolic status, such as hyperthyroidism or hypothyroidism, malignancy, chronic hepatitis, liver cirrhosis, hypothalamic disease, pituitary gland, or adrenal gland diseases; (iv) parathyroid gland disease or intake of medications that may affect vitamin D level; (v) high sensitivity (hs)-CRP > 10 mg/L, which may indicate acute infection status; and (vi) participants with incomplete data and history. In total, 6,655 participants were included in the analysis. Informed consent was not obtained because all data were accessed anonymously in the setting of retrospective records.
Trained nurses used a standardized questionnaire to collect information on patients' medical and personal histories. Completion of the questionnaire was followed by anthropometric measurement, including body weight (kg), height (centimeter, cm), waist circumference (cm), and blood pressure (mmHg). Body height and weight were measured using calibrated meters and scales, according to a standardized protocol. BMI was calculated as body weight divided by the square of body height (kg/m2). Waist circumference was measured midway between the lowest rib and iliac crest. Blood pressure was measured using an automated sphygmomanometer three times after the participants were seated for at least 15 min.
Laboratory data included total cholesterol (TC), low-density lipoprotein-cholesterol (LDL-C, mmol/L), high-density lipoprotein-cholesterol (HDL-C, mmol/L), triglyceride (TG, mmol/L), fasting blood glucose (FBG, mmol/L), hs-CRP (μg/mL), and insulin, which were determined using enzymatic, spectrophotometric, or colorimetric methods. Between 2013 and 2014, serum 25(OH)D levels were quantitatively determined using an electrochemiluminescence assay (ECLIA) performed on a Roche Cobas E601 immunoassay system (Roche Diagnostics, Mannheim, Germany); the unit of measurement was ng/mL. After 2015, it was determined using a chemiluminescent microparticle immunoassay (CMIA) on an Abbott I2000SR immunoassay system (Abbott Diagnostics, Illinois, USA), and the measurement unit was nmol/L. All the data were entered into an electronic database under strict quality control.
Participants who fulfilled at least three of the five criteria described by the Third Adult Treatment Panel (ATP III) of the National Cholesterol Education Program (NCEP) were defined as having metabolic syndromes. The five factors are high blood pressure (systolic blood pressure ≥ 130 mmHg and diastolic pressure ≥ 85 mmHg), under treatment, or already diagnosed with hypertension); high serum TG (≥ 1.7 mmol/L or under treatment); decreased HDL-C (<1.03 mmol/L for males and < 1.29 mmol/L for females or under treatment); hyperglycemia (FBG ≥ 5.6 mmol/L, under treatment, or previously diagnosed with diabetes mellitus); and abdominal obesity (waist circumference ≥ 90 cm for males and ≥ 80 cm for females).
HOMA-IR index was used to quantify the extent of insulin resistance. The cutoff value of HOMA-IR as an indicator of metabolic syndrome was based on two recent studies in Asian populations (26, 27). The HOMA-IR index formula was as follows:
All participants were categorized into four metabolic phenotypes:
(i) metabolically healthy normal weight (MHNW) (HOMA-IR <2.5, without MS, BMI <25), (ii) MHO (HOMA-IR <2.5, without MS, BMI ≥ 25), (iii) MUNW (HOMA-IR ≥ 2.5 or with MS, BMI <25), and (iv) MUO (HOMA-IR ≥ 2.5 or with MS, BMI ≥ 25).
A serum vitamin D level < 20 ng/mL is defined as vitamin D deficiency according to the Endocrine Society Clinical Practice Guidelines (56).
The mean ± standard deviation (SD) was used for continuous variables and the number (%) was used for categorical variables. The independent t-test and chi-square tests were used to compare differences between sexes for continuous and categorical variables, respectively. Analysis of variance and chi-square tests were used to compare the differences among different metabolic states (MHNW, MHO, MUNW, and MUO) for continuous and categorical variables, respectively. Additionally, linear contrast in the analysis of variance and the Cochran-Armitage test were used to determine the linear trend across metabolic states for continuous and categorical variables, respectively. Bonferroni post hoc comparisons were performed for pairwise analyses of the study groups. Multiple logistic regression models were used to explore the relationship between the metabolic phenotypes and vitamin D deficiency. We chose the mean arterial pressure, TG/HDL-C ratio, and hs-CRP level as covariates. Sex, age, and HOMA-IR were grouped variables; thus, they were not adjusted for. Neither were FBG and insulin levels adjusted for because they were highly correlated with HOMA-IR. Metabolic body composition was a variable of interest; therefore, BMI and waist-to-height ratio were not adjusted for. The LDL-C level was not adjusted for because of its collinearity with TC. All statistical analyses were conducted using International Business Machine (IBM) Statistical Product and Service Solutions Statistics (SPSS, IBM Corp., Armonk, NY, USA). Statistical significance was set at a P-value < 0.05.
A total of 6,655 participants were enrolled in this study. The main characteristics of the study participants, stratified by age (< 50 and ≥ 50 years), are shown in Table 1. In the < 50 years group (n = 2,589), the mean age and BMI of the male participants were slightly higher than that of the female participants. Mean arterial pressure (MAP), TC, TG, LDL-C, hs-CRP, insulin, and HOMA-IR were significantly higher in men than that in women (P < 0.001). The proportion of MHO and MUO were higher in men than that in women (30.2% vs. 13.0% and 17.3% vs. 4.0%, respectively). The prevalence of vitamin D deficiency was significantly higher in women than that in men (35.5% vs. 31.2%, P = 0.025; Table 1).
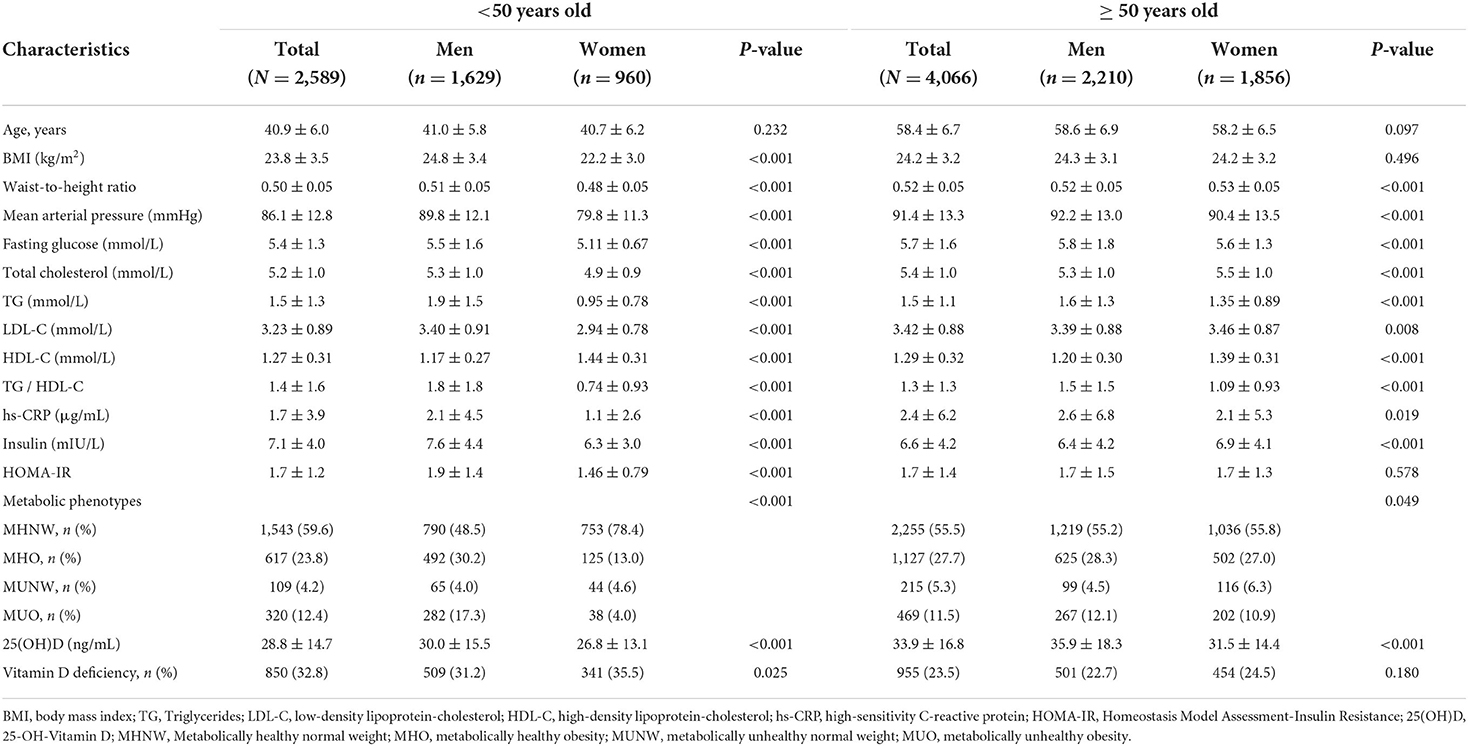
Table 1. Main characteristics of the participants by age and sex.
In the ≥ 50 years group (n = 4,066), the mean ± SD age of the participants was 58.6 ± 6.9 for men and 58.2 ± 6.5 for women. The mean ± SD BMI was 24.3 ± 3.1 for men and 24.2 ± 3.2 for women. No significant difference was observed in the mean ± SD age or BMI between men and women (Table 1).The MAP, FBG, TG, and hs-CRP levels were significantly higher in men than that in women, while TC, LDL-C, and insulin levels were significantly higher in women. HOMA-IR levels and vitamin D deficiency were not significantly different between the sexes. The proportion of MHO and MUO were higher in male than that in female. Vitamin D deficiency was observed in 22.7% of men and 24.5% of women, without a significant difference (P = 0.18).
The baseline characteristics of men according to metabolic phenotypes stratified by age are presented in Table 2. The male participants were classified into four groups: MHNW, MHO, MUNW, and MUO.
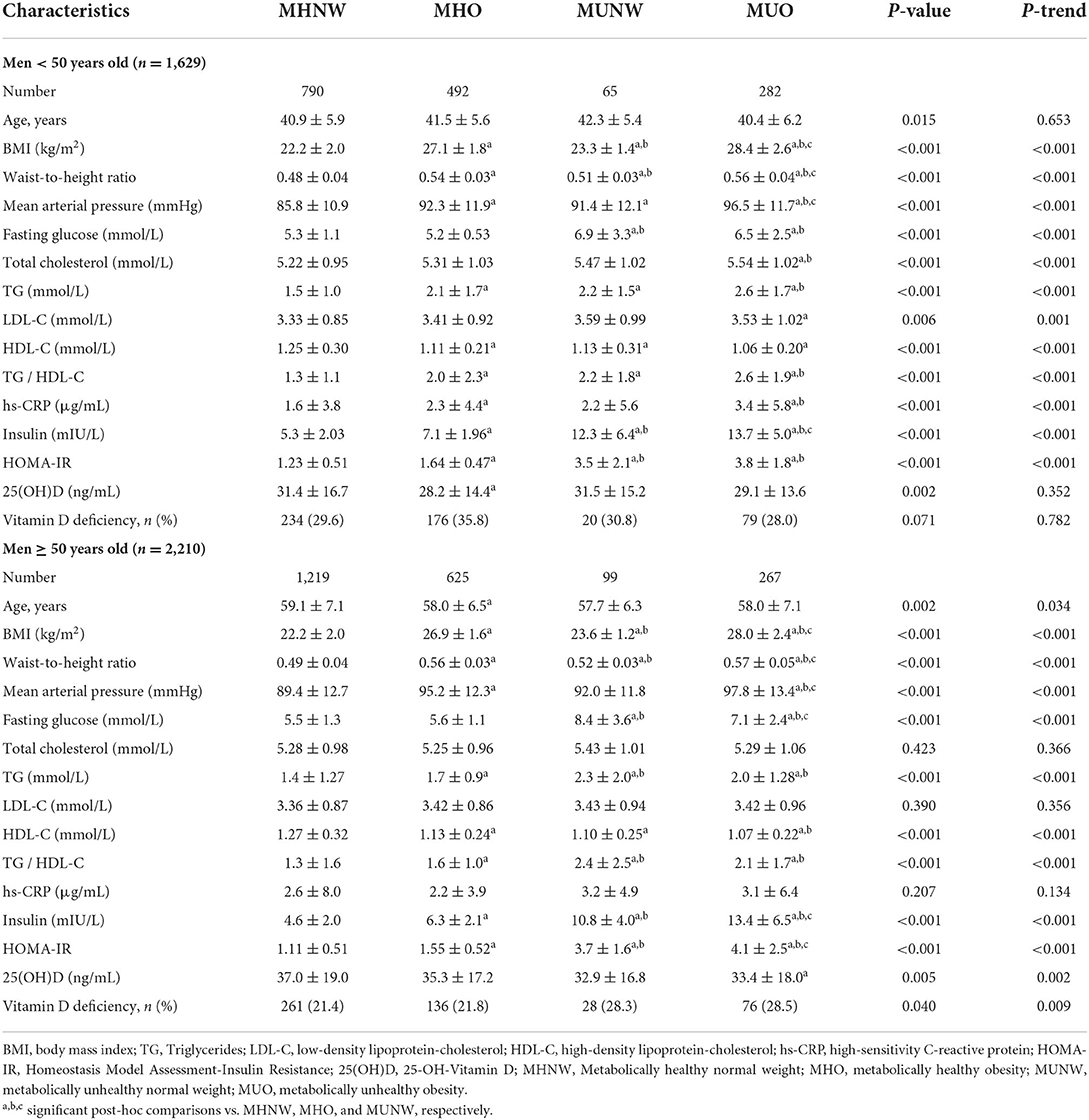
Table 2. Baseline characteristics of men according to metabolic phenotypes stratified by age.
Among the four metabolic groups of men aged < 50 years, there were significant incremental trends in TC, TG, insulin, and HOMA-IR levels. The MHO group had the lowest vitamin D level (28.2 ng/mL) and the highest prevalence of vitamin D deficiency (35.8%, Table 2).
Among men aged > 50 years, there was no significant difference in TC, LDL-C, and hs-CRP levels among the four groups. Individuals with MUNW had the highest FBG, TG, and TG/HDL-C levels. Insulin and HOMA-IR levels showed an incremental trend among the four groups. The percentage of vitamin D deficiency also showed an increasing trend among the four groups (P = 0.009, Table 2).
The women were classified into four groups: MHNW, MHO, MUNW, and MUO. Table 3 shows the characteristics of the women according to the four metabolic phenotypes stratified by age.

Table 3. Baseline characteristics of women according to metabolic phenotypes stratified by age.
Among the four metabolic groups of women aged < 50 years, the levels of metabolic biomarkers, including FBG, TC, TG, LDL-C, insulin, and HOMA-IR, showed significant incremental trends. The MUO group had the highest MAP level, lowest vitamin D level (22.8 ng/mL), and the highest prevalence of vitamin D deficiency (47.4%). However, there was no significant difference in vitamin D levels and prevalence of vitamin D deficiency among the four groups (P = 0.085 and P = 0.13, respectively, Table 3).
When considering women aged > 50 years, the MAP, TG, hs-CRP, insulin, and HOMA-IR levels showed significant incremental trends. However, TC and LDL-C levels were not significantly different among the four groups. The MUO group had the lowest vitamin D level (29.3 ng/mL) and the highest prevalence of vitamin D deficiency (29.2%). There was no significant difference in vitamin D levels and prevalence of vitamin D deficiency among the four groups (P = 0.091 and P = 0.066, respectively, Table 3).
The associations between the metabolic phenotypes and vitamin D deficiency are shown in Table 4. Compared with MHNW, the MHO group showed a higher odds ratio (OR) for vitamin D deficiency in men aged < 50 years, which remained statistically significant after adjusting for cardiometabolic factors, including MAP, TG/HDL-C, and hs-CRP [1.35, 95% confidence interval (CI) 1.05–1.73]. By contrast, in men aged > 50 years, the risk of vitamin D deficiency was greater in the MUO group (OR 1.44, 95% CI 1.05–1.97) followed by MUNW (OR 1.53, 95% CI 0.96–2.43, P = 0.076) with borderline significance in multivariable analysis compared with that of the MHNW group (Table 4).
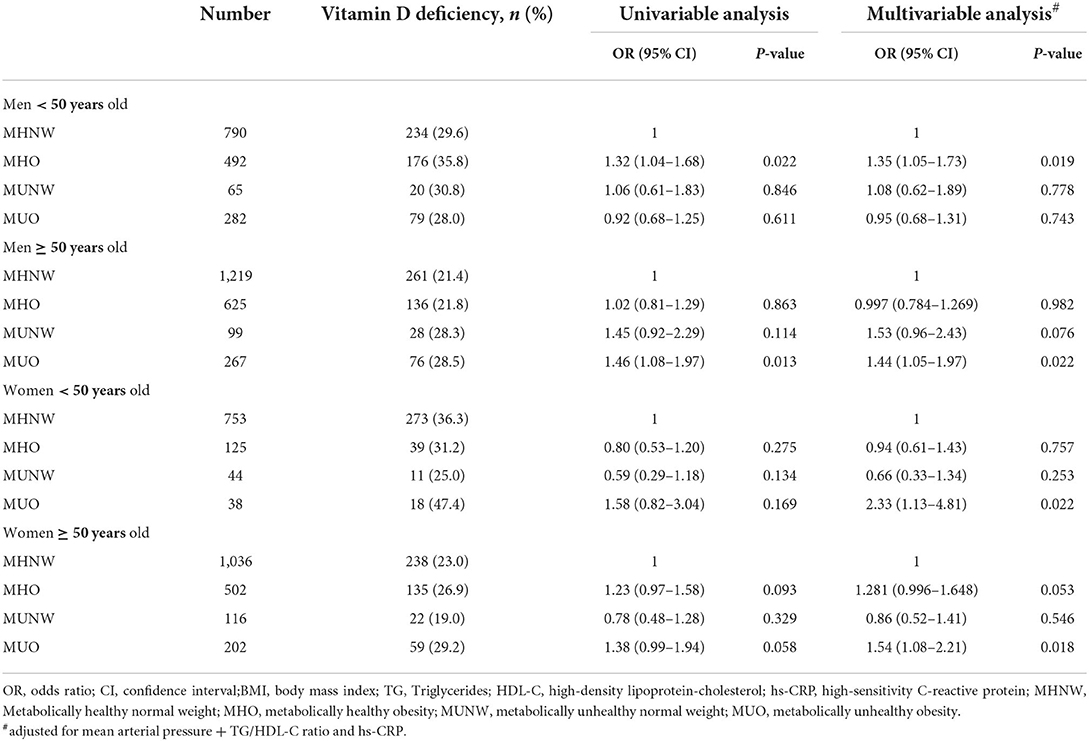
Table 4. Association between metabolic phenotypes and vitamin D deficiency stratified by age and sex.
In women aged < 50 years, the MUO group demonstrated the highest risk for vitamin D deficiency (OR 2.33, 95% CI 1.13–4.81) compared to the MHNW group after adjusting for MAP, TG/HDL-C, and hs-CRP levels. In women aged > 50 years, the MUO group demonstrated the highest risk for vitamin D deficiency (OR 1.54, 95% CI 1.08–2.21) followed by MHO (OR 1.28, 95% CI 0.996–1.648, P = 0.053) with borderline significance compared to that of the MHNW group in multivariable analysis.
Our logistic findings implied that in women of all ages and men aged > 50 years, MUO was associated with vitamin D deficiency. Among men aged < 50 years, MHO had the highest OR for vitamin D deficiency. Subcutaneous adipose tissue can store large amounts of fat-soluble vitamin D (57); thus, leading to less vitamin D entering the blood circulation. Greater subcutaneous fat in women, which is related to estrogen, has a greater influence on serum vitamin D concentration than visceral fat tissue (58). Among men aged < 50 years, metabolically unhealthy participants tended to have more visceral fat; the metabolically healthy obese group tended to have more subcutaneous fat, thus leading to the current findings. Lifestyle differences may also contribute to sex and age differences. Younger females generally work indoors and often intentionally avoid sunshine, whereas older male and female might take vitamin D supplements and have more time to engage in outdoor activities (59). To the best of our knowledge, this is a novel study demonstrating cardiovascular risk factors and vitamin D deficiency according to sex, age, and metabolic body composition status in a large Chinese population. The study results provide physicians with useful information regarding vitamin D deficiency and both age- and sex-specific intervention methods to decrease cardiometabolic risk.
A small population study found that obese individuals had significantly lower serum 25-hydroxy vitamin D (25[OH]D) levels than normal-weight participants, regardless of metabolic phenotypes (60). Patchaya et al. performed a retrospective chart review of outpatient medical records. Patients aged > 18 years with BMI > 30 kg/m2 were enrolled and divided into two groups: MHO and MUO. They found no significant differences in the 25(OH)D levels between individuals with MHO and MUO. In addition, there was a negative correlation between 25(OH)D levels and adiposity markers (BMI, body weight, and waist circumference), but not between 25(OH)D levels and lipid parameters or HOMA-IR (61). An Iranian population-based study found that 25(OH)D levels were lower in patients with MUO than in those with MHO. Reduced vitamin D concentrations were associated with cardiometabolic and inflammatory markers in MUO compared with MHO. This study did not find a correlation between serum 25(OH)D levels and BMI in obese participants, but it was negatively correlated with waist circumference. Adipose tissue distribution has been hypothesized to be associated with the bioavailability of 25(OH)D (62). Another cross-sectional study recruited 111 healthy adults without diabetes. After adjusting for age, sex, and body fat percentage, 25(OH)D was no longer associated with insulin sensitivity, 2 h glucose, or hs-CRP but remained associated with fasting glucose. The authors interpreted that the association between vitamin D and cardiometabolic risk among healthy adults without diabetes is largely mediated by adiposity (63).
The most commonly mentioned mechanisms explaining the low vitamin D level in individuals with obesity include (i) less sun exposure, (ii) negative feedback from an increased 1,25(OH)D concentration, (iii) sequestration of vitamin D within adipose tissue, and (iv) volumetric dilution resulting in lower 25(OH)D concentration (64).
We also found that for hs-CRP levels, in both sexes aged < 50 years, the highest value was observed in the MUO group, followed by the MHO group, with statistical significance. However, among men aged > 50 years, the MUNW group had the highest hs-CRP level, followed by the MUO group, without statistical significance. Among women aged > 50 years, the MUO group had the highest hs-CRP level, followed by the MUNW group (P for trend = 0.005). Hs-CRP, which represents inflammation status, is more influenced by obesity in the younger population, and it is more frequently correlated with metabolically unhealthy status in the older population.
Vitamin D affects adipogenesis, apoptosis, oxidative stress, inflammation, and lipid metabolism (65). Hypponen et al. reviewed the evidence of calcitriol-induced inhibition of many of the adverse effects of obesity. For example, calcitriol suppresses the secretion of pro-inflammatory cytokines, stimulates the secretion of anti-inflammatory cytokines from macrophage-infiltrated adipose tissue, and upregulates insulin growth factor 1 (IGF-1) secretion, which has protective effects against metabolic syndrome. Calcitriol also promotes insulin secretion from islet beta cells, suppresses the overactivity of the renin-angiotensin system in islets, and protects against apoptosis. In obesity-related dyslipidemia, calcitriol can reduce hepatic TG synthesis (66).
Some studies have demonstrated the effects of vitamin D supplementation. A 12-week randomized controlled trial revealed that improvement of vitamin D status in T2DM patients resulted in the amelioration of systemic inflammatory markers, such as hs-CRP and IL-6 (67). A recent meta-analysis demonstrated that vitamin D improves serum levels of TC, TG, and LDL in patients with T2DM (68). A case-control study that focused on men with spinal cord injury demonstrated that even a small increase in vitamin D intake may improve TC independent of lean mass. Vitamin D adjusted for total dietary intake, was positively correlated with carbohydrate profile parameters (69). Another Mendelian randomization study found that a 25 nmol/L higher concentration was associated with a 14% lower risk of T2DM (70). Wenclewska et al. found that among patients suffering from metabolic disturbances and T2DM, supplementation with 2,000 IU vitamin D for 3 months reduced the level of oxidative deoxyribonucleic acid (DNA) damage, HOMA-IR, and TG/HDL ratio (71).
Our study focused on a large Asian population, stratified by age and sex. We evaluated cardiometabolic biomarkers and the risk of vitamin D deficiency among the four metabolic phenotypes. We combined both HOMA-IR and metabolic syndrome criteria to define metabolic health or unhealthy status, which makes it more indicative of morbidity and mortality and provides relatively convincing results.
Nevertheless, this study has several limitations. First, the cross-sectional study design makes it impractical to establish causal relationships. Second, we did not record participants' lifestyles, including physical activity, sun exposure, dietary habits, and use of vitamin D supplements. Third, our study participants were relatively healthy or had better health awareness; therefore, they may not represent the general population. Further research is warranted to elucidate the potential protective or anti-inflammatory effects of vitamin D in different obesity phenotypes.
In conclusion, in a relatively healthy population, our data revealed that in women of all ages and men aged > 50 years, the MUO group had the highest OR for vitamin D deficiency. Among men aged < 50 years, the highest OR for vitamin D deficiency was observed in the MHO group. The inflammatory biomarker hs-CRP is more strongly correlated with obesity in younger adults, and it is more correlated with metabolically unhealthy status in older individuals.
The original contributions presented in the study are included in the article/supplementary material, further inquiries can be directed to the corresponding author.
The studies involving human participants were reviewed and approved by Institutional review board of Chang Gung Memorial Hospital. Written informed consent for participation was not required for this study in accordance with the national legislation and the institutional requirements.
Y-CC and W-CL conceived the study concept, design and contributed equally to this study. WY, H-YH, and X-JX were responsible for data collection. Y-CC drafted the manuscript. W-CL and J-YC interpreted the data. J-YC revised the final manuscript. All the authors approved the final version of the manuscript.
We would like to thank editage (https://Online.Editage.jp/) for english language editing.
The authors declare that the research was conducted in the absence of any commercial or financial relationships that could be construed as a potential conflict of interest.
All claims expressed in this article are solely those of the authors and do not necessarily represent those of their affiliated organizations, or those of the publisher, the editors and the reviewers. Any product that may be evaluated in this article, or claim that may be made by its manufacturer, is not guaranteed or endorsed by the publisher.
1. Tchernof A, Despres JP. Pathophysiology of human visceral obesity: an update. Physiol Rev. (2013) 93:359–404. doi: 10.1152/physrev.00033.2011
2. Ding C, Gao D, Wilding J, Trayhurn P, Bing C. Vitamin D signalling in adipose tissue. Br J Nutr. (2012) 108:1915–23. doi: 10.1017/S0007114512003285
3. Baker RG, Hayden MS, Ghosh S. NF-kappaB, inflammation, and metabolic disease. Cell Metab. (2011) 13:11–22. doi: 10.1016/j.cmet.2010.12.008
4. Wellen KE, Hotamisligil GS. Obesity-induced inflammatory changes in adipose tissue. J Clin Invest. (2003) 112:1785–8. doi: 10.1172/JCI20514
5. Berg AH, Scherer PE. Adipose tissue, inflammation, and cardiovascular disease. Circ Res. (2005) 96:939–49. doi: 10.1161/01.RES.0000163635.62927.34
6. Zhu S, Wang Z, Heshka S, Heo M, Faith MS, Heymsfield SB. Waist circumference and obesity-associated risk factors among whites in the third national health and nutrition examination survey: clinical action thresholds. Am J Clin Nutr. (2002) 76:743–9. doi: 10.1093/ajcn/76.4.743
7. Janssen I, Katzmarzyk PT, Ross R. Waist circumference and not body mass index explains obesity-related health risk. Am J Clin Nutr. (2004) 79:379–84. doi: 10.1093/ajcn/79.3.379
8. Gomez-Ambrosi J, Silva C, Galofre JC, Escalada J, Santos S, Millan D, et al. Body mass index classification misses subjects with increased cardiometabolic risk factors related to elevated adiposity. Int J Obes. (2012) 36:286–94. doi: 10.1038/ijo.2011.100
9. Stefan N, Haring HU, Hu FB, Schulze MB. Metabolically healthy obesity: epidemiology, mechanisms, and clinical implications. Lancet Diabetes Endocrinol. (2013) 1:152–62. doi: 10.1016/S2213-8587(13)70062-7
10. Mangge H, Zelzer S, Puerstner P, Schnedl WJ, Reeves G, Postolache TT, et al. Uric acid best predicts metabolically unhealthy obesity with increased cardiovascular risk in youth and adults. Obesity. (2013) 21:E71–7. doi: 10.1002/oby.20061
11. Primeau V, Coderre L, Karelis AD, Brochu M, Lavoie ME, Messier V, et al. Characterizing the profile of obese patients who are metabolically healthy. Int J Obes. (2011) 35:971–81. doi: 10.1038/ijo.2010.216
12. Karelis AD, Faraj M, Bastard JP, St-Pierre DH, Brochu M, Prud'homme D, et al. The metabolically healthy but obese individual presents a favorable inflammation profile. J Clin Endocrinol Metab. (2005) 90:4145–50. doi: 10.1210/jc.2005-0482
13. Marques-Vidal P, Velho S, Waterworth D, Waeber G, von Kanel R, Vollenweider P. The association between inflammatory biomarkers and metabolically healthy obesity depends of the definition used. Eur J Clin Nutr. (2012) 66:426–35. doi: 10.1038/ejcn.2011.170
14. Messier V, Karelis AD, Robillard ME, Bellefeuille P, Brochu M, Lavoie JM, et al. Metabolically healthy but obese individuals: relationship with hepatic enzymes. Metabolism. (2010) 59:20–4. doi: 10.1016/j.metabol.2009.06.020
15. Meigs JB, Wilson PW, Fox CS, Vasan RS, Nathan DM, Sullivan LM, et al. Body mass index, metabolic syndrome, and risk of type 2 diabetes or cardiovascular disease. J Clin Endocrinol Metab. (2006) 91:2906–12. doi: 10.1210/jc.2006-0594
16. Marini MA, Succurro E, Frontoni S, Hribal ML, Andreozzi F, Lauro R, et al. Metabolically healthy but obese women have an intermediate cardiovascular risk profile between healthy nonobese women and obese insulin-resistant women. Diabetes Care. (2007) 30:2145–7. doi: 10.2337/dc07-0419
17. Naukkarinen J, Heinonen S, Hakkarainen A, Lundbom J, Vuolteenaho K, Saarinen L, et al. Characterising metabolically healthy obesity in weight-discordant monozygotic twins. Diabetologia. (2014) 57:167–76. doi: 10.1007/s00125-013-3066-y
18. Fruhbeck G, Gomez-Ambrosi J, Salvador J. Leptin-induced lipolysis opposes the tonic inhibition of endogenous adenosine in white adipocytes. FASEB J. (2001) 15:333–40. doi: 10.1096/fj.00-0249com
19. Ruderman NB, Schneider SH, Berchtold P. The “metabolically-obese,” normal-weight individual. Am J Clin Nutr. (1981) 34:1617–21. doi: 10.1093/ajcn/34.8.1617
20. Ruderman N, Chisholm D, Pi-Sunyer X, Schneider S. The metabolically obese, normal-weight individual revisited. Diabetes. (1998) 47:699–713. doi: 10.2337/diabetes.47.5.699
21. Ding C, Chan Z, Magkos F. Lean, but not healthy: the 'metabolically obese, normal-weight' phenotype. Curr Opin Clin Nutr Metab Care. (2016) 19:408–17. doi: 10.1097/MCO.0000000000000317
22. Oliveros E, Somers VK, Sochor O, Goel K, Lopez-Jimenez F. The concept of normal weight obesity. Prog Cardiovasc Dis. (2014) 56:426–33. doi: 10.1016/j.pcad.2013.10.003
23. Dvorak RV, DeNino WF, Ades PA, Poehlman ET. Phenotypic characteristics associated with insulin resistance in metabolically obese but normal-weight young women. Diabetes. (1999) 48:2210–4. doi: 10.2337/diabetes.48.11.2210
24. Katsuki A, Sumida Y, Urakawa H, Gabazza EC, Murashima S, Maruyama N, et al. Increased visceral fat and serum levels of triglyceride are associated with insulin resistance in Japanese metabolically obese, normal weight subjects with normal glucose tolerance. Diabetes Care. (2003) 26:2341–4. doi: 10.2337/diacare.26.8.2341
25. Conus F, Allison DB, Rabasa-Lhoret R, St-Onge M, St-Pierre DH, Tremblay-Lebeau A, et al. Metabolic and behavioral characteristics of metabolically obese but normal-weight women. J Clin Endocrinol Metab. (2004) 89:5013–20. doi: 10.1210/jc.2004-0265
27. Zittermann A. Vitamin D and disease prevention with special reference to cardiovascular disease. Prog Biophys Mol Biol. (2006) 92:39–48. doi: 10.1016/j.pbiomolbio.2006.02.001
28. Rostand SG. Ultraviolet light may contribute to geographic and racial blood pressure differences. Hypertension. (1997) 30:150–6. doi: 10.1161/01.HYP.30.2.150
29. Scragg R, Holdaway I, Singh V, Metcalf P, Baker J, Dryson E. Serum 25-hydroxyvitamin D3 levels decreased in impaired glucose tolerance and diabetes mellitus. Diabetes Res Clin Pract. (1995) 27:181–8. doi: 10.1016/0168-8227(95)01040-K
30. Chiu KC, Chu A, Go VL, Saad MF. Hypovitaminosis D is associated with insulin resistance and beta cell dysfunction. Am J Clin Nutr. (2004) 79:820–5. doi: 10.1093/ajcn/79.5.820
31. Michos ED, Melamed ML. Vitamin D and cardiovascular disease risk. Curr Opin Clin Nutr Metab Care. (2008) 11:7–12. doi: 10.1097/MCO.0b013e3282f2f4dd
32. Nemerovski CW, Dorsch MP, Simpson RU, Bone HG, Aaronson KD, Bleske BE. Vitamin D and cardiovascular disease. Pharmacotherapy. (2009) 29:691–708. doi: 10.1592/phco.29.6.691
33. Brenner DR, Arora P, Garcia-Bailo B, Wolever TM, Morrison H, El-Sohemy A, et al. Plasma vitamin D levels and risk of metabolic syndrome in Canadians. Clin Invest Med. (2011) 34:E377. doi: 10.25011/cim.v34i6.15899
34. Ford ES, Ajani UA, McGuire LC, Liu S. Concentrations of serum vitamin D and the metabolic syndrome among US adults. Diabetes Care. (2005) 28:1228–30. doi: 10.2337/diacare.28.5.1228
35. Cheng S, Massaro JM, Fox CS, Larson MG, Keyes MJ, McCabe EL, et al. Adiposity, cardiometabolic risk, and vitamin D status: the framingham heart study. Diabetes. (2010) 59:242–8. doi: 10.2337/db09-1011
36. Gholami F, Moradi G, Zareei B, Rasouli MA, Nikkhoo B, Roshani D, et al. The association between circulating 25-hydroxyvitamin D and cardiovascular diseases: a meta-analysis of prospective cohort studies. BMC Cardiovasc Disord. (2019) 19:248. doi: 10.1186/s12872-019-1236-7
37. Karhapaa P, Pihlajamaki J, Porsti I, Kastarinen M, Mustonen J, Niemela O, et al. Diverse associations of 25-hydroxyvitamin D and 1,25-dihydroxy-vitamin D with dyslipidaemias. J Intern Med. (2010) 268:604–10. doi: 10.1111/j.1365-2796.2010.02279.x
38. Demay MB. Mechanism of vitamin D receptor action. Ann N Y Acad Sci. (2006) 1068:204–13. doi: 10.1196/annals.1346.026
39. Ferder M, Inserra F, Manucha W, Ferder L. The world pandemic of vitamin D deficiency could possibly be explained by cellular inflammatory response activity induced by the renin-angiotensin system. Am J Physiol Cell Physiol. (2013) 304:C1027–39. doi: 10.1152/ajpcell.00403.2011
40. Abbas MA. Physiological functions of Vitamin D in adipose tissue. J Steroid Biochem Mol Biol. (2017) 165:369–81. doi: 10.1016/j.jsbmb.2016.08.004
41. Zemel MB, Sun X. Calcitriol and energy metabolism. Nutr Rev. (2008) 66:S139–46. doi: 10.1111/j.1753-4887.2008.00099.x
42. Goldner WS, Stoner JA, Thompson J, Taylor K, Larson L, Erickson J, et al. Prevalence of vitamin D insufficiency and deficiency in morbidly obese patients: a comparison with non-obese controls. Obes Surg. (2008) 18:145–50. doi: 10.1007/s11695-007-9315-8
43. Parikh SJ, Edelman M, Uwaifo GI, Freedman RJ, Semega-Janneh M, Reynolds J, et al. The relationship between obesity and serum 1,25-dihydroxy vitamin D concentrations in healthy adults. J Clin Endocrinol Metab. (2004) 89:1196–9. doi: 10.1210/jc.2003-031398
44. Botella-Carretero JI, Alvarez-Blasco F, Villafruela JJ, Balsa JA, Vazquez C, Escobar-Morreale HF. Vitamin D deficiency is associated with the metabolic syndrome in morbid obesity. Clin Nutr. (2007) 26:573–80. doi: 10.1016/j.clnu.2007.05.009
45. Konradsen S, Ag H, Lindberg F, Hexeberg S, Jorde R. Serum 1,25-dihydroxy vitamin D is inversely associated with body mass index. Eur J Nutr. (2008) 47:87–91. doi: 10.1007/s00394-008-0700-4
46. Jorde R, Sneve M, Emaus N, Figenschau Y, Grimnes G. Cross-sectional and longitudinal relation between serum 25-hydroxyvitamin D and body mass index: the tromso study. Eur J Nutr. (2010) 49:401–7. doi: 10.1007/s00394-010-0098-7
47. Wortsman J, Matsuoka LY, Chen TC, Lu Z, Holick MF. Decreased bioavailability of vitamin D in obesity. Am J Clin Nutr. (2000) 72:690–3. doi: 10.1093/ajcn/72.3.690
48. Blum M, Dolnikowski G, Seyoum E, Harris SS, Booth SL, Peterson J, et al. Vitamin D(3) in fat tissue. Endocrine. (2008) 33:90–4. doi: 10.1007/s12020-008-9051-4
49. Kayaniyil S, Retnakaran R, Harris SB, Vieth R, Knight JA, Gerstein HC, et al. Prospective associations of vitamin D with beta-cell function and glycemia: the PROspective Metabolism and ISlet cell Evaluation (PROMISE) cohort study. Diabetes. (2011) 60:2947–53. doi: 10.2337/db11-0465
50. Gannage-Yared MH, Chedid R, Khalife S, Azzi E, Zoghbi F, Halaby G. Vitamin D in relation to metabolic risk factors, insulin sensitivity and adiponectin in a young Middle-Eastern population. Eur J Endocrinol. (2009) 160:965–71. doi: 10.1530/EJE-08-0952
51. Kayaniyil S, Vieth R, Retnakaran R, Knight JA, Qi Y, Gerstein HC, et al. Association of vitamin D with insulin resistance and beta-cell dysfunction in subjects at risk for type 2 diabetes. Diabetes Care. (2010) 33:1379–81. doi: 10.2337/dc09-2321
52. Liu E, Meigs JB, Pittas AG, McKeown NM, Economos CD, Booth SL, et al. Plasma 25-hydroxyvitamin d is associated with markers of the insulin resistant phenotype in nondiabetic adults. J Nutr. (2009) 139:329–34. doi: 10.3945/jn.108.093831
53. Zhao G, Ford ES, Li C. Associations of serum concentrations of 25-hydroxyvitamin D and parathyroid hormone with surrogate markers of insulin resistance among US adults without physician-diagnosed diabetes: NHANES, 2003–2006. Diabetes Care. (2010) 33:344–7. doi: 10.2337/dc09-0924
54. Sung CC, Liao MT, Lu KC, Wu CC. Role of vitamin D in insulin resistance. J Biomed Biotechnol. (2012) 2012:634195. doi: 10.1155/2012/634195
55. Chacko SA, Song Y, Manson JE, Van Horn L, Eaton C, Martin LW, et al. Serum 25-hydroxyvitamin D concentrations in relation to cardiometabolic risk factors and metabolic syndrome in postmenopausal women. Am J Clin Nutr. (2011) 94:209–17. doi: 10.3945/ajcn.110.010272
56. Holick MF, Binkley NC, Bischoff-Ferrari HA, Gordon CM, Hanley DA, Heaney RP, et al. Evaluation, treatment, and prevention of vitamin D deficiency: an Endocrine Society clinical practice guideline. J Clin Endocrinol Metab. (2011) 96:1911–30. doi: 10.1210/jc.2011-0385
57. Didriksen A, Burild A, Jakobsen J, Fuskevag OM, Jorde R. Vitamin D3 increases in abdominal subcutaneous fat tissue after supplementation with vitamin D3. Eur J Endocrinol. (2015) 172:235–41. doi: 10.1530/EJE-14-0870
58. Janssen HC, Emmelot-Vonk MH, Verhaar HJ, van der Schouw YT. Determinants of vitamin D status in healthy men and women aged 40-80 years. Maturitas. (2013) 74:79–83. doi: 10.1016/j.maturitas.2012.10.008
59. Yan X, Zhang N, Cheng S, Wang Z, Qin Y. Gender differences in Vitamin D status in China. Med Sci Monit. (2019) 25:7094–9. doi: 10.12659/MSM.916326
60. Lamendola CA, Ariel D, Feldman D, Reaven GM. Relations between obesity, insulin resistance, and 25-hydroxyvitamin D. Am J Clin Nutr. (2012) 95:1055–9. doi: 10.3945/ajcn.111.032060
61. Boonchaya-anant P, Holick MF, Apovian CM. Serum 25-hydroxyvitamin D levels and metabolic health status in extremely obese individuals. Obesity. (2014) 22:2539–43. doi: 10.1002/oby.20877
62. Esteghamati A, Aryan Z, Esteghamati A, Nakhjavani M. Differences in vitamin D concentration between metabolically healthy and unhealthy obese adults: associations with inflammatory and cardiometabolic markers in 4391 subjects. Diabetes Metab. (2014) 40:347–55. doi: 10.1016/j.diabet.2014.02.007
63. Mousa A, Naderpoor N, de Courten MPJ, Scragg R, de Courten B. 25-hydroxyvitamin D is associated with adiposity and cardiometabolic risk factors in a predominantly vitamin D-deficient and overweight/obese but otherwise healthy cohort. J Steroid Biochem Mol Biol. (2017) 173:258–64. doi: 10.1016/j.jsbmb.2016.12.008
64. Pourshahidi LK. Vitamin D and obesity: current perspectives and future directions. Proc Nutr Soc. (2015) 74:115–24. doi: 10.1017/S0029665114001578
65. Szymczak-Pajor I, Miazek K, Selmi A, Balcerczyk A, Sliwinska A. The action of vitamin D in Adipose tissue: is there the link between vitamin D deficiency and adipose tissue-related metabolic disorders? Int J Mol Sci. (2022) 23:956. doi: 10.3390/ijms23020956
66. Hypponen E, Boucher BJ. Adiposity, vitamin D requirements, and clinical implications for obesity-related metabolic abnormalities. Nutr Rev. (2018) 76:678–92. doi: 10.1093/nutrit/nuy034
67. Shab-Bidar S, Neyestani TR, Djazayery A, Eshraghian MR, Houshiarrad A, Kalayi A, et al. Improvement of vitamin D status resulted in amelioration of biomarkers of systemic inflammation in the subjects with type 2 diabetes. Diabetes Metab Res Rev. (2012) 28:424–30. doi: 10.1002/dmrr.2290
68. Jafari T, Fallah AA, Barani A. Effects of vitamin D on serum lipid profile in patients with type 2 diabetes: a meta-analysis of randomized controlled trials. Clin Nutr. (2016) 35:1259–68. doi: 10.1016/j.clnu.2016.03.001
69. Beal C, Gorgey A, Moore P, Wong N, Adler RA, Gater D. Higher dietary intake of vitamin D may influence total cholesterol and carbohydrate profile independent of body composition in men with chronic spinal cord injury. J Spinal Cord Med. (2018) 41:459–70. doi: 10.1080/10790268.2017.1361561
70. Lu L, Bennett DA, Millwood IY, Parish S, McCarthy MI, Mahajan A, et al. Association of vitamin D with risk of type 2 diabetes: a Mendelian randomisation study in European and Chinese adults. PLoS Med. (2018) 15:e1002566. doi: 10.1371/journal.pmed.1002566
Keywords: metabolic body composition, obesity, vitamin D deficiency, inflammatory marker, cardiometabolic marker
Citation: Chen Y-C, Li W-C, Ke P-H, Chen I-C, Yu W, Huang H-Y, Xiong X-J and Chen J-Y (2022) Association between metabolic body composition status and vitamin D deficiency: A cross-sectional study. Front. Nutr. 9:940183. doi: 10.3389/fnut.2022.940183
Received: 10 May 2022; Accepted: 08 July 2022;
Published: 28 July 2022.
Edited by:
Marija Djekic Ivankovic, McGill University, CanadaReviewed by:
Ashraf S. Gorgey, United States Department of Veterans Affairs, United StatesCopyright © 2022 Chen, Li, Ke, Chen, Yu, Huang, Xiong and Chen. This is an open-access article distributed under the terms of the Creative Commons Attribution License (CC BY). The use, distribution or reproduction in other forums is permitted, provided the original author(s) and the copyright owner(s) are credited and that the original publication in this journal is cited, in accordance with accepted academic practice. No use, distribution or reproduction is permitted which does not comply with these terms.
*Correspondence: Jau-Yuan Chen, d2VsaW5zQGNnbWgub3JnLnR3
†These authors have contributed equally to this work and share first authorship
Disclaimer: All claims expressed in this article are solely those of the authors and do not necessarily represent those of their affiliated organizations, or those of the publisher, the editors and the reviewers. Any product that may be evaluated in this article or claim that may be made by its manufacturer is not guaranteed or endorsed by the publisher.
Research integrity at Frontiers
Learn more about the work of our research integrity team to safeguard the quality of each article we publish.