 Fangkai Han
 Li Ming1
 Joshua H. Aheto
 Xingyi Huang
94% of researchers rate our articles as excellent or good
Learn more about the work of our research integrity team to safeguard the quality of each article we publish.
Find out more
ORIGINAL RESEARCH article
Front. Nutr., 26 October 2022
Sec. Food Chemistry
Volume 9 - 2022 | https://doi.org/10.3389/fnut.2022.935099
This article is part of the Research TopicSpectroscopic Applications for Quality Profiling and Authentication of Food ProductsView all 5 articles
This work aims to investigate a feasible and practical technique for the authentication of edible animal blood food (EABF) using Fourier transform near-infrared (FT-NIR) coupled with fast chemometrics. A total of 540 samples were used, including raw duck blood tofu (DBT), cow blood-based gel (CBG), pig blood-based gel (PBG), and DBT binary and ternary adulterated with CBG and PBG. The protein, fat, total sugar, and 16 kinds of amino acids were measured to validate the difference in basic organic matters among EABFs according to species. Fisher linear discriminate analysis (Fisher LDA) and extreme learning machine (ELM) were implemented comparatively to identify the adulterated EABF. To predict adulteration levels, four extreme learning machine regression (ELMR) models were constructed and optimized. Results showed that, by analyzing 27 crucial spectral variables, the ELM model provides higher accuracy of 93.89% than Fisher LDA for the independent samples. All the correlation coefficients of the optimized ELMR models’ training and prediction sets were better than 0.94, the root mean square errors were all less than 3.5%, and the residual prediction deviation and the range error ratios were all higher than 4.0 and 12.0, respectively. In conclusion, the FT-NIR paired with ELM have great potential in authenticating the EABF. This work presents amino acids content in EABFs for the first time and built tracing models for rapid authentication of DBT, which can be used to manage the EABF market, thereby preventing illegal adulteration and unfair competition.
Animal blood is an excellent source of high-biological value proteins, essential minerals, and vitamins (1). The global consensus has concluded that using animal blood in foods helps in reducing the loss of valuable nutrition sources and prevents environmental pollution in the meat industry. Compared to advanced biological treatments, such as protein extraction from animal blood via membrane technology (2), the high-cost animal blood food, known as “blood tofu,” obtained through simple thermal processes, is widely distributed in supermarkets and restaurants in China. There are, however, differences in the types of animal blood that are suitable for making blood tofu. Compared to other commonly consumed animal blood, duck blood was more delicate and delicious (3). Therefore, in China’s domestic market, the price of duck blood is usually higher than that of cow blood or pork blood (4).
Although only a few scientific papers have addressed the issue of animal blood adulteration, it is clear from media reports and administrative punishment cases that the high-economic value of duck blood tofu (DBT) being adulterated or replaced with other low-cost animal blood remains a serious issue (3). Food frauds result in insignificant economic losses for businesses and governments, destroying brands and devaluing the market value of affected products (5). Moreover, with the advancement of novel food processing technology, it is becoming increasingly difficult to discern the authenticity of DBT by its appearances or textures. Therefore, there is an urgent need for an effective and practical technique for determining the DBT’s authenticity to promote fair trade and protect consumers’ rights.
Until now, DNA-based technology has demonstrated a high potential for determining the authenticity of animal blood. Sasimanas Unajak and co-workers developed an interspecies-specific multiplex-PCR assay using dried blood as an alternative DNA source to classify four commercial animal species: chicken, pig, cow, and crocodile (6). Yasser Said El-Sayed and co-authors researched DNA markers for detecting and discriminating human, cattle, buffalo, horse, sheep, pig, dog, cat, and chicken blood samples using a species-specific PCR method (7). Although the DNA-based technique is accurate, it suffers from several setbacks, such as DNA degradation and insufficient quantitative analysis (3). Gregory McLaughlin’s work showed that Raman spectroscopy could be effectively applied as a non-destructive technique for differentiating human blood stains from abroad range of animal blood stains, including cow, pig, chicken, etc. (8). Raman spectra provide information about the laser scattering characteristics of food surface substances. The detection depth is a vital obstacle to its practical application, as different depths of the DBT may contain varying amounts of adulteration. Recently, species-specific peptide markers of several animal blood samples were discovered and investigated for species identification using ultraperformance liquid chromatography in combination with the triple quadrupole mass spectrometry technique (3). However, this technique is a problematic practice due to the cumbersome measurement procedures, false positives due to sample contamination, and other drawbacks (4).
Fourier transform near-infrared spectroscopy is a promising green analytical technique presented with the following characteristics: rapid, convenient, non-destructive, and reliable (9). It has been widely used to develop methods for the authentication of animal source foods (10), with a particular emphasis on meat adulteration, for example, detection of pork adulteration in veal products (11), analysis of the minced lamb and beef fraud (12), chicken meat authenticity (13), quantitative detection of binary and ternary adulteration of minced beef with pork and duck meat (14), quantification of pork meat in other meats (15), and quantification of beef, pork, and chicken in ground meat (16), to name but a few. To our knowledge, however, the utilization of FT-NIR to test the authenticity of animal blood food has not been reported.
Hence, the present work attempts to develop a practical technique for the authentication of the DBT binary and ternary adulterated with cow and pig blood-based gel using FT-NIR with fast chemometrics models constructed, thereby preventing illegal adulteration and unfair competition.
Commercialized raw DBT was obtained from Henan Huaying Agricultural Development Co. Ltd. (the largest stockholder of the Chinese duck industry). Fresh cow and pig blood were purchased from a local slaughterhouse in Suzhou, China. After natural sedimentation, the cow and pig blood were sterilized for 40 min at 100°C to prepare blood gels, namely cow blood-based gel (CBG) and pig blood-based gel (PBG). All samples were homogenized and then frozen and kept at a temperature of -20°C for measurements.
A total of 540 samples were prepared and used, including 30 samples each of raw DBT, pure CBG, and PBG; 300 samples for adulterated binary DBT samples, in which the DBT was separately mixed with the CBG and PBG in a range of 10–50% by weight at 10% steps, and 30 samples on each adulteration level; 150 samples for the ternary adulterated DBT samples, in which the DBT was together mixed with CBG and PBG, in range of 10–50% by weight at 10% increments with equal amounts of CBG and PBG, and 30 samples on each adulteration level. The samples prepared and used are summarized in Table 1.
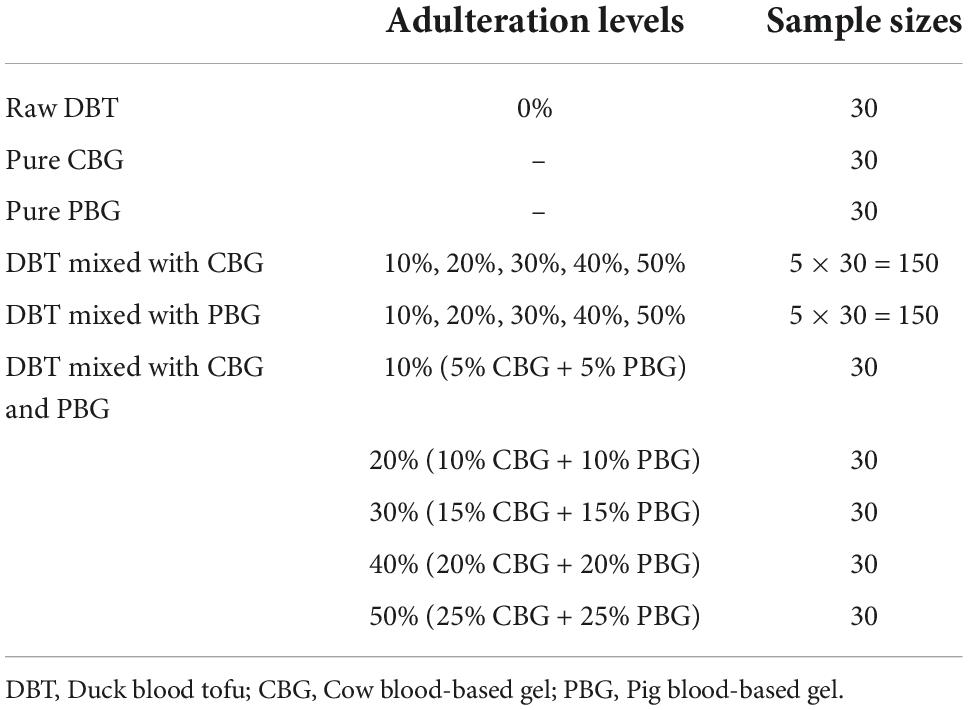
Table 1. Samples prepared and utilized.
The Kjeldahl method (GB 5009.5-2016) was used for the crude protein analysis; the Soxhlet extractor method (GB 5009.6-2016) was utilized to determine fat content in EABF samples; the Phenol-Sulfate spectrophotometry (GB/T 9695.31-2008) was applied for total sugar analysis, and the ion-exchange chromatography with post-column derivatization of ninhydrin (GB 5009.124-2016) was performed for amino acids analysis.
The Antaris II Near Infrared Spectrophotometer (ThermoElectron Company, USA) was employed to research the FT-NIR diffuse reflectance spectroscopy analysis. Due to the optical fiber used, it is possible to separate the spectrometer from the measurement location over several meters. Thus, industrial installations with a high degree of flexibility and complete automation are possible (11). The sample was collected separately into a standard cup and scanned three times with a spectral resolution of 8.0 cm–1 at different points. Each spectrum consisted of an average of 32 scans ranging from 4,000 to 10,000 cm–1, resulting in a total of 1,557 variables for each sample (17). Chemometrics was performed using the average of the three spectra collected from one sample (18).
Chemometric models were constructed and optimized for authentication of the animal blood food by analysis of FT-NIR datasets.
The first derivative (1st Der), second derivative (2nd Der), centralization, standard normal variate transform (SNV), and multivariate scattering correction (MSC) (19) separately paired with stepwise discriminant analysis (SWDA) (20) were used in comparison for spectra denoising and screening of the crucial spectral wavenumbers to identify the adulterated DBT.
Then, Fisher linear discriminant analysis (Fisher LDA) and non-linear algorithm, namely extreme learning machine (ELM) were utilized comparatively for modeling to identify adulterated DBT mixtures. ELM is selected because of its extremely fast learning speed, satisfactory generalization performance, and simple neural network structure (10). ELM theory for tasks of recognition and regression can be found in the literature by Pro. Guangbin Huang (21, 22).
The Fisher LDA and ELM models were evaluated for their performance in identifying DBT binary and ternary mixtures adulterated with cow and pig blood-based gels shown in Eq. (1).
Where R means the prediction accuracy (%) of the training or test set; N1 means the number of correctly classified samples; N2 means the number of all samples in the training or test set.
According to the conventional detection procedures of FT-NIR for food adulteration, when the identification task of adulterated blood food is completed, the next step is to quantitatively predict the adulteration level. Similarly, the 1st Der, 2nd Der, centralization, SNV, and MSC separately paired with competitive adaptive reweighted sampling methods (CARS) (23) were used in comparison for spectra denoising and screening of the crucial spectral wavenumbers to predict the adulteration level. Extreme learning machine regression (ELMR) models were constructed and optimized for the task of predicting adulteration levels.
The root mean square error (RMSE) in the training set (RMSEt) and prediction set (RMSEp), the correlation coefficients (r) in training set (rt), prediction set (rp), the residual prediction deviation (RPD), and the range error ratio (RER) were used to evaluate ELM regression models’ performance. The RMSE, r, RPD, and RER were calculated with the following formulas:
where n means the sample size of the training or prediction set, yi means the actual adulteration level of the ith sample, and means the predicted adulteration level of the ith sample (24).
where, means the average value of the actual adulteration levels of the samples in the training or prediction set (24).
where Std. means the standard deviation of the reference values for the training set samples. An RPD above 3 is considered satisfactory; a value of 5 or higher indicates that the established model can be used for quality control. Prediction models with an RPD value of 2–3 are considered to perform well enough for fast screening analysis (25).
where, Max and Min mean the maximum and the minimum values observed in the reference data (26), e.g., the adulteration levels. RER above 10 is roughly an indicator of a model with good predictive ability (27).
All algorithms were implemented in Matlab Version 7.14 (Mathworks, Natick, USA) with windows 10.
Protein, fat, and total sugars were determined to validate the difference in basic organic matters among raw DBT, pure CBG, and PBG used in this study. Results are shown in Table 2. It was found that the fat content in DBT and PBG was significantly lower than that in CBG; the total sugars content in DBT and CBG was similar, but both significantly lower than that in PBG; the protein content in PBG was the highest, while the protein content in CBG was the lowest.
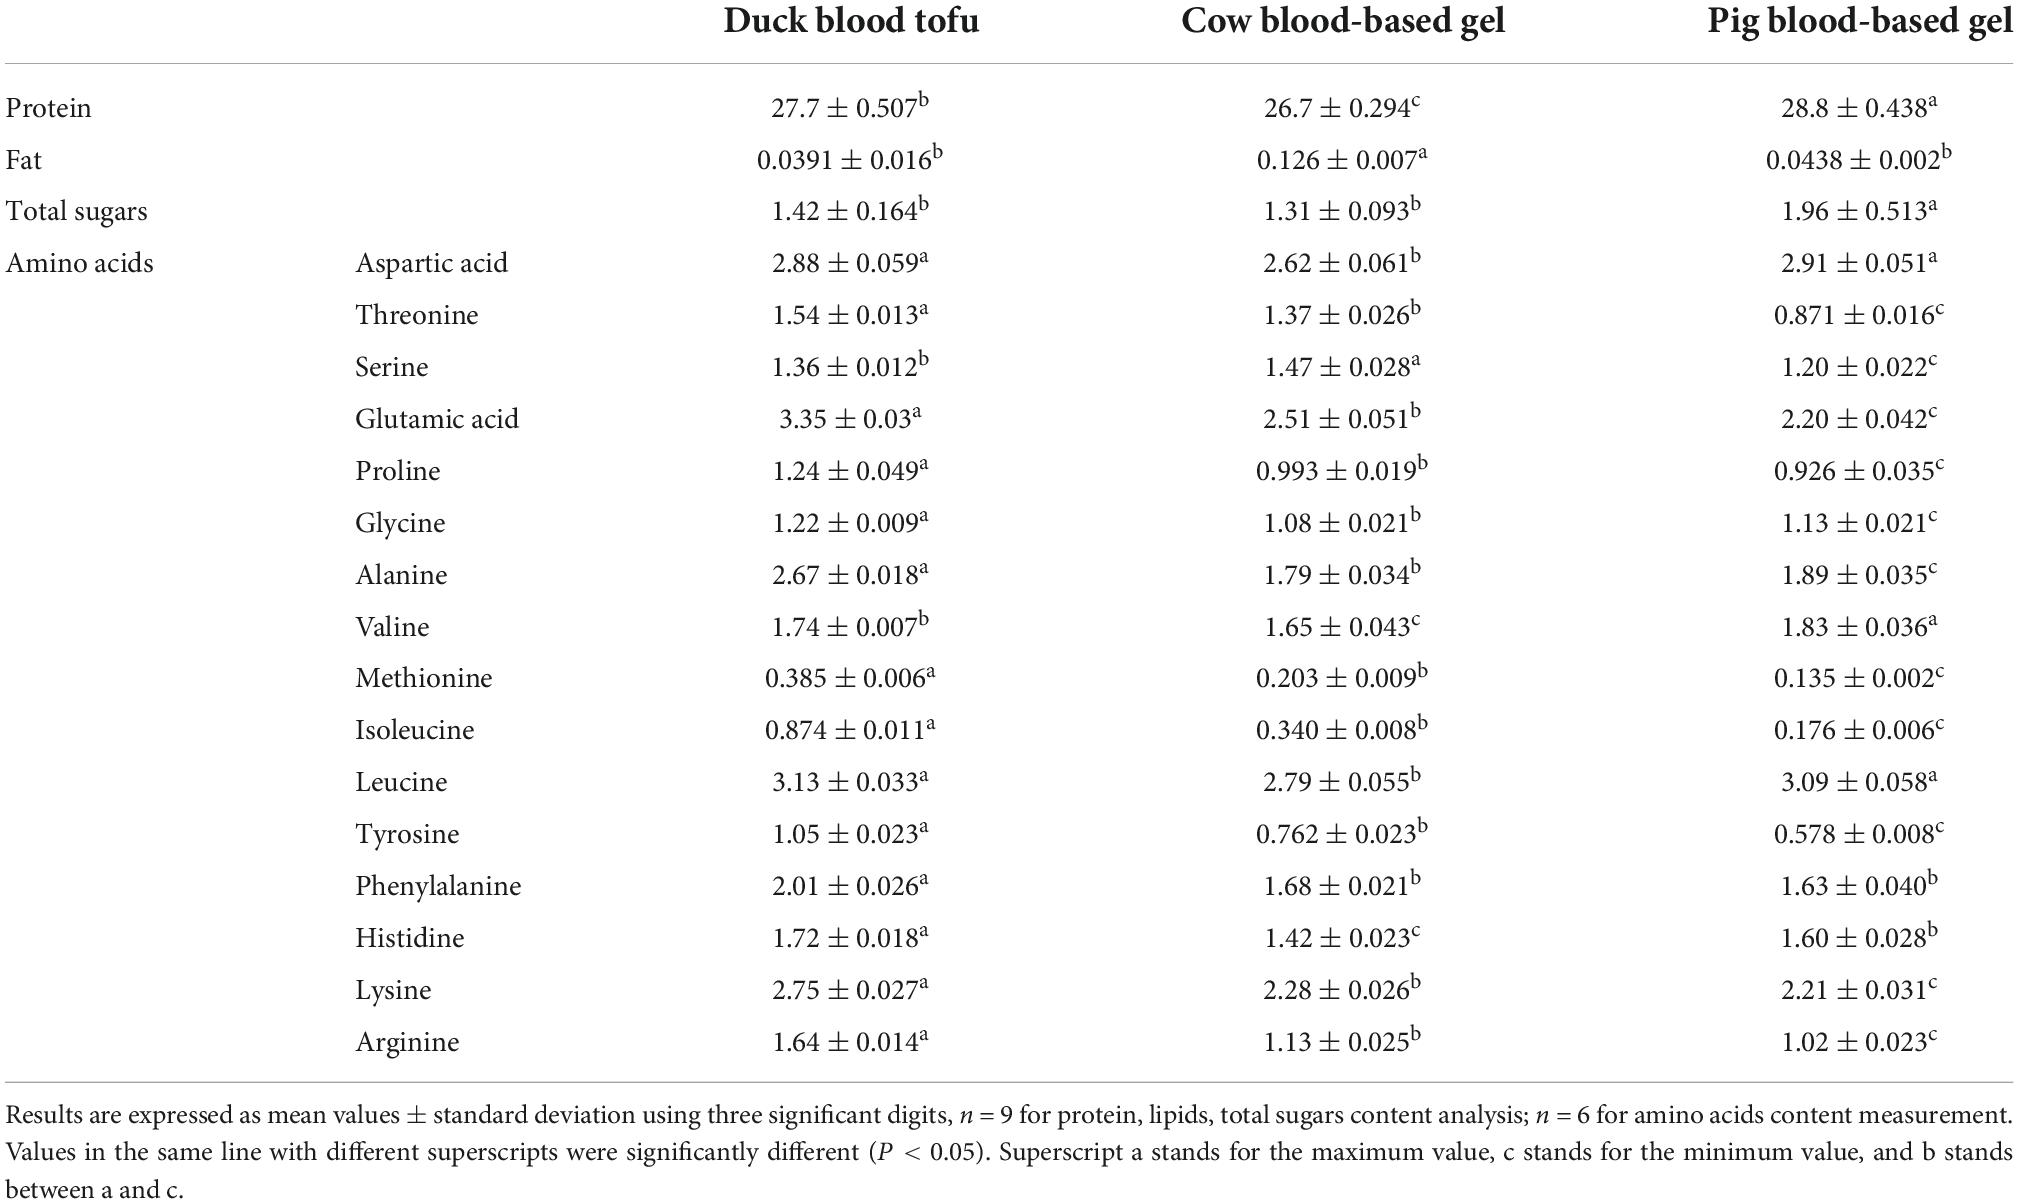
Table 2. Protein, fat, total sugars, and 16 different amino acids content (g/100 g) in the raw duck blood tofu, cow, and pig blood-based gels used.
It could also be found that protein is the major organic component in animal blood food used. As shown in Table 2, 16 different kinds of amino acid contents in samples were measured to explore the differences in protein composition. The aspartic acid and leucine content in DBT and PBG were significantly higher than these two indicators in CBG; the phenylalanine content in CBG and PBG was significantly less than that in DBT. The remaining 13 kinds of amino acids differed significantly among DBT, CBG, and PBG. It was found that the content of threonine, glutamic acid, proline, glycine, alanine, methionine, isoleucine, tyrosine, lysine, and arginine in DBT and PBG were the highest and the least, respectively. The serine content in CBG was significantly higher than that in DBT or PBG, while the serine content in PBG was the lowest. The valine content in the animal blood food samples increased in the following order: CBG, DBT, and PBG; and Histidine content was CBG, PBG, and DBT in turn.
Fisher LDA and ELM were utilized for modeling to identify the adulterated DBT. All 540 samples were divided into six categories: (1) Raw DBT, (2) Pure CBG, (3) Pure PBG, (4) DBT mixed with CBG, (5) DBT mixed with PBG, and (6) DBT ternary mixed with CBG and PBG, whose original FT-NIR spectral data are shown in Figure 1.
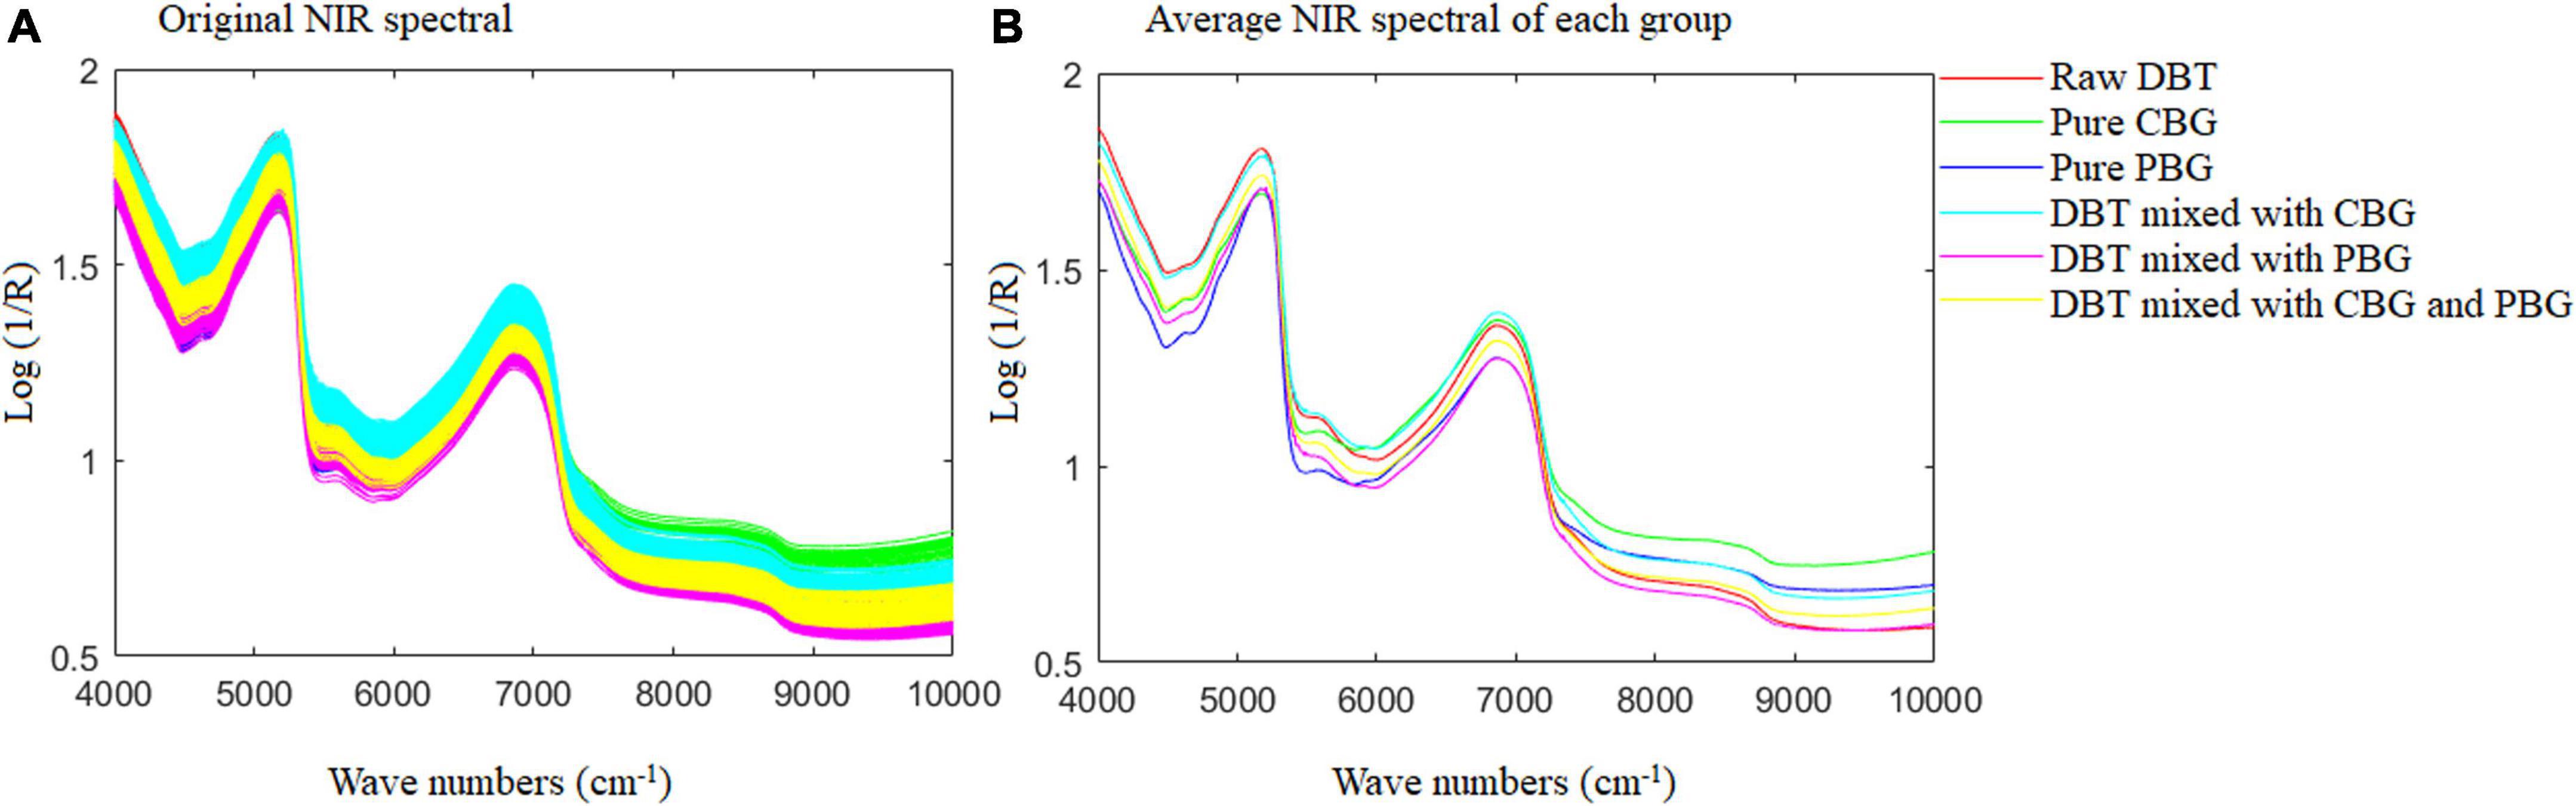
Figure 1. The original NIR spectral for the samples prepared and used. DBT, Duck blood tofu; CBG, cow blood-based gel; PBG, pig blood gel.
During modeling, one-third of the samples in each group were selected as the prediction set using the Kennard-Stone algorithm (28), and the remaining samples were utilized as the training set. The adopted Kennard-Stone algorithm ensures that the samples of training and test sets remain unchanged in the modeling process under the conditions of different spectral preprocessing methods and selected key variables, which is helpful to improve the stability of the model.
The 1st Der, 2nd Der, centralization, SNV, and MSC separately paired with the SWDA were performed and compared for spectra denoising and selecting the crucial spectral wavenumber. Afterward, the principal component analysis (PCA) was used to reduce the dimension and decorrelate the variables selected. The top three principal components (PCs) of the selected spectral variables with different spectral pretreatment techniques were utilized because of their cumulative contribution rates were all over 99.0%.
As for the identification of the adulterated DBT, the results showed that the optimal Fisher LDA model obtained by selecting 27 critical spectral wavenumbers through SWDA and MSC was the best spectral preprocessing technique. The discriminate functions (DFs) are used as follows:
Figure 2 depicts the scatter diagram of the discriminate scores of the training set samples of the optimal Fisher LDA model. Herein, 27 samples were misclassified, and the prediction accuracy was 92.5%. In terms of the test set, 25 samples were misclassified, giving a prediction accuracy of 86.11%. The following samples were incorrectly classified: one sample of the DBT was misclassified as DBT mixed with PBG; nine samples of DBT mixed with CBG were misclassified, including four samples as DBT mixed with PBG, three samples as DBT ternary mixed with cow and pig blood-based gels, one sample as DBT, and one sample as CBG; six samples from the group of DBT mixed with PBG were misclassified, there were four samples misclassified as DBT, and two samples as DBT ternary mixed with cow and pig blood-based gels, respectively; nine samples from the group of DBT ternary mixed with cow and pig blood-based gels were misclassified, including seven samples misclassified as DBT mixed with PBG, and two samples as DBT mixed with CBG. Figure 3 shows the confusion matrixes of the training set of the Fisher LDA. Table 3 summarizes the results of all Fisher LDA models with various spectral denoising techniques and crucial variables selected using SWDA.
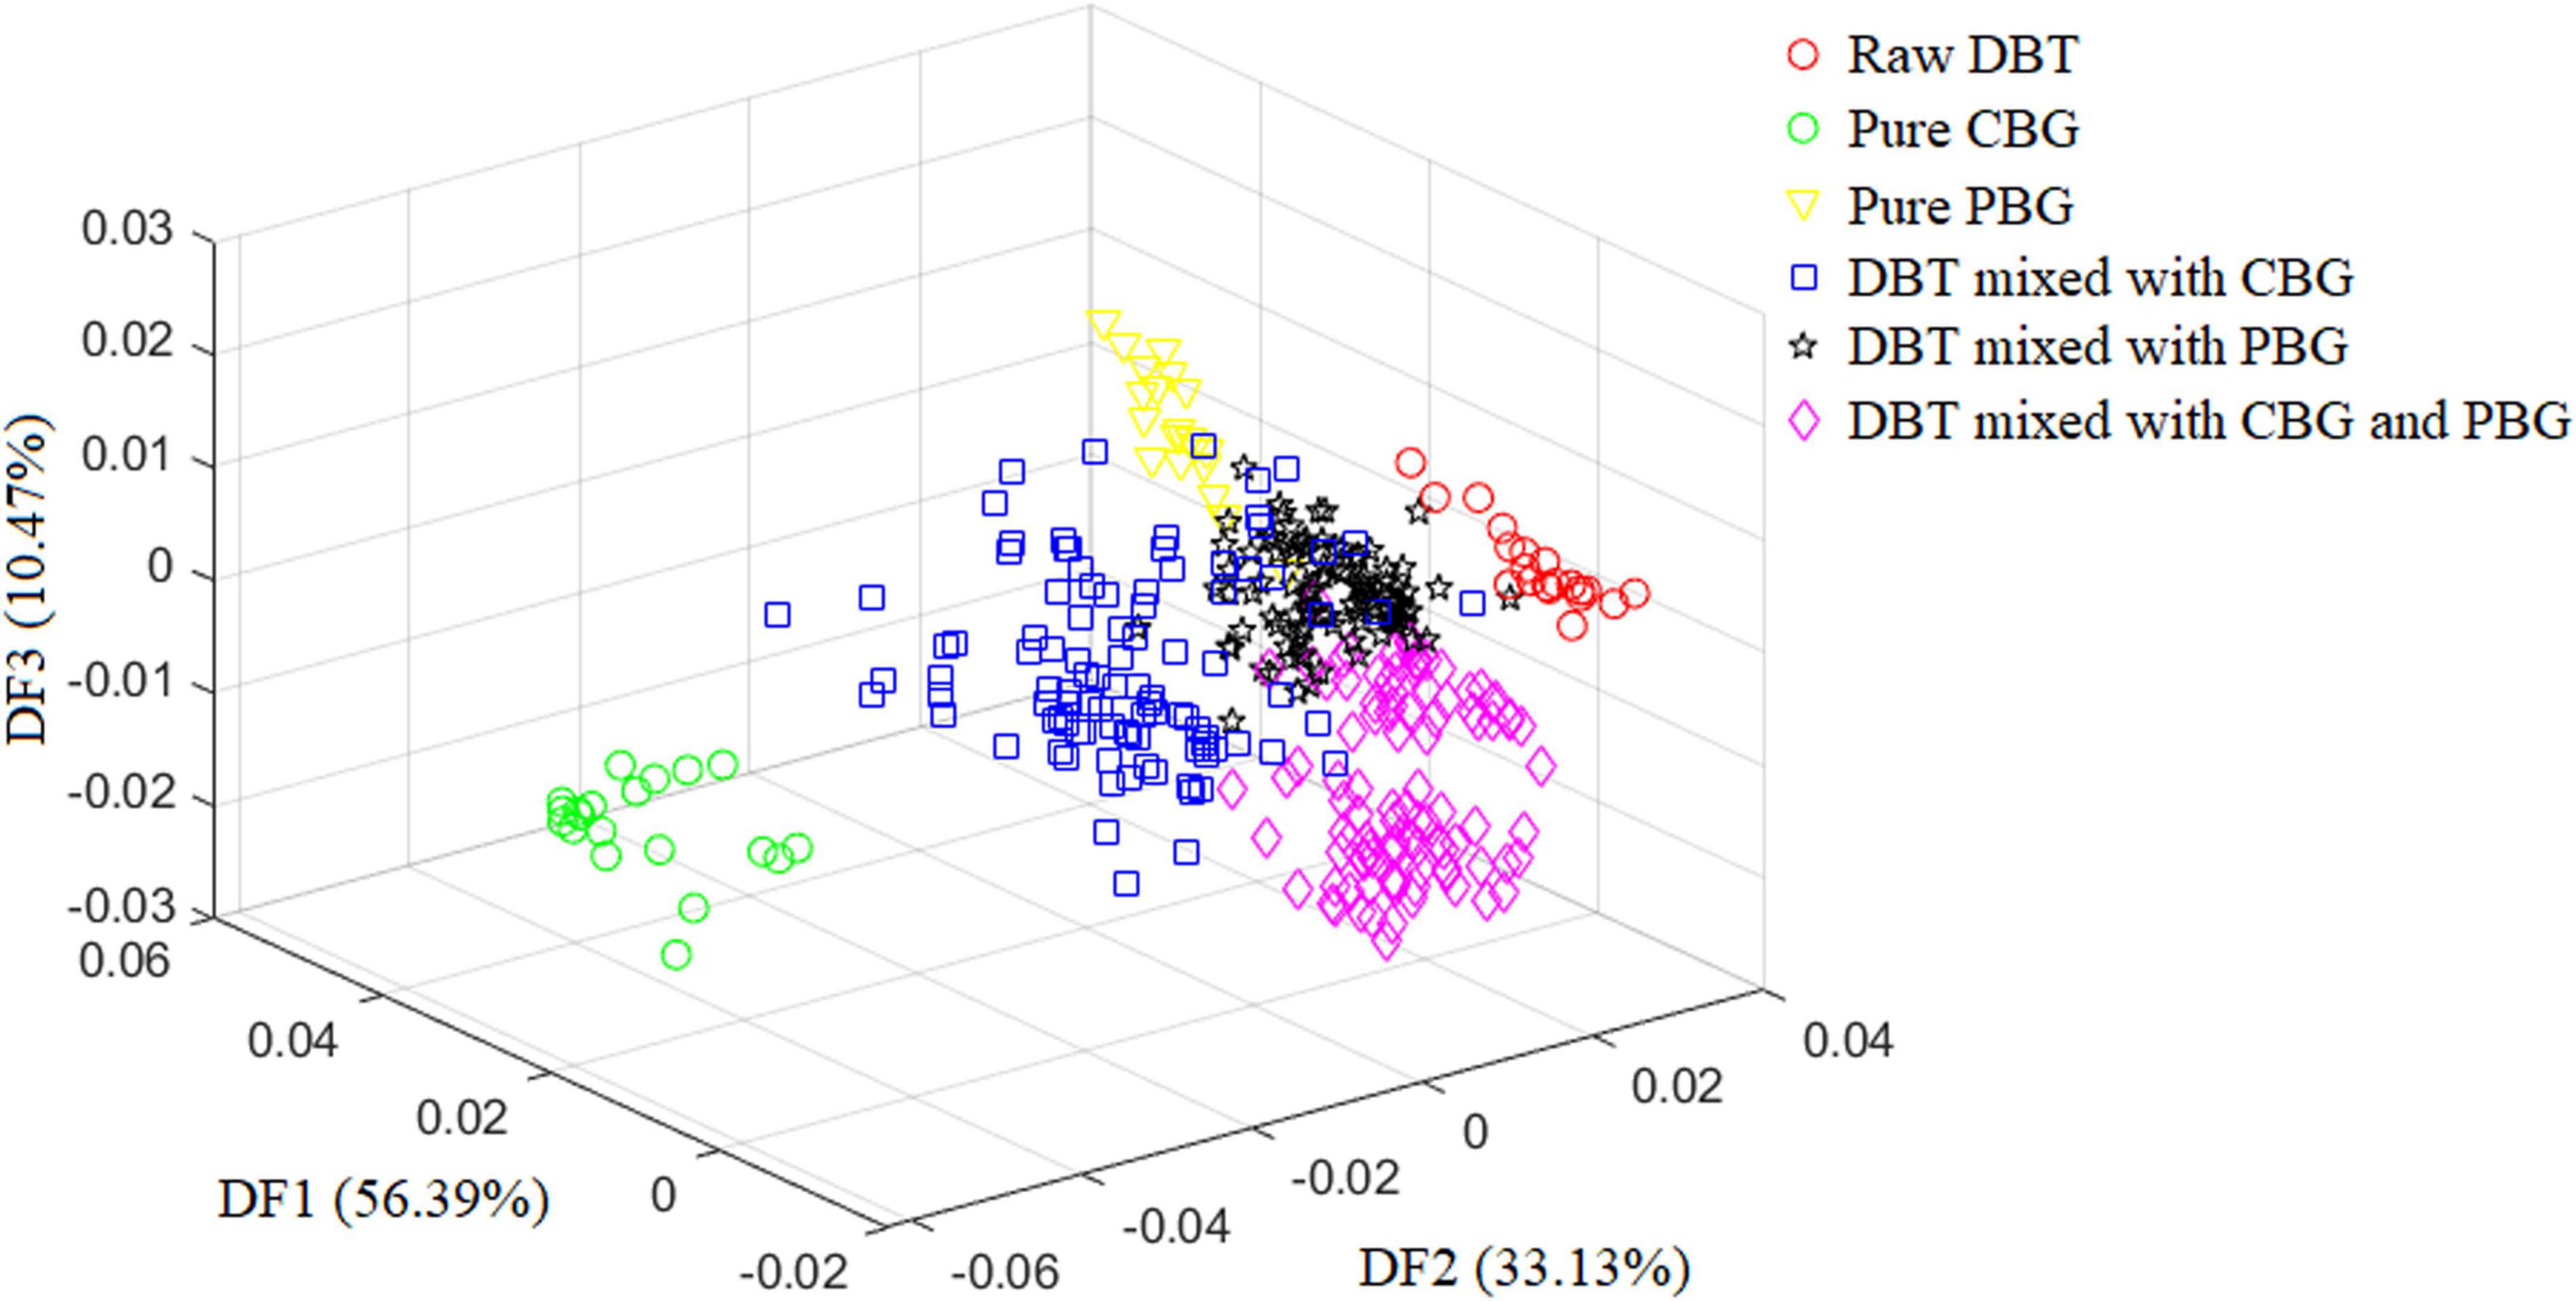
Figure 2. The scatter diagram of the discriminate scores of the training set samples for the optimal Fisher LDA model. DBT, Duck blood tofu; CBG, cow blood-based gel; PBG, pig blood gel.
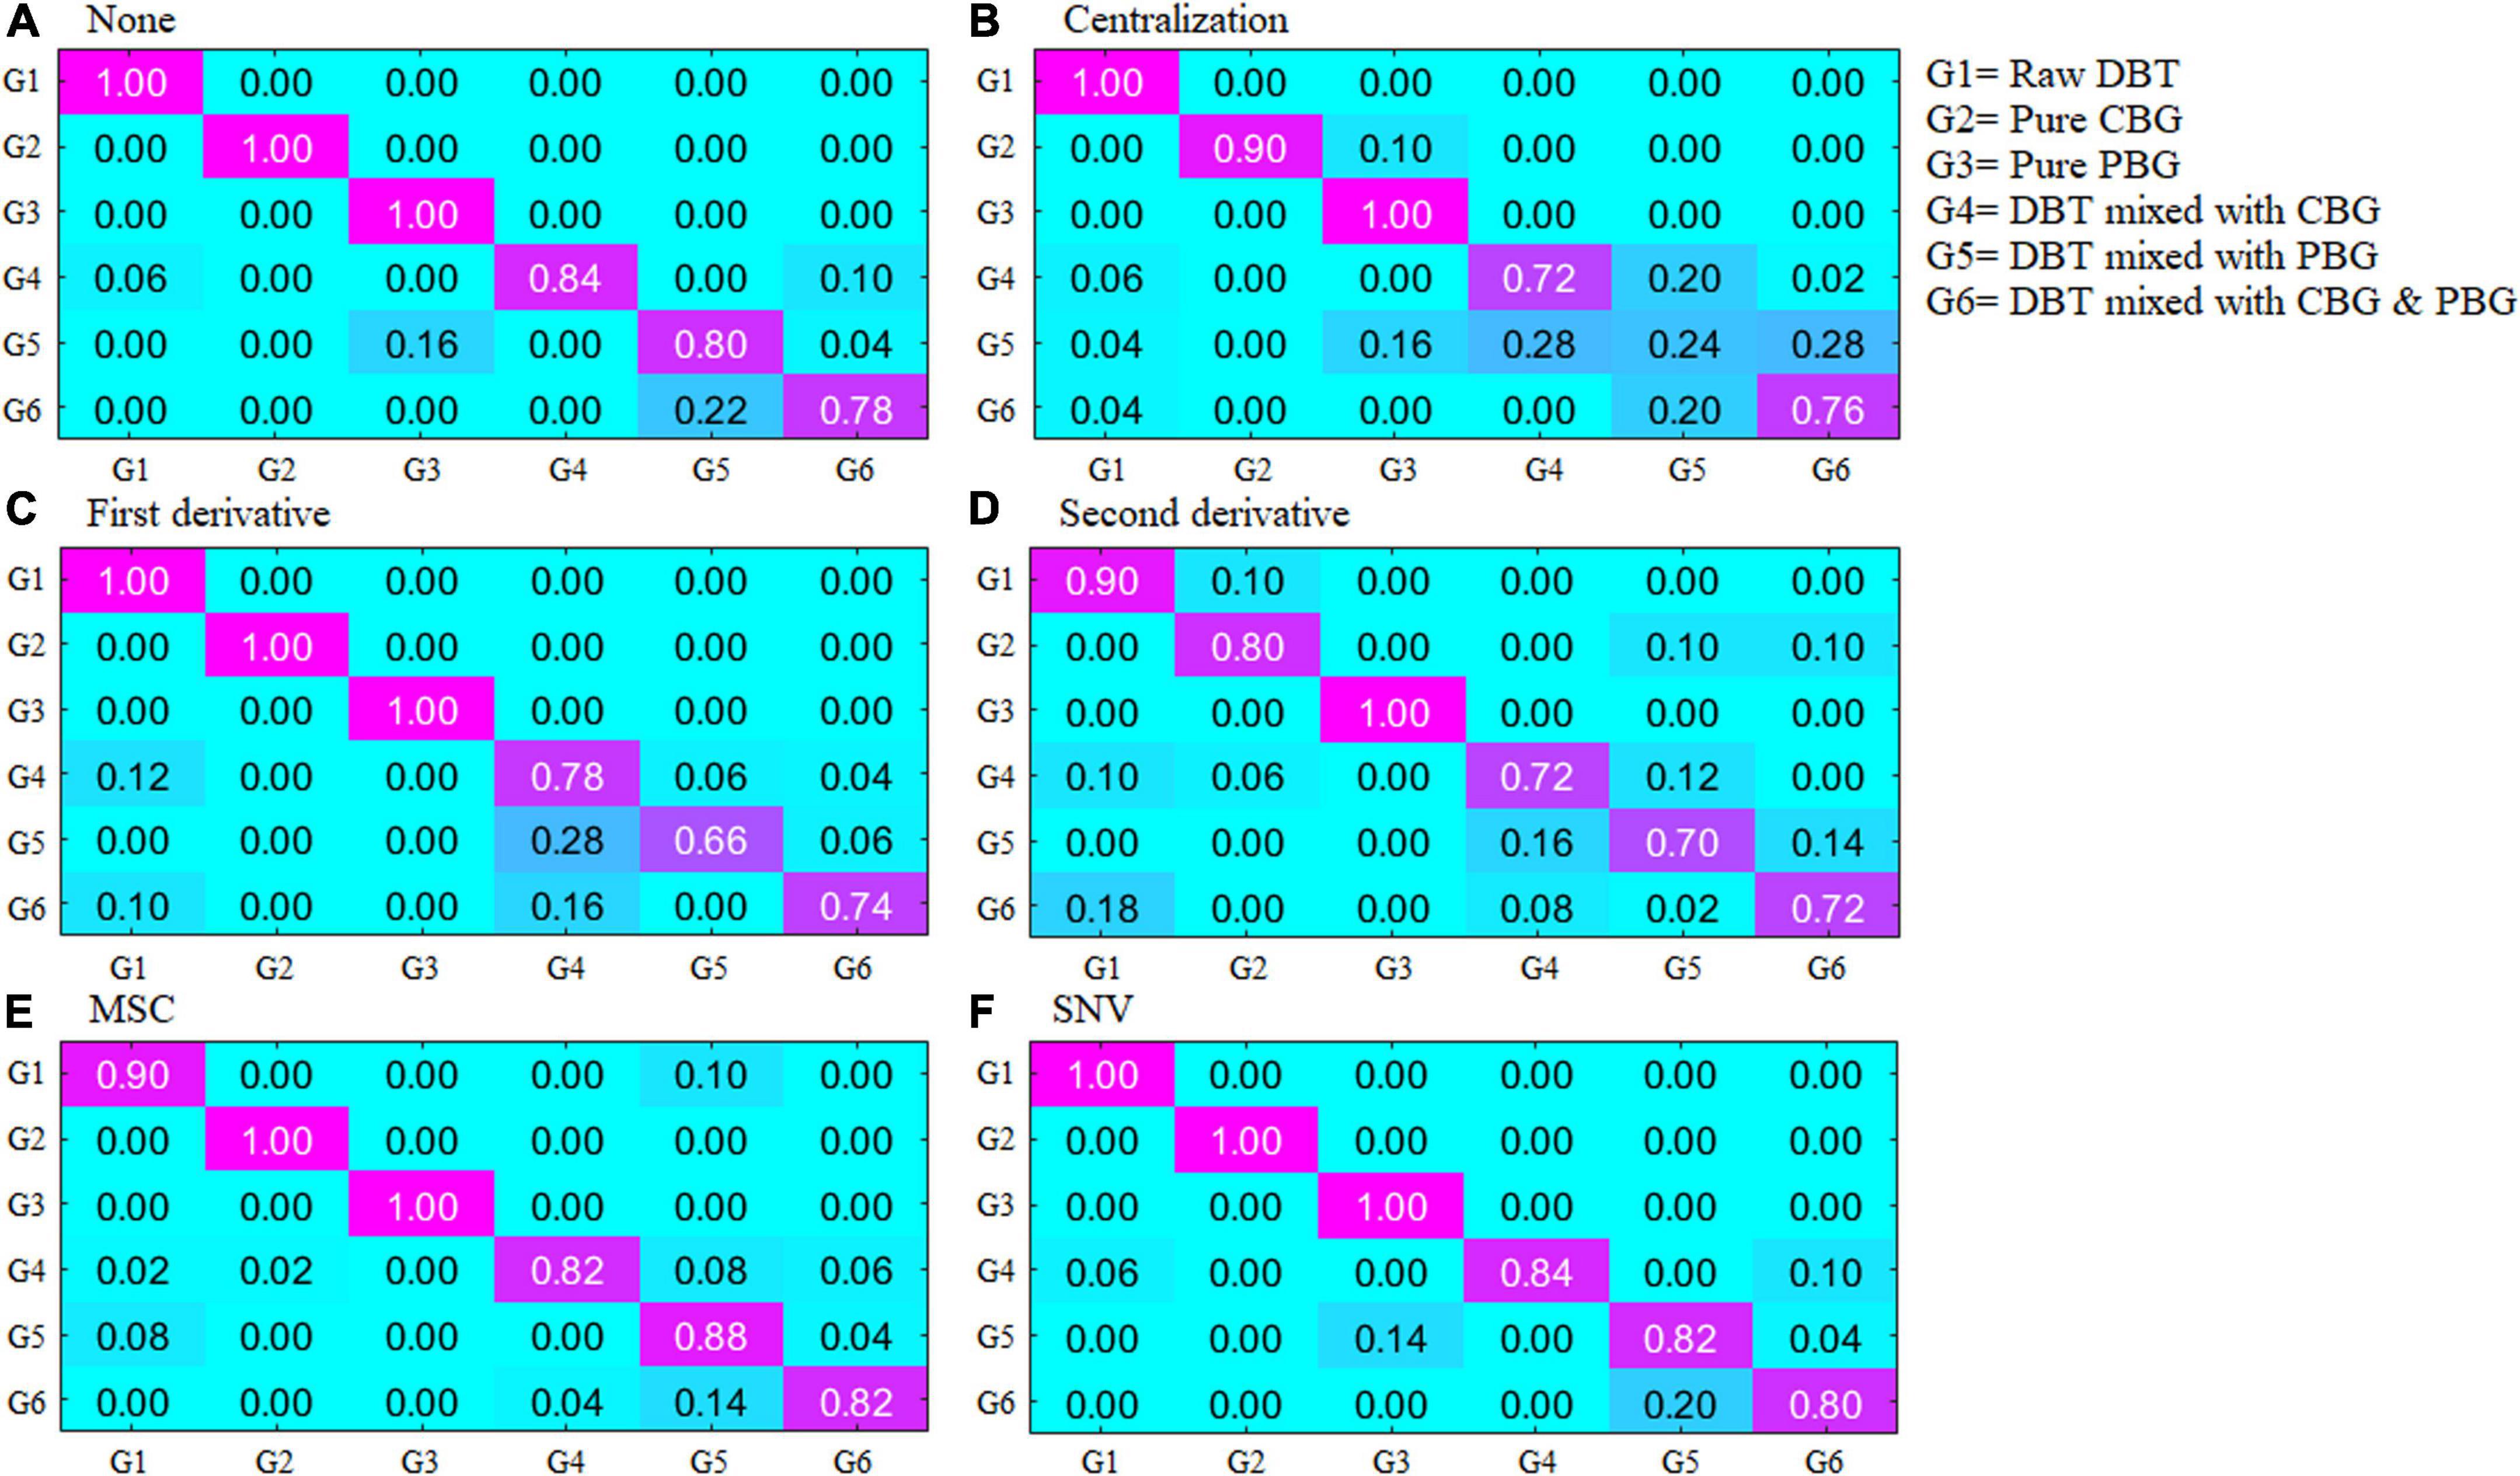
Figure 3. The confusion matrixes of the training set of the Fisher LDA. DBT, Duck blood tofu; CBG, cow blood-based gel; PBG, pig blood gel.
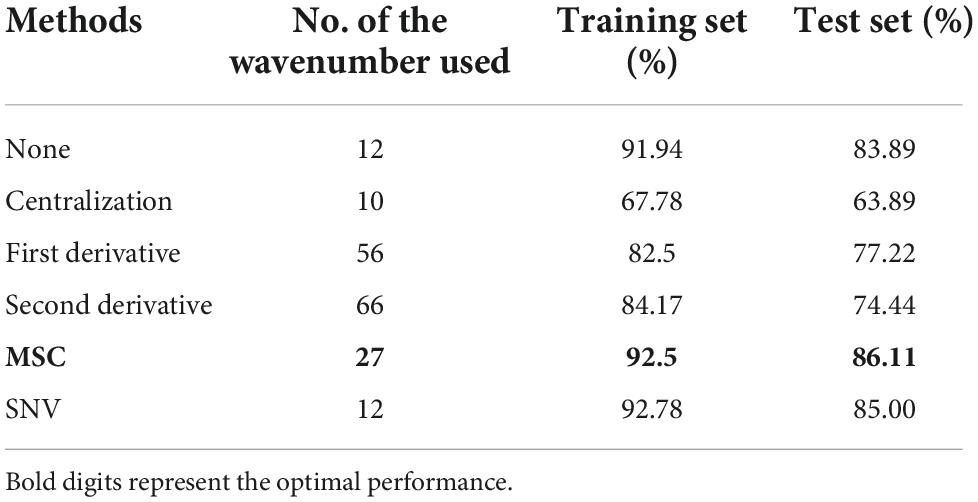
Table 3. Identification rates of the Fisher LDA models to classify the adulterated duck blood tofu with different spectra preprocess methods and wavenumbers selected.
Extreme learning machine model was also constructed using the same training and test sets with the optimal Fisher LDA model. The ELM theory states that the number of hidden neurons and the activation function of the hidden layers have a significant impact on the ELM’s performance (29). Hence, three functions were utilized in comparison as the activation function for the hidden layers during ELM modeling, as depicted in the following formulas:
Generally, the optimal number of hidden neurons can be obtained via the cut-and-trial method. However, the range of the optimal hidden neurons number could be obtained with the aid of the following empirical formula (30),
where, Nh means the number of hidden neurons, Ns means the sample size of the training set, Ni means the number of the input neurons, and N0 means the number of output neurons, α = [2, 10].
For this work, Ns = 360, Ni = 3, and N0 = 1. Hence, the Nh = [9, 45], as the strategy of cut-and-trial used, the optimal number of the hidden neurons was set at a range of [1, 50].
Figure 4 depicts the results of the ELM models with different activation functions and hidden neuron counts. The optimal ELM model was obtained when the number of hidden neurons was 41 and the Sine activation function was used, which offered the highest identification rates of 98.61 and 93.89% in the training and test sets, respectively. Details of the misclassified samples in the test set are as follows: one DBT sample was misclassified as DBT adulterated with CBG; five samples from the group of DBT adulterated with CBG were misclassified, including three samples as DBT ternary adulterated with cow and pig blood-based gels, and two samples as DBT adulterated with PBG; two samples from the group of the DBT adulterated with PBG were misclassified as DBT adulterated with CBG; three samples from the group of the DBT ternary adulterated with cow and pig blood-based gels were misclassified, including two samples as DBT adulterated with PBG, and one sample as DBT adulterated with CBG.
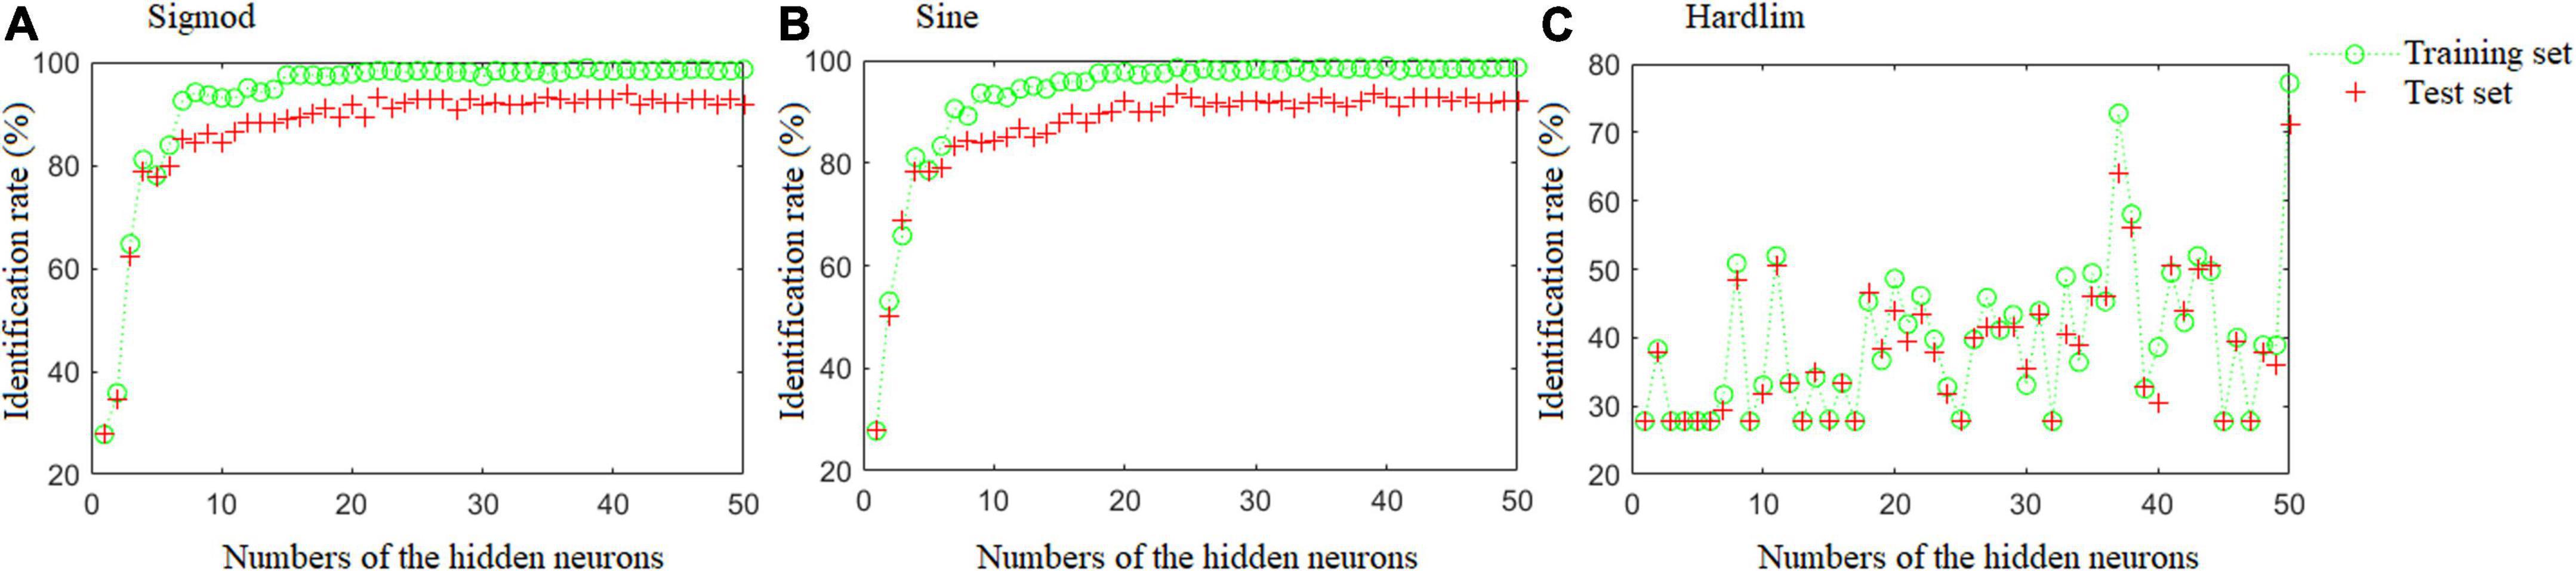
Figure 4. The results of the ELM models with different activation functions and numbers of hidden neurons.
The present work used FT-NIR with a spectral range of 4,000–10,000 cm–1 for quality analysis of animal blood food. There are differences in basic organic chemicals among the raw DBT, CBG, and PBG used (Table 2). Variations in radiation absorption at different wavenumbers are related to the chemical compositions of the animal blood food (5). As depicted in Figure 5A, each species of animal blood-based food has a characteristic spectrum that allows its identification and differentiation (Figure 5B). This is necessary to detect the DBT binary and ternary adulterated with cow and/or pig blood-based gel using the FT-NIR technique.
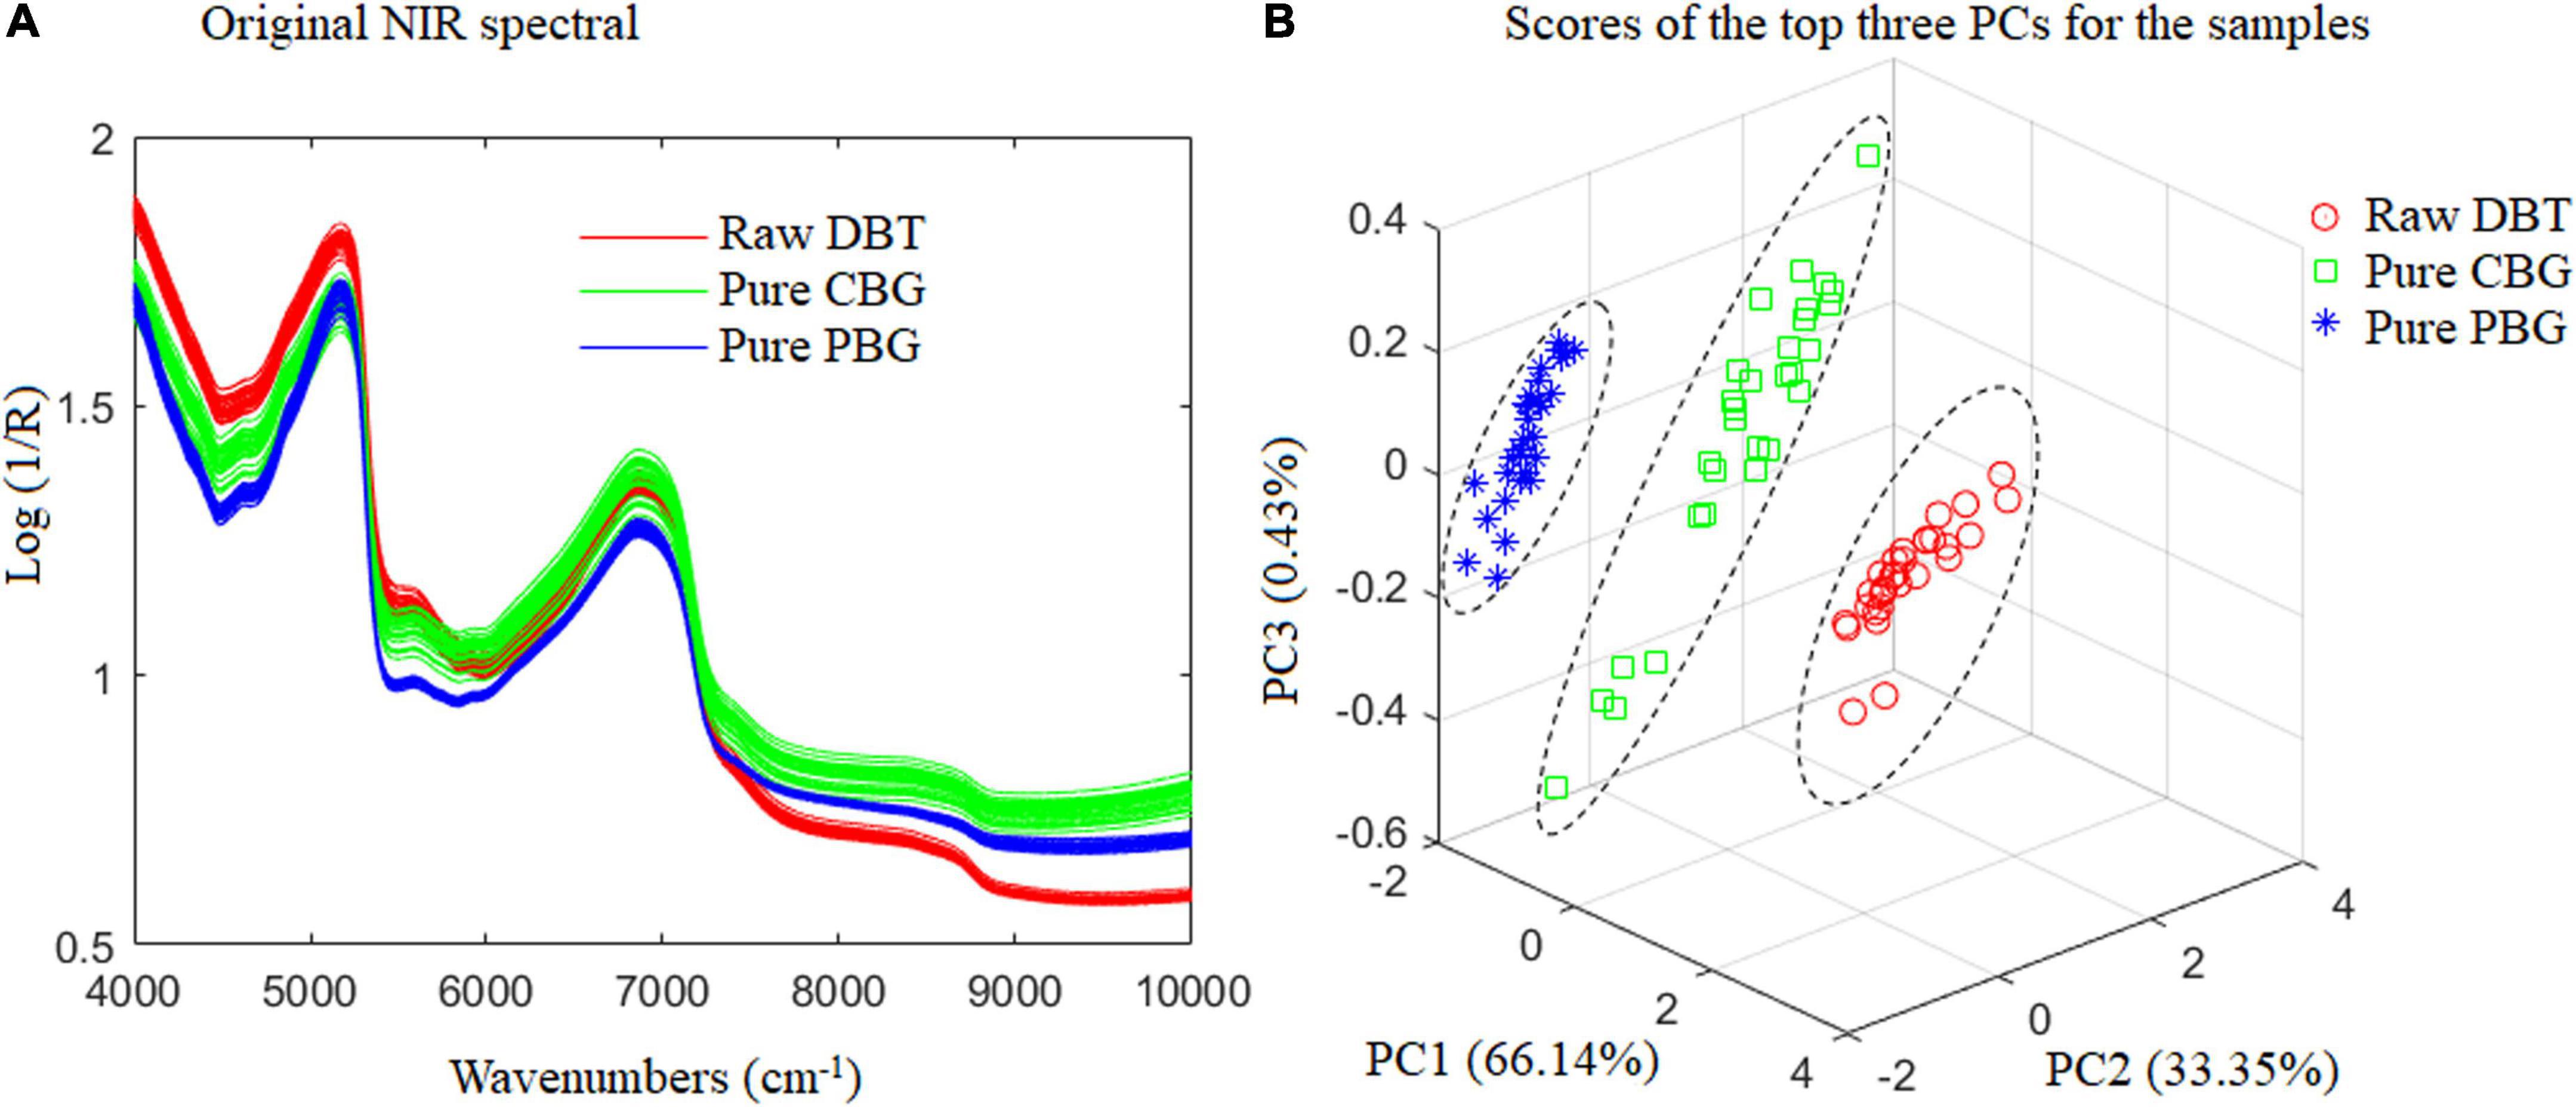
Figure 5. The raw NIR spectral and scatter diagram of the top three principal component analysis scores of the raw duck blood tofu (DBT), pure cow blood-based gel (CBG), and pig blood-based gel (PBG).
Figure 6 shows the MSC spectra (A) of the samples prepared and used, and the selected wavenumbers (B) for Fisher LDA and ELM modeling. It could be observed from the spectra profile in Figure 6B that the crucial wavenumber for identification of the adulterated DBT samples are around 4,108, 4,405, 5,238, 5,326, 5,477, 5,774, 6,241, 6,931, 7,189, 8,015, 9,399, and 9,997 cm–1. These key wavenumbers reflected the difference of hydrogen components in the raw DBT, pure cow, and pig blood-based gels, such as 4,108 and 4,405 cm–1 corresponds to C-H+C-C and C-H+C-H combinations, which represent CH, CH2, and CH3 groups, respectively; 5,238 and 5,326 cm–1 represents RCO2H and C = O stretch 2nd overtone, respectively; 5,477 cm–1 represents C = O stretch 2nd overtone; 5,774 cm–1 corresponds to S-H and C-H 1st overtone, which represents S-H, C-H, and C-H2; 6,241 cm–1 represents Ar-CH; 6,931 cm–1 represents ROH, CONH2, and CH; 7,189 and 8,015 cm–1 corresponds to the second overtone region, which represents CH3, CH2, ArOH, and CH; 9,399 and 9,997 cm–1 corresponds to N-H 2nd overtone, which represents RNH2. All groups are associated with significant amounts of protein, amino acids, fat, and sugar is shown in Table 2.
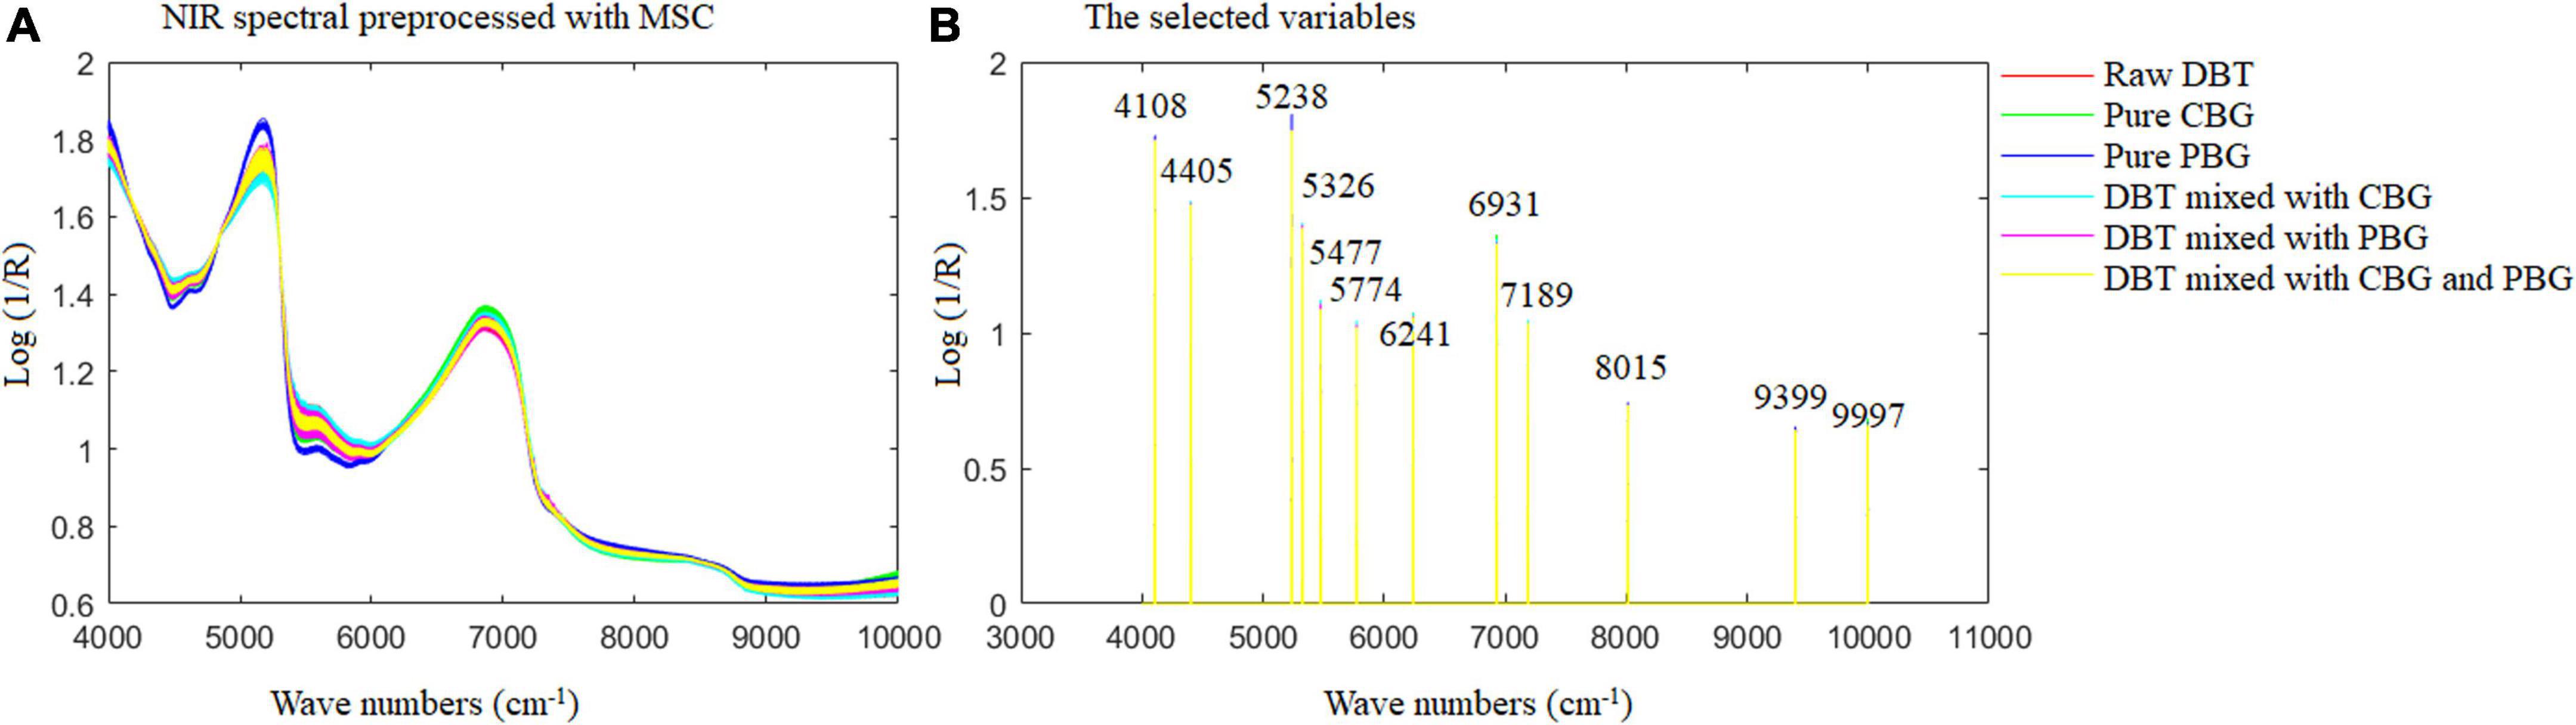
Figure 6. The multivariate scattering correction spectra of the samples prepared and used (A) and the selected wavenumbers (B) for Fisher LDA and ELM modeling. DBT, Duck blood tofu; CBG, cow blood-based gel; PBG, pig blood gel.
Extreme learning machine performed better than Fisher LDA for the identification of adulterated DBT samples. The reason is primarily due to the relationships among the FT-NIR data matrices of the animal blood food used were more complex than linear as a result of the essential characteristic of FT-NIR, which is spectral of several wavenumbers may contain information from the same organic chemicals, and spectral of each wavenumber may contain chemical information from several organic chemicals in the food materials. ELM has a significant advantage over linear discriminant analysis algorithms for processing non-linear problems due to its superior ability to self-learning and self-adjusting (31).
In this section, extreme learning machine regression (ELMR) models were constructed and optimized for predicting adulteration levels. Three FT-NIR datasets of those adulterated samples, namely DBT mixed with CBG, DBT mixed with PBG, and DBT ternary mixed with CBG and PBG were utilized to build four ELMR models. ELMR No. 1 for prediction of the CBG content in DBT adulterated with CBG; ELMR No. 2 for prediction of the PBG content in DBT adulterated with PBG; and ELMR Nos. 3 and 4 for prediction of the CBG and PBG content in the DBT ternary mixed with cow and pig blood-based gels, respectively.
The 1st Der, 2nd Der, centralization, SNV, and MSC separately paired with CARS for spectra denoising and screening of the crucial spectral wavenumber during ELMR modeling according to four convergence criteria: RMSE, correlation coefficients (r), RPD, and RER. The selected variables coupled with spectral preprocess technology for ELMR Nos. 1 and 2 were also utilized to construct ELMR Nos. 3 and 4, respectively, but performances were compared and optimized. Therefore, the optimized variables and spectral pretreatment method for ELMR No. 1 may be different from those for ELMR No. 3 because the original FT-NIR datasets were different. The same situation applies to ELMR Nos. 2 and 4.
The Kennard–Stone algorithm was also used to select one-third of samples from each adulteration level group as the prediction set and the remaining samples were utilized as the training set. The Sine activation function (Eq. 10) was used as the activation function of the hidden layers according to the optimized ELM model for identifying adulterated animal blood foods.
The number of hidden neurons was also optimized during ELMR modeling. Herein, as the strategy of cut-and-trial was used, the optimal number of hidden neurons was also set at a range of [1, 50].
Results show that, for the prediction of CBG content in the DBT adulterated with CBG, the optimal ELMR model was obtained while the MSC and 68 crucial variables were used; for the prediction of PBG content in the DBT adulterated with PBG, the optimal ELMR model was obtained, while the MSC and 52 crucial variables were used; for the prediction of the CBG content in the mixtures of DBT ternary adulterated with CBG and PBG, the optimal ELMR model was obtained while the centralization and 90 crucial variables were used; and for prediction of the PBG content in the mixtures of DBT ternary adulterated with CBG and PBG, the optimal ELMR model obtained while SNV and 602 crucial variables were used. The optimal spectral pretreatment method and the selected crucial variables for constructing the ELMR models are shown in Figure 7.
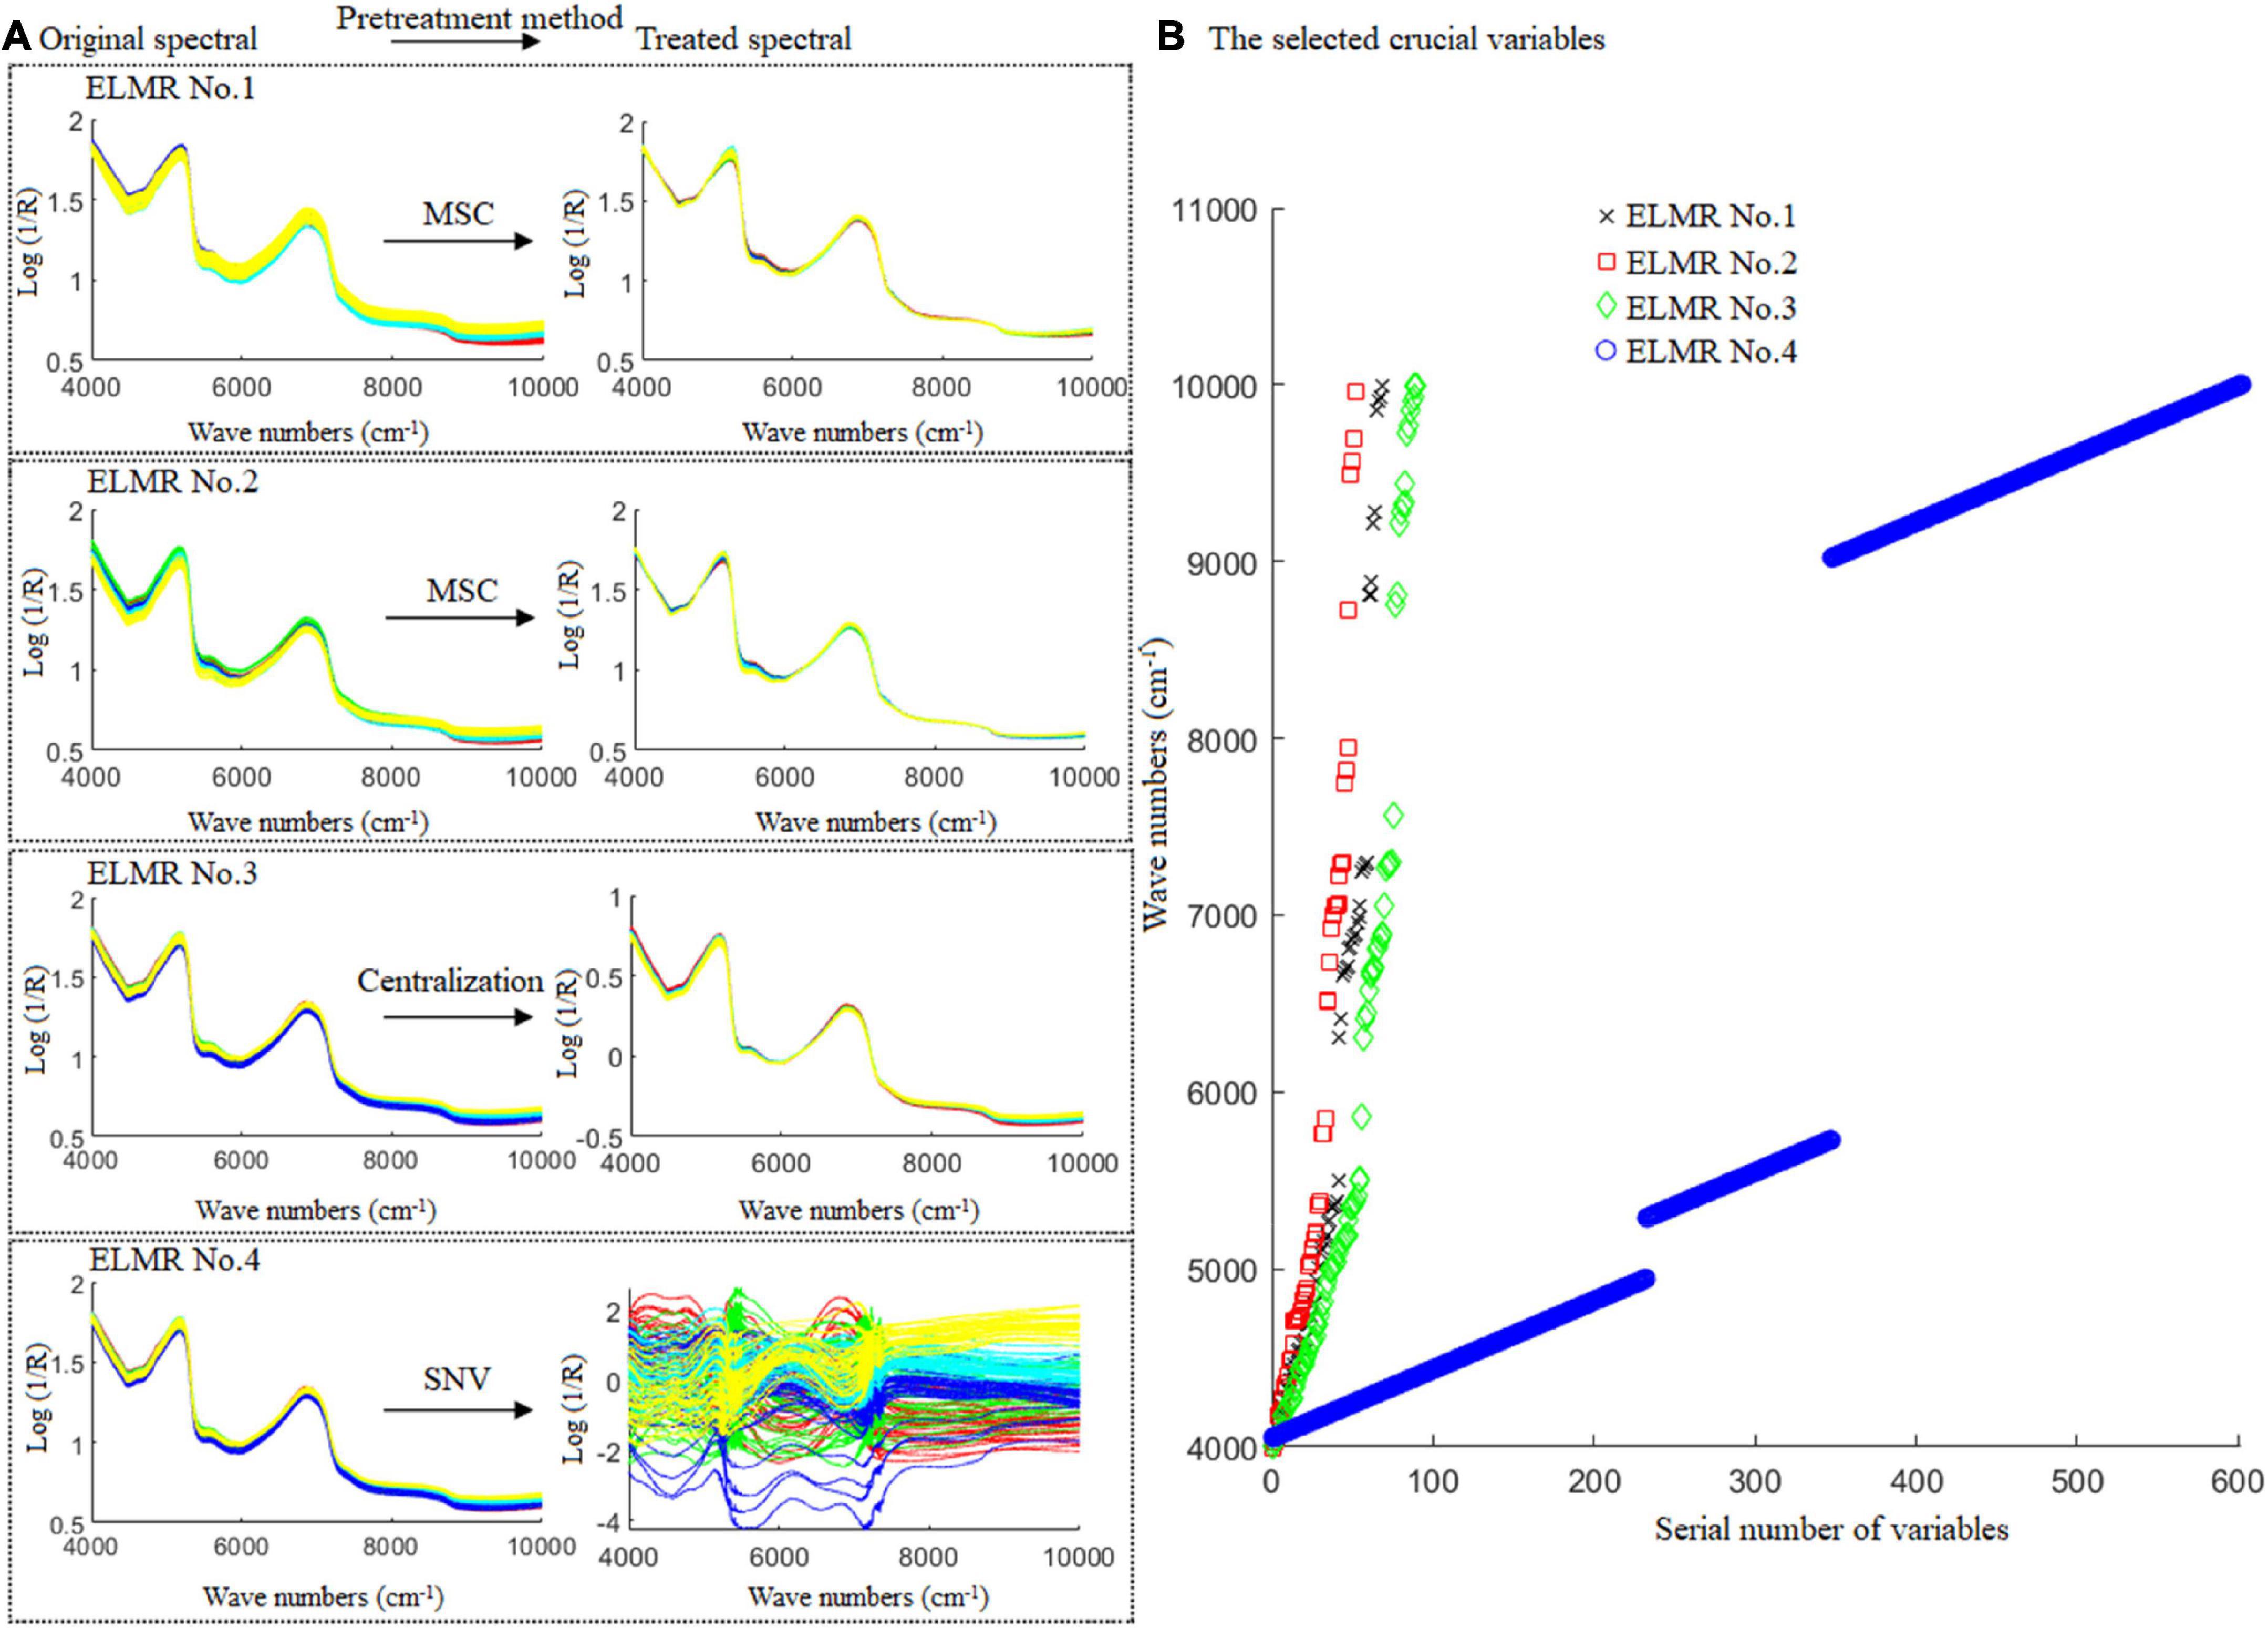
Figure 7. The best pre-treatment technique and the crucial variables selected for the optimal ELMR models constructed. ELMR No. 1 for prediction of the CBG content in DBT adulterated with CBG; ELMR No. 2 for prediction of the PBG content in DBT adulterated with PBG; and ELMR Nos. 3 and 4 for prediction of the CBG and PBG content in the DBT ternary mixed with cow and pig blood-based gels, respectively.
Figure 8 depicts the actual and predicted adulteration levels of the training and test set of the optimal ELMR models built. As demonstrated in the figure, all the correlation coefficients of the training and prediction set of the optimal ELMR models were higher than 0.94, with the RMSEt and RMSEp less than 3.5%, and the RPD and RER were over 4.0 and 12.0, respectively. Performances of the ELMR models constructed were satisfactory.
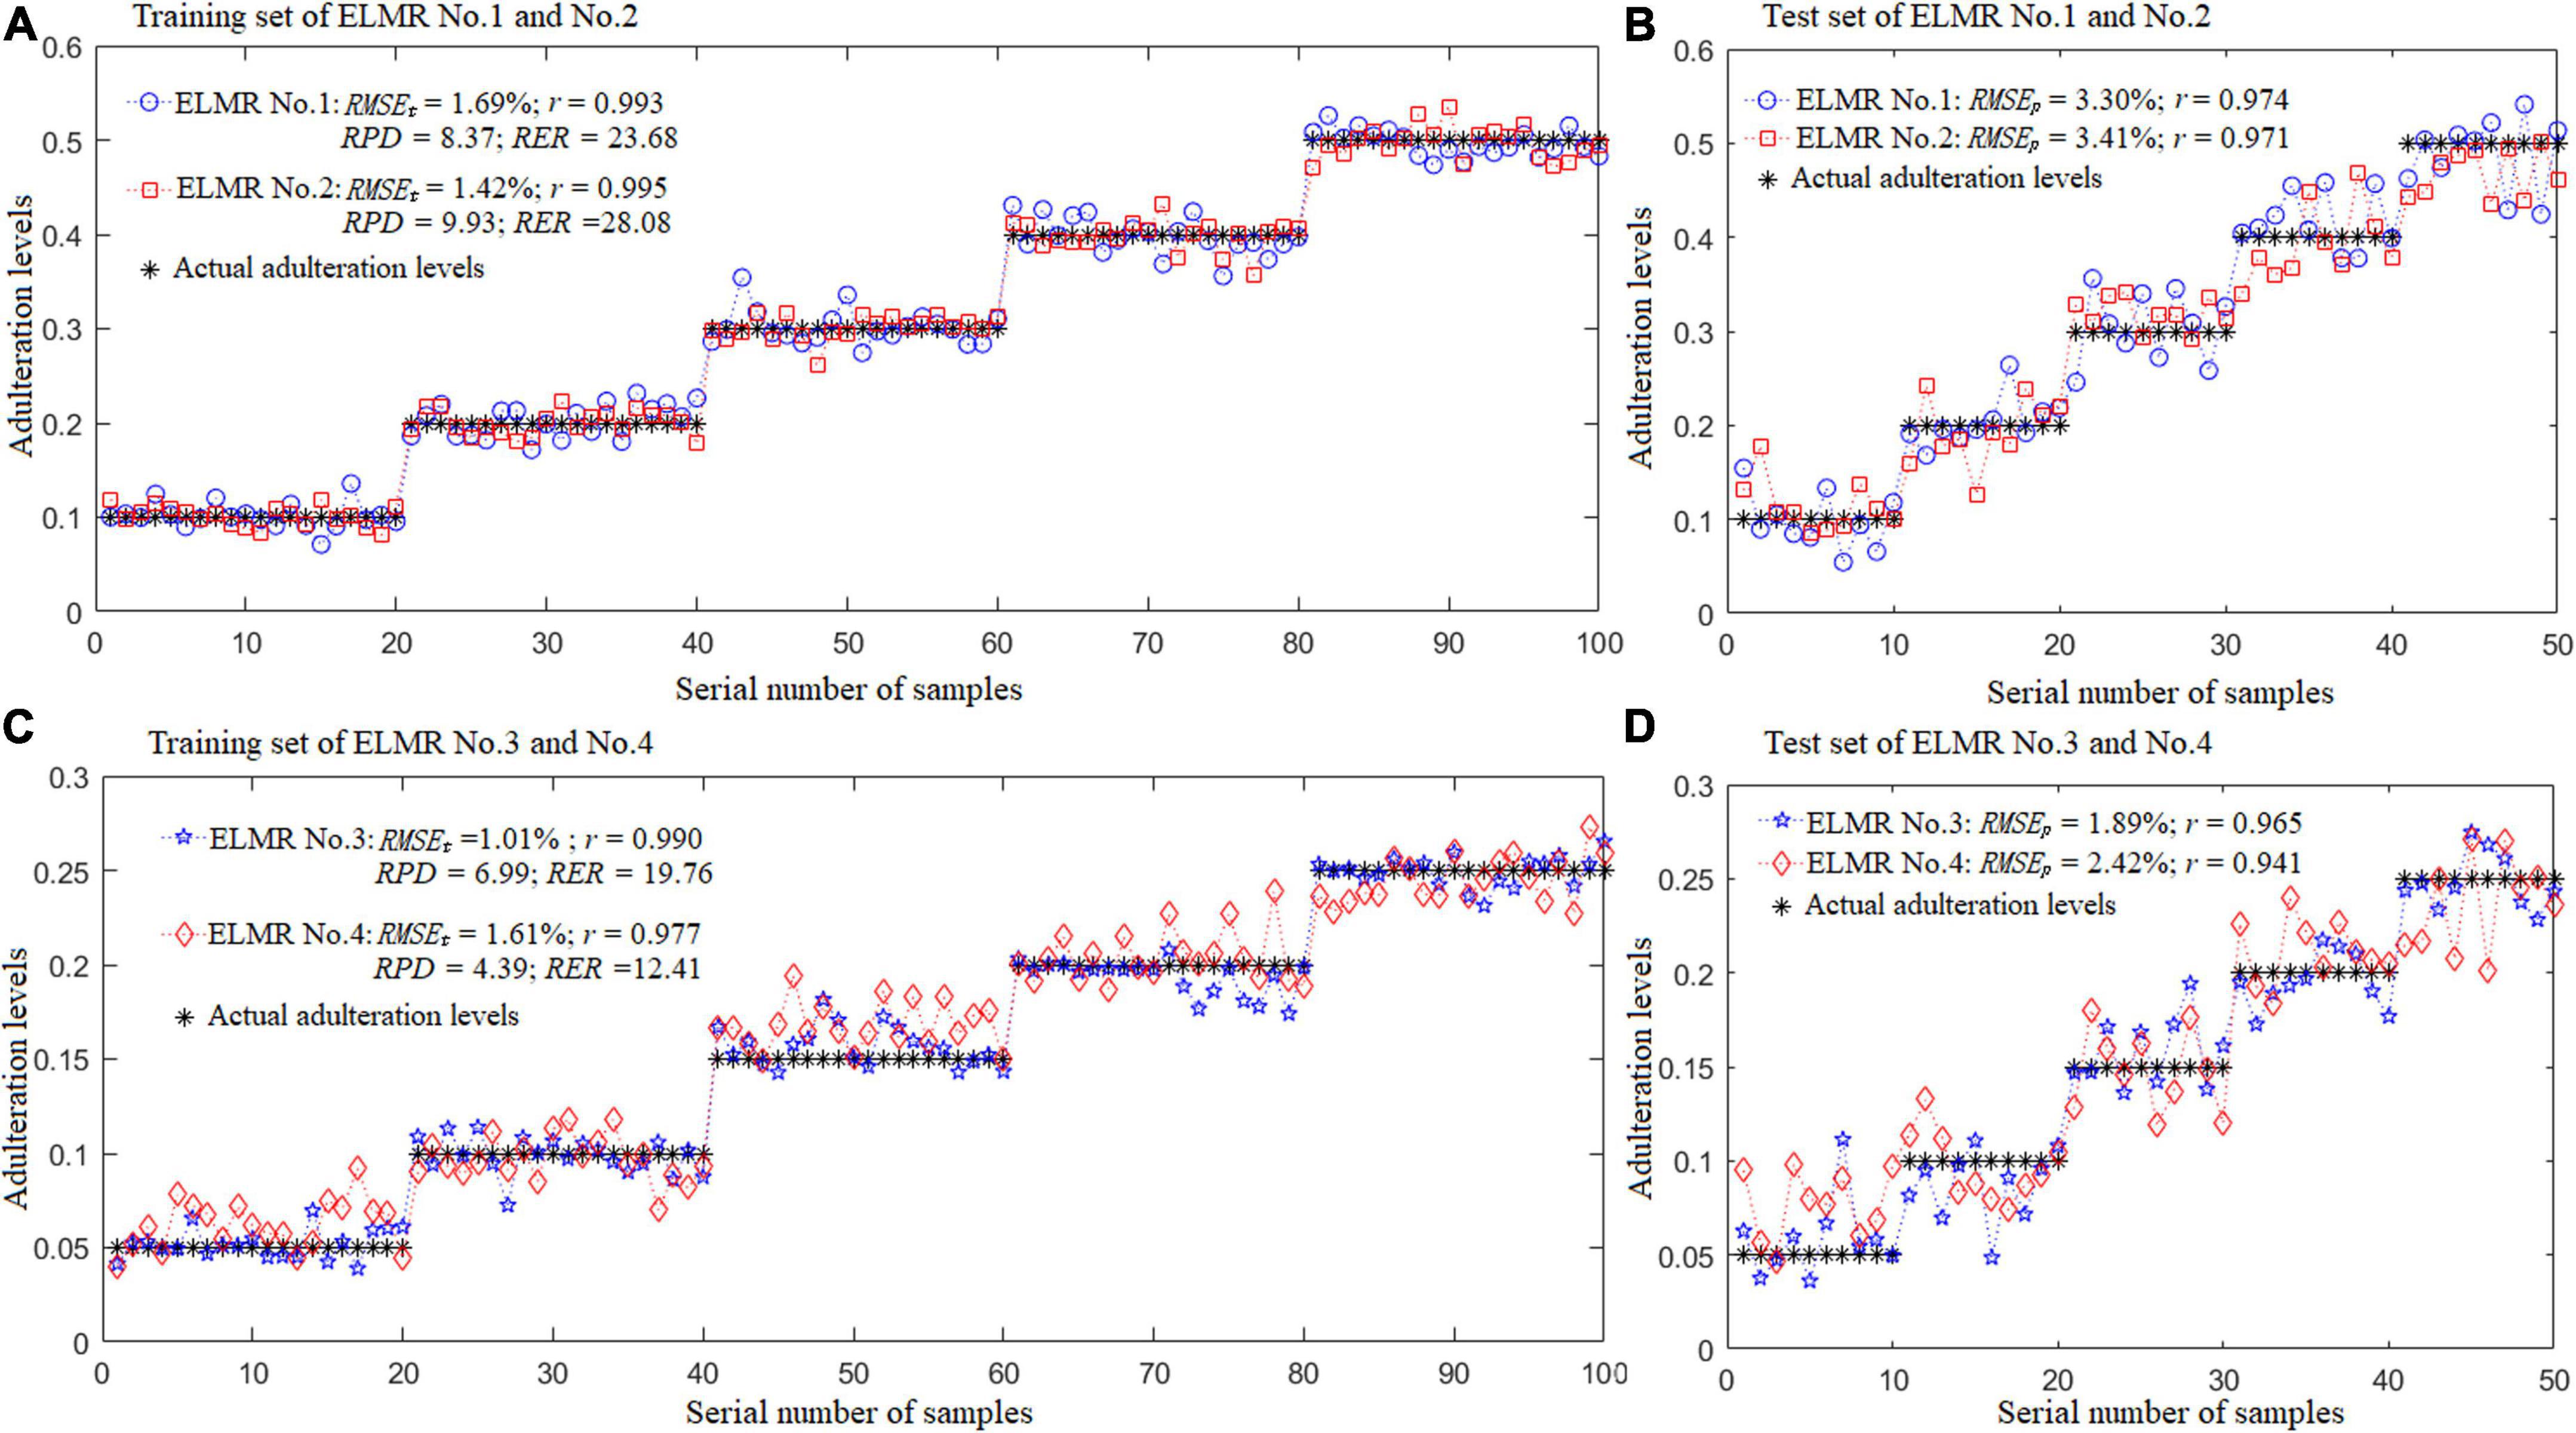
Figure 8. Results of the optimal ELMR models for predicting adulteration levels. (A,B) ELMR No. 1 for prediction of the CBG content in DBT adulterated with CBG; ELMR No. 2 for prediction of the PBG content in DBT adulterated with PBG; and (C,D) ELMR Nos. 3 and 4 for prediction of the CBG and PBG content in the DBT ternary mixed with cow and pig blood-based gels, respectively.
Due to the significant economic importance of DBT, the practice of adulterating or replacing it with other low-cost animal types of blood is still quite severe. The use of FT-NIR in combination with fast chemometrics was presented as a method for detecting DBT binary and ternary adulterated with cow and pig blood-based gels. The ELM model outperformed the Fisher LDA model in identifying adulterated DBT, with higher identification rates of over 93.0% in both the training and test sets. For adulterated level prediction, all the correlation coefficients of the training and prediction sets of the ELMR models constructed were higher than 0.94, with the RMSEt and RMSEp all less than 3.5%, and the RPD and RER were all over 4.0 and 12.0, respectively. The findings of this work show that FT-NIR paired with ELM may be utilized to assess edible animal blood food adulteration rapidly and conveniently.
The original contributions presented in this study are included in the article/supplementary material, further inquiries can be directed to the corresponding author.
FH conceived and designed the FT-NIR experiments, chemicals measurements, and data modeling. LM and XZ performed the measurements. FH, LM, JA, and MR wrote and revised the manuscript. FH and XH supervised the execution of analyses. All authors contributed to the article and approved the submitted version.
This work was sponsored by the National Natural Science Foundation of China (No. 31671932), the Anhui Provincial Natural Science Foundation (1908085QC146), the Back-up of Academic and Technical Leaders of Suzhou University (2020XJHB04), the Natural Science Research Project of Colleges and Universities in Anhui Province (KJ2021ZD0139), the Scientific Research Platform Project of Suzhou University (2021XJPT35), and the Support Project for Outstanding Young Talents of Colleges and Universities in Anhui Province (gxyq2022105).
We thank several students at Suzhou University for their contribution to this work: Mengxue Xue, Ruimin Zhang, Lei Bao, Linfang Hu, Qiantong Hu, Jinmeng Wang, Yan Yu, and Sisi Xu.
The authors declare that the research was conducted in the absence of any commercial or financial relationships that could be construed as a potential conflict of interest.
All claims expressed in this article are solely those of the authors and do not necessarily represent those of their affiliated organizations, or those of the publisher, the editors and the reviewers. Any product that may be evaluated in this article, or claim that may be made by its manufacturer, is not guaranteed or endorsed by the publisher.
1. Bah CSF, Bekhit AE-DA, Carne A, McConnell MA. Slaughterhouse blood: an emerging source of bioactive compounds. Compr Rev Food Sci Food Saf. (2013) 12:314–31. doi: 10.1111/1541-4337.12013
2. Petrotos K. Application of membrane technology to slaughterhouse blood to produce edible powdered protein mixture. J Membr Separat Technol. (2012) 1:35–42. doi: 10.6000/1929-6037.2012.01.01.5
3. Zhang Y, Wang S, Ma Y, Li H, Li Y. Identification and absolute quantification of animal blood products by peptide markers using an Uplc–Ms/Ms Method. Eur Food Res Technol. (2020) 246:581–9. doi: 10.1007/s00217-019-03421-x
4. Han F, Aheto JH, Rashed MMA, Zhang X. Machine-learning assisted modelling of multiple elements for authenticating edible animal blood Food. Food Chem. (2022) 14:100280. doi: 10.1016/j.fochx.2022.100280
5. Mendez J, Mendoza L, Cruz-Tirado JP, Quevedo R, Siche R. Trends in application of nir and hyperspectral imaging for food authentication. Sci Agropecuaria. (2019) 10:143–61. doi: 10.17268/sci.agropecu.2019.01.16
6. Unajak S, Meesawat P, Anyamaneeratch K, Srikulnath K, Choowongkomon K. Identification of species (meat and blood samples) using nested-pcr analysis of mitochondrial DNA. Afr J Biotechnol. (2010) 10:5670–6.
7. El-Sayed YS, Mohamed OI, Ashry KM, Abd El-Rahman SM. Using species-specific repeat and Pcr–Rflp in typing of DNA derived from blood of human and animal species. For Sci Med Pathol. (2010) 6:158–64. doi: 10.1007/s12024-009-9117-5
8. McLaughlin G, Doty KC, Lednev IK. Discrimination of human and animal blood traces via raman spectroscopy. For Sci Int. (2014) 238:91–5. doi: 10.1016/j.forsciint.2014.02.027
9. Pandiselvam R, Sruthi NU, Kumar A, Kothakota A, Thirumdas R, Ramesh SV, et al. Recent applications of vibrational spectroscopic techniques in the grain industry. Food Rev Int. (2021):1–31. doi: 10.1080/87559129.2021.1904253
10. Han F, Huang X, Aheto JH, Zhang X, Rashed MMA. Fusion of a low-cost electronic nose and fourier transform near-infrared spectroscopy for qualitative and quantitative detection of beef adulterated with duck. Anal Methods. (2022) 14:417–26. doi: 10.1039/D1AY01949J
11. Schmutzler M, Beganovic A, Böhler G, Huck CW. Methods for detection of pork adulteration in veal product based on ft-nir spectroscopy for laboratory, industrial and on-site analysis. Food Control. (2015) 57:258–67. doi: 10.1016/j.foodcont.2015.04.019
12. Lopez A, Insausti K, Jaren C, Pérez-Roncal C, Urrutia O, Beriain M, et al. Detection of minced lamb and beef fraud using nir spectroscopy. Food Control. (2018) 98:465–73. doi: 10.1016/j.foodcont.2018.12.003
13. Parastar H, van Kollenburg G, Weesepoel Y, van den Doel A, Buydens L, Jansen J. Integration of handheld nir and machine learning to “measure & monitor” chicken meat authenticity. Food Control. (2020) 112:107149. doi: 10.1016/j.foodcont.2020.107149
14. Leng T, Li F, Xiong L, Xiong Q, Zhu M, Chen Y. Quantitative detection of binary and ternary adulteration of minced beef meat with pork and duck meat by nir combined with chemometrics. Food Control. (2020) 113:107203. doi: 10.1016/j.foodcont.2020.107203
15. Mabood F, Boqué R, Alkindi AY, Al-Harrasi A, Al Amri IS, Boukra S, et al. Fast detection and quantification of pork meat in other meats by reflectance ft-nir spectroscopy and multivariate analysis. Meat Sci. (2020) 163:108084. doi: 10.1016/j.meatsci.2020.108084
16. Silva LCR, Folli GS, Santos LP, Barros IHAS, Oliveira BG, Borghi FT, et al. Quantification of beef, pork, and chicken in ground meat using a portable nir spectrometer. Vibrat Spectr. (2020) 111:103158. doi: 10.1016/j.vibspec.2020.103158
17. Teye E, Huang X-Y, Lei W, Dai H. Feasibility study on the use of fourier transform near-infrared spectroscopy together with chemometrics to discriminate and quantify adulteration in cocoa beans. Food Res Int. (2014) 55:288–93. doi: 10.1016/j.foodres.2013.11.021
18. Huang X, Teye E, Sam-Amoah L, Han F, Yao L, Tchabo W. Rapid measurement of total polyphenols content in cocoa beans by data fusion of nir spectroscopy and electronic tongue. Anal Methods. (2014) 6:5008. doi: 10.1039/c4ay00223g
19. Kumar Y, Chandrakant Karne S. Spectral analysis: a rapid tool for species detection in meat products. Trends Food Sci Technol. (2017) 62:59–67. doi: 10.1016/j.tifs.2017.02.008
20. Baxter MJ. Stepwise discriminant analysis in archaeometry: a critique. J Archaeol Sci. (1994) 21:659–66. doi: 10.1006/jasc.1994.1065
21. Huang GB, Zhu QY, Siew CK. Extreme learning machine: theory and applications. Neurocomputing. (2006) 70:489–501.
22. Guang-Bin H, Qin-Yu Z, Chee-Kheong S. Extreme learning machine: a new learning scheme of feedforward neural networks. Proceedings of the 2004 IEEE International Joint Conference on Neural Networks (IEEE Cat No04CH37541). Budapest: IEEE (2004).
23. Li H, Liang Y, Xu Q, Cao D. Key wavelengths screening using competitive adaptive reweighted sampling method for multivariate calibration. Anal Chim Acta. (2009) 648:77–84. doi: 10.1016/j.aca.2009.06.046
24. Han F, Huang X, Teye E, Gu F, Gu H. Nondestructive detection of fish freshness during its preservation by combining electronic nose and electronic tongue techniques in conjunction with chemometric analysis. Anal Methods. (2014) 6:529–36. doi: 10.1039/C3AY41579A
25. Wiedemair V, De Biasio M, Leitner R, Balthasar D, Huck C. Application of design of experiment for detection of meat fraud with a portable near-infrared spectrometer. Curr Anal Chem. (2018) 14:58–67. doi: 10.2174/1573411013666170207121113
26. Nduwamungu C, Ziadi N, Parent L-É, Tremblay GF, Thuriès L. Opportunities for, and limitations of, near infrared reflectance spectroscopy applications in soil analysis: a review. Can J Soil Sci. (2009) 89:531–41. doi: 10.4141/cjss08076
27. Dos Santos CAT, Páscoa RN, Porto PA, Cerdeira AL, González-Sáiz J, Pizarro C, et al. Raman spectroscopy for wine analyses: a comparison with near and mid infrared spectroscopy. Talanta. (2018) 186:306–14. doi: 10.1016/j.talanta.2018.04.075
28. Zhang L, Li G, Sun M, Li H, Wang Z, Li Y, et al. Kennard-stone combined with least square support vector machine method for noncontact discriminating human blood species. Infrared Phys Technol. (2017) 86:116–9. doi: 10.1016/j.infrared.2017.08.020
29. Han F, Zhang D, Aheto JH, Feng F, Duan T. Integration of a low-cost electronic nose and a voltammetric electronic tongue for red wines identification. Food Sci Nutr. (2020) 8:4330–9. doi: 10.1002/fsn3.1730
30. Azad MA, Akhter S, Hossain MR. A smart travel time prediction model for urban traffic using long short-term memory network. Proceedings of the International Conference on Engineering Research and Practice (iCERP2019). Dhaka: (2019).
Keywords: animal blood food, food fraud, FT-NIR, fast chemometrics, rapid detection
Citation: Han F, Ming L, Aheto JH, Rashed MMA, Zhang X and Huang X (2022) Authentication of duck blood tofu binary and ternary adulterated with cow and pig blood-based gel using Fourier transform near-infrared coupled with fast chemometrics. Front. Nutr. 9:935099. doi: 10.3389/fnut.2022.935099
Received: 03 May 2022; Accepted: 20 September 2022;
Published: 26 October 2022.
Edited by:
R. Pandiselvam, Central Plantation Crops Research Institute (ICAR), IndiaReviewed by:
Naveen Kumar Mahanti, Dr. Y.S.R. Horticultural University, IndiaCopyright © 2022 Han, Ming, Aheto, Rashed, Zhang and Huang. This is an open-access article distributed under the terms of the Creative Commons Attribution License (CC BY). The use, distribution or reproduction in other forums is permitted, provided the original author(s) and the copyright owner(s) are credited and that the original publication in this journal is cited, in accordance with accepted academic practice. No use, distribution or reproduction is permitted which does not comply with these terms.
*Correspondence: Fangkai Han, aGFuZmsxMUAxNjMuY29t
Disclaimer: All claims expressed in this article are solely those of the authors and do not necessarily represent those of their affiliated organizations, or those of the publisher, the editors and the reviewers. Any product that may be evaluated in this article or claim that may be made by its manufacturer is not guaranteed or endorsed by the publisher.
Research integrity at Frontiers
Learn more about the work of our research integrity team to safeguard the quality of each article we publish.