
95% of researchers rate our articles as excellent or good
Learn more about the work of our research integrity team to safeguard the quality of each article we publish.
Find out more
ORIGINAL RESEARCH article
Front. Nutr. , 06 December 2022
Sec. Clinical Nutrition
Volume 9 - 2022 | https://doi.org/10.3389/fnut.2022.933745
This article is part of the Research Topic Improving Body Composition and Functional Capacity in Chronic Kidney Disease Patients View all 6 articles
 Si Chen1†
 Xiaoyan Ma1†
 Xun Zhou1†
 Yi Wang1
 WeiWei Liang1
 Liang Zheng2Xiujuan Zang3
 Xiaobin Mei4Yinghui Qi5Yan Jiang3Shanbao Zhang5
 Jinqing Li1
 Hui Chen1
 Yingfeng Shi1
 Yan Hu1
 Min Tao1
 Shougang Zhuang1,6
 Na Liu1*
Background and aim: Protein-energy wasting (PEW) is critically associated with the reduced quality of life and poor prognosis of hemodialysis patients. However, the diagnosis criteria of PEW are complex, characterized by difficulty in estimating dietary intake and assessing muscle mass loss objectively. We performed a cross-sectional study in hemodialysis patients to propose a novel PEW prediction model.
Materials and methods: A total of 380 patients who underwent maintenance hemodialysis were enrolled in this cross-sectional study. The data were analyzed with univariate and multivariable logistic regression to identify influencing factors of PEW. The PEW prediction model was presented as a nomogram by using the results of logistic regression. Furthermore, receiver operating characteristic (ROC) and decision curve analysis (DCA) were used to test the prediction and discrimination ability of the novel model.
Results: Binary logistic regression was used to identify four independent influencing factors, namely, sex (P = 0.03), triglycerides (P = 0.009), vitamin D (P = 0.029), and NT-proBNP (P = 0.029). The nomogram was applied to display the value of each influencing factor contributed to PEW. Then, we built a novel prediction model of PEW (model 3) by combining these four independent variables with part of the International Society of Renal Nutrition and Metabolism (ISRNM) diagnostic criteria including albumin, total cholesterol, and BMI, while the ISRNM diagnostic criteria served as model 1 and model 2. ROC analysis of model 3 showed that the area under the curve was 0.851 (95%CI: 0.799–0.904), and there was no significant difference between model 3 and model 1 or model 2 (all P > 0.05). DCA revealed that the novel prediction model resulted in clinical net benefit as well as the other two models.
Conclusion: In this research, we proposed a novel PEW prediction model, which could effectively identify PEW in hemodialysis patients and was more convenient and objective than traditional diagnostic criteria.
Chronic kidney disease (CKD) is a global public health problem. CKD progresses to a terminal stage termed as end-stage renal disease (ESRD), requiring renal replacement therapy (hemodialysis, peritoneal dialysis, and kidney transplantation). According to the Renal Data System, the number of patients with ESRD requiring renal replacement therapy is increasing year by year in the United States, reaching nearly 7,50,000 in 2019 (1). Sixty-three percent of these individuals receive maintenance hemodialysis (MHD) (1). Despite improving survival rates, only 57% of MHD patients are still alive 3 years after their first treatment (1). The main reasons for such a high-mortality rate are cardiovascular diseases (2). However, these factors do not fully explain the increased risk of mortality. With the progression of CKD, patients are accompanied by nutritional disorder and muscle catabolism, leading to protein-energy wasting (PEW) (3–5). PEW is a multifactorial, maladaptive metabolic state characterized by a loss of body protein mass and energy reserves and is a major cause of high morbidity and mortality in patients with CKD (6, 7).
It has been revealed that PEW is prevalent in patients with CKD. Based on a meta-analysis, the global prevalence of PEW is estimated to be 11–54% among patients with CKD (stages 3–5) and 28–54% among dialysis patients (8). Up to now, the mechanism of PEW is still unclear, and the current physiopathological mechanisms of PEW mainly include inflammation, insulin resistance, oxidative stress, hormone dysregulation, and metabolic acidosis (9–11). Low-grade inflammation is a common hallmark of CKD (12). Recent studies have demonstrated that inflammatory cytokines such as interleukin-18 (IL-18), interleukin-6 (IL-6), and galectin-3 are critically involved in PEW (13, 14). Persistent inflammation may damage the structure and function of different tissues, thus destroying the normal inter-organ crosstalk and leading to metabolic disorders (14). Furthermore, inflammation can lead to adipose tissue browning, muscle atrophy, and increased resting energy expenditure (REE), which ultimately lead to PEW (15). Recent basic and clinical studies demonstrate that chronic kidney disease–mineral and bone disorder (CKD–MBD) directly induces inflammation and PEW, and high circulating levels of parathyroid hormone (PTH) have been proven to induce the inflammatory response that leads to PEW (16). PTH can also increase adipose tissue browning and REE, which explains the clinical association between secondary hyperparathyroidism and PEW in hemodialysis patients (17–20). In addition, N-terminal pro-B-type natriuretic peptide (NT-proBNP), as a robust biomarker of muscle wasting, is elevated in MHD patients and can independently predict PEW (21–23).
The International Society of Renal Nutrition and Metabolism (ISRNM) recommends four main categories to be recognized for the diagnosis of PEW (24): low levels of biochemical criteria (i.e., albumin, prealbumin, and cholesterol); low body weight, reduced total body fat, or weight loss; a decrease in muscle mass (i.e., muscle wasting and reduced mid-arm muscle circumference area); and low protein or energy intake. At least three out of the four listed categories must be satisfied to diagnose kidney disease-related PEW. However, the identification and diagnosis of PEW rely on the clinical judgment process, depending on meeting multiple criteria, including serum biochemistry, body weight status, muscle mass prediction, dietary energy, and protein intake (10). In particular, estimating dietary intake for patients with chronic diseases is difficult, and the data obtained may not be reliable (25, 26). In this research, we conducted the analysis of independent influencing factors of PEW and proposed a novel PEW prediction model, in order to make the diagnosis of PEW more objective and convenient, thus improving the life quality and reducing the mortality of MHD patients.
This was a cross-sectional study in MHD patients from four different medical centers in Shanghai, including Shanghai East Hospital, Shanghai Songjiang District Central Hospital, Shanghai Punan Hospital, and Shanghai Gongli Hospital. The study recruited MHD patients according to the following inclusion criteria: age range 18–75 years; maintenance hemodialysis for over 6 months; and consented to participate in all aspects of the study. Patients with the following conditions were excluded: pregnancy; thyroid dysfunction; corticosteroid or immunosuppressive medication; systemic infections, cardiovascular events, operations, trauma, and tumors for which a patient had received radiotherapy or chemotherapy within 3 months; active communicable diseases; patients enrolled in other clinical studies; poor compliance; and patients who underwent nutritional interventions. A total of 380 participants were ultimately included in this study, including 190 participants from Shanghai East Hospital, 92 participants from Shanghai Songjiang District Central Hospital, 60 participants from Shanghai Punan Hospital, and 38 participants from Shanghai Gongli Hospital. The Ethics Committee of Shanghai East Hospital approved the study protocol and adhered to the Declaration of Helsinki. Each patient provided written informed consent to participate in the study. This trial was registered at ClinicalTrials.gov (ChiCTR2000038127).
According to the diagnostic criteria proposed by the ISRNM in 2008 (24), at least three out of the four listed categories must be satisfied for the diagnosis of kidney disease-related PEW (each criterion should be documented on at least three occasions, preferably 2–4 weeks apart): (1) serum chemistry: serum albumin <38 g/L, serum prealbumin <0.3 g/L, or serum cholesterol <1 g/L; (2) body mass: body mass index (BMI) <23 kg/m2, unintentional 5% weight loss over 3 months or 10% weight loss over 6 months, and total body fat percentage <10%; (3) muscle mass: reduced 5% muscle mass over 3 months or 10% over 6 months, reduction of mid-arm muscle circumference (MAMC) area over 10% in relation to 50th percentile of reference population, and creatinine appearance; and (4) dietary protein intake (DPI): unintentional low DPI < 0.80 g/kg per day for at least 2 months for dialysis patients or DPI < 0.60 g/kg per day for patients with CKD stages 2–5.
Demographic and clinical data including age, sex, education level, height, weight, primary renal disease, comorbidities (hypertension, diabetes, hyperlipidemia, stroke, and cardiovascular disease), systolic blood pressure, and diastolic blood pressure were collected. BMI was calculated by dividing the dry weight of dialysis patients by their height^2. MAMC was calculated by using the following formula: MAMC = arm circumference (mm)–3.14 * triceps skin-fold thickness (mm) (27). We used a 3-day dietary questionnaire to record the dietary intake of each patient for three consecutive days (including two working days and one weekend) to estimate their DPI (3).
Blood samples were collected following an overnight fast (before dialysis). Biochemistry data including serum albumin (g/L), serum prealbumin (mg/L), serum bilirubin (μmol/L), alanine aminotransferase (U/L), aspartate aminotransferase (U/L), serum creatinine (μmol/L), blood urea nitrogen (mmol/L), serum uric acid (μmol/L), triglyceride (TC, mmol/L), total cholesterol (TG, mmol/L), high-density lipoprotein cholesterol (HDL-c, mmol/L), low-density lipoprotein cholesterol (LDL-c, mmol/L), fasting blood glucose (mmol/L), serum calcium (mmol/L), serum magnesium (mmol/L), serum phosphorous (mmol/L), serum iron (μmol/L), ferritin (ng/mL), PTH (pg/mL), vitamin D (ng/mL), NT-proBNP (ng/L), lymphocyte count (10^9/L), hemoglobin (g/L), C-reactive protein (CRP, mg/L), and urea clearance index (Kt/V urea) were collected. Serum albumin, bilirubin, alanine aminotransferase, aspartate aminotransferase, creatinine, blood urea nitrogen, uric acid, TC, TG, HDL-c, LDL-c, fasting blood glucose, serum calcium, serum magnesium, serum phosphorous, serum iron, ferritin, hemoglobin, CRP, and PTH were measured by enzymatic colorimetry; prealbumin was measured by immunoturbidimetry; vitamin D was measured by competition method; and NT-proBNP was measured by double antibody sandwich method. All central laboratory data detection methods were unified.
Continuous variables were presented as mean and standard deviation or median and interquartile ranges. Categorical variables were presented as counts and percentages. The independent sample t-test, Mann–Whitney U test, or χ2 test was used to compare the differences between PEW and non-PEW participants. The data were Ln-transformed to reduce skew. Then, univariate logistic regression was used to identify potential factors; factors with an associated P-value of less than 0.05 were entered into both forward and backward conditional multivariable logistic regression procedures. The prediction strength was quantified as odds ratios (ORs) with 95% confidence intervals (CIs). The function of the “rms” package in R software was invoked to establish the nomogram model based on the results of multivariable logistic regression.
Model stability was assessed via bootstrap analysis (plots of predicted versus observed outcomes, 1,000 bootstrap samples), a graphic representation of the relationship between the observed outcome frequencies and the predicted probabilities. The predictions should fall on a 45-degree diagonal line in a well-calibrated model. Model discrimination was assessed by the receiver operating characteristic (ROC) and quantified by the area under the ROC curve. DCA was used to estimate and compare clinical benefits between different prediction models. Introducing “threshold probability” to trigger medical intervention under the same threshold probability, if the nomogram brings a higher net benefit to patients, its clinical practicability will be better. All probabilities were two-tailed, and the level of significance was set at 0.05. Statistical analysis was performed using SPSS (version 23.0) and RStudio (version 2021.09.1 + 372).
Six hundred and twenty hemodialysis patients from four centers in Shanghai were included in the study, and 240 patients were excluded according to the inclusion criteria (Figure 1). Three hundred and eighty patients were finally enrolled and were partitioned into two groups by the diagnostic criteria of PEW (24): PEW group (n = 175, 98 male and 77 female patients) and non-PEW group (n = 205, 141 male and 64 female patients). The criteria met by the 175 patients diagnosed with PEW are listed in Table 1. The prevalence of PEW was 46.05%. The female patients were presented with a significantly increased incidence of PEW compared with the male patients (P < 0.05). The etiologies of participants are given in Table 2: hypertensive nephropathy (10.79%), diabetic nephropathy (24.26%), chronic glomerulonephritis (31.58%), nephrotic syndrome (2.89%), IgA nephropathy (2.10%), purpura nephritis (0.79%), obstructive nephropathy (0.79%), polycystic renal disease (3.95%), and unknown etiology (21.84%). There was no difference between the etiologies of the PEW group and the non-PEW group (P = 0.676).
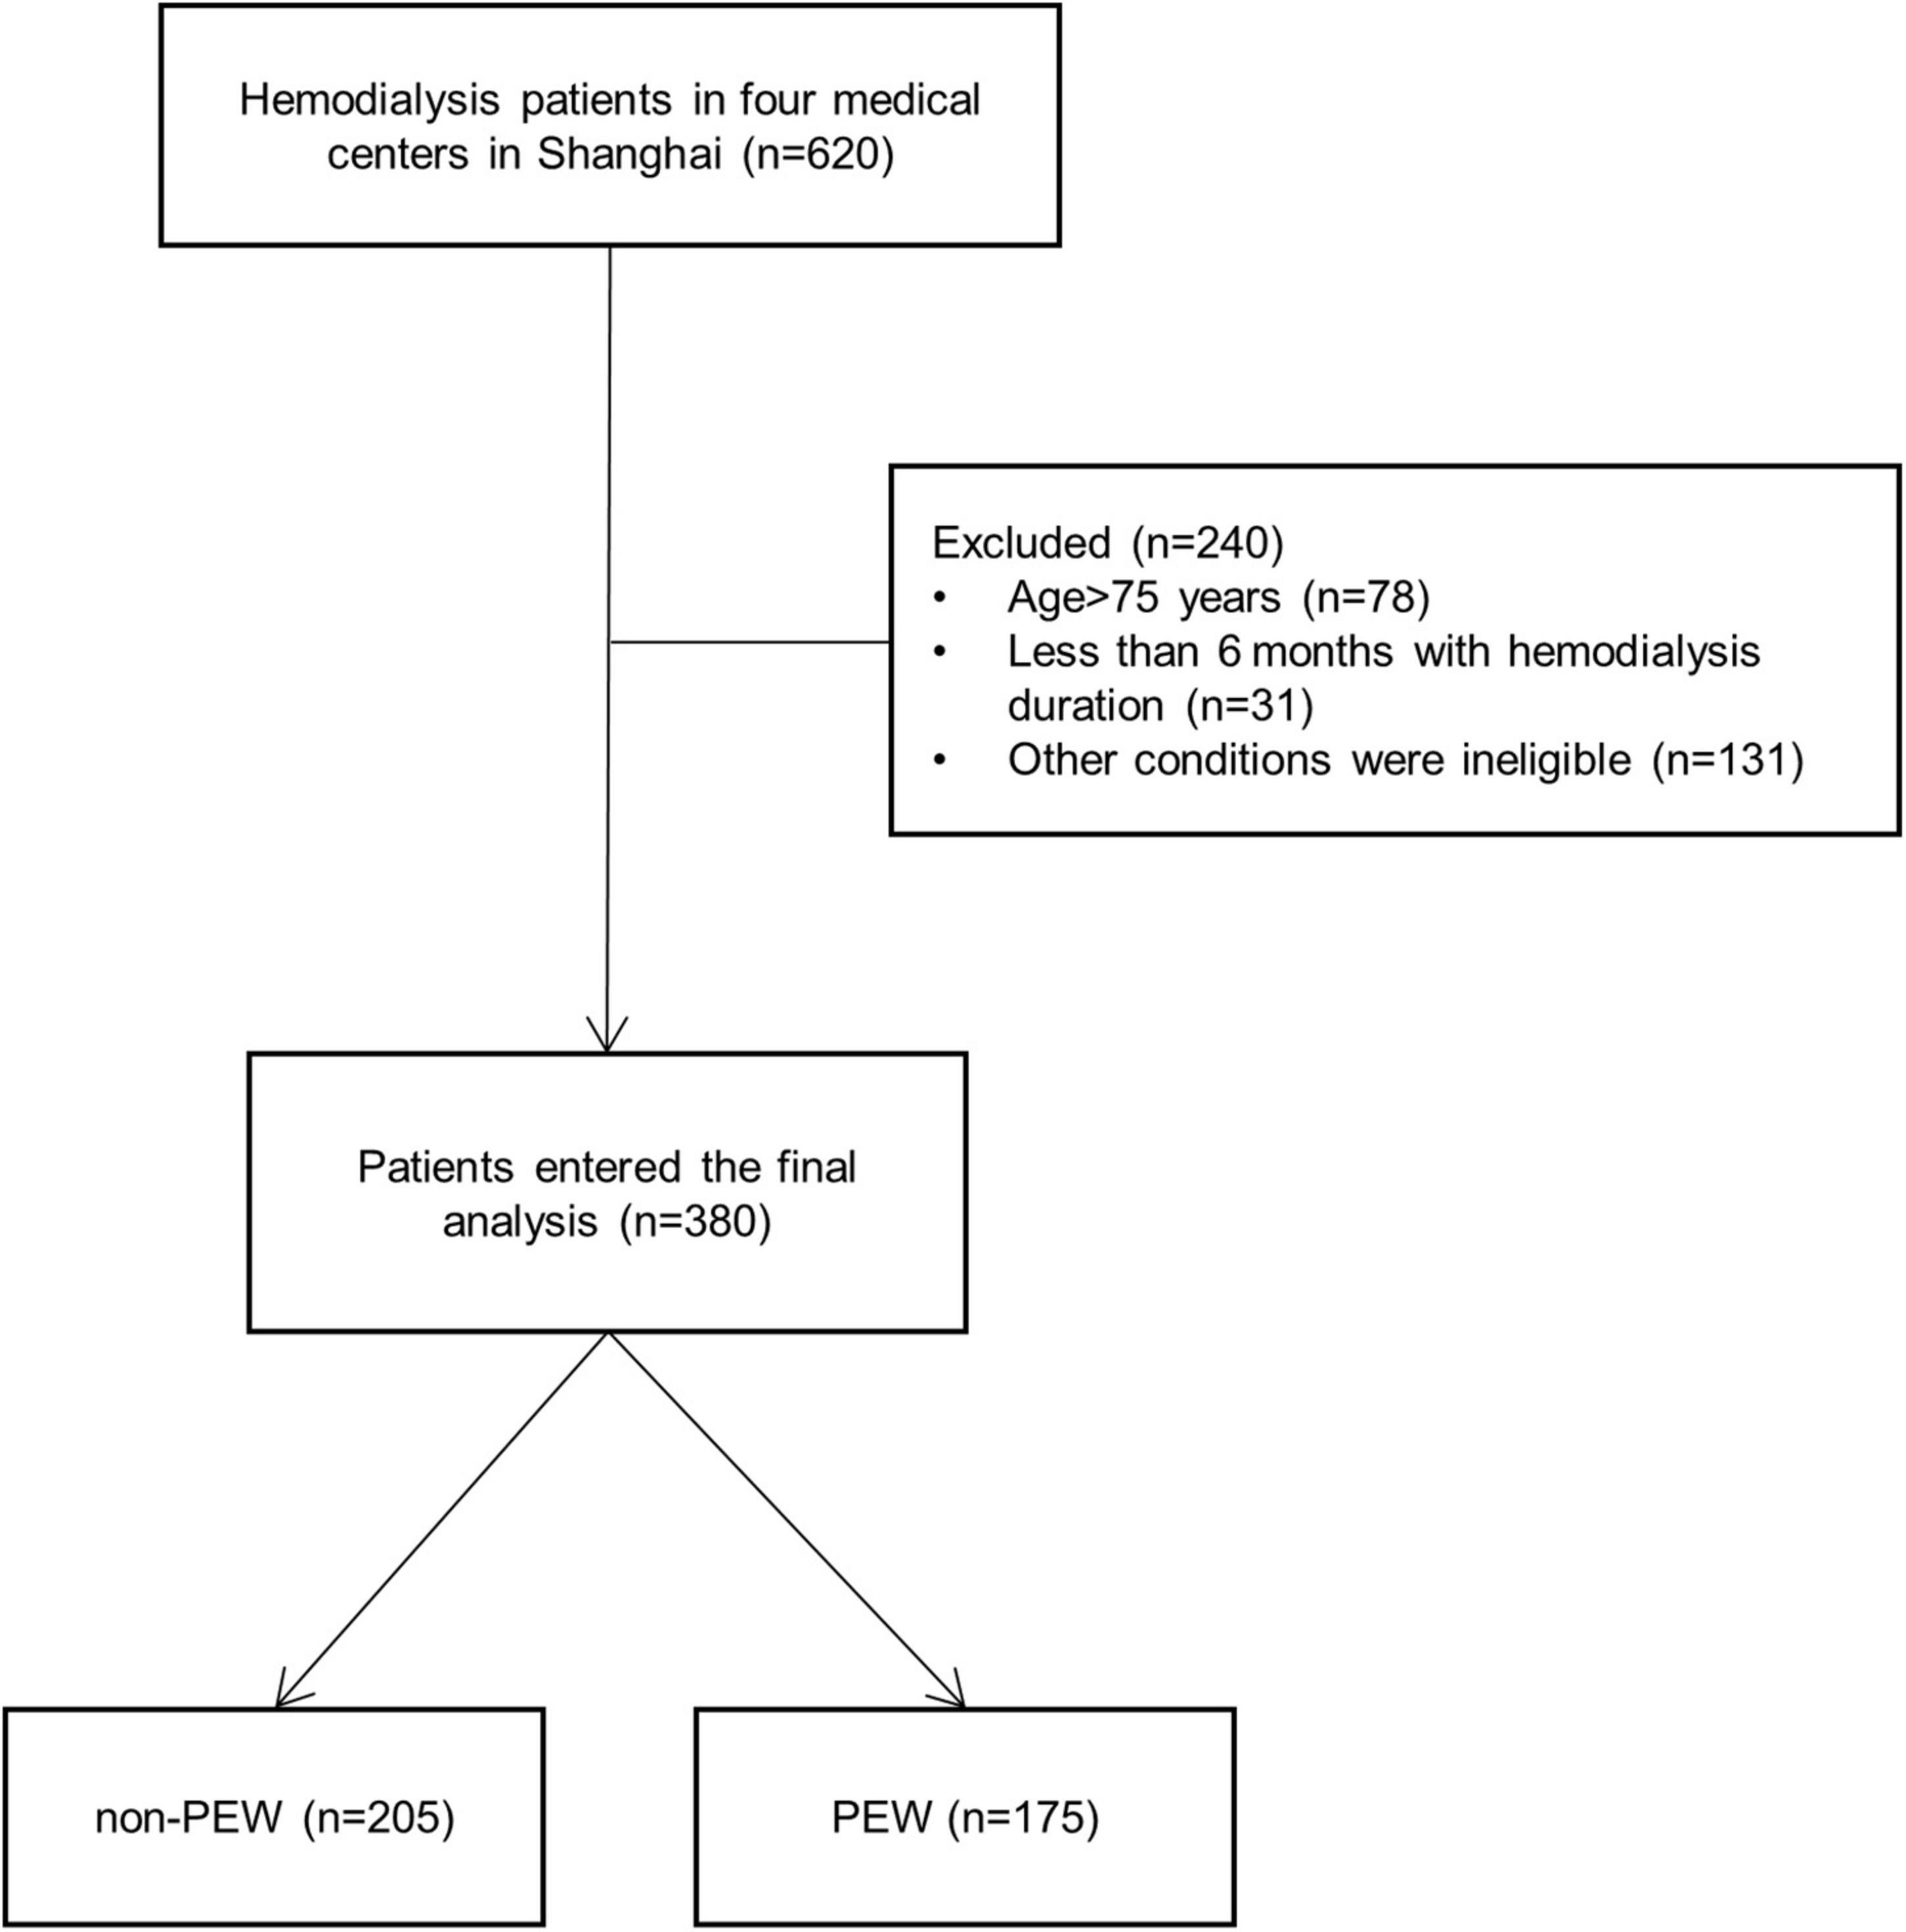
Figure 1. Flowchart of the protein-energy wasting (PEW) study. Six hundred and twenty hemodialysis patients from four centers in Shanghai were included in the study, and 240 patients were excluded according to the criteria. Three hundred and eighty patients were finally enrolled, consisting of 175 PEW patients and 205 non-PEW patients. PEW, protein-energy wasting.

Table 1. The criteria met by the 175 patients diagnosed with protein-energy depletion (PEW).
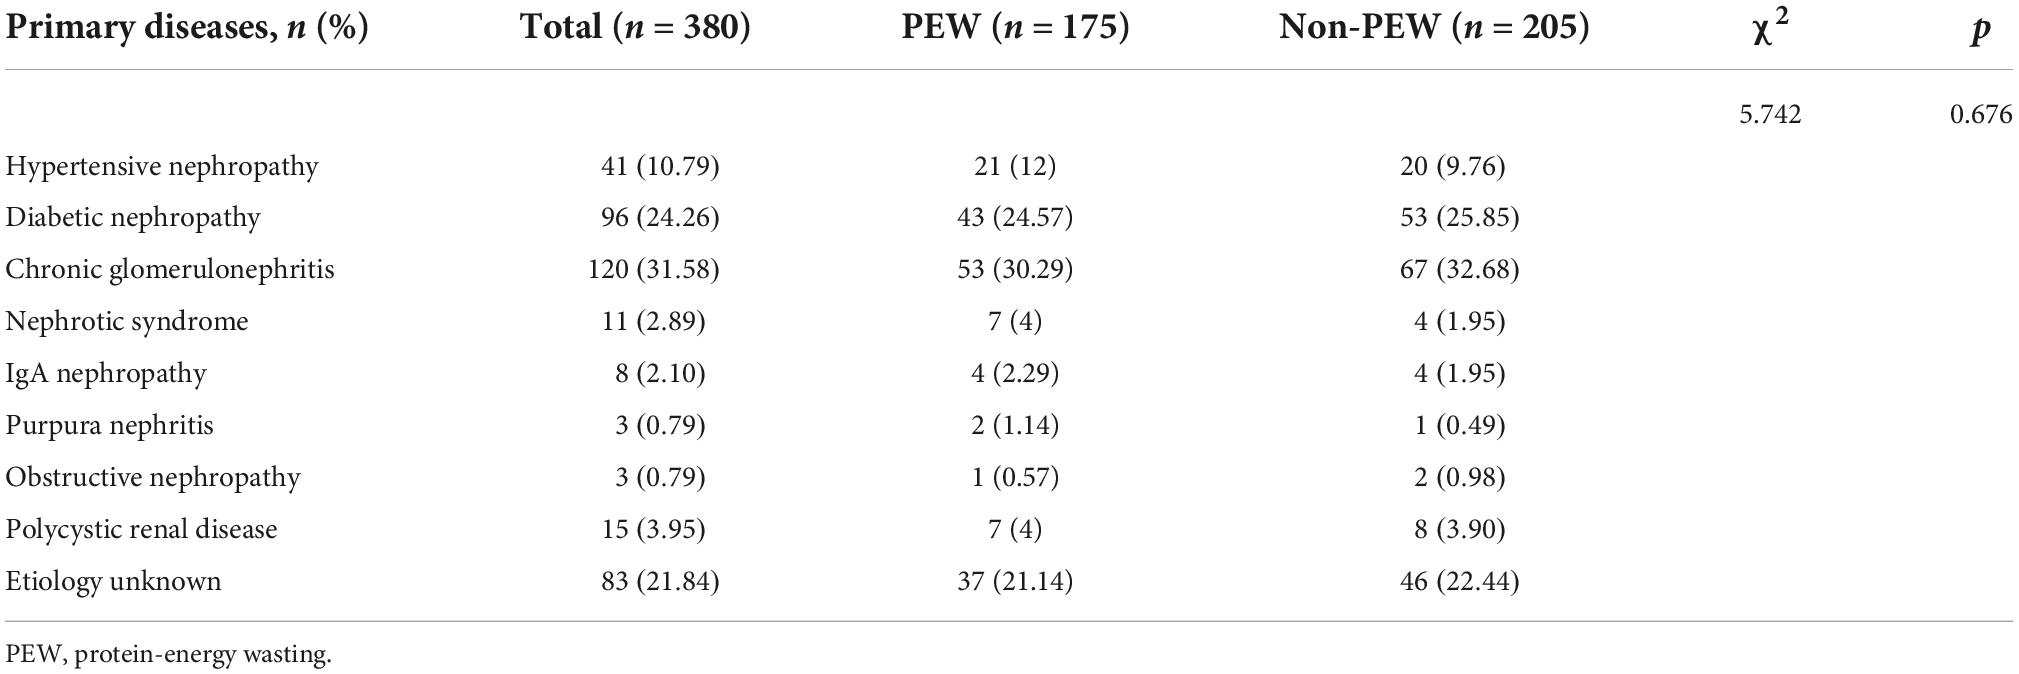
Table 2. Primary diseases of the patients.
The clinical characteristics and biochemical data of all participants are summarized in Table 3. The median age of patients was 63 (interquartile range 55–68) years in the PEW group and 61 (interquartile range 52–68) years in the non-PEW group. There were significant differences between the two groups regarding sex, education level, monthly frequency of HD, diabetes, and hyperlipidemia (all P < 0.05). In terms of the biochemical parameters, albumin, prealbumin, TG, creatinine, blood urea nitrogen, blood uric acid, TC, HDL-c, LDL-c, serum phosphorous, serum iron, vitamin D, NT-proBNP, hemoglobin, and Kt/V urea were significantly different between the PEW group and the non-PEW group (all P < 0.05).
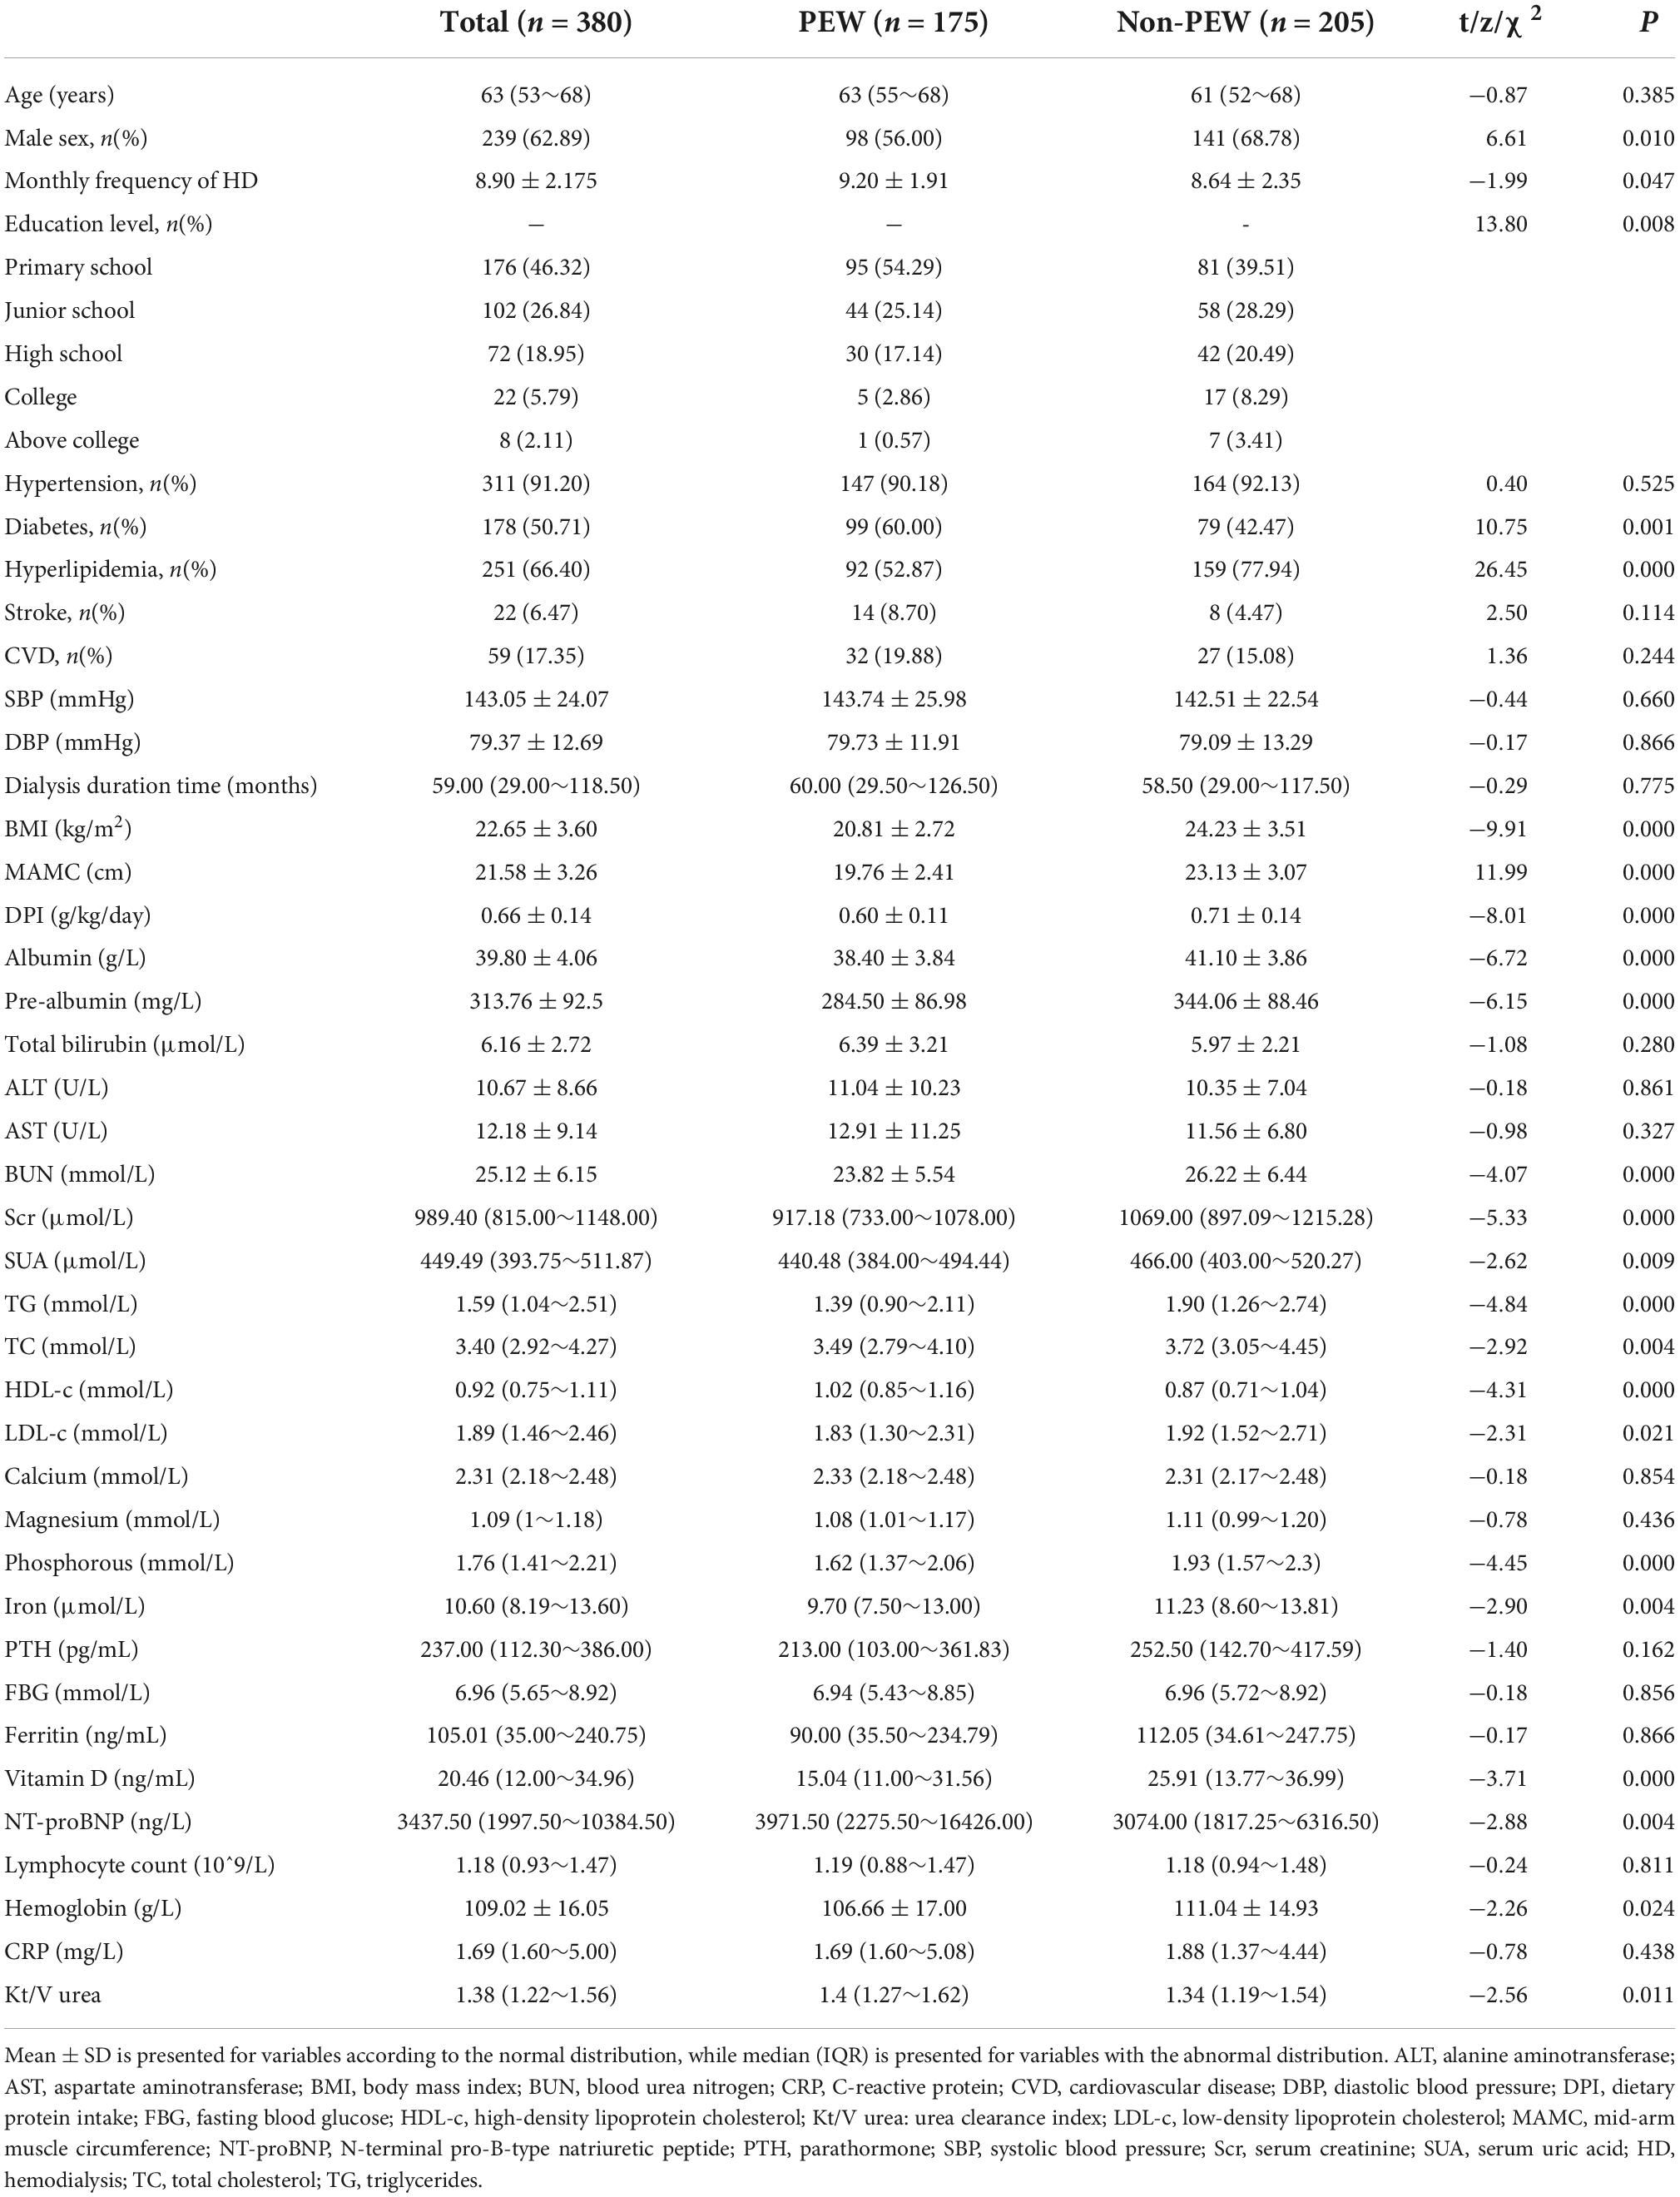
Table 3. General information and clinical characteristics of participants.
We used binary logistic regression to identify significant predictors (P < 0.05) and then fit a model using significant predictors (P < 0.05) which were clinically significant. Variables of biochemical parameters were Ln-transformed to approximate normality for analysis. The data were analyzed with univariate and multivariable logistic regression to identify influencing factors of PEW (Table 4). We included all the variables with a p-value less than 0.05 into the multivariate logistic regression model (including monthly frequency of HD, sex, diabetes, BUN, Scr, TG, LDL-c, HDL-c, phosphorous, iron, PTH, vitamin D, NT-proBNP, hemoglobin, CRP, Kt/V urea, and ferritin). Tolerance was greater than 0.1 and variance inflation factor (VIF) was less than 10, indicating no multicollinearity (Supplementary Table 1). Based on the Akaike information criterion (AIC) results, TG (OR = 0.85, 95% CI 0.75–0.96, P = 0.00995) and vitamin D (OR = 0.84, 95% CI 0.72–0.98, P = 0.029) reduced the risk of PEW, while NT-proBNP increased the risk of PEW (P = 0.029, OR = 1.07, 95% CI 1.01, 1.14). Furthermore, the risk of PEW in female patients was 1.20 times higher than that in male patients (OR = 1.20, 95% CI 1.02–1.42, P = 0.03). According to the results of the logistic regression, we built a novel prediction model of PEW by combining four independent influencing factors with part of the ISRNM diagnostic criteria (albumin + TC + BMI + sex + TG + vitamin D + NT-proBNP). The nomogram was constructed by this novel model (Figure 2). Based on the multivariate logistic regression results, the value level of each influencing factor was scored according to its contribution degree to the outcome variable (the incidence of PEW). Then, each predictor was assigned a specific grading value. Finally, the predicted value of the incidence of PEW was derived from the aggregate score of four influencing factors.
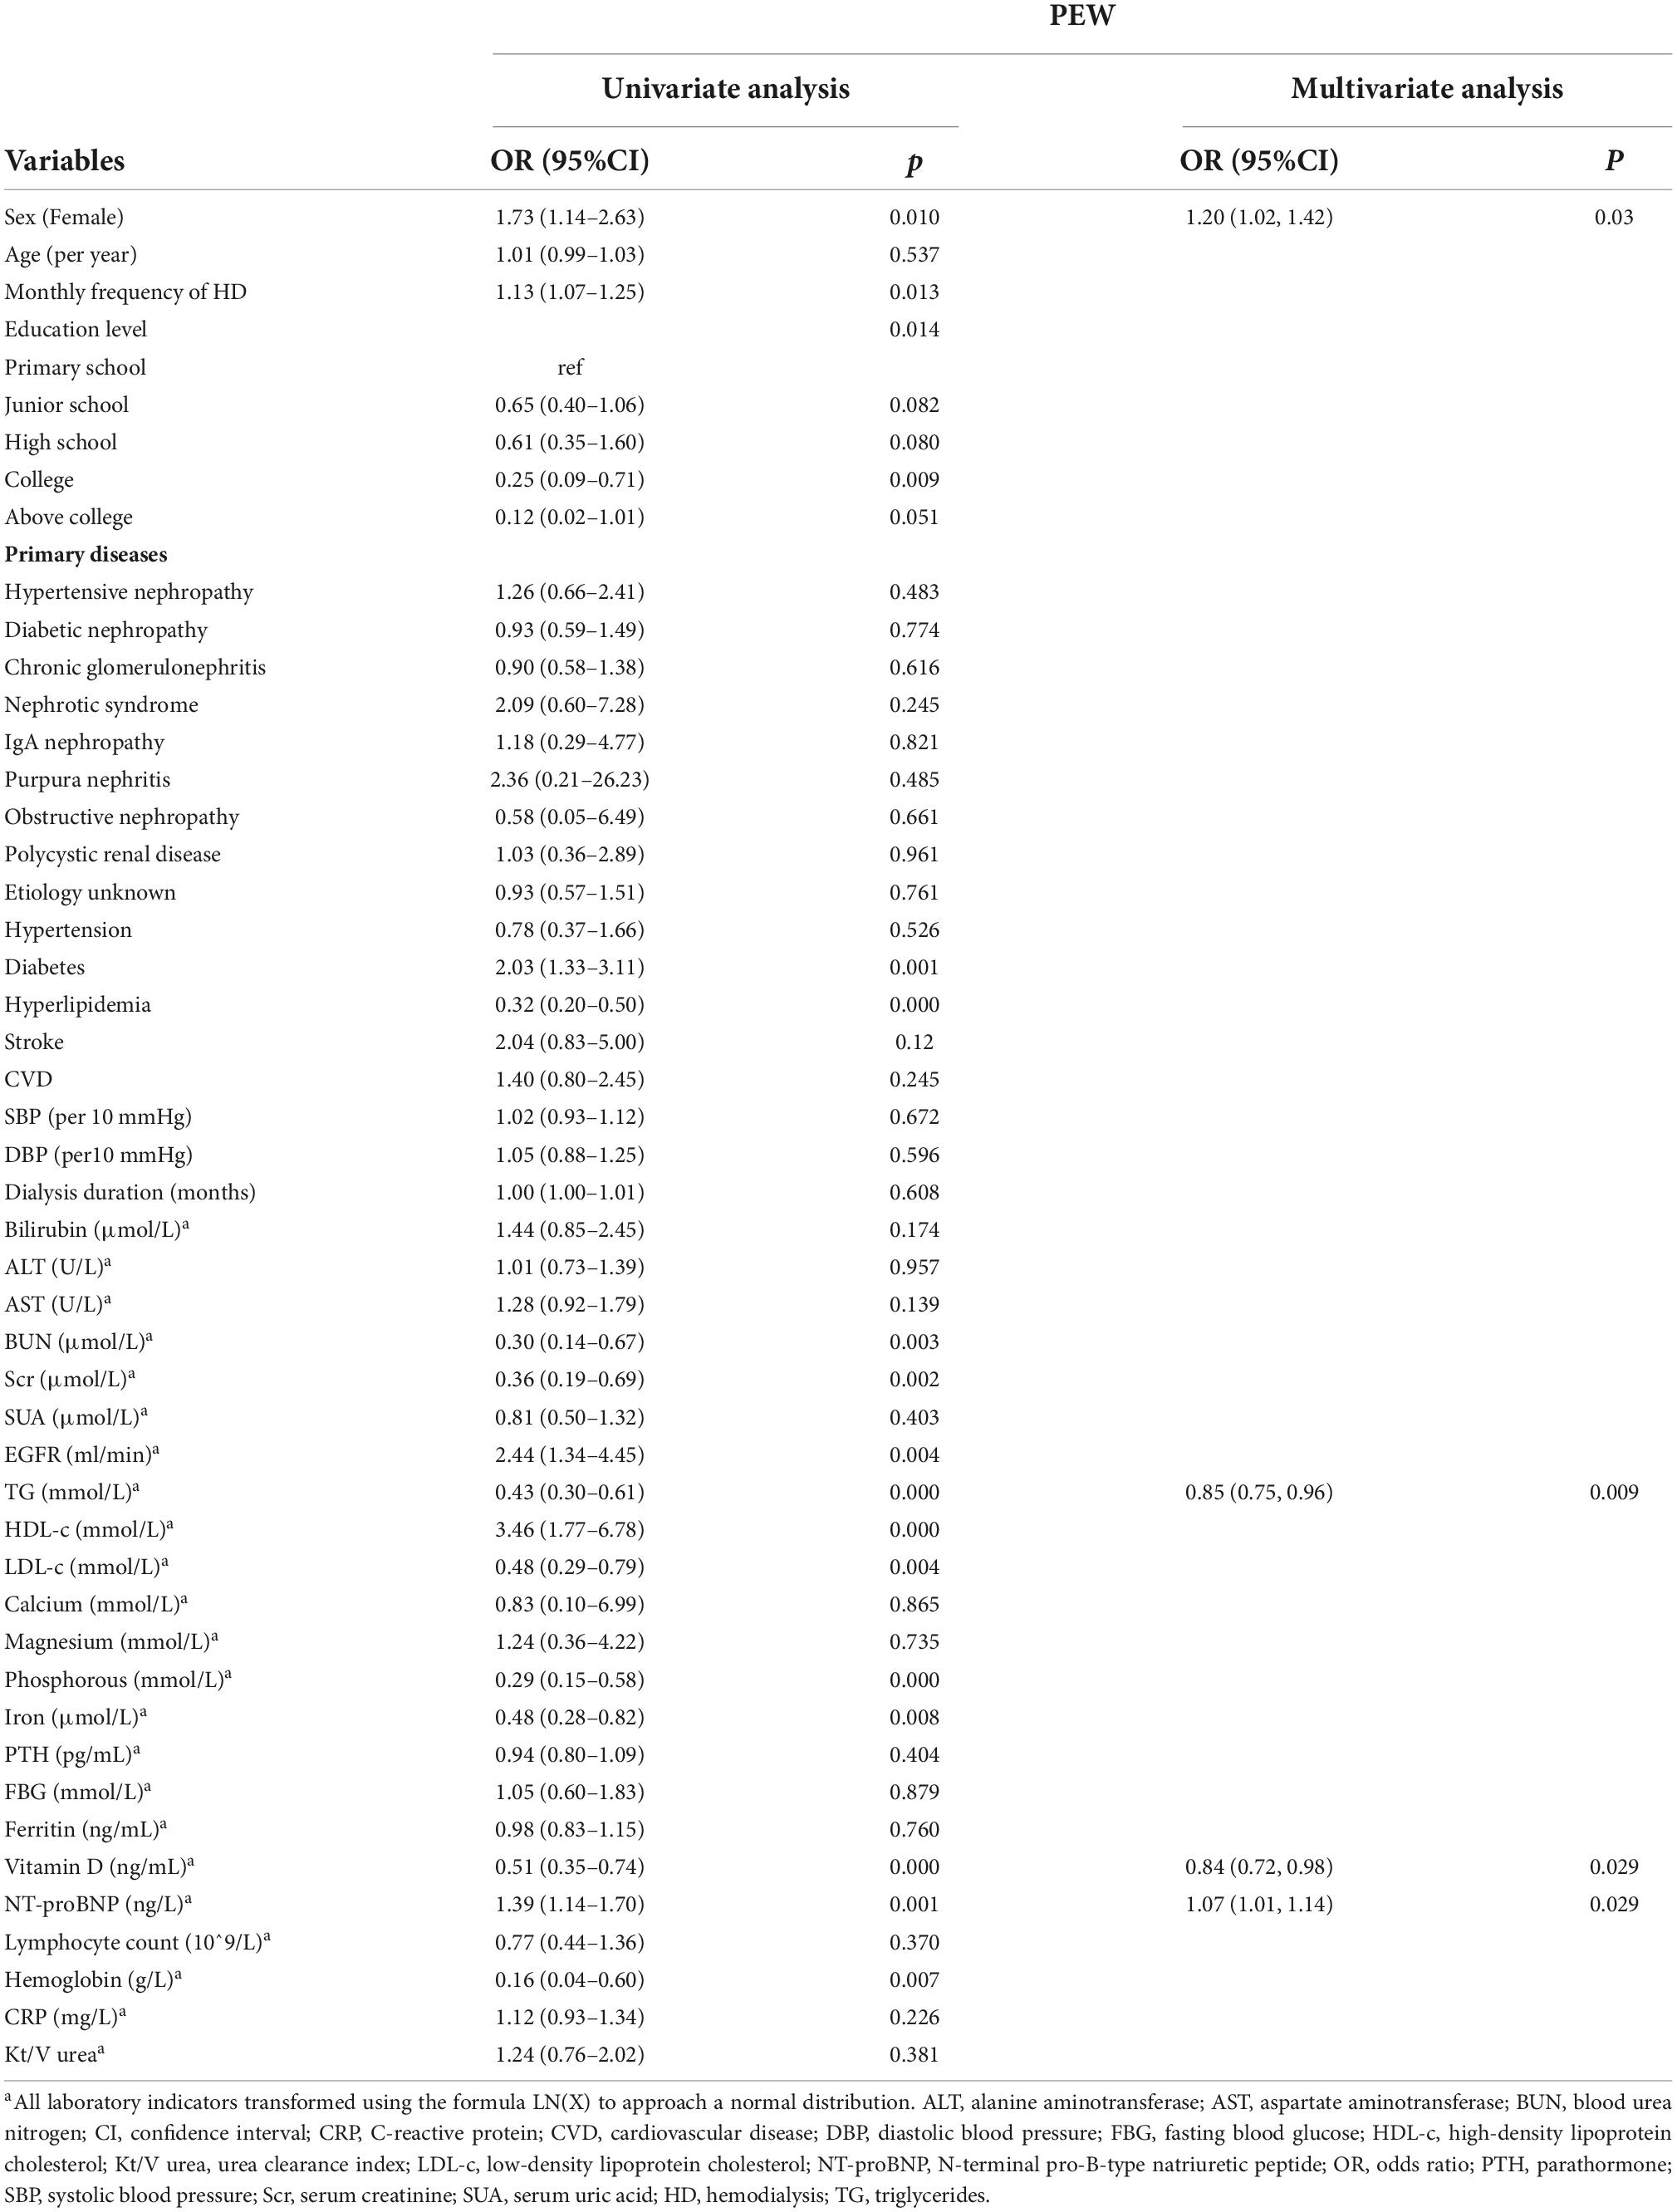
Table 4. Odds ratios and 95% confidence intervals from multivariate logistic analysis of risk factors related to protein-energy depletion (PEW).
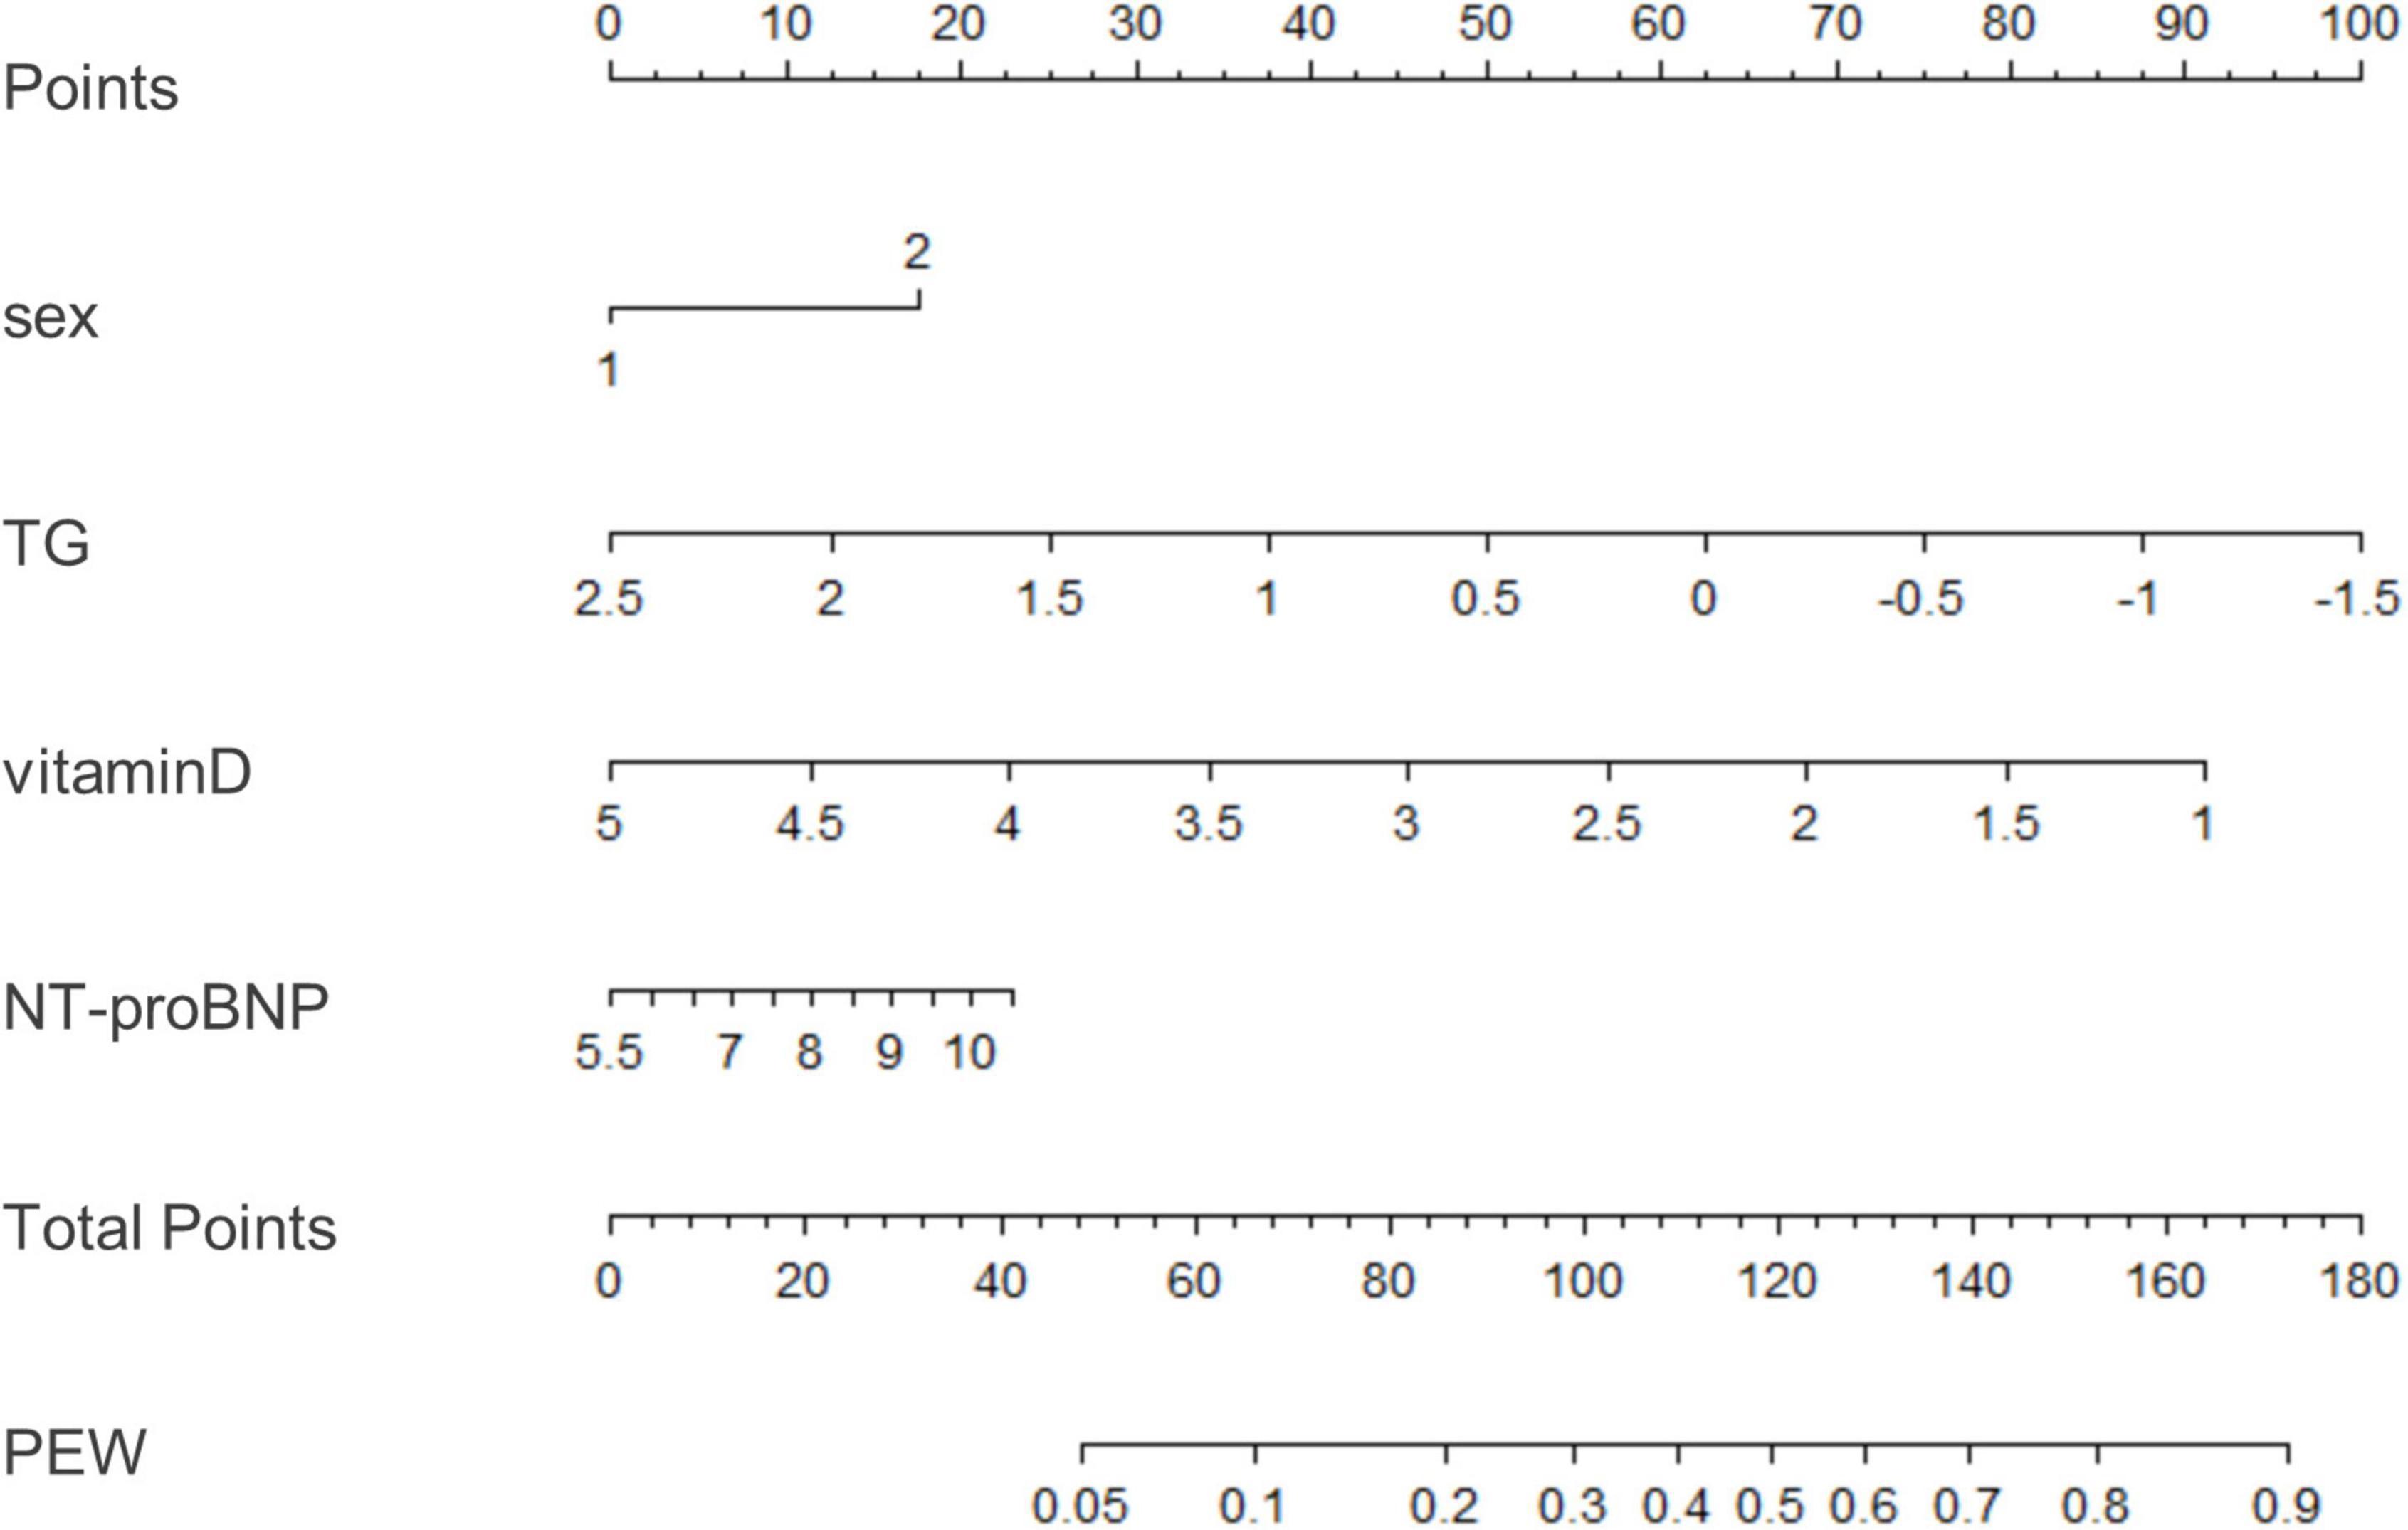
Figure 2. A nomogram for predicting risk of protein-energy wasting (PEW) in maintenance hemodialysis (MHD) patients. Based on the multivariate logistic regression results, the value level of each influencing factor was scored according to its contribution degree to the outcome variable. Then, each predictor was assigned a specific grading value. Finally, the predicted value of the incidence of PEW was derived from the aggregate score of four influencing factors, namely, sex, TG, vitamin D, and NT-proBNP. Sex: 1–male; 2–female. TG, triglyceride; NT-proBNP, N-terminal pro-B-type natriuretic peptide; PEW, protein-energy wasting.
The clinical effectiveness of the nomogram was demonstrated by the calibration curve, which predicted the probability stratification of subjects with the bootstrap (B = 1,000) technique. The calibration curve showed good agreement between prediction and observation in the probability of PEW (Figure 3). We used the nomogramEx package in RStudio to calculate the scores of each variable in model 3 (all variables were Ln-transformed) (Figure 4): BMI points = −125 * BMI + 437.5; albumin points = −53.697 * albumin + 230.899; TC points = −17.863 * TC + 46.445; sex male points = 0, sex female points = 8.225; TG points = −6.719 * TG + 16.797; vitamin D points = −14.693 * vitamin D + 73.465; NT-proBNP points = 2.235 * NT-proBNP-13.411. The predicted value of the incidence of PEW was derived from the aggregate score of these influencing factors. We built two reference models with the ISRNM diagnosis criteria, namely, model 1 (albumin + TC + BMI + MAMC) and model 2 (albumin + TC + BMI + DPI). According to the results of the logistic regression, we built model 3 by combining four independent influencing factors with part of the ISRNM diagnostic criteria (albumin + TC + BMI + sex + TG + vitamin D + NT-proBNP). The DCA curve revealed that the net clinical benefit of model 3 was quite similar to that of model 1 and model 2 (Figure 5). In Figure 5, the abscissa was the threshold probability. When the predicted diagnostic probability reached a certain value, the PEW risk probability of patient “i” was denoted as Pi. When Pi reached a certain threshold (denoted as Pt), it was defined as positive and some intervention (such as nutritional intervention) should be taken. The horizontal line represented that all of the samples were negative without intervention, and the net benefit was “0.” The slash line indicated that all samples were positive with several interventions, and the net benefit was a backslash with a negative slope. It could be seen from the DCA curve in Figure 5 that the curve of model 3 was far away from the two extreme curves, which was within a wide Pt range, proving its high clinical practical value. Furthermore, we made a supplementary chart of clinical impact curve (Supplementary Figure 1). Model 3 was used to predict the risk stratification of 1,000 people. The “loss/benefit” coordinate axis was displayed with eight scales, and confidence intervals were displayed. The red curve (number high risk) represented the number of people classified as positive (high risk) by model 3 under each threshold probability; the blue curve (number high risk with the outcome) showed the number of true positives under each threshold probability. After comprehensive consideration of the loss–benefit ratio, it was considered that the threshold value of 60% could indicate the optimal benefit of diagnosing PEW population. Figure 6 shows the ROC curves of three models, namely, model 1 (albumin + TC + BMI + MAMC; AUC = 0.914, 95% CI 0.886–0.943); model 2 (albumin + TC + BMI + DPI; AUC = 0.902, 95% CI 0.871–0.933); and model 3 (albumin + TC + BMI + sex + TG + vitamin D + NT-proBNP; AUC = 0.851, 95% CI 0.799–0.904). A pairwise comparison of ROC curves showed that there was no difference between model 3 and model 1 or model 2 in identifying PEW (all P > 0.05).
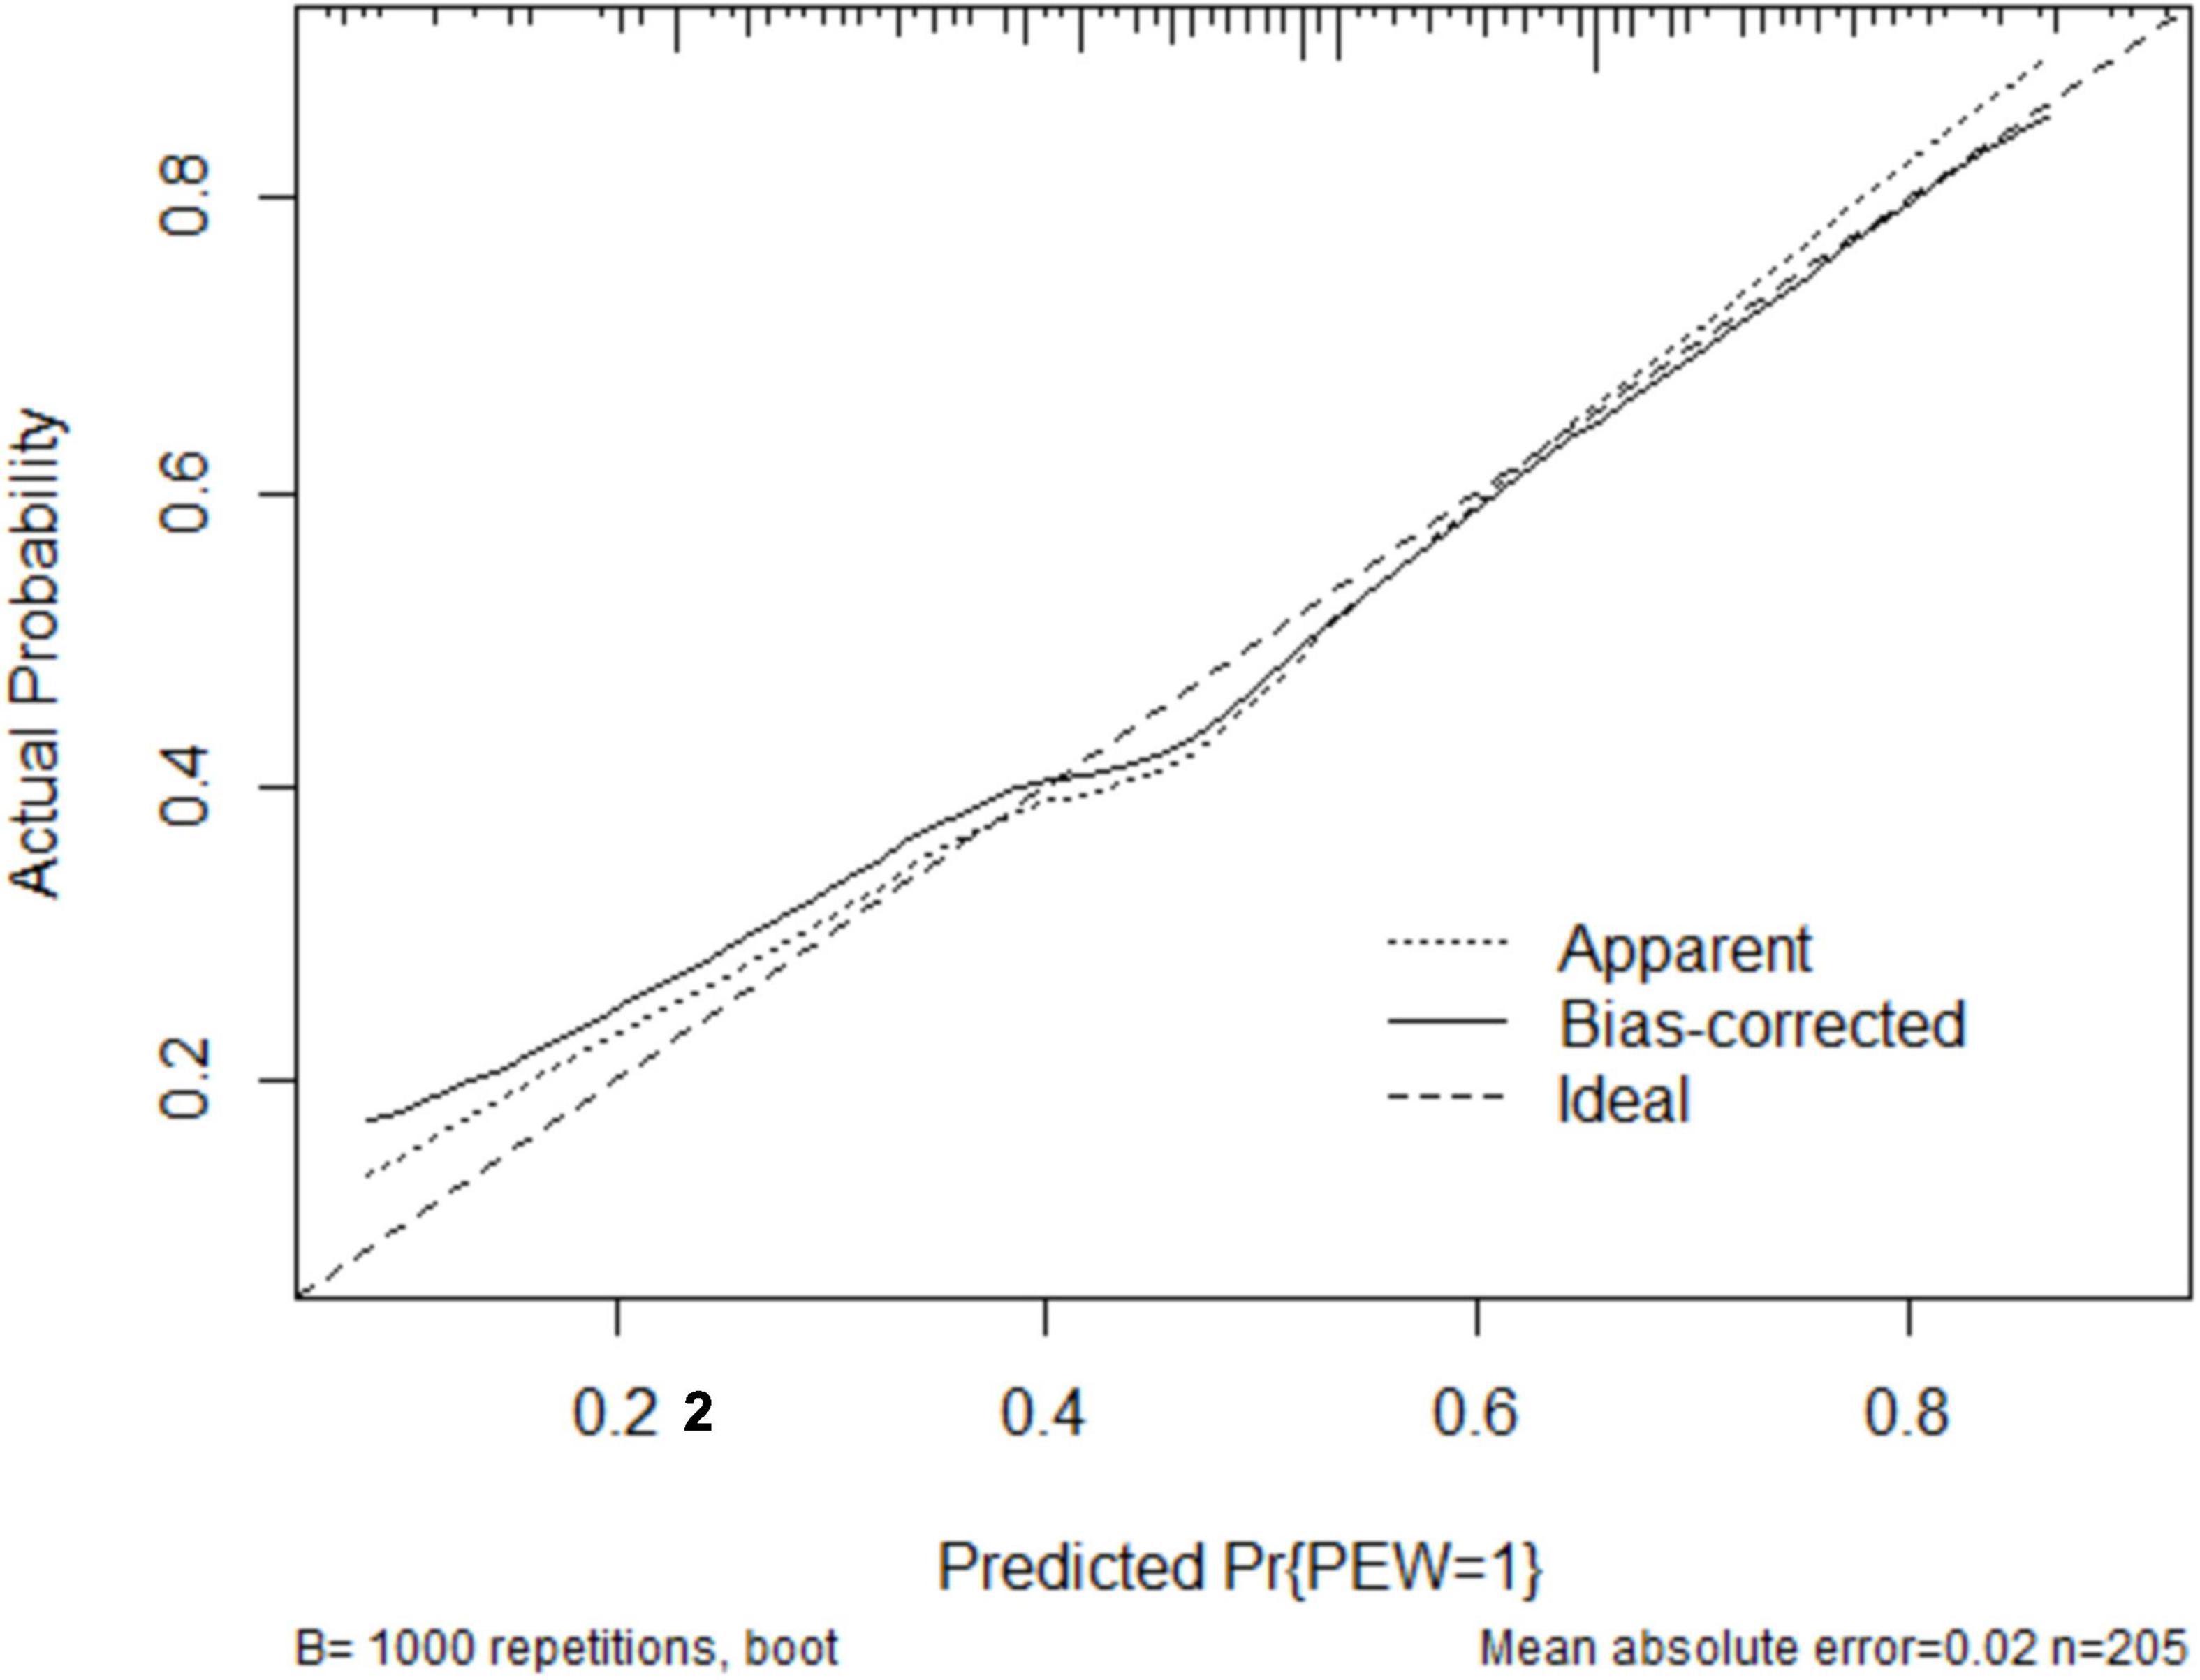
Figure 3. The robust performance of the nomogram in terms of consensus between the predicted risk and actual risk assessment. The clinical effectiveness of the nomogram was demonstrated by the calibration curve, which predicted the probability stratification of subjects with the bootstrap (B = 1,000) technique. The calibration curve showed good agreement between prediction and observation in the probability of PEW. PEW, protein-energy wasting.
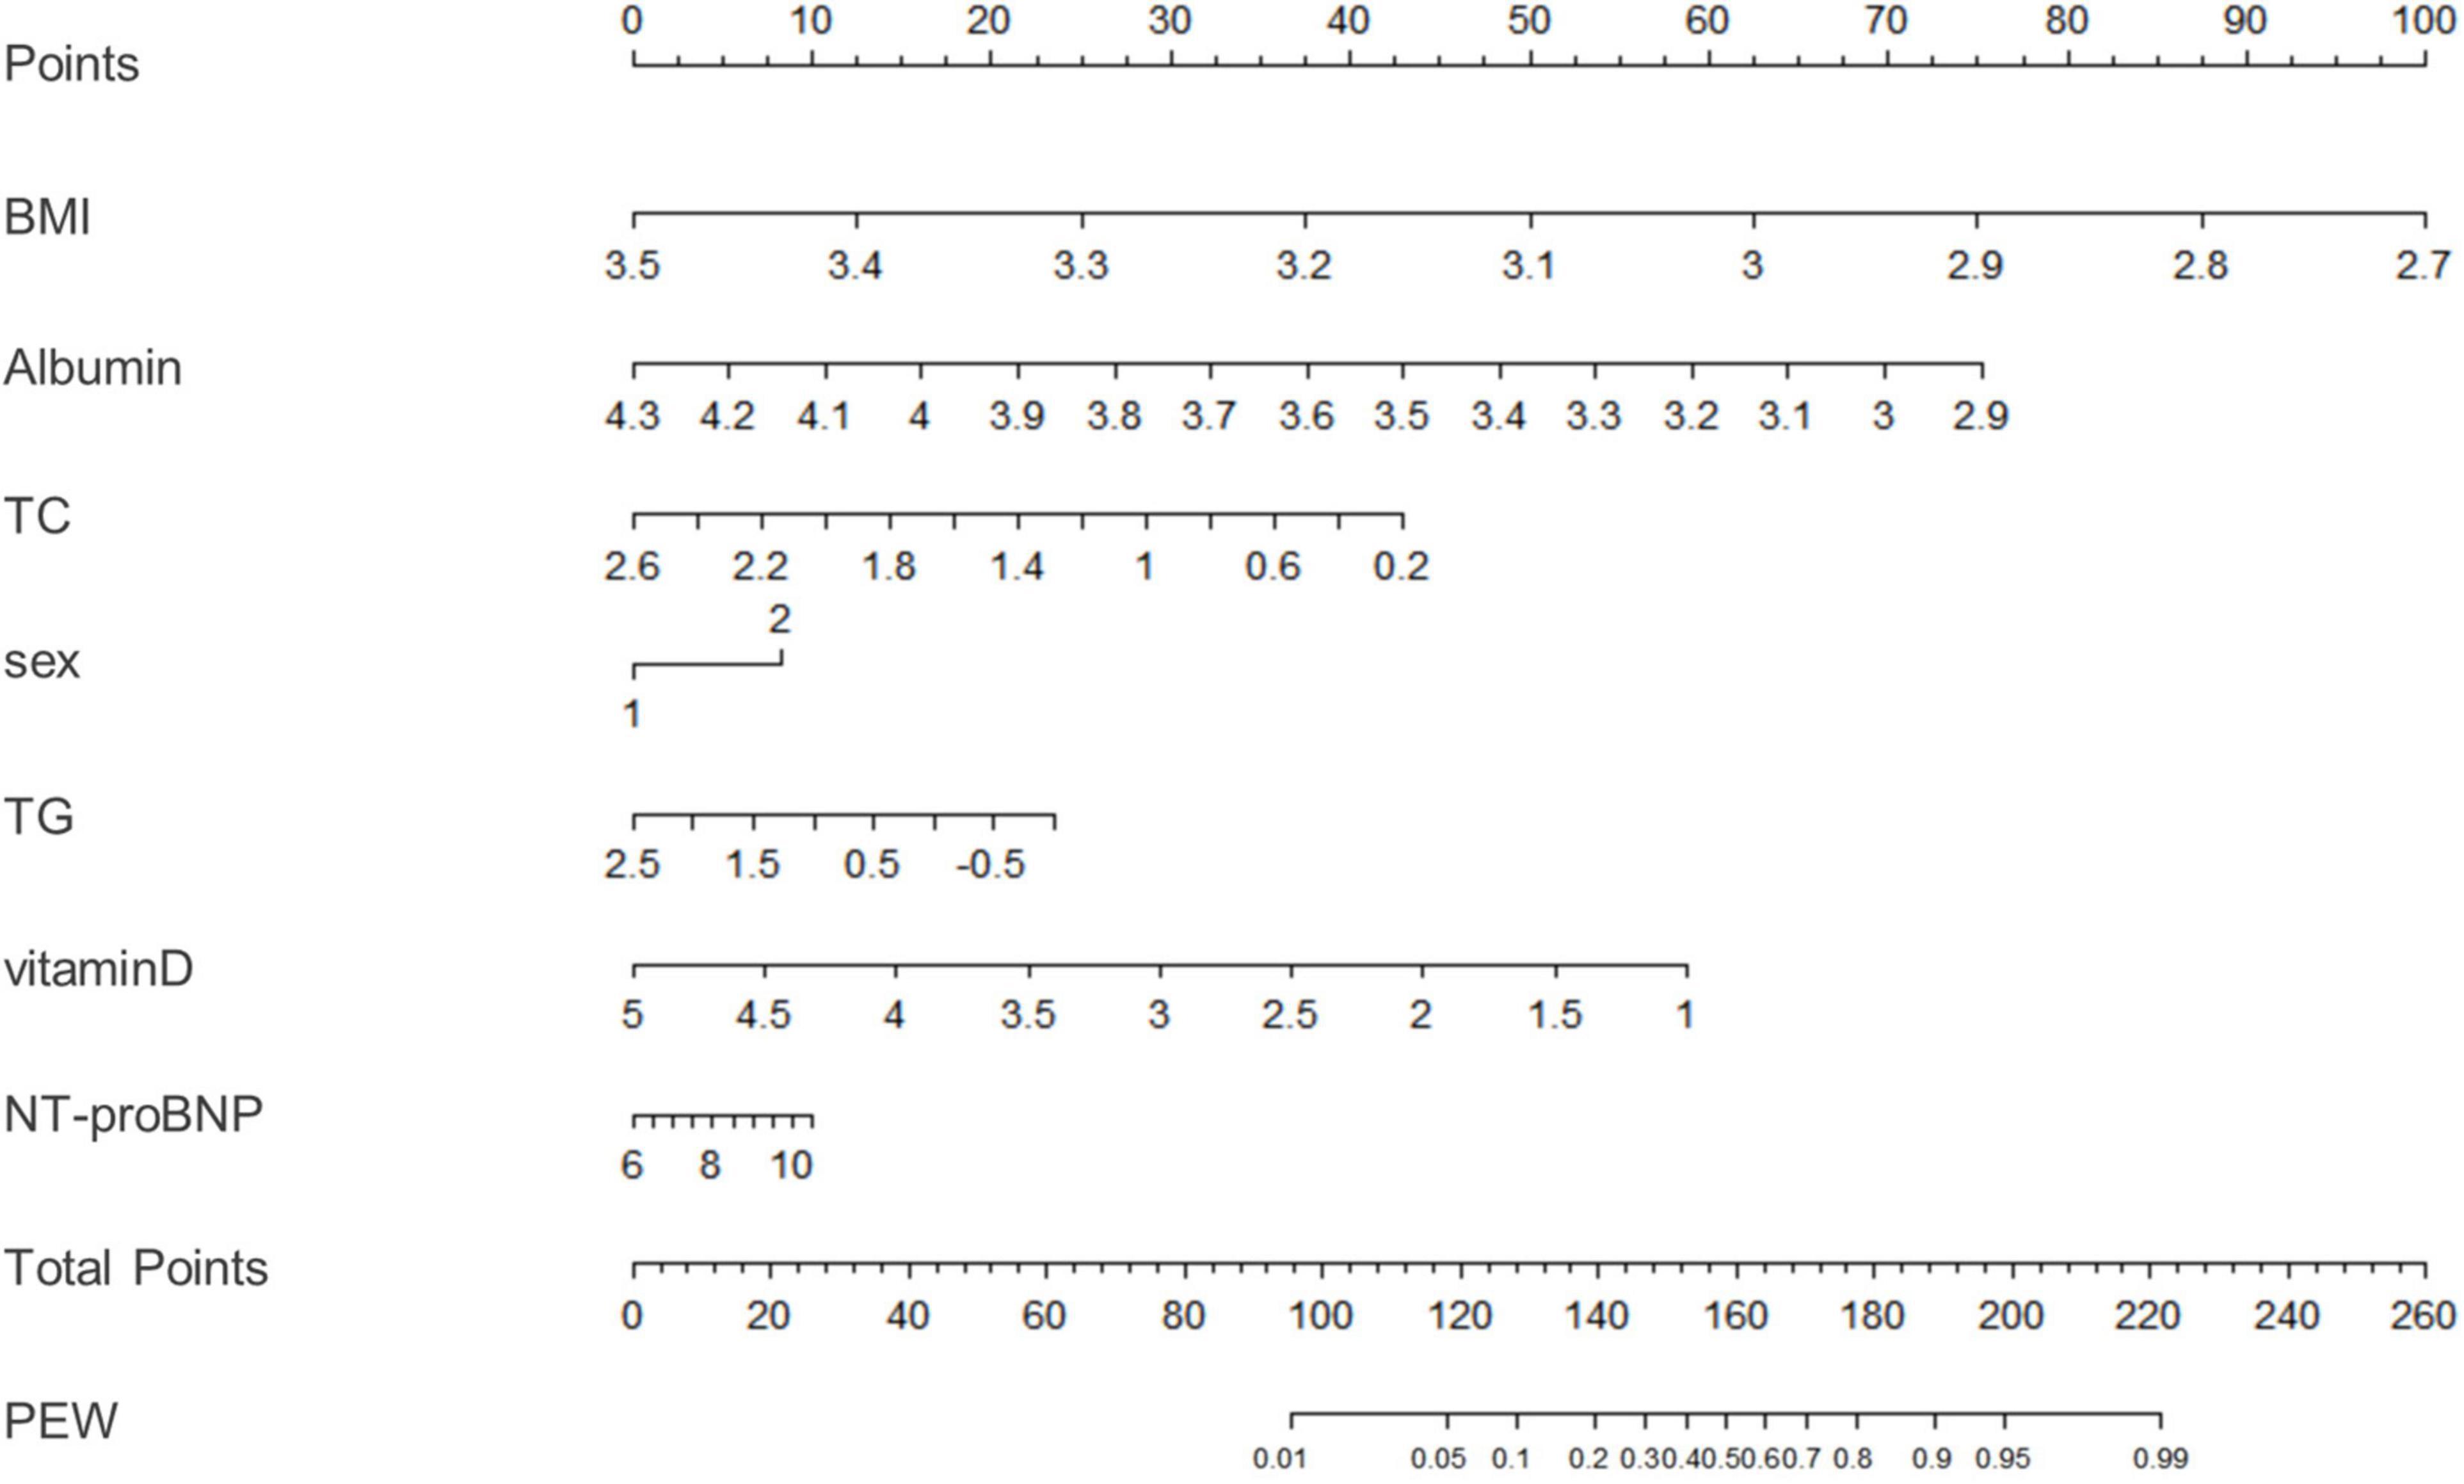
Figure 4. A nomogram for model 3. We used the nomogramEx package in RStudio to calculate the scores of each variable in model 3 (all variables were Ln-transformed): BMI points = –125 * BMI + 437.5; albumin points = –53.697 * albumin + 230.899; TC points = –17.863 * TC + 46.445; sex male points = 0, sex female points = 8.225; TG points = –6.719 * TG + 16.797; vitamin D points = –14.693 * vitamin D + 73.465; NT-proBNP points = 2.235 * NT-proBNP-13.411. The predicted value of the incidence of PEW was derived from the aggregate score of these influencing factors. BMI, body mass index; TC, total cholesterol; TG, triglyceride; ProBNP, pro-B-type natriuretic peptide; PEW, protein-energy wasting. *: multiply.

Figure 5. The decision curve analysis (DCA) curves of three models for diagnosing PEW. The DCA curve revealed that the net clinical benefit of model 3 was quite similar to model 1 and model 2. Model 1: albumin, TC, BMI, MAMC; model 2: albumin, TC, BMI, DPI; model 3: sex, TG, vitamin D, NT-proBNP, albumin, TC, BMI. DCA, decision curve analysis; PEW, protein-energy wasting; TC, total cholesterol; BMI, body mass index; MAMC, mid-arm muscle circumference; DPI, dietary protein intake; TG, triglyceride; NT-proBNP, N-terminal pro-B-type natriuretic peptide.
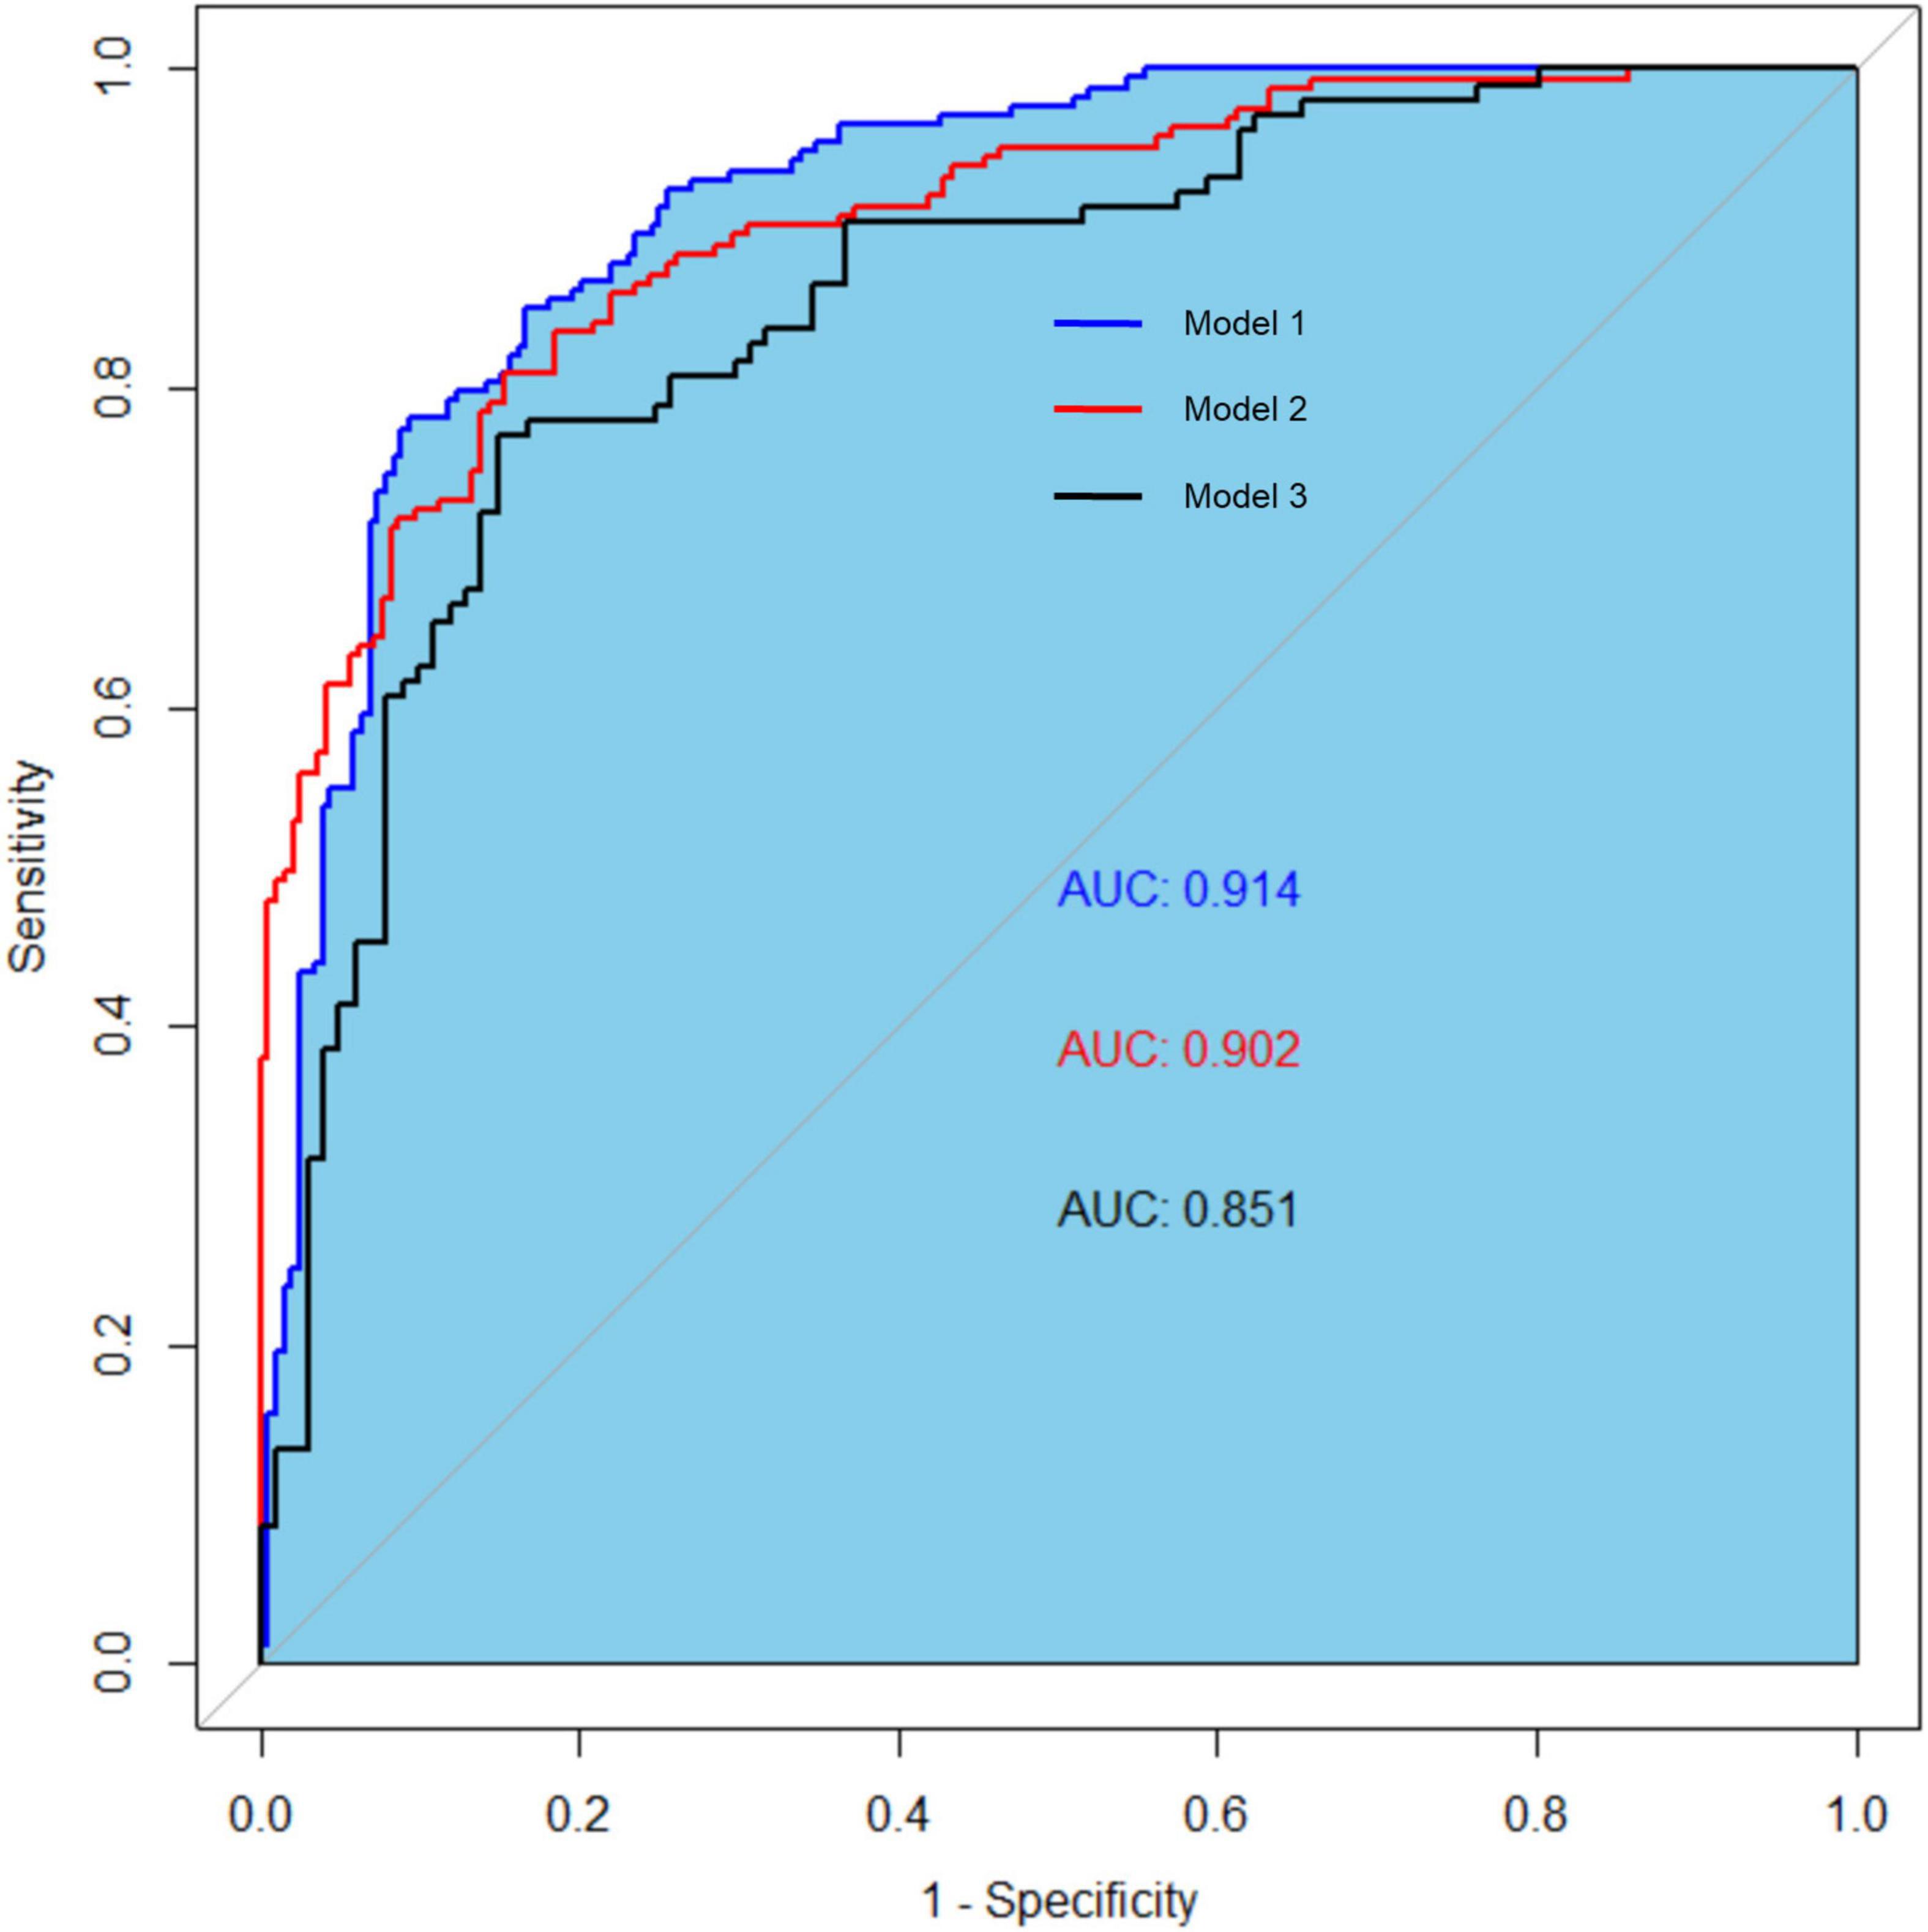
Figure 6. The receiver operating characteristic (ROC) curves of three models for diagnosing protein-energy wasting (PEW). The ROC curves of three models: model 1 (AUC = 0.914, 95% CI 0.886–0.943); model 2 (AUC = 0.902, 95% CI 0.871–0.933); and model 3 (AUC = 0.851, 95% CI 0.799–0.904). Model 1: albumin, TC, BMI, and MAMC; model 2: albumin, TC, BMI, and DPI; model 3: sex, TG, vitamin D, NT-proBNP, albumin, TC, and BMI. ROC, receiver operating characteristic curve; TC, total cholesterol; BMI, body mass index; MAMC, mid-arm muscle circumference; DPI, dietary protein intake; TG, triglyceride; NT-proBNP, N-terminal pro-B-type natriuretic peptide.
Initiation of dialysis is an important juncture in CKD and is usually accompanied by increased mortality (28). According to the data from 11 countries, the mortality rate of CKD patients is increased in the following 120 days after first dialysis treatment (28). Although factors associated with early mortality have not been fully studied, the majority of early death can be attributed to cardiovascular events or infections, and mortality is significantly higher among PEW patients (29). PEW may increase susceptibility to catheter-related infections and cardiovascular events related to hemodynamic stress during dialysis (30). Therefore, targeted nutritional interventions need to be best implemented in the early stage of dialysis. However, the 2008 ISRNM diagnostic criteria are complex, characterized by difficulty in estimating dietary intake and assessing muscle mass loss objectively. This study aims to use clinical routine detection indicators to predict the risk of PEW in MHD patients objectively and improve the possibility of early intervention. In this research, we performed a cross-sectional study in hemodialysis patients from four different medical centers in Shanghai. Binary logistic regression was used to identify four independent influencing factors: sex, TG, vitamin D, and NT-proBNP. Then, we used these four independent variables to build a novel prediction model of PEW. The nomogram was applied to display the value of each influencing factor that contributed to PEW. ROC and DCA curves tested the prediction and discrimination ability of this novel model. Collectively, the novel prediction model could effectively identify PEW in hemodialysis patients and was more convenient than traditional diagnostic criteria.
Our analysis suggested that the incidence of PEW varied between sex in MHD patients. The female patients were presented with a significantly increased incidence of PEW compared with the male patients. This may be due to the complex distribution of adipokines in different sex, which plays an important role in energy metabolism (31–33). In addition, sex hormones may also play an important regulatory role. Compared with female patients, male patients have a higher percentage of visceral fat, and the male brain is relatively more sensitive to the catabolic effect of insulin and less sensitive to leptin than the female brain (34). Estrogen acts in the brain to increase leptin sensitivity and reduce insulin sensitivity, thus changing the distribution of body fat in female patients (34). Furthermore, several studies have demonstrated that androgens act differently in women and men. In male patients, indicators of obesity are negatively correlated with testosterone levels in all age groups (35). On the contrary, increased androgen levels will increase food intake in women, resulting in metabolic imbalance and weight gain (36–40).
Total cholesterol reflects a certain level of human energy supply (41). Our study suggested that TG played a protective role in the development of PEW. A recent study showed that plasma TG n-3 polyunsaturated fatty acids (PUFAs) are associated with lower levels of inflammatory markers and better nutritional status in MHD patients, and TG n-6 PUFAs are also associated with greater serum albumin and increased handgrip strength (20). On the contrary, TG saturated fatty acids are associated with increased insulin resistance (20), which has been proven to cause muscle wasting via the suppression of PI3K/Akt signaling pathway and the ubiquitin–proteasome proteolytic pathway (42). In addition, TG-monounsaturated fatty acids (MUFAs) are related to an unfavorable nutritional status, such as lower serum albumin and MAMC (20). Collectively, the role and mechanism of TG in PEW remain to be further studied.
Vitamin D plays an essential role in regulating skeletal muscle metabolism (43). It is hydroxylated to 25-hydroxyvitamin D3 (25-OHD3) in the liver and further hydroxylated to biologically active 1,25-(OH)2D3 via the enzyme 1-α-hydroxylase (44). CKD–MBD is prevalent in CKD patients, and high levels of PTH can induce the hydroxylation of 25-OHD3 to 1,25-(OH)2D3 (16). The biologically active 1,25-dihydroxyvitamin D3 (1,25-(OH)2D3) exerts its muscle differentiation and proliferation functions through binding with vitamin D receptor (VDR) (44). A South Korean study has shown that the average 25-(OH)D3 concentration in sarcopenia patients is significantly lower than that in patients without sarcopenia (45). Vitamin D deficiency is frequent among hemodialysis patients (46), and a cross-sectional study has found a positive correlation between vitamin D levels and nutritional parameters (serum albumin and serum hemoglobin) (47). Furthermore, low-level vitamin D significantly increases the mortality of MHD patients with PEW (48). These studies provide evidence that vitamin D can be a powerful PEW predictor.
Cardiac myocytes synthesize proBNP, which is mainly used as a diagnostic marker of heart failure. For MHD patients, the change of NT-proBNP may be related to non-cardiac problems, such as liquid overload, inflammation, or malnutrition (49). Recent studies have demonstrated a positive correlation between proBNP and malnutrition (50), and NT-proBNP might be an independent biomarker of PEW, especially in MHD patients (21). The accumulation of NT-proBNP is negatively associated with body fat mass and significantly correlated with the increased incidence of PEW in hemodialysis patients (51). Furthermore, NT-proBNP could predict all-cause mortality in hemodialysis patients, especially coronary heart disease (21). A recent study proposes a direction regarding how natriuretic peptides (NPs) participate in the progression of PEW (52). CKD-PEW patients are in a high catabolic state (53). Browning in high catabolic diseases such as cancer-related cachexia corresponds to the activation of brown adipocytes in white adipose tissue (53). They suggest that the uremic environment can induce browning activation, and NPs as one of the uremic toxins are involved in browning in CKD (52). This conclusion is consistent with our findings. In our research, we demonstrated that NT-proBNP had a positive correlation with the incidence of PEW.
However, there are still some limitations to our study. First, the participants included in our research are patients who have undergone hemodialysis for over 6 months; although we have collected the data from multiple hemodialysis centers, the final number of participants included is still smaller than that in the other prediction models. Second, this is cross-sectional research, and large-scale prospective studies are needed to provide more guidance information. Finally, external validation is required to confirm the reliability of the nomogram using an independent dataset. We are now expanding the database and will perform the external verification later.
In summary, we established a novel PEW prediction model by using clinical routine detection indicators (including sex, TG, vitamin D, and NT-proBNP). Compared with traditional ISRNM standard models, this novel model could avoid measurement errors in estimating dietary intake and assessing muscle mass loss and is more convenient and objective, which is helpful for clinicians to identify and intervene PEW in MHD patients in the early stage.
The datasets presented in this article are not readily available because the Management of China’s Human Genetic Resources does not allow sharing this information. Requests to access the datasets should be directed to NL, bmFsaXVicm93bkAxNjMuY29t.
The studies involving human participants were reviewed and approved by the Research Ethics Committee of Shanghai East Hospital. The patients/participants provided their written informed consent to participate in this study.
NL: supervision or mentorship, research idea, and study design. SC, XM, XZh, YW, WL, LZ, XZa, YQ, YJ, SbZ, JL, HC, YS, YH, and MT: data acquisition. SC, XZh, and SgZ: statistical analysis and manuscript drafting or revision. All authors read and approved the final manuscript.
This study was supported by the Outstanding Leaders Training Program of Pudong Health Bureau of Shanghai (PWR12021-02 to NL), the Shanghai Health Bureau and Shanghai administration of traditional Chinese Medicine of China (ZHYY-ZXYJHZX-202114 to NL), the Project of Pudong Health Bureau of Shanghai (PW2021D-04, PWYgf2021-03, and PWZxk2017-05 to NL), the clinical investigation grant of Shanghai East Hospital (DFLC2022016 to NL), the China Postdoctoral Science Foundation (2021M692436 to YS), the Youth Cultivation Talent Fund of Shanghai East Hospital (DFPY2022011 to YS), the Shanghai Scientific Committee of China (20ZR1445800 and 13PJ1406900 to NL), the National Nature Science Foundation of China grants (82070791, 81670690, 81470991, and 81200492 to NL, 82070700 and 81830021 to SgZ), and the Branch Grant of National Key R&D Program of China (2018YFA0108802 to SgZ).
The authors declare that the research was conducted in the absence of any commercial or financial relationships that could be construed as a potential conflict of interest.
All claims expressed in this article are solely those of the authors and do not necessarily represent those of their affiliated organizations, or those of the publisher, the editors and the reviewers. Any product that may be evaluated in this article, or claim that may be made by its manufacturer, is not guaranteed or endorsed by the publisher.
The Supplementary Material for this article can be found online at: https://www.frontiersin.org/articles/10.3389/fnut.2022.933745/full#supplementary-material
Supplementary Figure 1 | The clinical impact curve of model 3 for diagnosing PEW. Model 3 was used to predict the risk stratification of 1,000 people. The “loss/benefit” coordinate axis was displayed with eight scales, and confidence intervals were displayed. The red curve (number high risk) represents the number of people classified as positive (high risk) by model 3 under each threshold probability; the blue curve (number high risk with outcome) shows the number of true positives under each threshold probability.
1. Bailey A, Brody R, Sackey J, Parrott JS, Peters E, Byham-Gray L. Current methods for developing predictive energy equations in maintenance dialysis are imprecise. Ann Med. (2022) 54:909–20. doi: 10.1080/07853890.2022.2057581
2. Turkmen K, Ozer H, Kusztal M. The relationship of epicardial adipose tissue and cardiovascular disease in chronic kidney disease and hemodialysis patients. J Clin Med. (2022) 11:1308. doi: 10.3390/jcm11051308
3. MacLaughlin HL, Friedman AN, Ikizler TA. Nutrition in kidney disease: core curriculum 2022. Am J Kidney Dis. (2022) 79:437–49. doi: 10.1053/j.ajkd.2021.05.024
4. Iseki K. Nutrition and quality of life in chronic kidney disease patients: a practical approach for salt restriction. Kidney Res Clin Pract. (2022). [Epub ahead of print]. doi: 10.23876/j.krcp.21.203
5. Sung CC, Liao MT, Chao CT. Independent determinants of appetite impairment among patients with stage 3 or higher chronic kidney disease: a prospective study. Nutrients. (2021) 13:2863. doi: 10.3390/nu13082863
6. Chan W. Chronic kidney disease and nutrition support. Nutr Clin Pract. (2021) 36:312–30. doi: 10.1002/ncp.10658
7. Zhou H, Yao W, Pan D, Sun G. Predicational ability of phase angle on protein energy wasting in kidney disease patients with renal replacement therapy: a cross-sectional study. Food Sci Nutr. (2021) 9:3573–9. doi: 10.1002/fsn3.2310
8. Obi Y, Qader H, Kovesdy CP, Kalantar-Zadeh K. Latest consensus and update on protein-energy wasting in chronic kidney disease. Curr Opin Clin Nutr Metab Care. (2015) 18:254–62. doi: 10.1097/MCO.0000000000000171
9. Carrero JJ, Stenvinkel P, Cuppari L, Ikizler TA, Kalantar-Zadeh K, Kaysen G, et al. Etiology of the protein-energy wasting syndrome in chronic kidney disease: a consensus statement from the International Society of Renal Nutrition and Metabolism (ISRNM). J Ren Nutr. (2013) 23:77–90. doi: 10.1053/j.jrn.2013.01.001
10. Velasquez MT, Andrews SC, Raj DS. Protein energy metabolism in chronic kidney disease. Chron Ren Dis. (2020). 225–48. doi: 10.1016/b978-0-12-815876-0.00016-4
11. Han Q, Lin S, He F, Zhang R, Xie X, Qing F, et al. A high neutrophil to lymphocyte ratio is associated with poor nutritional status in chronic kidney disease patients. Br J Nutr. (2022). [Epub ahead of print]. doi: 10.1017/S000711452100516X
12. Kooman JP, Dekker MJ, Usvyat LA, Kotanko P, van der Sande FM, Schalkwijk CG, et al. Inflammation and premature aging in advanced chronic kidney disease. Am J Physiol Renal Physiol. (2017) 313:F938–50. doi: 10.1152/ajprenal.00256.2017
13. Bi X, Chu M, Ai H, Hu C, Ding W. Association of serum IL-18 with protein-energy wasting in end-stage renal disease patients on haemodialysis. Int Urol Nephrol. (2019) 51:1271–8. doi: 10.1007/s11255-019-02167-5
14. Tsai MT, Ou SM, Chen HY, Tseng WC, Lee KH, Yang CY, et al. Relationship between circulating galectin-3, systemic inflammation, and protein-energy wasting in chronic hemodialysis patients. Nutrients. (2021) 13:2803. doi: 10.3390/nu13082803
15. Koppe L, Fouque D, Kalantar-Zadeh K. Kidney cachexia or protein-energy wasting in chronic kidney disease: facts and numbers. J Cachexia Sarcopenia Muscle. (2019) 10:479–84. doi: 10.1002/jcsm.12421
16. Yamada S, Tsuruya K, Kitazono T, Nakano T. Emerging cross-talks between chronic kidney disease-mineral and bone disorder (CKD-MBD) and malnutrition-inflammation complex syndrome (MICS) in patients receiving dialysis. Clin Exp Nephrol. (2022) 26:613–29. doi: 10.1007/s10157-022-02216-x
17. Komaba H, Fukagawa M. Secondary Hyperparathyroidism and Protein-Energy Wasting in End-Stage Renal Disease. Ther Apher Dial. (2018) 22:246–50. doi: 10.1111/1744-9987.12683
18. Chiu TT, Liao SC, Lee WC, Lee PS, Ng HY, Chien YS, et al. Gelsolin and adipokines are associated with protein-energy wasting in hemodialysis patients. Artif Organs. (2015) 39:150–5. doi: 10.1111/aor.12342
19. Carrero JJ, Qureshi AR, Parini P, Arver S, Lindholm B, Bárány P, et al. Low serum testosterone increases mortality risk among male dialysis patients. J Am Soc Nephrol. (2009) 20:613–20. doi: 10.1681/asn.2008060664
20. Khor BH, Sahathevan S, Sualeheen A, Ali MSM, Narayanan SS, Chinna K, et al. Circulating fatty acid profiles are associated with protein energy wasting in maintenance hemodialysis patients: a cross-sectional study. Sci Rep. (2021) 11:1416. doi: 10.1038/s41598-020-80812-1
21. Ikeda M, Honda H, Takahashi K, Shishido K, Shibata T. N-Terminal pro-B-type natriuretic peptide as a biomarker for loss of muscle mass in prevalent hemodialysis patients. PLoS One. (2016) 11:e0166804. doi: 10.1371/journal.pone.0166804
22. Ducros J, Larifla L, Merault H, Galantine V, Bassien-Capsa V, Foucan L. N-terminal pro-B-type natriuretic peptide and malnutrition in patients on hemodialysis. Int J Nephrol. (2020) 2020:9528014.
23. Guo Q, Barany P, Qureshi AR, Snaedal S, Heimburger O, Stenvinkel P, et al. N-terminal pro-brain natriuretic peptide independently predicts protein energy wasting and is associated with all-cause mortality in prevalent HD patients. Am J Nephrol. (2009) 29:516–23. doi: 10.1159/000185628
24. Fouque D, Kalantar-Zadeh K, Kopple J, Cano N, Chauveau P, Cuppari L, et al. A proposed nomenclature and diagnostic criteria for protein-energy wasting in acute and chronic kidney disease. Kidney Int. (2008) 73:391–8. doi: 10.1038/sj.ki.5002585
25. Kato A, Takita T, Furuhashi M, Maruyama Y, Hishida A. Comparison of serum albumin, C-reactive protein and carotid atherosclerosis as predictors of 10-year mortality in hemodialysis patients. Hemodial Int. (2010) 14:226–32. doi: 10.1111/j.1542-4758.2009.00432.x
26. Bross R, Noori N, Kovesdy CP, Murali SB, Benner D, Block G, et al. Dietary assessment of individuals with chronic kidney disease. Semin Dial. (2010) 23:359–64. doi: 10.1111/j.1525-139X.2010.00743.x
27. Huang YC, Wahlqvist ML, Lo YC, Lin C, Chang HY, Lee MS. A non-invasive modifiable healthy ageing nutrition index (HANI) predicts longevity in free-living older Taiwanese. Sci Rep. (2018) 8:7113. doi: 10.1038/s41598-018-24625-3
28. Robinson BM, Zhang J, Morgenstern H, Bradbury BD, Ng LJ, McCullough KP, et al. Worldwide, mortality risk is high soon after initiation of hemodialysis. Kidney Int. (2014) 85:158–65. doi: 10.1038/ki.2013.252
29. Tinti F, Lai S, Noce A, Rotondi S, Marrone G, Mazzaferro S, et al. Chronic kidney disease as a systemic inflammatory syndrome: update on mechanisms involved and potential treatment. Life. (2021) 11:419. doi: 10.3390/life11050419
30. Franco BB, Hopman WM, Lamarche MC, Holden RM. Protein energy wasting and long-term outcomes in nondialysis dependent chronic kidney disease. J Ren Care. (2022) 48:14–23. doi: 10.1111/jorc.12378
31. Pajvani UB, Hawkins M, Combs TP, Rajala MW, Doebber T, Berger JP, et al. Complex distribution, not absolute amount of adiponectin, correlates with thiazolidinedione-mediated improvement in insulin sensitivity. J Biol Chem. (2004) 279:12152–62. doi: 10.1074/jbc.M311113200
32. Da SRS, Liu M, Sweeney G. Adiponectin synthesis, secretion and extravasation from circulation to interstitial space. Physiology. (2021) 36:134–49. doi: 10.1152/physiol.00031.2020
33. Kita S, Maeda N, Shimomura I. Interorgan communication by exosomes, adipose tissue, and adiponectin in metabolic syndrome. J Clin Invest. (2019) 129:4041–9. doi: 10.1172/JCI129193
34. Clegg DJ, Brown LM, Woods SC, Benoit SC. Gonadal hormones determine sensitivity to central leptin and insulin. Diabetes. (2006) 55:978–87. doi: 10.2337/diabetes.55.04.06.db05-1339
35. Saad F, Gooren L. The role of testosterone in the metabolic syndrome: a review. J Steroid Biochem Mol Biol. (2009) 114:40–3. doi: 10.1016/j.jsbmb.2008.12.022
36. Kanaya N, Vonderfecht S, Chen S. Androgen (dihydrotestosterone)-mediated regulation of food intake and obesity in female mice. J Steroid Biochem Mol Biol. (2013) 138:100–6. doi: 10.1016/j.jsbmb.2013.04.001
37. Hirschberg AL. Sex hormones, appetite and eating behaviour in women. Maturitas. (2012) 71:248–56. doi: 10.1016/j.maturitas.2011.12.016
38. Naessén S, Carlström K, Garoff L, Glant R, Hirschberg AL. Polycystic ovary syndrome in bulimic women–an evaluation based on the new diagnostic criteria. Gynecol Endocrinol. (2006) 22:388–94. doi: 10.1080/09513590600847421
39. Barber TM, McCarthy MI, Wass JA, Franks S. Obesity and polycystic ovary syndrome. Clin Endocrinol. (2006) 65:137–45. doi: 10.1111/j.1365-2265.2006.02587.x
40. Hirschberg AL, Naessén S, Stridsberg M, Byström B, Holtet J. Impaired cholecystokinin secretion and disturbed appetite regulation in women with polycystic ovary syndrome. Gynecol Endocrinol. (2004) 19:79–87. doi: 10.1080/09513590400002300
41. Al-Sabti H, Al-Hinai AT, Al-Zakwani I, Al-Hashmi K, Al MW, Arafah M, et al. The achievement of non-high-density lipoprotein cholesterol target in patients with very high atherosclerotic cardiovascular disease risk stratified by triglyceride levels despite statin-controlled low-density lipoprotein cholesterol. Oman Med J. (2022) 37:e367. doi: 10.5001/omj.2022.79
42. Wang X, Hu Z, Hu J, Du J, Mitch WE. Insulin resistance accelerates muscle protein degradation: activation of the ubiquitin-proteasome pathway by defects in muscle cell signaling. Endocrinology. (2006) 147:4160–8. doi: 10.1210/en.2006-0251
43. Molina P, Carrero JJ, Bover J, Chauveau P, Mazzaferro S, Torres PU. Vitamin D, a modulator of musculoskeletal health in chronic kidney disease. J Cachexia Sarcopenia Muscle. (2017) 8:686–701. doi: 10.1002/jcsm.12218
44. Pojednic RM, Ceglia L. The emerging biomolecular role of vitamin D in skeletal muscle. Exerc Sport Sci Rev. (2014) 42:76–81. doi: 10.1249/jes.0000000000000013
45. Kim MK, Baek KH, Song KH, Il Kang M, Park CY, Lee WY, et al. Vitamin D deficiency is associated with sarcopenia in older Koreans, regardless of obesity: the Fourth Korea National Health and Nutrition Examination Surveys (KNHANES IV) 2009. J Clin Endocrinol Metab. (2011) 96:3250–6. doi: 10.1210/jc.2011-1602
46. Ahmadi F, Damghani S, Lessan-Pezeshki M, Razeghi E, Maziar S, Mahdavi-Mazdeh M. Association of low vitamin D levels with metabolic syndrome in hemodialysis patients. Hemodial Int. (2016) 20:261–9. doi: 10.1111/hdi.12316
47. Olvera-Soto MG, Melquiades-Castillo D, Castillo-Martínez L, Clark P, Medeiros M, Monroy A, et al. 25 hydroxyvitamin D and nutritional parameters correlation in adults with stage 4 chronic kidney disease. Clin Nutr ESPEN. (2018) 28:80–7. doi: 10.1016/j.clnesp.2018.09.074
48. Fiedler R, Dorligjav O, Seibert E, Ulrich C, Markau S, Girndt M. Vitamin D deficiency, mortality, and hospitalization in hemodialysis patients with or without protein-energy wasting. Nephron Clin Pract. (2011) 119:c220–6. doi: 10.1159/000328927
49. Dekker MJE, Konings C, Canaud B, van der Sande FM, Stuard S, Raimann JG, et al. Interactions between malnutrition, inflammation, and fluid overload and their associations with survival in prevalent hemodialysis patients. J Ren Nutr. (2018) 28:435–44. doi: 10.1053/j.jrn.2018.06.005
50. Ducros J, Larifla L, Merault H, Foucan L. NT-proBNP, cardiometabolic risk factors, and nutritional status in hemodialysis patients. Int J Nephrol. (2017) 2017:1312547. doi: 10.1155/2017/1312547
51. Luce M, Bres E, Yi D, Pastural M, Granjon S, Szelag JC, et al. Natriuretic peptides as predictors of protein-energy wasting in hemodialysis population. J Ren Nutr. (2021) 32:234–42. doi: 10.1053/j.jrn.2021.03.002
52. Luce M, Barba C, Yi D, Mey A, Roussel D, Bres E, et al. Accumulation of natriuretic peptides is associated with protein energy wasting and activation of browning in white adipose tissue in chronic kidney disease. Kidney Int. (2020) 98:663–72. doi: 10.1016/j.kint.2020.03.027
Keywords: protein-energy wasting, hemodialysis, prediction model, nomogram, impact factors
Citation: Chen S, Ma X, Zhou X, Wang Y, Liang W, Zheng L, Zang X, Mei X, Qi Y, Jiang Y, Zhang S, Li J, Chen H, Shi Y, Hu Y, Tao M, Zhuang S and Liu N (2022) An updated clinical prediction model of protein-energy wasting for hemodialysis patients. Front. Nutr. 9:933745. doi: 10.3389/fnut.2022.933745
Received: 01 May 2022; Accepted: 11 October 2022;
Published: 06 December 2022.
Edited by:
Erick P. de Oliveira, Federal University of Uberlândia, BrazilReviewed by:
Ying Fan, Shanghai Jiao Tong University, ChinaCopyright © 2022 Chen, Ma, Zhou, Wang, Liang, Zheng, Zang, Mei, Qi, Jiang, Zhang, Li, Chen, Shi, Hu, Tao, Zhuang and Liu. This is an open-access article distributed under the terms of the Creative Commons Attribution License (CC BY). The use, distribution or reproduction in other forums is permitted, provided the original author(s) and the copyright owner(s) are credited and that the original publication in this journal is cited, in accordance with accepted academic practice. No use, distribution or reproduction is permitted which does not comply with these terms.
*Correspondence: Na Liu, bmFsaXVicm93bkAxNjMuY29t
†These authors have contributed equally to this work
Disclaimer: All claims expressed in this article are solely those of the authors and do not necessarily represent those of their affiliated organizations, or those of the publisher, the editors and the reviewers. Any product that may be evaluated in this article or claim that may be made by its manufacturer is not guaranteed or endorsed by the publisher.
Research integrity at Frontiers
Learn more about the work of our research integrity team to safeguard the quality of each article we publish.