
94% of researchers rate our articles as excellent or good
Learn more about the work of our research integrity team to safeguard the quality of each article we publish.
Find out more
ORIGINAL RESEARCH article
Front. Nutr., 27 June 2022
Sec. Food Chemistry
Volume 9 - 2022 | https://doi.org/10.3389/fnut.2022.932826
This article is part of the Research TopicTrace Element Chemistry and HealthView all 6 articles
 Xin Leng1,2,3,4
 Mengyao She1,2,3
 Xilang Jin5
 Jiao Chen1,2,3
 Xuehao Ma5
 Fulin Chen1,2,3*
 Jianli Li4*
 Bingqin Yang4
Copper is a vital trace metal in human body, which plays the significant roles in amounts of physiological and pathological processes. The application of copper-selective probe has attracted great interests from environmental tests to life process research, yet a few of sensitive Cu2+ tests based on on-site analysis have been reported. In this paper, a novel fluorescein-based fluorescent probe N4 was designed, synthesized, and characterized, which exhibited high selectivity and sensitivity to Cu2+ comparing with other metal ions in ethanol–water (1/1, v/v) solution. The probe N4 bonded with Cu2+ to facilitate the ring-opening, and an obvious new band at 525 nm in the fluorescence spectroscopy appeared, which could be used for naked-eye detection of Cu2+ within a broad pH range of 6–9. Meanwhile, a good linearity between the fluorescence intensity and the concentrations of Cu2+ ranged 0.1–1.5 eq. was observed, and the limit of detection of N4 to Cu2+ was calculated to be as low as 1.20 μm. In addition, the interaction mode between N4 and Cu2+ was found to be 1:1 by the Job's plot and mass experiment. Biological experiments showed that the probe N4 exhibited low biological toxicity and could be applied for Cu2+ imaging in living cells. The significant color shift associated with the production of the N4-Cu2+ complex at low micromolar concentrations under UV light endows N4 with a promising probe for field testing of trace Cu2+ ions.
Trace elements are present in living body in small amounts, but they are important for the growth, development, maintenance, and recovery of health (1–3). Either insufficient or excessive intake of trace elements could cause several diseases (4). Copper is a vital trace metal in the human body, which plays the significant roles in amounts of physiological and pathological processes including body circulation, ATP production, and bone formation as well as protecting the cell from oxygen free radicals (5–7). An aberrant concentration of copper may cause the imbalance in organisms, resulting in a series of pathological illnesses such as liver and kidney damage, cancer, and neurodegenerative disorders including Parkinson's, Wilson's, and Alzheimer's (8–10). In addition, Cu2+ pollution in water and soil mainly comes from the metal-containing wastes caused by industrial production. Due to the pollution of water environment and soil environment, Cu2+ can gradually be accumulated in animals and plants, thereby affecting human health (11, 12). Resulting ground the absence and overloading of Cu2+ has been found to adversely affect all the biological systems including humans (13–15). As a result, it is vital to develop efficient methods for tracking and quantifying the anomalous of the concentrations and distributions of Cu2+ to comprehend the transportation, metabolic mechanism, and interaction roles of Cu2+ in linked physiological and pathological processes (16–20).
In the past decades, many copper quantification methods including inductively coupled plasma mass spectrometry (ICP-MS) (21, 22), atomic absorption spectrometry (AAS) (23, 24), and fluorescent probes (25–27) have been reported. These methods offer sensitivity but usually suffer from complexity and costly. Fluorescent probe technique enjoys the advantages of simplicity, high selectivity, and sensitivity as well as convenient visual imaging with excellent spectroscopic properties (28–35). Among the reported probes, the colorimetric fluorescent probes of Cu2+ exhibit the potential advantages of naked-eye detection without complicated sample preparation or expensive instruments, which represent a rapid, sensitive Cu2+ testing method (25, 26). In addition, the development of new techniques makes it easy to quickly detect and quantify harmful levels of Cu2+ at low micromolarity through field tests.
To date, many colorimetric fluorescent probes consisted of large π-conjugated system such as fluorescein (36), rhodamine (37), coumarin (38, 39), anthracene (40), and BODIPY (41, 42) with obvious spectra absorption or strong fluorescence have been successfully synthesized (43). Among those probes, the fluorescein family dyes have excellent spectroscopic properties, such as long absorption and emission wavelengths, high extinction coefficients, high quantum yields, and excellent photostability, which are always introduced to construct optical sensors for metal ions (44). The sensing mechanism of these probes is based on the coordination sites to bind metal ions (45). However, the interaction between Cu2+ and fluorescein was rarely confirmed, which blocks our understanding of its interaction mode.
In this work, we designed and synthesized a novel fluorescent probe N4 based on a fluorescein derivative for rapid, selective, and sensitive response to Cu2+ in aqueous media. The fluorescent probe N4 exhibited the naked-eye detection of Cu2+ and a limit of detection (LOD) of 1.20 μm, indicating promise in-field applications. The solution color of N4 changes from colorless to green after the addition of Cu2+, with a noticeable new band at 525 nm observed under UV light. The coordination process can be detected efficiently, and the sensing mechanism is also illustrated by Job's plot, FT-IR, and mass spectra. Furthermore, biological application experiments indicated that the probes can detect Cu2+ in living cells, which might not only provide effective tools for Cu2+ imaging in biological samples, but also promote the understanding of the pathological and pharmacological effects of Cu2+ and its related enzymes in various diseases.
Ethyl acetate, petroleum ether, ethanol, sodium hydrate, hydrochloric acid, fluorescein, and hydrazine hydrate were purchased from Tianjin Fuyu Fine Chemicals Co., Ltd (Tianjin, China). 5-Bromoindole-3-formaldehyde, copper sulfate, and dimethyl sulfoxide were purchased from Aladdin Reagent Co., Ltd (Shanghai, China). All of the reagents were of analytical grade and were utilized straight away (without further treatment). A Milli-Q system was used to create ultrapure water for all of the solutions.
Fluorescence analysis was carried on a HITACHI F-4500 fluorescence spectrophotometer. IR spectra were performed on a Bruker Tensor 27 spectrometer. NMR spectra were obtained on a Varian INOVA-400 MHz spectrometer (400 MHz). A Bruker micro-TOF-Q II ESI-TOF LC/MS/MS spectroscopy was used mass spectra test. Living cells imaging experiments were performed on an Olympus FV1000 confocal microscopy. Cytotoxicity analysis was recorded with the SoftMax Pro software in Spectra max190-Molecular Devices.
Fluorescein hydrazine was synthesized from fluorescein and hydrazine according to the literature (45). Fluorescein hydrazine (3.48 g, 10.04 mmol) and 5-bromoindole-3-carbaldehyde (1.50 g, 6.69 mmol) were dissolved in 50 ml of ethanol, refluxed for 6 h, cooled to room temperature after the reaction. The precipitate was filtered out and washed several times with absolute ethanol, and the pale yellow solid was obtained and placed in a dark place at 4°C for use; yield 43.27%, melting point 259–261°C. 1H NMR (400 MHz, TMS, CD3OD) δ 9.31 (s, 1H), 8.01 (d, J = 1.2 Hz, 1H), 7.94 (dd, J = 6.0, 1.4 Hz, 1H), 7.62 (td, J = 6.6, 1.3 Hz, 2H), 7.49 (s, 1H), 7.24-7.16 (m, 3H), 6.74 (d, J = 2.3 Hz, 2H), 6.46 (dt, J = 8.6, 5.5 Hz, 4H); 13C NMR (100 MHz, TMS, DMSO-d6) δ 165.9, 163.2, 158.9, 158.7, 153.2, 152.9, 152.0, 149.79, 148.9, 136.2, 133.8, 133.0, 132.8, 131.6, 129.8, 129.5, 128.9, 128.7, 128.4, 126.0, 125.6, 124.9, 124.4, 123.9, 123.2, 122.8, 114.1, 113.9, 112.6, 112.5, 112.3, 111.3, 110.4, 103.0, 102.9, 66.2, 65.1, 40.7, 40.5, 40.3, 40.1, 39.8, 39.6, 39.4, 19.0; IR (KBr, cm−1): 3,554, 3,402, 3,111, 1,654, 1,612, 1,503, 1,449, 1,339, 1,298, 1,265, 1,236, 1,175, 1,110, 1,078, 993, 885, 861, 792, 752, 687, 584, 529; (ESI) m/z calcd for C29H18BrN3O4 (M+Na)+: 574.0373. found: 574.0357.
Cell toxicity was tested by CCK-8 assay. Cells were cultured in 96-well plates and cultured at 37°C for 24 h, and then, different concentrations of probe (0.0, 2.5, 5.0, 10.0, 20.0, and 40.0 μmol/L) were added to the wells and cultured for 24 h. CCK-8 was added to each well, and the plate was incubated for another 2 h. Absorbance was measured at 450 nm. All experiments were repeated three times, and the data were presented as the percentage of control cells.
The stock solution of probe N4 (1 mm) was prepared in EtOH. The solutions of biologically relevant analytes stock solutions (1 mm) were prepared in deionized water. During the titration experiments, different amounts of Cu2+ and 1.0 ml of 200 μm probes were mixed and filled up with phosphate-buffered saline (PBS) to 10 ml in volumetric tubes. During the interference experiments, 20 μm of Cu2+, 1.0 ml of N4 (200 μm), and 1.0 ml of testing species (400.0 μm) were mixed and filled up with PBS to 10 ml in volumetric tubes. During the titration experiments of ethylenediamine, 1.0 ml of 200.0 μm probes, 1.0 ml of 400.0 μm Cu2+, and different amounts of ethylenediamine were mixed and filled up with PBS to 10.0 ml in volumetric tubes. About 1 ml aliquots were pipetted into a 1-cm cuvette for spectral measurements. About 5 nm bandpasses were used for both excitation and emission wavelengths. For all measurements, the absorbance was recorded at 440 nm and the fluorescence intensity was recorded at 525 nm.
The detection limit was calculated based on the fluorescence data. To determine the δ/S ratio, the emission intensity or absorbance of N4 (20.0 μm) without Cu2+ was measured 10 times, and the standard deviation of the blank measurements was determined. Under the present conditions, a good linear relationship between the relative emission intensity (525 nm) and Cu2+ concentration could be obtained in the 0.0–30.0 μm. The detection limit is then calculated with the equation: detection limit = K × δ/S, where δ is the standard deviation of blank measurements; S is the slope between intensity vs. sample concentration. The fluorescence analysis results are as follows: linear equation: y = 49.559x-91.3 (R2= 0.9922), δ= 19.823 (N = 10), S = 49.559, K = 3; LOD = K × δ/S = 3 ×19.823/49.559 = 1.20 μm.
First, the optical study of the probe N4 was investigated in PBS buffer (10.0 mm, pH = 7.4)/ EtOH (1:1, v/v). As shown in the Supplementary Figure S1 and Figure 1A, when the probe was treated with Cu2+(20.0 μm), the fluorescence intensity at 525 nm was rapidly enhanced, which was attributed to the opening of the loop of the probe spironolactone caused by Cu2+. Meanwhile, the color of the probe solution changed from colorless to green under visible light, indicating that probe N4 can be used for visual detection of Cu2+. As shown in Figure 1B, the enhanced fluorescence intensity at 525 nm was recorded after the addition of Cu2+ (20.0 μm) and reached a plateau after 160 s, indicating that probe N4 can detect Cu2+ rapidly.
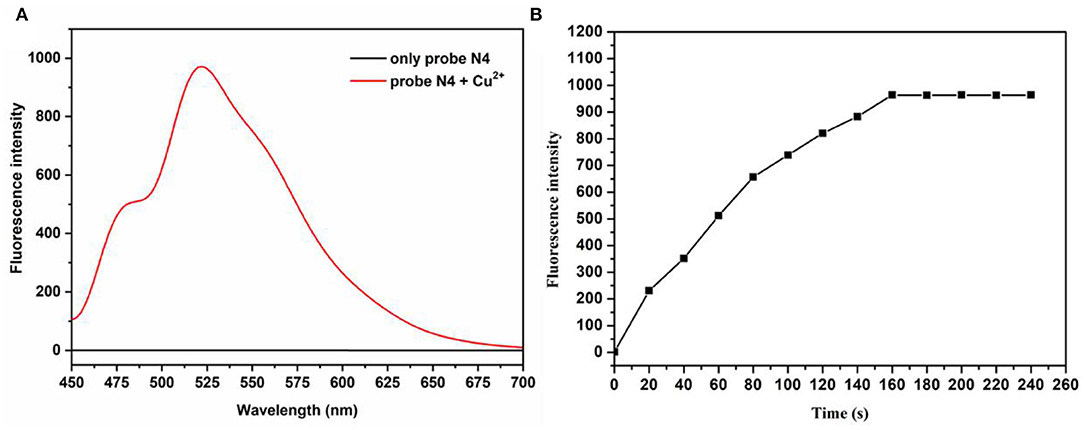
Figure 1. (A) Emission spectra of probes before and after treatment with Cu2+. (B) The time-dependent fluorescence intensity (525 nm) of probe N4 (20.0 μm) upon addition of Cu2+ (20.0 μm). λex = 440 nm.
Next, the titration study was carried out by adding different concentrations of Cu2+ (0–100.0 μm) into the solutions of the probe N4 (20.0 μm). As shown in Figure 2, the fluorescence intensity at 525 nm increased significantly with increasing Cu2+ concentration and reached the maximum value when the Cu2+ concentration up to 5.0 eq. In addition, a good linear relationship was observed between fluorescence intensity and Cu2+ concentration in the range of 0.0–1.5 eq., and the detection limit of probe N4 for Cu2+ was calculated to be 1.2 μm. All the results showed that the probe N4 exhibited good sensitivity and the ability to quantitatively detect Cu2+ in related samples.
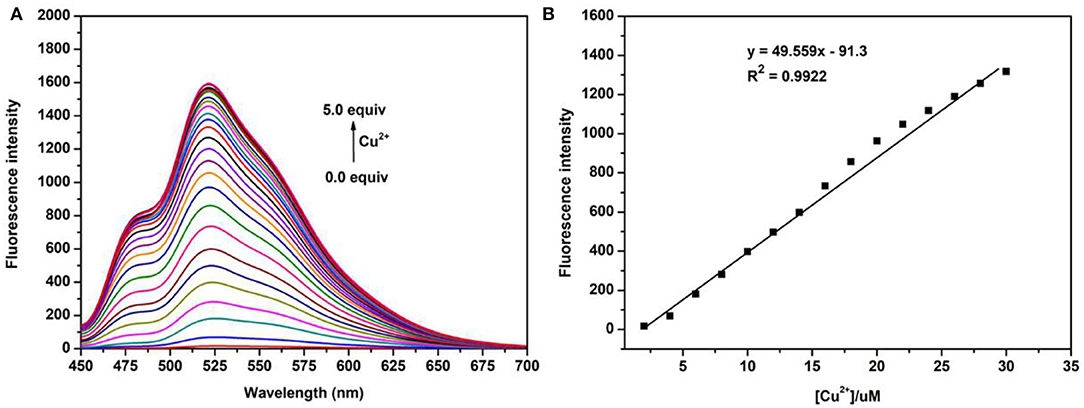
Figure 2. (A) Fluorescence titration of probe N4 (20.0 μm) upon addition of different concentration of Cu2+ (0.0–100.0 μm); (B) the linear correlation between the maximum fluorescence intensity (525 nm) and the concentration of Cu2+; λex = 440 nm.
To further evaluate the selective and anti-interference ability of the probe N4 against Cu2+, we performed selectivity and competition studies of the probe in PBS buffer (10 mm, pH = 7.4)/ EtOH (1:1, v/v). As shown in Figure 3, with the addition of Cu2+, it exhibited an obvious increase in fluorescence spectroscopy at 525 nm which associated with the ring opening of the spirocyclic. In comparison, no obvious fluorescent changes were observed when other ions added. Moreover, the fluorescence properties of the probe with different ions were investigated, and the competition experiment also showed that all of the competing metal ions had no interference on the Cu2+-selective recognition process. In addition, the probe N4 had good selectivity for Cu2+ in the physiological pH range of 6.0 to 9.0 (Supplementary Figure S2).
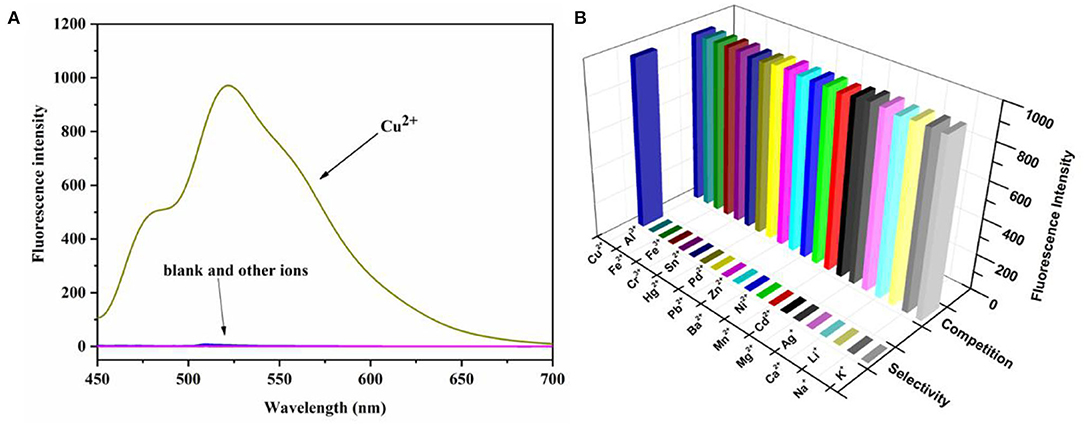
Figure 3. (A) Fluorescence spectrum of N4 (20 μm) in the presence of various metal ions K+, Na+, Li+, Ca2+, Ag+, Mg2+, Cd2+, Mn2+, Ni2+, Ba2+, Zn2+, Pb2+, Pd2+, Hg2+, Sn4+, Cr3+, Fe3+, Fe2+, Al3+, and Cu2+ (40.0 μm) in PBS buffer (10 mm, pH = 7.4)/EtOH (1:1, v/v), λex = 440 nm. (B) Fluorescence intensity (525 nm) selectivity and competition of probe N4 (20 μM) in the presence of various metal ions. The pillars in the front row are: probe N4 (20.0 μM) + various metal ions. The rear pillars are: probe N4 (20.0 μM) + Cu2+ (40.0 μm) + various metal ions. λex = 440 nm.
To understand the interaction between probe N4 and Cu2+, the mechanism was investigated by Job's plots, FT-IR, and MS analysis. The stoichiometric ratio of 1:1 between probe N4 and Cu2+ was gained by Job's plots (Figure 4A).
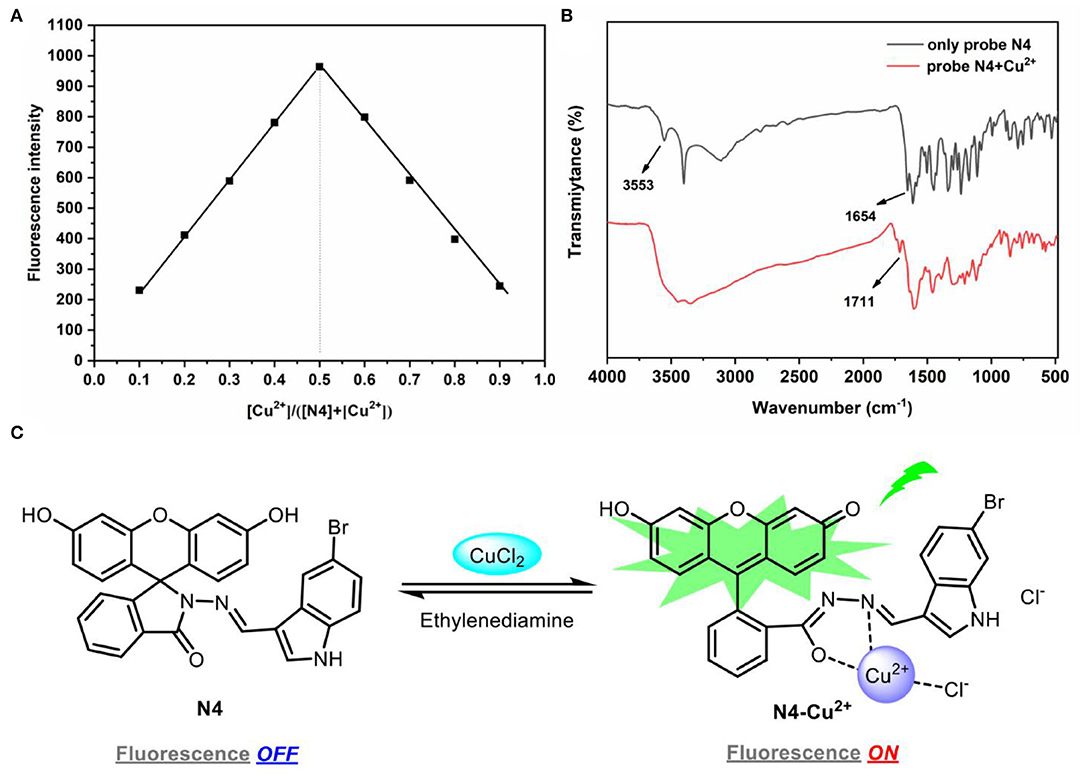
Figure 4. (A) Job's plot of probe N4 and Cu2+. The total concentration of probe N4 and Cu2+ was 40.0 μm. λex = 440 nm; (B) the FT-IR spectra and complex N4-Cu2+; (C) the proposed sensing mechanism of probe N4 with Cu2+.
The FT-IR spectra showed that the peak change from 3,553 (–OH) to 1,711 cm−1 (C=O) after the reaction of probe N4 and Cu2+, which was attributed to the conversion of phenolic hydroxyl group to carbonyl group. The absorption peak of probe N4 at 1,654 cm−1 disappeared, indicating that the amide group was coordinated with Cu2+ (Figure 4B).
In addition, a new peak at m/z 651.1717 [C29H18BrClCuN3O4(M+CuCl)]+ in mass spectra was founded for the complex of probe N4 with Cu2+, which further illustrated the 1:1 complexation (Supplementary Figure S8). Thus, it can be supposed that the coordination of Cu2+ to the nitrogen atom of the Schiff base moiety and the oxygen atom of the amide carbonyl group in fluorescein as well as a free chlorine atom resulted in the Cu2+ induced reversible ring-opening process (Figure 4C).
To further extend the field detection capability of the probe in real samples, we prepared probe-loaded test strips. They were subsequently immersed in different metal ion solutions (K+, Na+, Li+, Ca2+, Ag+, Mg2+, Cd2+, Mn2+, Ni2+, Cu2+, Ba2+, Zn2+, Pb2+, Pd2+, Hg2+, Sn4+, Cr3+, Fe3+, Fe2+, Al3+). It was interesting that only aqueous solutions of Cu2+ caused color changes that could be seen by the “naked eye” especially under UV light (Figure 5).

Figure 5. Photographs of test strips immersed in different analyte aqueous solutions under ambient light (A) and hand-held UV lamp at 365 nm (B).
Based on the excellent performance of the probe N4, we explored the effect of probe N4 on the detection of Cu2+ in cell. First, the cytotoxicity of the probe to MCF-7 cells was investigated using the method of MTT. As shown Supplementary Figure S3, MCF-7 cells were incubated with different concentrations of the probe N4 (0.0–40.0 μm) for 24 h, which indicated the low cytotoxicity of the probe. To further test the bioimaging ability of probe N4 in living cells, the MCF-7 cells were cultured with the probe N4 for 30 min, and no intracellular fluorescence was observed. Then, the cells were treated with Cu2+ (40.0 μm) for 1 h at 37°C, and significant fluorescence from the intracellular area was found. In addition, the bright field images of cells were also seen clearly which further confirmed that the probe has good biocompatibility (Figure 6), indicating the ability of probe for tracking of Cu2+ in living cells.
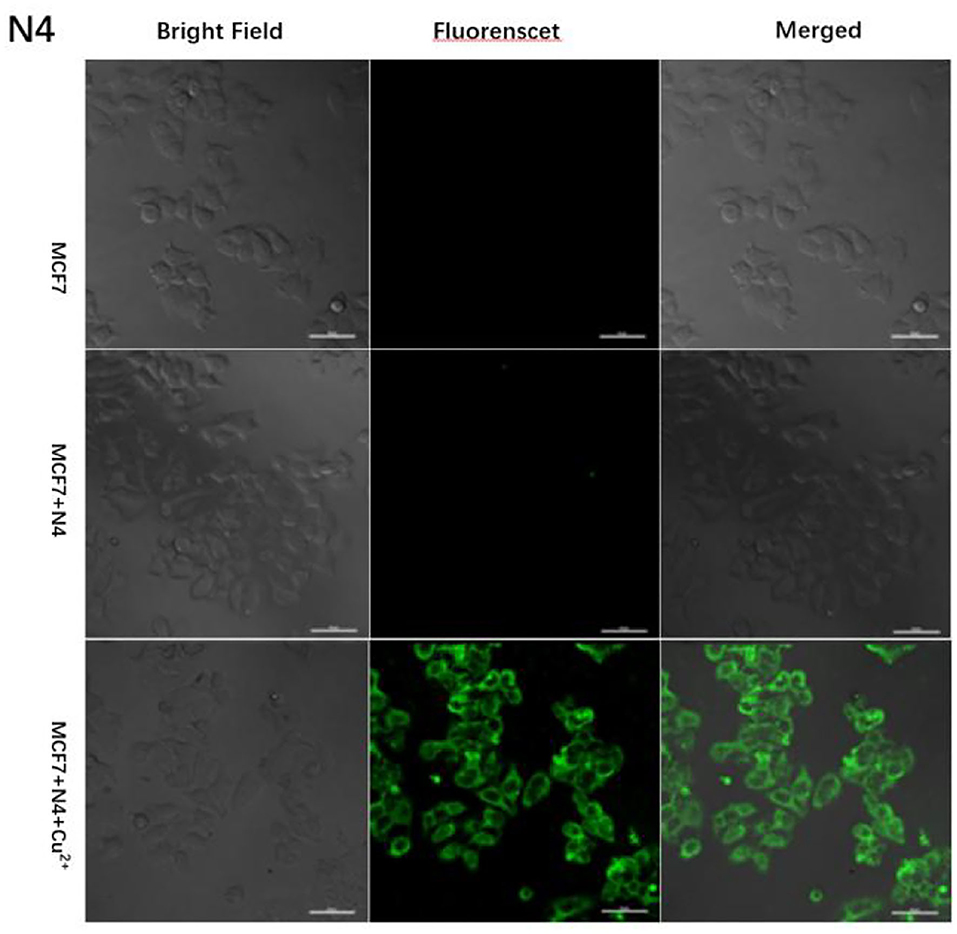
Figure 6. Fluorescent images of MCF-7 cells after incubation with probe N4 (40.0 μm) in the absence and the presence of Cu2+ (40.0 μm).
In conclusion, a novel “turn-on” fluorescent probe N4 was designed and synthesized for detecting Cu2+, and the probe exhibited better selectivity and sensitivity for Cu2+ over other ions. Meanwhile, the binding mode between probe N4 and Cu2+ was studied by Job's plot, FT-IR, and mass experiment, suggesting that the Cu2+ coordination to the Schiff base moiety and the amide carbonyl group of fluorescein induced the fluorescent emission. The probe N4 could detect Cu2+ in water qualitatively by test paper. More importantly, the probe was successfully used to detect Cu2+ in cells and was verified to have low toxicity, which presented a fantastic candidate for mapping of Cu2+ in related biological samples and processes.
The original contributions presented in the study are included in the article/Supplementary Material, further inquiries can be directed to the corresponding author/s.
XL: project administration and writing—original draft. MS: data curation and formal analysis. XJ: writing—review and editing. JC: validation and methodology. XM: formal analysis. FC and JL: supervision. BY: design the protocol and formal analysis. All authors contributed to the article and approved the submitted version.
This work was supported by the grants from the Technology Innovation Leading Program of Shaanxi (Nos. 2020QFY07-05 and 2020TG-031).
The authors declare that the research was conducted in the absence of any commercial or financial relationships that could be construed as a potential conflict of interest.
All claims expressed in this article are solely those of the authors and do not necessarily represent those of their affiliated organizations, or those of the publisher, the editors and the reviewers. Any product that may be evaluated in this article, or claim that may be made by its manufacturer, is not guaranteed or endorsed by the publisher.
The authors wish to acknowledge Prof. Wenhuan Huang, Shaanxi University of Science & Technology, Dr. Zheng Yang, Xi'an University of Science and Technology for their help in interpreting the significance of the result of this study.
The Supplementary Material for this article can be found online at: https://www.frontiersin.org/articles/10.3389/fnut.2022.932826/full#supplementary-material
1. Gupta N, Yadav KK, Kumar V, Kumar S, Chadd RP, Kumar A. Trace elements in soil-vegetables interface: translocation, bioaccumulation, toxicity and amelioration - a review. Sci Total Environ. (2019) 651:2927–42. doi: 10.1016/j.scitotenv.2018.10.047
2. He F, Lu Z, Song M, Liu X, Tang H, Huo P, et al. Selective reduction of Cu2+ with simultaneous degradation of tetracycline by the dual channels ion imprinted Popd-Cofe2o4 heterojunction photocatalyst. Chem Eng J. (2019) 360:750–61. doi: 10.1016/j.cej.2018.12.034
3. Huang R, Cheng R, Jing M, Yang L, Li Y, Chen Q, et al. Source-specific health risk analysis on particulate trace elements: coal combustion and traffic emission as major contributors in Wintertime Beijing. Environ Sci Technol. (2018) 52:10967–74. doi: 10.1021/acs.est.8b02091
4. Vineethkumar V, Sayooj VV, Shimod KP, Prakash V. Estimation of pollution indices and hazard evaluation from trace elements concentration in coastal sediments of Kerala, Southwest Coast of India. Bull Natl Res Centre. (2020) 44:198. doi: 10.1186/s42269-020-00455-0
5. Chung CY-S, Posimo JM, Lee S, Tsang T, Davis JM, Brady DC, et al. Activity-based ratiometric fret probe reveals oncogene-driven changes in labile copper pools induced by altered glutathione metabolism. Proc Natl Acad Sci USA. (2019) 116:18285–94. doi: 10.1073/pnas.1904610116
6. Waggoner DJ, Bartnikas TB, Gitlin JD. The role of copper in neurodegenerative disease. Neurobiol Dis. (1999) 6:221–30. doi: 10.1006/nbdi.1999.0250
7. Camakaris J, Voskoboinik I, Mercer JF. Molecular mechanisms of copper homeostasis. Biochem Biophys Res Commun. (1999) 261:225–32. doi: 10.1006/bbrc.1999.1073
8. Gaggelli E, Kozlowski H, Valensin D, Valensin G. Copper homeostasis and neurodegenerative disorders (Alzheimer's, Prion, and Parkinson's diseases and amyotrophic lateral sclerosis). Chem Inform. (2006) 106:1995–2044. doi: 10.1021/cr040410w
9. Que EL, Domaille DW, Chang CJ. Metals in neurobiology: probing their chemistry and biology with molecular imaging. Chem Rev. (2008) 108:1517–49. doi: 10.1021/cr078203u
10. Walke GR, Ranade DS, Ramteke SN, Rapole S, Satriano C, Rizzarelli E, et al. Fluorescent copper probe inhibiting Aβ1-16-Copper(II)-catalyzed intracellular reactive oxygen species production. Inorg Chem. (2017) 56:3729–32. doi: 10.1021/acs.inorgchem.6b02915
11. Donadio G, Di Martino R, Oliva R, Petraccone L, Del Vecchio P, Di Luccia B, et al. A new peptide-based fluorescent probe selective for Zinc(II) and Copper(II). J Mater Chem B. (2016) 4:6979–88. doi: 10.1039/C6TB00671J
12. Wang G, Wang L, Han Y, Zhou S, Guan X. nanopore detection of copper ions using a polyhistidine probe. Biosens Bioelectron. (2014) 53:453–8. doi: 10.1016/j.bios.2013.10.013
13. Doumani N, Bou-Maroun E, Maalouly J, Tueni M, Dubois A, Bernhard C, et al. A new PH-dependent macrocyclic rhodamine B-based fluorescent probe for copper detection in white wine. Sensors. (2019) 19:4514. doi: 10.3390/s19204514
14. Robinson NJ, Winge DR. Copper metallochaperones. Annu Rev Biochem. (2010) 79:537–62. doi: 10.1146/annurev-biochem-030409-143539
15. Prigge Sean T, Eipper Betty A, Mains Richard E, Amzel LM. Dioxygen binds end-on to mononuclear copper in a precatalytic enzyme complex. Science. (2004) 304:864–67. doi: 10.1126/science.1094583
16. Jung HS, Kwon PS, Lee JW, Kim JI, Hong CS, Kim JW, et al. Coumarin-derived Cu2+-selective fluorescence sensor: synthesis, mechanisms, and applications in living cells. J Am Chem Soc. (2009) 131:2008–12. doi: 10.1021/ja808611d
17. Sanmartín-Matalobos J, García-Deibe AM, Fondo M, Zarepour-Jevinani M, Domínguez-González MR, Bermejo-Barrera P. Exploration of an easily synthesized fluorescent probe for detecting copper in aqueous samples. Dalton Trans. (2017) 46:15827–35. doi: 10.1039/C7DT02872E
18. Cotruvo JJA, Aron AT, Ramos-Torres KM, Chang CJ. synthetic fluorescent probes for studying copper in biological systems. Chem Soc Rev. (2015) 44:4400–14. doi: 10.1039/C4CS00346B
19. Pelin JNBD, Edwards-Gayle CJC, Martinho H, Gerbelli BB, Castelletto V, Hamley IW, et al. Self-assembled gold nanoparticles and amphiphile peptides: a colorimetric probe for copper(II) ion detection. Dalton Trans. (2020) 49:16226–37. doi: 10.1039/D0DT00844C
20. Kierat RM, Krämer R. A fluorogenic and chromogenic probe that detects the esterase activity of trace copper(II). Bioorg Med Chem Lett. (2005) 15:4824–7. doi: 10.1016/j.bmcl.2005.07.042
21. Kazi T, Afridi H, Kazi N, Jamali M, Arain M, Jalbani N, et al. Copper, chromium, manganese, iron, nickel, and zinc levels in biological samples of diabetes mellitus patients. Biol Trace Element Res. (2008) 122:1–18. doi: 10.1007/s12011-007-8062-y
22. Stadler N, Lindner RA, Davies MJ. Direct detection and quantification of transition metal ions in human atherosclerotic plaques: evidence for the presence of elevated levels of iron and copper. Arterioscler Thromb Vasc Biol. (2004) 24:949–54. doi: 10.1161/01.ATV.0000124892.90999.cb
23. Ghaedi M, Ahmadi F. Simultaneous preconcentration and determination of copper, nickel, cobalt and lead ions content by flame atomic absorption spectrometry. J Hazard Mater. (2007) 142:272–8. doi: 10.1016/j.jhazmat.2006.08.012
24. Shokrollahi A, Ghaedi M, Hossaini O, Khanjari N, Soylak M. Cloud point extraction and flame atomic absorption spectrometry combination for copper(II) ion in environmental and biological samples. J Hazard Mater. (2008) 160:435–40. doi: 10.1016/j.jhazmat.2008.03.016
25. Kim KB, Kim H, Song EJ, Kim S, Noh I, Kim C. A cap-type schiff base acting as a fluorescence sensor for zinc(II) and a colorimetric sensor for iron(II), copper(II), and zinc(II) in aqueous media. Dalton Trans. (2013) 42:16569–77. doi: 10.1039/c3dt51916c
26. Park GJ, Hwang IH, Song EJ, Kim H, Kim C. A colorimetric and fluorescent sensor for sequential detection of copper ion and cyanide. Tetrahedron. (2014) 70:2822–8. doi: 10.1016/j.tet.2014.02.055
27. Tautges B, Or V, Garcia J, Shaw JT, Louie AY. Preparation of a conjugation-ready thiol responsive molecular switch. Tetrahedron Lett. (2015) 56:6569–73. doi: 10.1016/j.tetlet.2015.10.019
28. Park SY, Kim W, Park S-H, Han J, Lee J, Kang C, et al. An endoplasmic reticulum-selective ratiometric fluorescent probe for imaging a copper pool. Chem Commun. (2017) 53:4457–60. doi: 10.1039/C7CC01430A
29. Wu X, Wang H, Yang S, Tian H, Liu Y, Sun B. A novel coumarin-based fluorescent probe for sensitive detection of copper(II) in wine. Food Chem. (2019) 284:23–7. doi: 10.1016/j.foodchem.2019.01.090
30. Zeng X, Gao S, Jiang C, Duan Q, Ma M, Liu Z, et al. Rhodol-derived turn-on fluorescent probe for copper ions with high selectivity and sensitivity. Luminescence. (2021) 36:1761–66. doi: 10.1002/bio.4118
31. Huo F-J, Yin C-X, Yang Y-T, Su J, Chao J-B, Liu D-S. Ultraviolet-visible light (Uv–Vis)-reversible but fluorescence-irreversible chemosensor for copper in water and its application in living cells. Anal Chem. (2012) 84:2219–23. doi: 10.1021/ac202734m
32. Xia Y, Yu T, Li F, Zhu W, Ji Y, Kong S, et al. A lipid droplet-targeted fluorescence probe for visualizing exogenous copper (II) based on Llct and Lmct. Talanta. (2018) 188:178–82. doi: 10.1016/j.talanta.2018.05.080
33. Tang Z, Song B, Ma H, Shi Y, Yuan J. A ratiometric time-gated luminescence probe for hydrogen sulfide based on copper(II)-coupled lanthanide complexes. Analy Chim Acta. (2019) 1049:152–60. doi: 10.1016/j.aca.2018.10.048
34. Chen W, Wang T, Zhang Y, Li S, Zhou H, Jia Yb, et al. A seminaphthorhodafluor-based fluorescent probe for H2S detection and its application. Chin J Org Chem. (2020) 40:2956–62. doi: 10.6023/cjoc202006001
35. Zhou Z, Tang H, Chen S, Huang Y, Zhu X, Li H, et al. A turn-on red-emitting fluorescent probe for determination of copper(II) ions in food samples and living zebrafish. Food Chem. (2021) 343:128513. doi: 10.1016/j.foodchem.2020.128513
36. Zhang L, Zhang X. A selectively fluorescein-based colorimetric probe for detecting copper(II) ion. Spectrochim Acta Part A Mol Biomol Spectrosc. (2014) 133:54–9. doi: 10.1016/j.saa.2014.04.130
37. Zhang M, Shen C, Jia T, Qiu J, Zhu H, Gao Y. One-step synthesis of rhodamine-based Fe3+ fluorescent probes via mannich reaction and its application in living cell imaging. Spectroch Acta Part A Mol Biomol Spectrosc. (2020) 231:118105. doi: 10.1016/j.saa.2020.118105
38. Yang Y-S, Liang C, Yang C, Zhang Y-P, Wang B-X, Liu J. A novel coumarin-derived acylhydrazone schiff base gelator for synthesis of organogels and identification of Fe3+. Spectrochim Acta Part A Mol Biomol Spectrosc. (2020) 237:118391. doi: 10.1016/j.saa.2020.118391
39. Wang W, Wu J, Liu Q, Gao Y, Liu H, Zhao B. A highly selective coumarin-based chemosensor for the sequential detection of Fe3+ and pyrophosphate and its application in living cell imaging. Tetrahedron Lett. (2018) 59:1860–5. doi: 10.1016/j.tetlet.2018.04.007
40. Pandith A, Choi J-H, Jung O-S, Kim H-S. A simple and robust pet-based anthracene-appended O-N-O chelate for sequential recognition of Fe3+/CN− ions in aqueous media and its multimodal applications. Inorg Chim Acta. (2018) 482:669–80. doi: 10.1016/j.ica.2018.07.007
41. Shen B-x, Qian Y. Building rhodamine-bodipy fluorescent platform using click reaction: naked-eye visible and multi-channel chemodosimeter for detection of Fe3+ and Hg2+. Sensors Actuat B Chem. (2018) 260:666–75. doi: 10.1016/j.snb.2017.12.146
42. Sui B, Tang S, Liu T, Kim B, Belfield KD. Novel Bodipy-Based Fluorescence Turn-On Sensor for Fe3+ and its bioimaging application in living cells. ACS Appl Mater Interfaces. (2014) 6:18408–12. doi: 10.1021/am506262u
43. Zhang Y, Li L, Wang J, Jia L, Yang R, Guo X. A 4,5-Quinolimide-based fluorescent sensor for sequential detection of Cu2+ and cysteine in water and living cells with application in a memorized device. Spectrochim Acta Part A Mol Biomol Spectrosc. (2020) 230:118030. doi: 10.1016/j.saa.2020.118030
44. Zhang Y, Li S, Zhang H, Xu H. Design and application of receptor-targeted fluorescent probes based on small molecular fluorescent dyes. Bioconj Chem. (2021) 32:4–24. doi: 10.1021/acs.bioconjchem.0c00606
Keywords: trace metal, fluorescent probe, copper ion, test strips, cells imaging
Citation: Leng X, She M, Jin X, Chen J, Ma X, Chen F, Li J and Yang B (2022) A Highly Sensitive and Selective Fluorescein-Based Cu2+ Probe and Its Bioimaging in Cell. Front. Nutr. 9:932826. doi: 10.3389/fnut.2022.932826
Received: 30 April 2022; Accepted: 19 May 2022;
Published: 27 June 2022.
Edited by:
Shuai Mao, Xi'an Jiaotong University, ChinaReviewed by:
Zhenhuan Lu, Guilin University of Technology, ChinaCopyright © 2022 Leng, She, Jin, Chen, Ma, Chen, Li and Yang. This is an open-access article distributed under the terms of the Creative Commons Attribution License (CC BY). The use, distribution or reproduction in other forums is permitted, provided the original author(s) and the copyright owner(s) are credited and that the original publication in this journal is cited, in accordance with accepted academic practice. No use, distribution or reproduction is permitted which does not comply with these terms.
*Correspondence: Fulin Chen, Y2hlbmZsQG53dS5lZHUuY24=; Jianli Li, bGlqaWFubGlAbnd1LmVkdS5jbg==
Disclaimer: All claims expressed in this article are solely those of the authors and do not necessarily represent those of their affiliated organizations, or those of the publisher, the editors and the reviewers. Any product that may be evaluated in this article or claim that may be made by its manufacturer is not guaranteed or endorsed by the publisher.
Research integrity at Frontiers

Learn more about the work of our research integrity team to safeguard the quality of each article we publish.