
95% of researchers rate our articles as excellent or good
Learn more about the work of our research integrity team to safeguard the quality of each article we publish.
Find out more
ORIGINAL RESEARCH article
Front. Nutr. , 29 August 2022
Sec. Nutrition and Metabolism
Volume 9 - 2022 | https://doi.org/10.3389/fnut.2022.929446
This article is part of the Research Topic Diet-Microbe-Host Interactions in Metabolic Syndrome View all 12 articles
 Sophie B. Chehade1
 George B. H. Green1
 Christopher D. Graham1
 Ayanabha Chakraborti2
 Bijal Vashai2
 Amber Moon2
 Michael B. Williams1
 Benjamin Vickers2
 Taylor Berryhill3
 William Van Der Pol4
 Landon Wilson5
 Mickie L. Powell1
 Daniel L. Smith Jr.6
 Stephen Barnes3
 Casey Morrow7
 M. Shahid Mukhtar1
 Gregory D. Kennedy2
 James A. Bibb2
 Stephen A. Watts1*
Investigations into the causative role that western dietary patterns have on obesity and disease pathogenesis have speculated that quality and quantity of dietary fats and/or carbohydrates have a predictive role in the development of these disorders. Standard reference diets such as the AIN-93 rodent diet have historically been used to promote animal health and reduce variation of results across experiments, rather than model modern human dietary habits or nutrition-related pathologies. In rodents high-fat diets (HFDs) became a classic tool to investigate diet-induced obesity (DIO). These murine diets often relied on a single fat source with the most DIO consistent HFDs containing levels of fat up to 45-60% (kcal), higher than the reported human intake of 33–35% (kcal). More recently, researchers are formulating experimental animal (pre-clinical) diets that reflect mean human macro- and micronutrient consumption levels described by the National Health and Nutrition Examination Survey (NHANES). These diets attempt to integrate relevant ingredient sources and levels of nutrients; however, they most often fail to include high-fructose corn syrup (HFCS) as a source of dietary carbohydrate. We have formulated a modified Standard American Diet (mSAD) that incorporates relevant levels and sources of nutrient classes, including dietary HFCS, to assess the basal physiologies associated with mSAD consumption. Mice proffered the mSAD for 15 weeks displayed a phenotype consistent with metabolic syndrome, exhibiting increased adiposity, fasting hyperglycemia with impaired glucose and insulin tolerance. Metabolic alterations were evidenced at the tissue level as crown-like structures (CLS) in adipose tissue and fatty acid deposition in the liver, and targeted 16S rRNA metagenomics revealed microbial compositional shifts between dietary groups. This study suggests diet quality significantly affects metabolic homeostasis, emphasizing the importance of developing relevant pre-clinical diets to investigate chronic diseases highly impacted by western dietary consumption patterns.
Obesity and related metabolic syndrome (MetS) are widespread in developed countries. Dietary consumption patterns generally referred to as the “Western Diet” (WD) have been scrutinized as possible causes of MetS (1, 2). The WD is characterized by increased consumption of processed foods, added sugars, saturated fat, sodium, and a high ratio of omega-6: omega-3 polyunsaturated fatty acids (PUFAs). The WD pattern is typically low in fibrous fruits and vegetables (3). From 1970 to 2003, the average daily calorie intake increased by 523 kcal with a concomitant 63% increase in consumption of animal fats and vegetable oils as well as a 19% increase of sugars (4). The quantity and quality of these dietary fats and sugars have been investigated as possible causes of diet-related health disorders (5, 6).
Understanding the etiology of MetS is paramount to identifying and treating at-risk populations. The strong association between WD patterns and the development of MetS highlights the importance of establishing a pre-clinical model that incorporates human-relevant dietary patterns (2). Currently, most researchers applying pre-clinical rodent models utilize standardized reference diets, such as AIN-93, in their studies (3). These semi-purified diets were originally created to address concerns of variation in results among experiments and are formulated to promote reproducible health and reproductive parameters of the model organism (7). Although these diets have been invaluable for standardizing murine research (8), they may not be adequate to model human nutrition-related pathologies. Historically, nutrition experiments utilizing rodent models employ experimental diets that are produced by modification of reference diets for specific ingredients or nutrient classes, such as protein, fat, or carbohydrate. Although useful for understanding disease pathologies induced by one specific nutrient change (over or under exposure), these altered diets are not representative of what is being consumed on average in the United States and have limited translatability to the average human population (2). For example, the classic high-fat diet (HFD) contains approximately 45–60% of kcal as fat derived from one or few dietary fat sources, typically lard and/or tallow, and has been successful in inducing MetS and associated pathologies (9). According to the CDC, however, the mean fat intake for men and women over 20 years old is approximately 34–35% of their caloric intake (10). Similar to the pitfalls of HFDs, choline-deficient diets are utilized to induce non-alcoholic fatty liver disease (NAFLD) associated with MetS, yet they fail to produce NAFLD that manifests in a physiologically relevant way to the human population (2). While of basic interest, these commonly used experimental diets may not accurately replicate the pathogenesis of metabolic disorders, resulting in poor translatability to human populations.
Recently, two groups of investigators designed WDs in accordance with survey responses reported by the National Health and Nutrition Examination Survey (NHANES) to reflect average human consumption patterns. Monsanto et aldeveloped the Total Western Diet (TWD) to address overestimations of fat intake as well as lack of inclusion of multiple sources of fat in previously established diets (3). Totsch et al. further modified the TWD to produce the Standard American Diet (SAD), incorporating multiple sources of dietary fat as well as human-relevant levels of omega-6: omega-3 PUFA (11). The primary source of carbohydrate in both the TWD and the SAD is sucrose; however, NHANES reports that sugar-sweetened beverages (SSBs) are primary contributors to added sugars being consumed across multiple age-groups in the United States (12). SSBs such as soft drinks are commonly sweetened with high fructose corn syrup (HFCS) and are associated with an increased risk for obesity (13).
There is increasing evidence that fructose consumption may be related to the development of metabolic disorders associated with obesity (2, 14–18). Following its introduction in the 1970s, HFCS consumption markedly increased until the early 2000s (19). During this time, rates of obesity increased (20), leading many to hypothesize that fructose may be at least partially responsible (21). The HFCS contained in SSBs, HFCS-55, is an unequal mixture of glucose and fructose monosaccharides that are produced by a series of enzymatic reactions which convert extracted corn starch to glucose and fructose at levels of ca. 45 and 55%, respectively (22). In contrast, sucrose is a disaccharide composed of a 50:50 ratio of glucose: fructose.
To investigate the association of WD and the development of MetS, we have formulated a modified version of the SAD that reflects above-average macronutrient intakes as reported by NHANES. The modified SAD (mSAD) incorporates HFCS within the feed, an important distinction from diets that introduce HFCS in an ad libitum drinking solution (23). Beyond formulating the diet, we have characterized the basal physiologies of C57BL/6J mice consuming this diet. We hypothesize that a diet that represents above-average human intakes will produce metabolic phenotypes consistent with those seen in human populations with a greater incidence of obesity and MetS.
All experiments were approved by the Institutional Animal Care and Use Committee at the University of Alabama at Birmingham (UAB), Birmingham, AL (IACUC-21005). Male C57BL/6J mice were obtained from Jackson Labs (000664) at 4 weeks of age and housed in AAALAC-approved facilities at UAB with a 12:12 h dark: light cycle (06:00–18:00). Mice were housed in groups of 3 in wire-top cages with ad libitum access to food and sterile water. Mice were acclimated for 7 days and then randomly assigned to the AIN93M control diet (CON) or the experimental diet (mSAD) at 5 weeks of age. Mice were proffered diets for 15 weeks. Food and water intake for each cage of mice were recorded weekly, and nutrient intake parameters were calculated from these records.
C57BL/6J male mice were assigned randomly to one of two groups (n = 12 total, n = 6/group, n = 3/cage, n = 2 cages/group) and proffered either the CON or the mSAD for a period of 15 weeks. The CON (AIN-93M, TD.94048, Envigo, Madison, WI, United States) is formulated for optimal health and is a common standard reference diet used in rodent research (7). AIN-93M consists of 12.4% protein (13.7% kcal), 68.3% carbohydrate (75.9% kcal), and 4.1% fat (10.3% kcal) (Table 1). The modified Standard American diet (mSAD, TD.180061, Envigo, Madison, WI, United States) was formulated to approximate 50th percentile macronutrient intakes from data reported by NHANES. Macro- and micronutrient levels are listed in Table 1 and Table 2, respectively. The mSAD is composed of 12.3% protein dry matter (12.2% kcal), 49.5% carbohydrate (49.2% kcal), and 17.3% fat (38.6% kcal) (Table 1). The mSAD contains HFCS as the primary source of carbohydrate at a level of 26% of the diet (by weight). Multiple sources of saturated and unsaturated fat were incorporated in the mSAD, including palm oil, soybean oil, corn oil, cottonseed oil, lard, beef tallow, and anhydrous milkfat (Table 1). Moreover, the mSAD contains reduced levels of fiber and increased levels of sodium, which are supported by NHANES data (7).
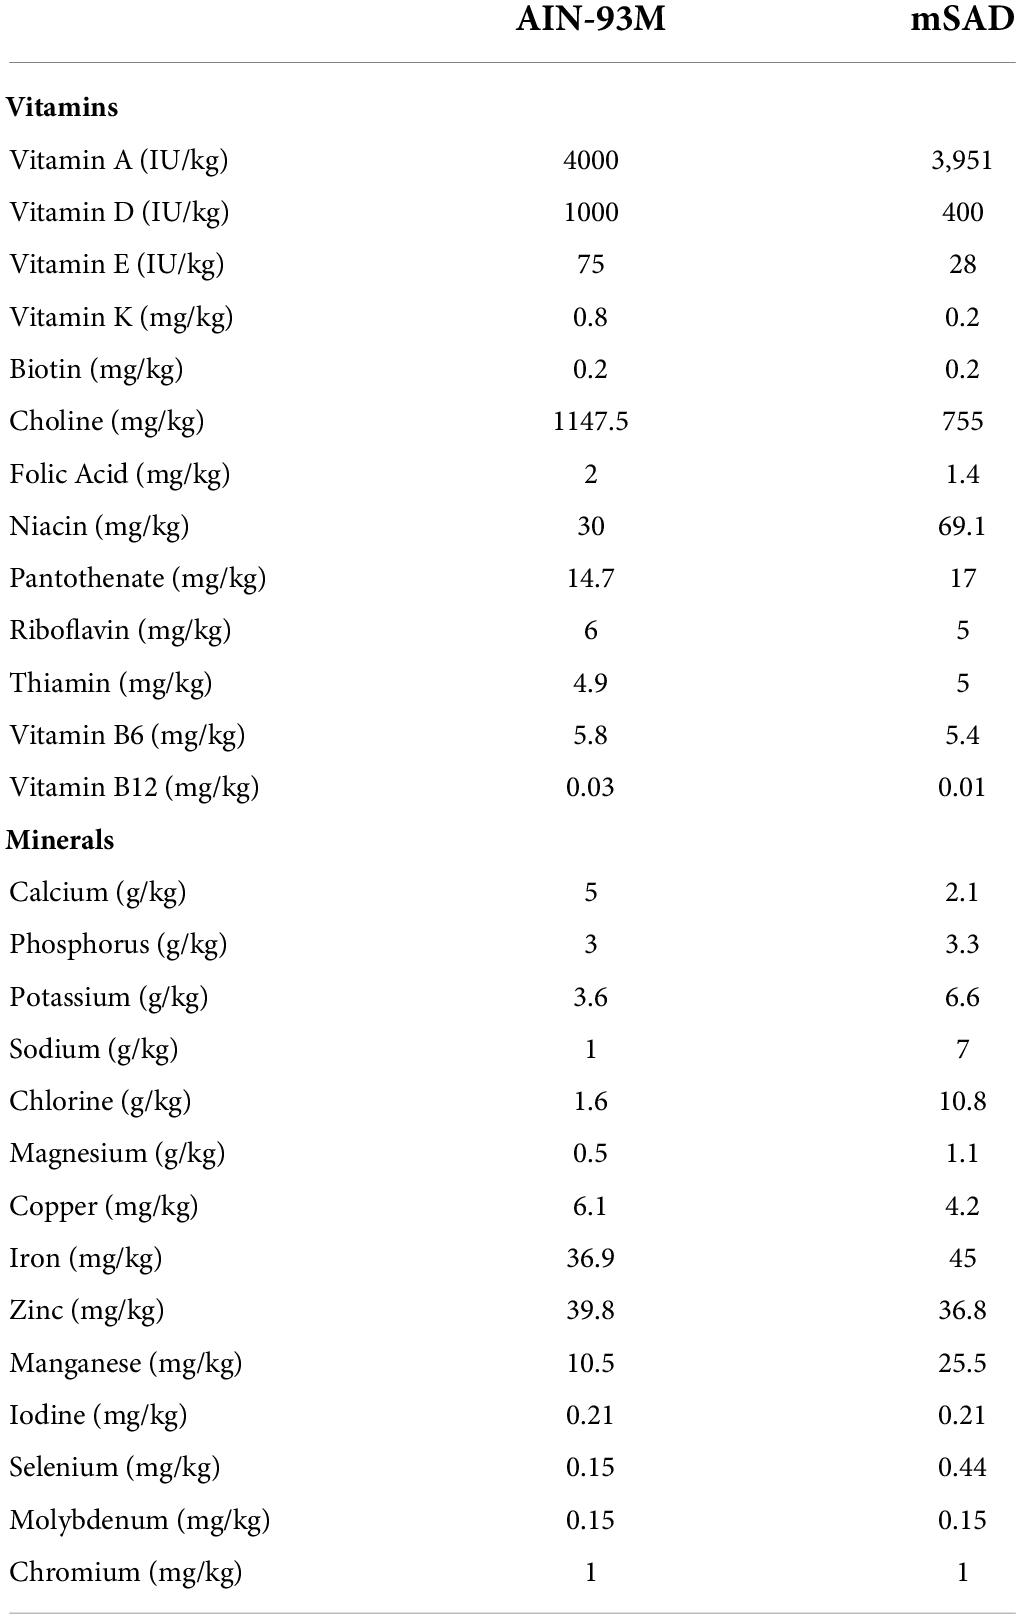
Table 2. AIN-93M control diet (CON) and modified Standard American Diet (mSAD) micronutrient profiles.
To assess body weight over time, individual body weights were measured weekly. Weight gain was calculated by subtracting the previous week’s weight from the current week. Specific growth rate (SGR) was calculated using the following formula:
Quantitative Magnetic Resonance (QMR) was performed according to previously published methods (24) on mice at weeks 4, 6, 7, 10, and 12 to measure in vivo fat and lean-tissue mass (EchoMRI™ 3-in-1; Echo Medical Systems, Houston, TX, United States). Due to technical issues, QMR could not be performed at the termination of the study; however, QMR lean mass values for week 15 were predicted using a simple linear regression.
Glucose tolerance tests (GTT) and insulin tolerance tests (ITT) were performed to evaluate glucose and insulin response, respectively. Tests were performed after 4, 6, 10, and 12 weeks of diet exposure. Mice were weighed and fasted prior to testing (5-h fast for GTT, 4-h fast for ITT). For GTTs, mice received i.p. injection of a 25% glucose solution in phosphate-buffered saline (PBS) at a concentration of 2 g/kg body weight and blood glucose was monitored at 0, 15, 30, 60, and 120 min post-injection. For ITTs, mice received i.p. injection of insulin at 0.5 U/kg body weight. Blood glucose was measured at 0, 15, 30, 45, 60, and 120 min following injection. All blood samples were collected via tail vein venipuncture and blood glucose was measured using a Contour glucose meter (Bayer 82486543).
Following termination of the study, mice were euthanized by decapitation and trunk blood was collected for downstream analyses. Adipose depots (inguinal, dorsal, peri-renal, gonadal, mesenteric, and interscapular) and internal organs (kidney, liver, spleen, and alimentary canal) were dissected and weighed individually. Following overnight fixation in 10% Neutral Buffered Formalin (NBF), liver and adipose tissues were processed and embedded in paraffin by UAB’s Molecular Detection Core Facility. Tissues were sectioned at 5 μm and mounted onto glass slides. To assess hepatic lipid deposition, liver sections were stained with Hematoxylin and Eosin (H&E). For CLS detection, adipose sections were stained with anti-Mac-2 antibody (1:2,800; Cedarlane Laboratories 61R-1589) followed by hematoxylin counterstaining. Slides were imaged using a Nikon stereomicroscope (Nikon SMZ1000N, Nikon, Melville, NY, United States). The total area occupied by CLS from the full field of each tissue section was quantified using NIS Elements imaging software (NIS Elements BR 3.2, Nikon, Melville, NY, United States).
Total RNA was collected from proximal colon tissue using the RNeasy Plus Mini Kit (Qiagen 74134) per the manufacturer’s instructions followed by quantification and purity assessment on a NanoDrop One (Thermo Fisher Scientific). RNA with a concentration >30 ng/μl and A260/280 > 2.00 was processed into complementary DNA (cDNA) using a High Capacity cDNA Reverse Transcription Kit (Applied Biosystems 4368814) per the manufacturer’s instructions (200 ng RNA/reaction). cDNA was used in duplicate as a template for qRT-PCR using Taqman Fast Advanced Master Mix (Applied Biosystems 4444556) and the following primers on a QuantStudio 6 Flex (Applied Biosystems): Actin (Mm02619580_g1), TNFα (Mm00443258_m1), IL-1β (Mm00434228_m1), IL-6 (Mm00446190_m1). The 2^(-delta Ct) method was used to calculate relative gene expression from raw cycle threshold (Ct) values and target gene expression was normalized to actin.
Microbiome analysis was performed according to previously published methods (25). After 15 weeks of diet, feces were collected and fecal DNA was isolated using the Fecal DNA Isolation Kit (Zymo Research, Irvine, CA, United States, cat. no. 06010) and a 250 base pair amplicon library was generated via PCR with primers specific for the V4 region of the rRNA gene. PCR products were electrophoresed on agarose gel and subsequently excised from the gel and purified using the QIAquick Gel Extraction Kit (Qiagen, cat. no. 28704). Next-generation sequencing was accomplished using the Illumina MiSeq (Illumina, San Diego, CA, United States, cat. no. SY-410-1003) and microbiome analysis was performed using QIIME2 (Quantitative Insights Into Microbial Ecology) (25).
The taxonomic composition of the mouse fecal mSAD and control samples were determined utilizing QIIME2 (v.2021.11) bioinformatics tools (26). The samples raw sequence files was demultiplexed, via the Casava 1.8 paired-end demultiplexed fastq format, followed by denoising using DADA2 (q2-dada2) for quality filtering (27). The alignment of amplicon sequence variants (ASVs) was achieved using mafft (q2-alignment) (28), and the results were exported into fasttree2 (q2-phylogeny plugin) for phylogeny construction, using the FastTree building method (default setting) (29). The “Core-metrics-phylogenetic” command (q2-diversity plugin) generated Alpha-diversity metrics (Faith’s Phylogenetic Diversity, and observed features) (30), Shannon (31), Simpson (32), chao1 (33), beta diversity metrics, un-weighted UniFrac, weighted UniFrac (34), Principle Coordinate Analysis (PCoA), Bray–Curtis dissimilarity, and Jaccard distance. The samples based off the minimum value of 15,411 sequences per sample were rarefied (subsampled without replacement). Taxonomic assignment to ASVs was achieved via q2-feature-classifier plugin (35), utilizing the “classify-sklearn” command against the silva-138-99-nb-classifier (36). The taxa were then collapsed into table format using the “qiime taxa collapse” command. Adonis and PERMANOVA beta-diversity metrics were determined via “qiime diversity beta-group-significance” plug-in (37).
Statistical analysis was performed using Prism 9.0 software (GraphPad Software, San Diego, CA, United States) and R software (R Core Team (38)). Statistical significance was determined using Student’s t-test (when comparing two groups), Welch’s T-test (when comparing two groups with unequal variances), Wilcoxon T-test (when comparing two groups when data was not normally distributed), one-way analysis of variance (ANOVA) (when comparing more than two groups with one independent variable) or two-way ANOVA (when comparing more than two groups with two or more independent variables). When applicable, a Tukey–Kramer post-hoc test was used to calculate the Minimum Significant Difference (MSD) between any pair of means and statistical significance was assigned to groups with differences between the means greater than the MSD. A p-value < 0.05 was considered significant.
Weight and body composition parameters recorded during the study revealed immediate and significant changes to the physical state of mice in response to mSAD feeding. After 15 weeks, mSAD-fed mice exhibited significantly more weight gain and a higher SGR than their CON counterparts (Figures 1A–D). Mice fed the mSAD accumulated higher absolute amounts of fat mass as well as a percentage of body weight than CON (Figures 1E,F). Both diets induced lean mass accumulation at a similar rate throughout the study (Figure 1G), but not as a percentage of total mass (Figure 1H).
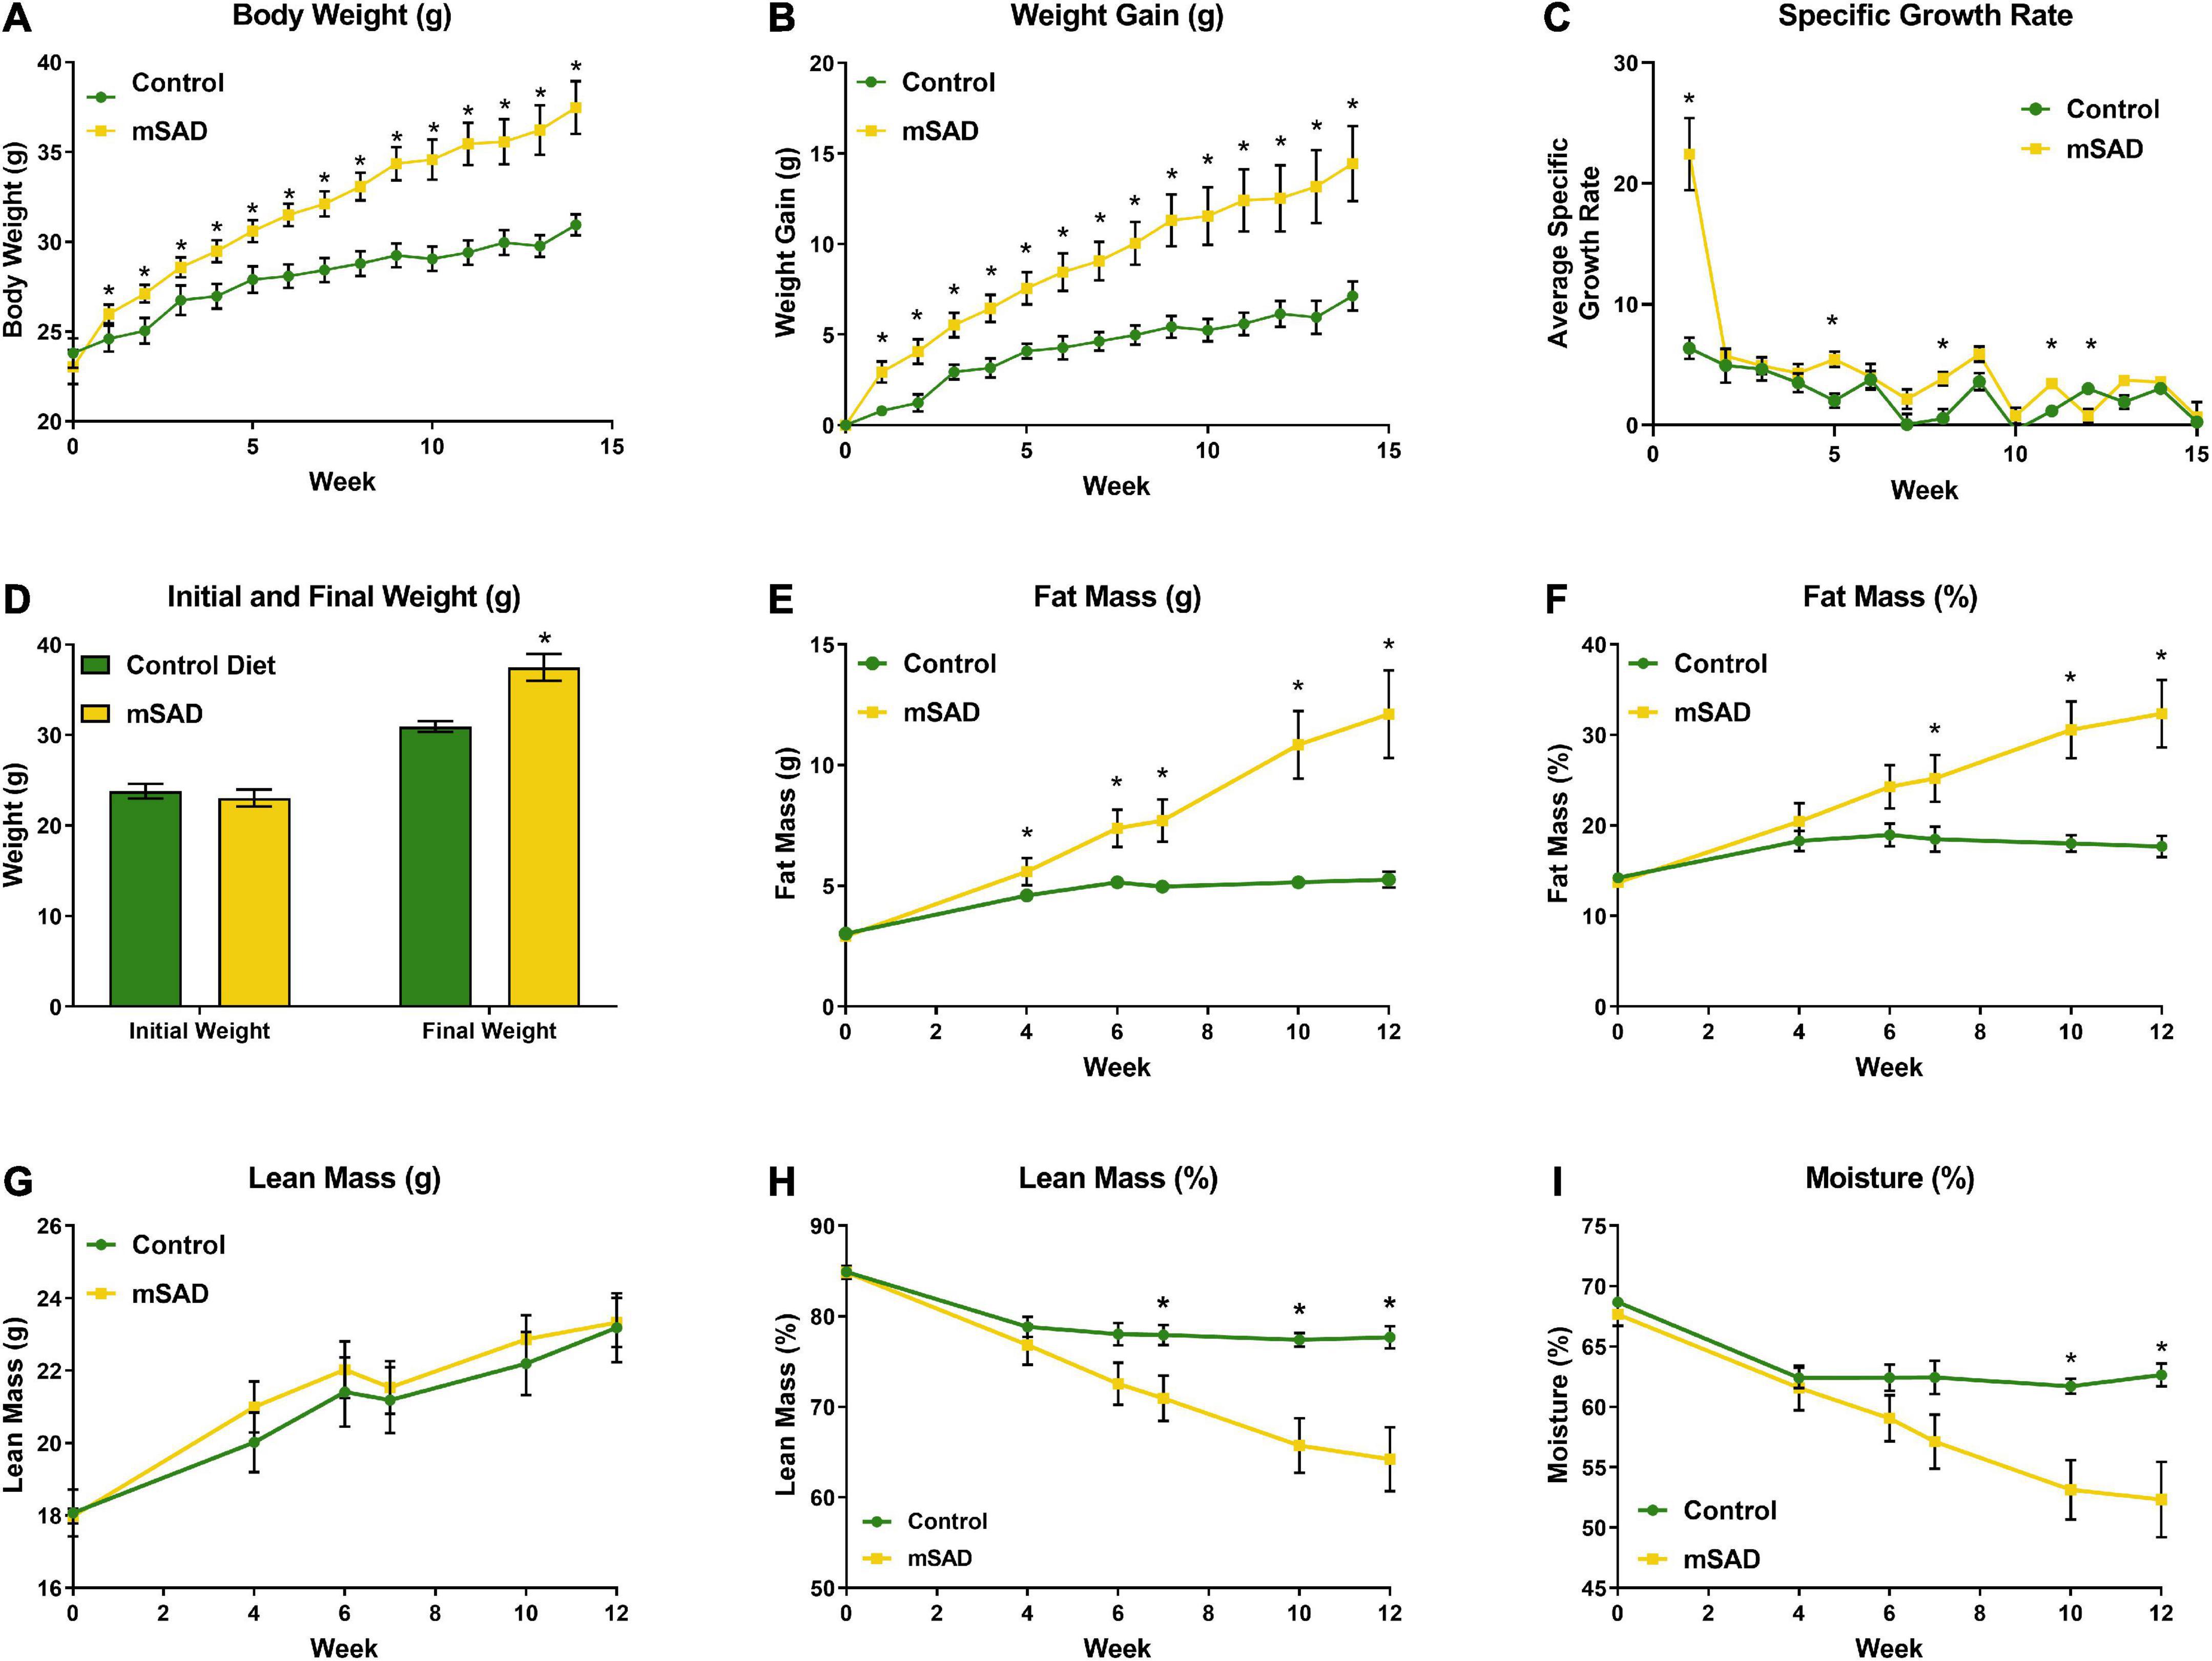
Figure 1. Effects of diet on weight and body composition. Male C57BL/6J mice were proffered the CON or the mSAD diet for a 15-week period. (A) Body weight was measured weekly (n = 12/diet). (B) Cumulative weight gain and (C) specific growth rate for each diet. (D) Initial and final weights for each diet. QMR analysis at 4, 6, 7, 10, and 12 weeks (n = 6/diet) includes (E) g fat mass, (F) % fat mass, (G) g lean mass, (H) % lean mass, and (I) percent water. Values are represented as mean ± SEM. Data were compared using Welch’s t-test. *p < 0.05.
Within the first week, water intake was higher in the mSAD diet compared to CON (Figure 2A). However, water intake in CON mice increased over the feeding period. Water intake values displayed high levels of variance, in some cases due to issues with leaky sippers that were noted at a few timepoints during the study. No change in weekly or overall food intake was observed between diet treatments (Figures 2B–D); however, because the mSAD had a higher caloric density, total energy intake in mSAD-fed mice was slightly higher (3,742 kcal) than in CON (3,314 kcal) (Figure 2E). Caloric efficiency, defined as total mg of weight gained/total kcal consumed, was significantly higher in mSAD-fed mice (Figure 2F). At the macronutrient level, mSAD-fed mice consumed more fat and less carbohydrate than CON mice, with no differences in protein intake (Figures 2G–I).
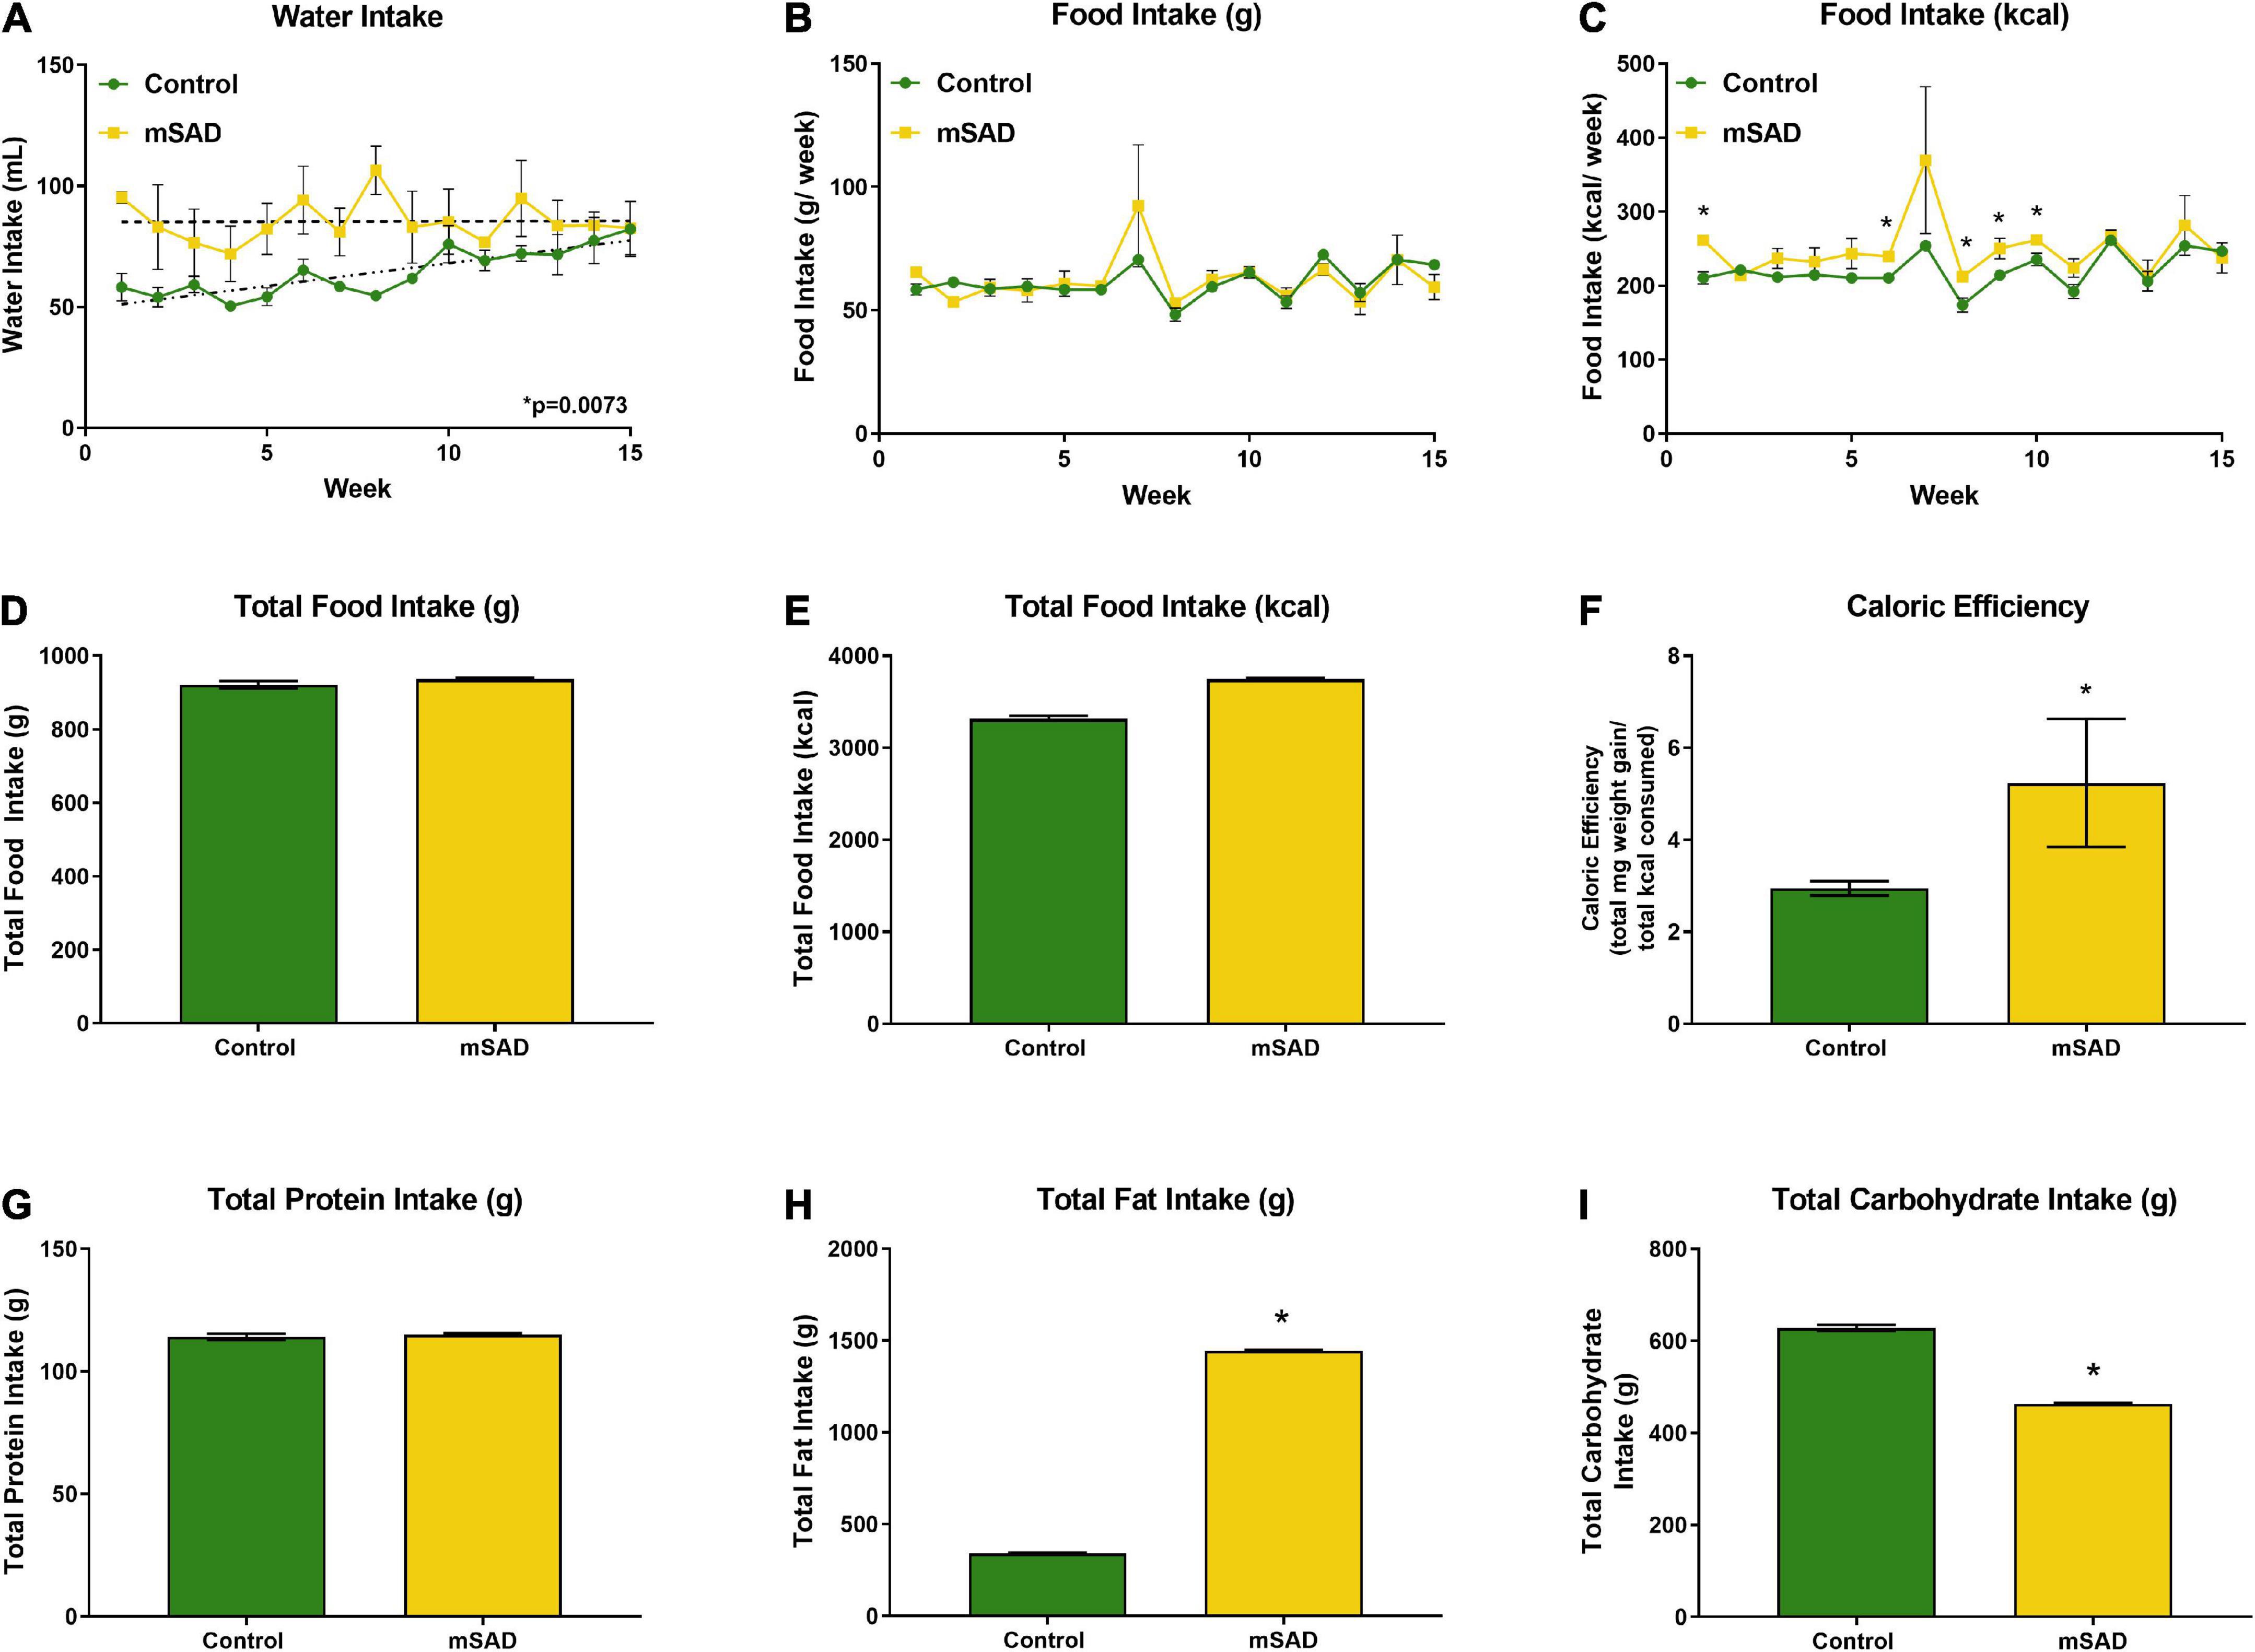
Figure 2. Water, food, and macronutrient intake. All values represent average cage intake (n = two cages, each containing three mice). Water intake was measured as mL per cage per week (A). Food intake was measured as g per cage per week by a subtractive method of weekly provision minus weekly remnants (B) and kcal consumed per week (C). Total food intake (g) (D) and kcal consumption (E) for the 15-week period. Caloric efficiency for each diet was calculated as total mg weight gain/total kcal consumed for the 15-week period (F). Total protein (G), lipid (H), and carbohydrate intake (I) were calculated. Values are represented as mean ± SEM. Data were compared using Welch’s t-test. *p < 0.05.
To assess whether the changes in body composition in response to mSAD intake are associated with metabolic alterations in glucose and insulin signaling, GTT and ITT were recorded during the study period. Prior to diet administration, mice showed no difference in fasting blood glucose or glucose tolerance (Figure 3A). However, mSAD-fed mice displayed fasting hyperglycemia and impaired glucose tolerance at every timepoint measured relative to CON mice (Figures 3B–E). Similarly, mSAD-fed mice display impaired insulin responsiveness at all time points measured (Figures 3F–H). At week 12, 4 of 6 control mice fell below the glucose threshold, forcing premature termination of the assay with no subsequent data collection.
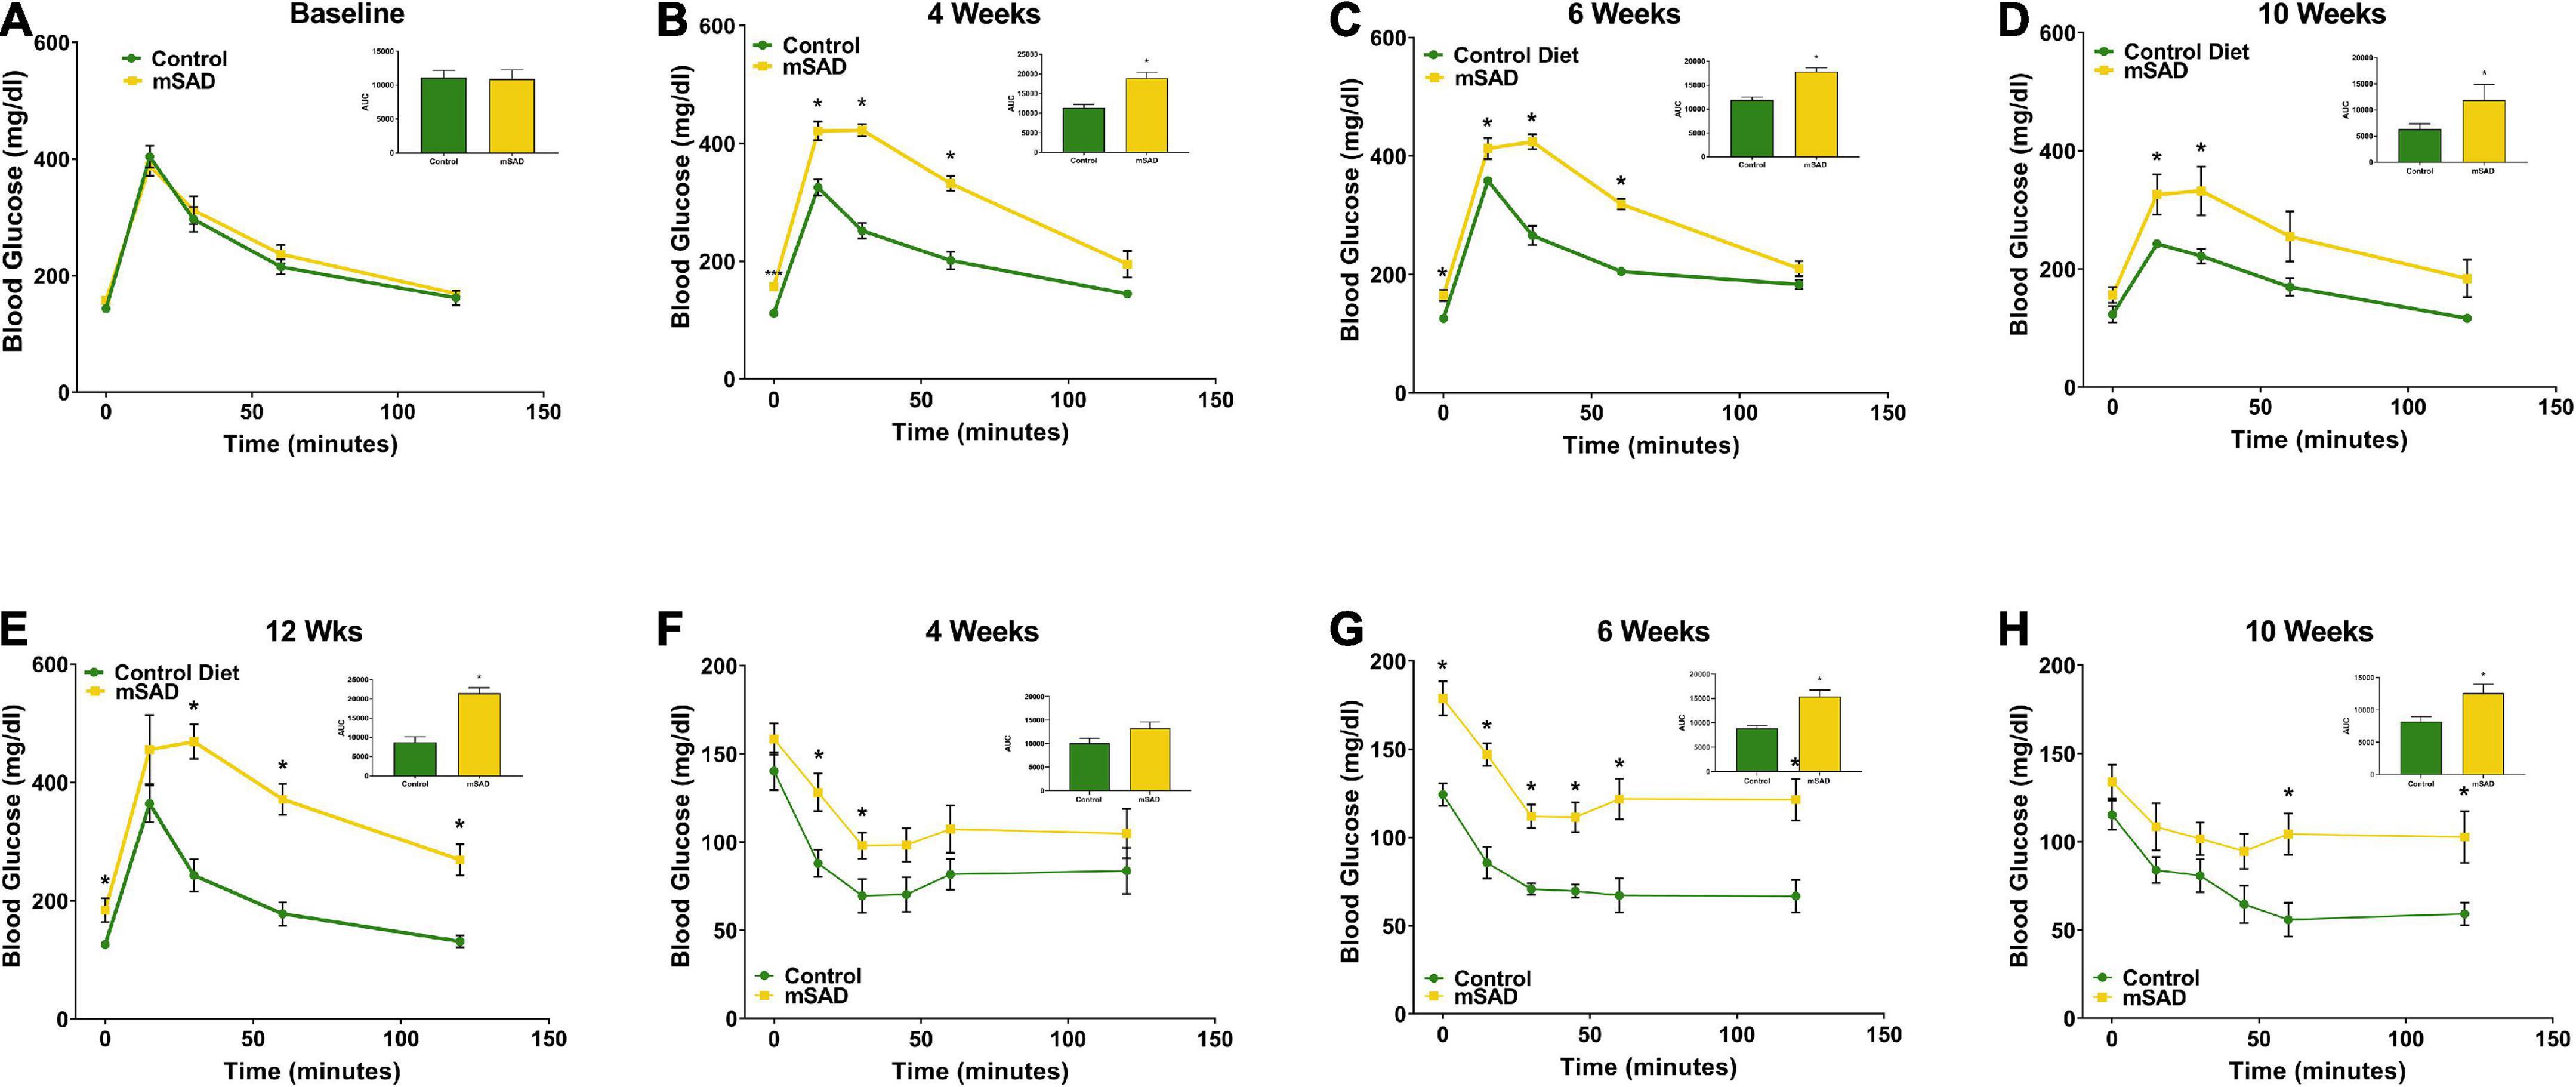
Figure 3. Effects of diet on glucose and insulin response. Glucose tolerance tests were performed prior to the feeding regimen (A) and after weeks 4 (B), 6 (C), 10 (D), and 12 (E) weeks of diet. Insulin tolerance tests were performed after weeks 4, (F), 6 (G), and 10 (H) weeks of diet. Values are represented as mean ± SEM (n = 4–6/time point). Data were compared using Welch’s t-test. *p < 0.05.
Following termination of the study, mice were euthanized, and adipose depots, kidneys, liver, spleen, and alimentary canal were dissected and weighed for further assessment of mSAD alterations at the tissue-level. Inguinal, dorsal, peri-renal, and gonadal depot weights of mSAD-fed mice were significantly heavier than CON mice (Figure 4A). Organ weights were evaluated by normalizing their absolute weight with regression-predicted lean matter weights at the 15-week timepoint. Although data cannot be statistically compared, organs of mSAD animals overall appeared larger than those in the control group (Figures 4B–E).
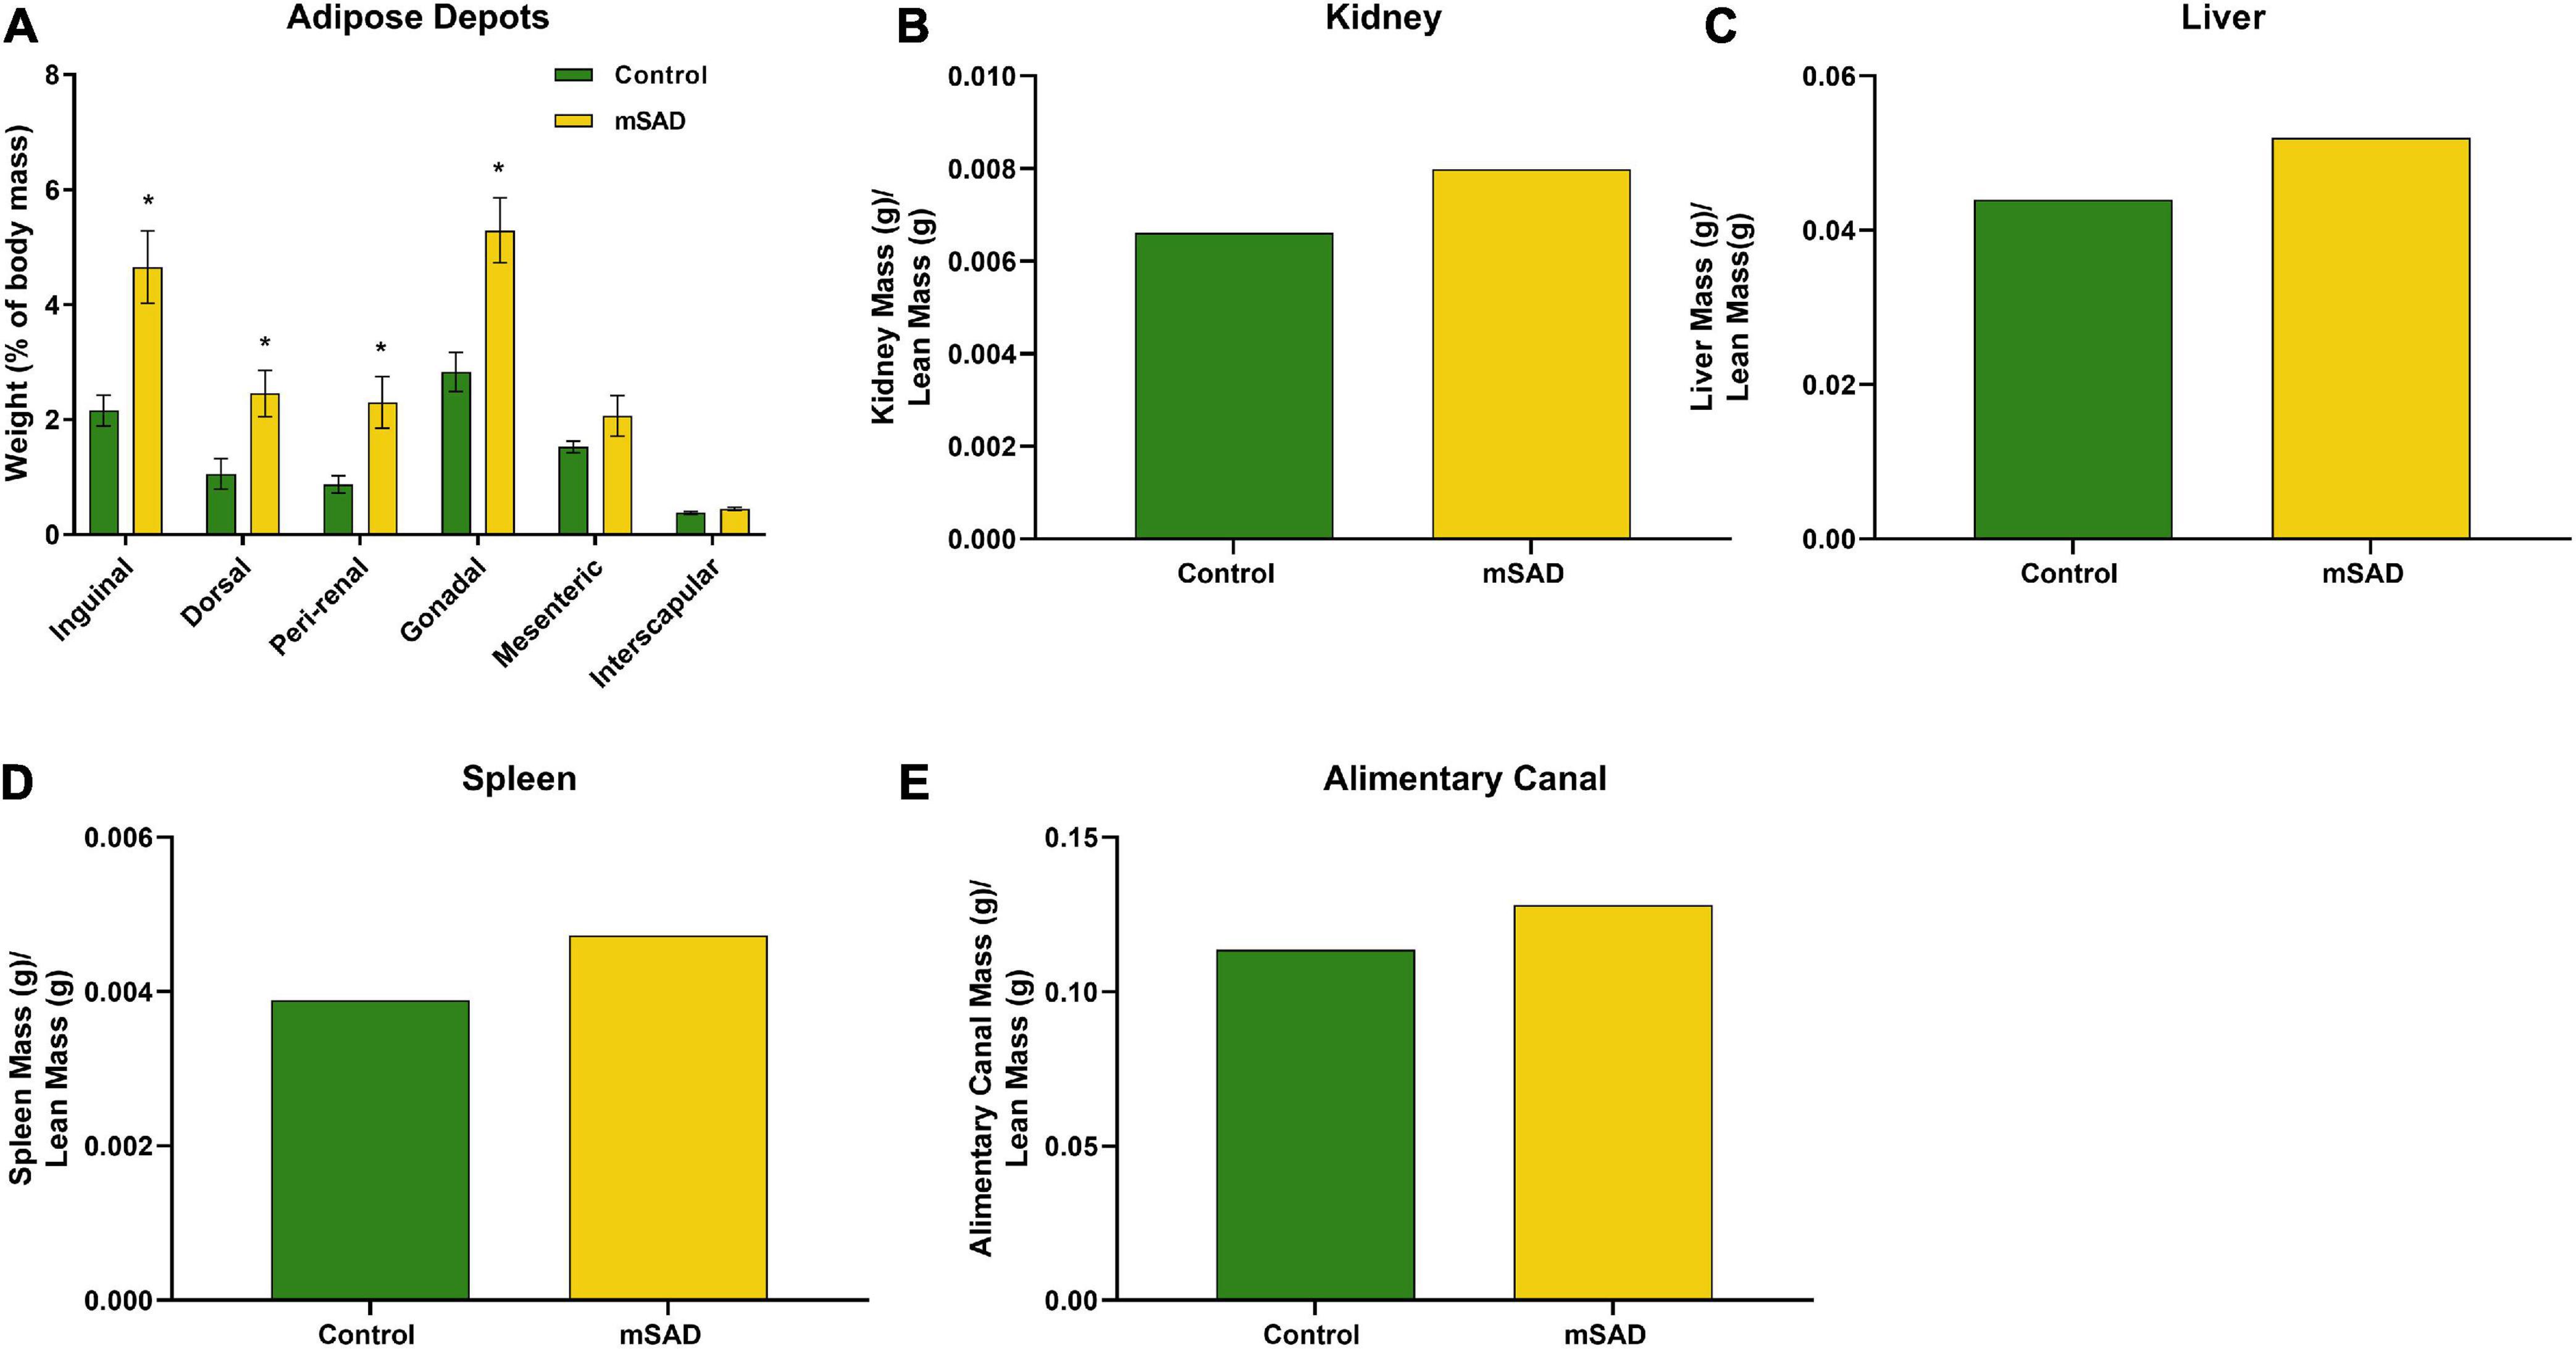
Figure 4. Effects of diet on an adipose depot and organ weights. Weights of the inguinal, dorsal, peri-renal, gonadal, mesenteric, and interscapular adipose depots were compared between CON- and mSAD-fed mice after 15 weeks of feeding (A). Kidney (B), liver (C), spleen (D), and alimentary canal (E) weights were also evaluated in both groups. Adipose depot values are represented as % of total body mass. Organ weight values are represented as absolute mass normalized by regression-predicted lean mass (g/g). When possible, data were compared using Student’s t-tests. *p < 0.05.
To understand cellular responses within the larger adipose mass with mSAD diets, adipocyte hyperplasia and hypertrophy were measured on gonadal tissue sections of CON- and mSAD-fed mice. Cell counts to evaluate adipocyte hyperplasia within equivalent areas of the tissue revealed significantly lower cell numbers in mSAD fat pads compared to CON (Figure 5A). Quantification of adipocyte cell area indicated a significantly larger average cell area in mSAD tissue sections compared to CON (Figure 5B).
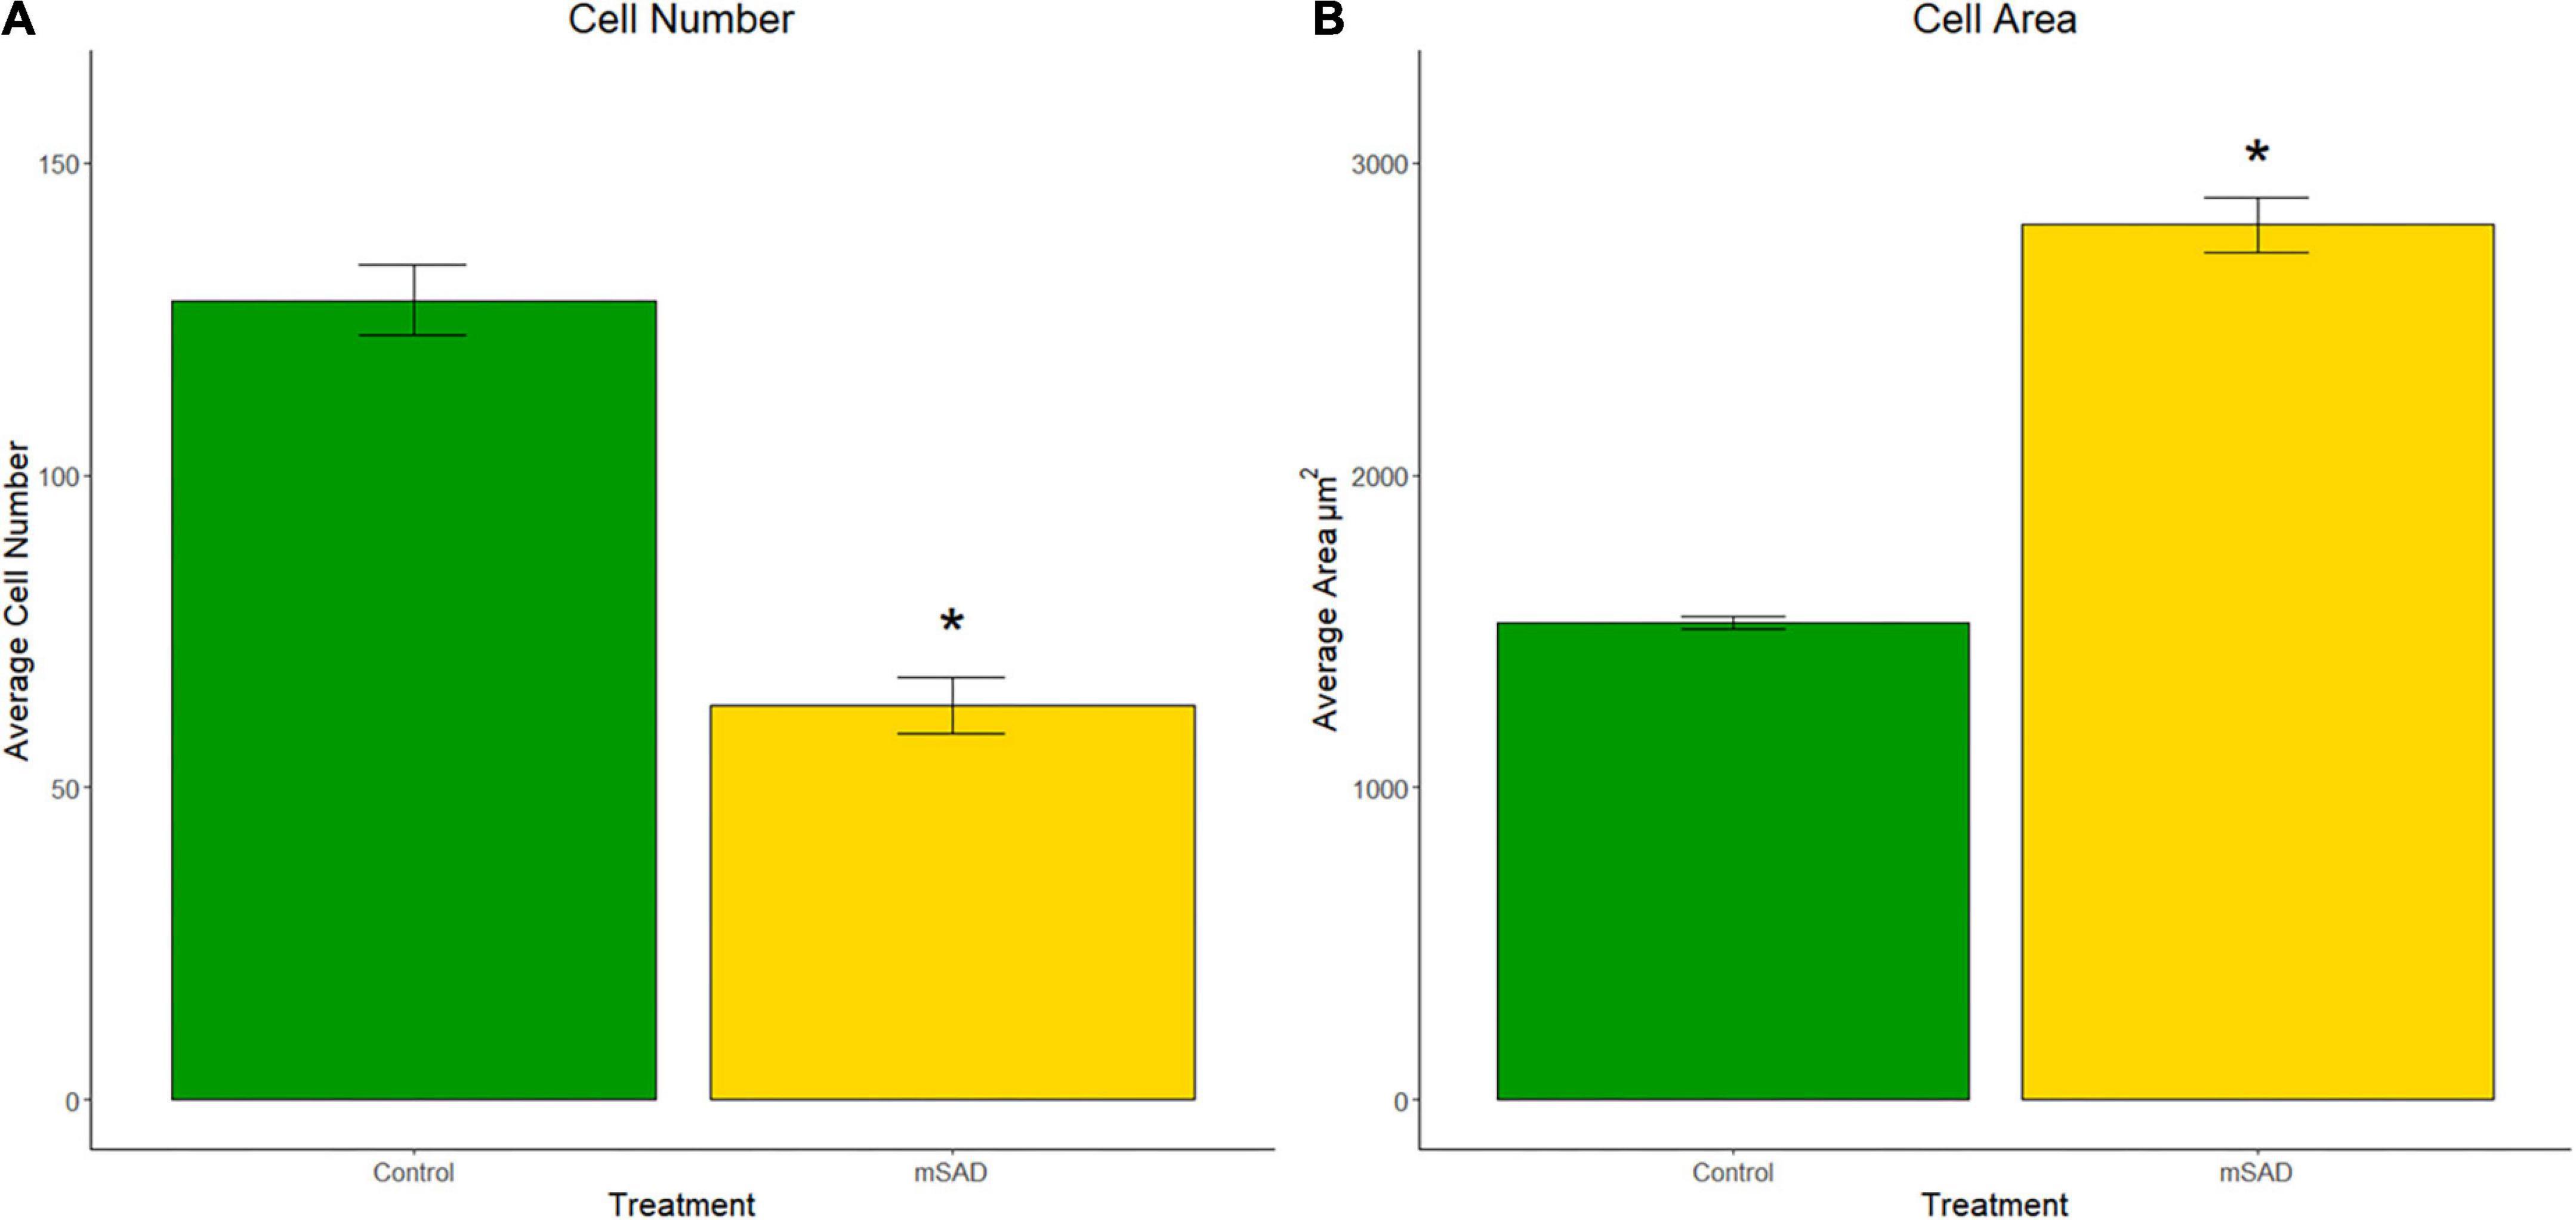
Figure 5. Effects of diet on gonadal adipocyte hyperplasia and hypertrophy. Cell counts and cell area measurements were performed on FFPE sections of gonadal fat pads stained with hematoxylin. Cell counts (A) and cell area measurements (B) were quantified. Values are representative of average cell count and average cell area (μm2) of multiple regions of interest (CON, n = 6; mSAD, n = 3) each measuring 500 μm × 500 μm. Data were compared using the unpaired Wilcoxon rank-sum test. *p < 0.001.
The presence of CLS in gonadal adipose tissue sections of CON- and mSAD-fed mice was evaluated histologically (Figure 6A) followed by quantification of the percent area of CLS occupied in the total field of each tissue section (Figure 6B). mSAD-fed mice samples displayed a significantly higher percentage of CLS compared to CON mice.

Figure 6. Effects of diet on gonadal fat pad inflammation. FFPE sections of gonadal fat pads from CON- or mSAD-fed mice were incubated with anti-MAC-2 followed by counter-staining with hematoxylin (A). Quantification of CLS (B). Values are represented as the average % area of CLS occupied in the total field of tissue sections. Data were compared using Student’s t-test. *p < 0.05.
FFPE liver sections of mice from both groups were stained with H&E to assess lipid deposition (Figures 7A,B). Gross increases in lipid deposits were observed in one of six CON mice and two of six mSAD-fed mice.
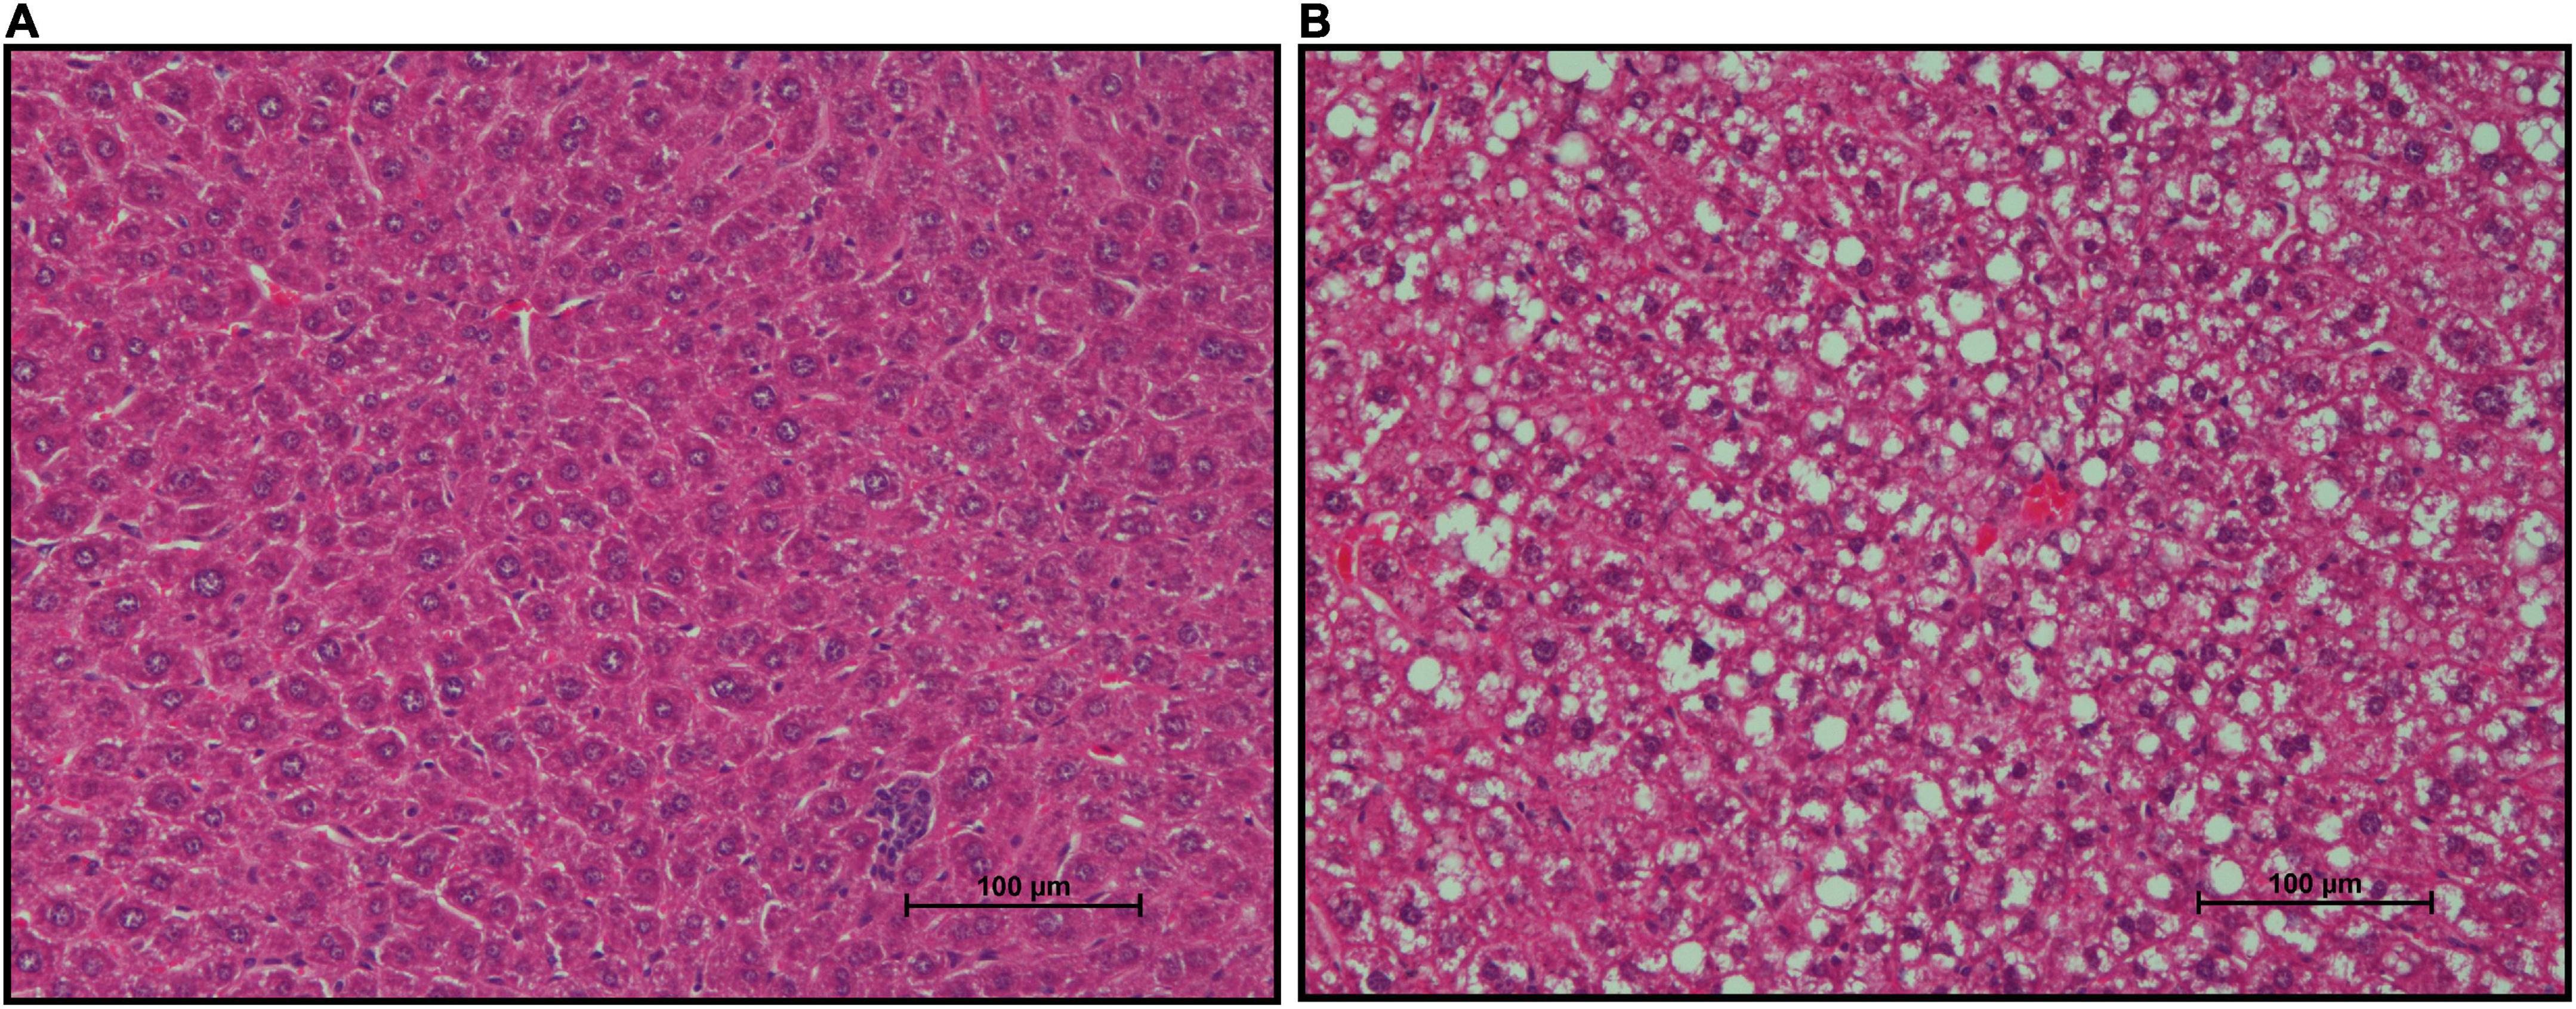
Figure 7. Effects of diet on hepatic lipid accumulation. Representative images of Formalin-fixed Paraffin-Embedded (FFPE) livers from six mice fed either CON diet with no lipid deposition (A) or mSAD with lipid deposition (B). Tissue sections were stained with Hematoxylin and Eosin (H&E). Scale bars at the bottom right of images represent 100 μm.
The presence of CLS within adipose tissue and hepatic steatosis in mSAD animals suggested that pro-inflammatory processes associated with mSAD feeding may affect multiple organ systems. To evaluate the role of inflammation in the colon, pro-inflammatory cytokine levels were measured. mSAD-fed mice exhibited significantly elevated gene expression levels of Tumor Necrosis Factor α (Tnfα), Interleukin 1 β (Il-1β), and Interleukin 6 (Il-6) relative to CON mice (Figures 8A–C) in colon tissues.

Figure 8. Effects of diet on colonic inflammation. Relative gene expression levels of Tnfα (A), Il-1β (B), and Il-6 (C) in colon tissues of CON- and mSAD-fed mice. Values are represented as relative expression levels normalized to β-actin. Data were compared using one-way ANOVA. *p < 0.05.
Increased levels of pro-inflammatory mediators prompted further analysis of the impact of the mSAD on the composition of the fecal microbe community. Using 16S rRNA sequencing and QIIME2 (v2021.11) analysis of pooled fecal samples, we assessed alpha and beta diversity metrics between CON and mSAD groups controlling for possible cage effects (Table 3 and Figures 9A,B, 10). Comparisons of alpha diversity in CON and mSAD samples measured by the Shannon index with cage input as a random effect produced a significant effect of diet (p = 0.04). Simpson and Chao1 comparisons with cage as a random effect produced nonsignificant results (p = 0.11, p = 0.32) (Table 3). Analysis of Bray-Curtis calculations (25) revealed significant differences between the microbe communities in the CON versus mSAD (BC < 0.001) indicating that exposure of mice to mSAD resulted in a re-structuring of the microbial community so that it was now distinct from that found in mice fed the CON diet. Visualization of changes in beta diversity of the sample groups can be seen in the principal coordinate analysis (PCOA) in Figure 10. Cluster separation seen in the PCOA plot between control cage 1 and control cage 2 was controlled for during analysis of beta diversity metrics with the Adonis test and resulted in a significant difference between diet groups (p < 0.001), and 83% (R2 = 0.826) of the variation seen is due to the diet (Supplementary Table 2). Further evaluation of microbial composition within control cage 1 and control cage 2 was explored to assess the slight separation of the two cages seen in Figure 10. This assessment revealed that differences between these cages may be primarily influenced by two genera of microbes. In cage 1, genus Romboutsia represents approximately 9–25% of the microbiome, while in cage 2, genus Faecalibaculum represents ∼10–30% of the microbiome. Across both cages and all six mice, all other genera are present in similar proportions (Supplementary Table 3). The pooled fecal samples of mSAD and CON fed mice groups revealed taxa assigned to the Firmicutes phylum to be most abundant across groups (Figure 9A). Ileibacterium, and Akkermansia to be most abundant across diet groups. Ileibacterium was found to the more dominant taxon in the mSAD group (∼22–50%), compared to the control group (∼5–28%). The control group revealed a larger abundance of Akkermansia (∼7–57%), in contrast to the mSAD group (∼11–17%). A unique abundance of Lachnospiraceae family members (∼5–40%) were observed in the mSAD group, in contrast to the CON group (∼4–9%). The CON diet group showed distinct abundances of Faecalibaculum (0–31%) and Romboutsia (0–24%).
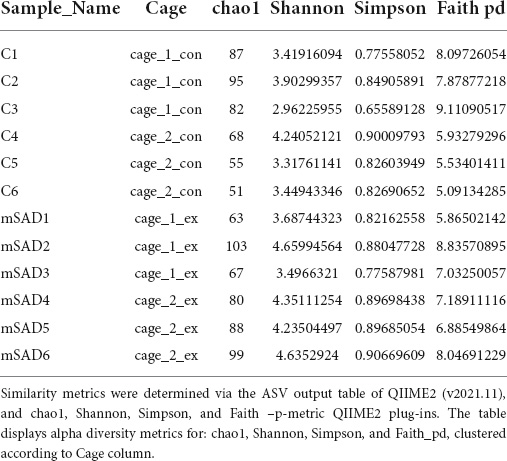
Table 3. Alpha diversity metrics were determined via QIIME2 diversity alpha plugin (QIIME_2, v2021.11), clustered according to cage_1_con (samples C1:C3, n = 3), cage_2_con (samples C4:C6, n = 3), cage_1_ex (samples mSAD1:mSAD3, n = 3), cage_2_ex (samples mSAD4:mSAD6, n = 3).
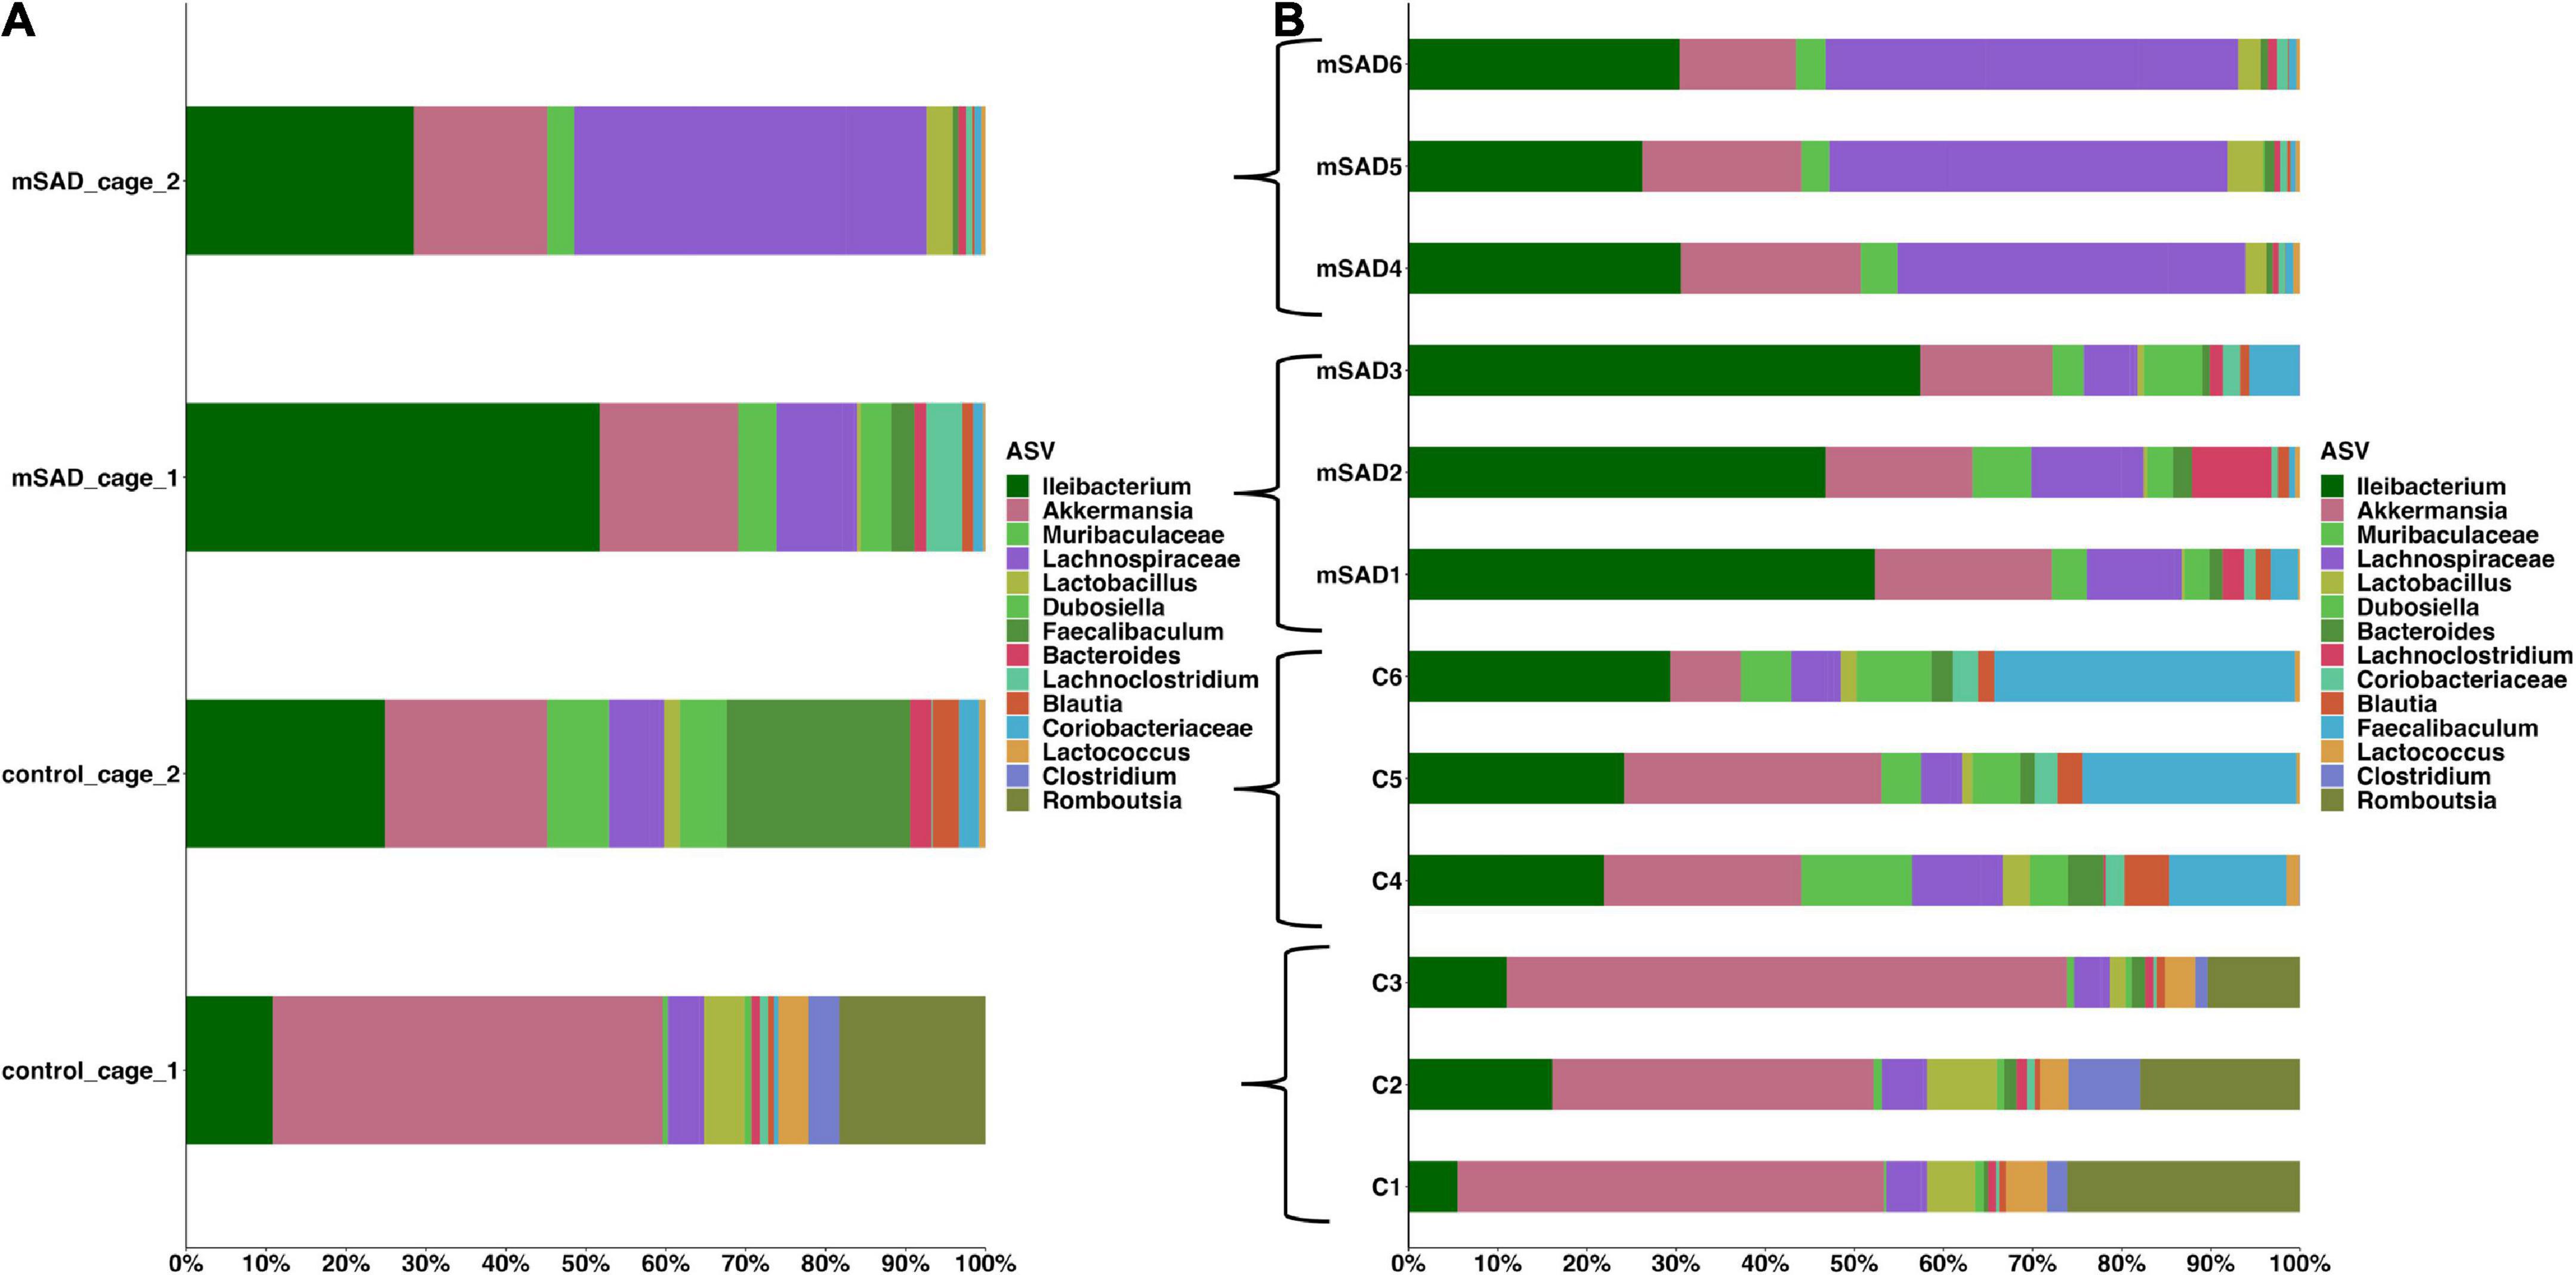
Figure 9. The mean of each sample group, according to cage was plotted for clarity, across sample groups (A). Sample assignments are as follows: mSAD = mice fed the mSAD diet, control/con = mice feed the control diet, and cage represents their respective cage. Relative abundance stacked column bar graph showing top 15 taxa at the most resolved level across all samples (n = 3 for each sample) in the gut ecosystem of mus musculus (B). Taxonomic identities were based on their assignment through the (SILVA v138) database as determined by the Quantitative Insights into Microbial Ecology (QIIME_2, v2021.11) and graphed using R (ggplot package).
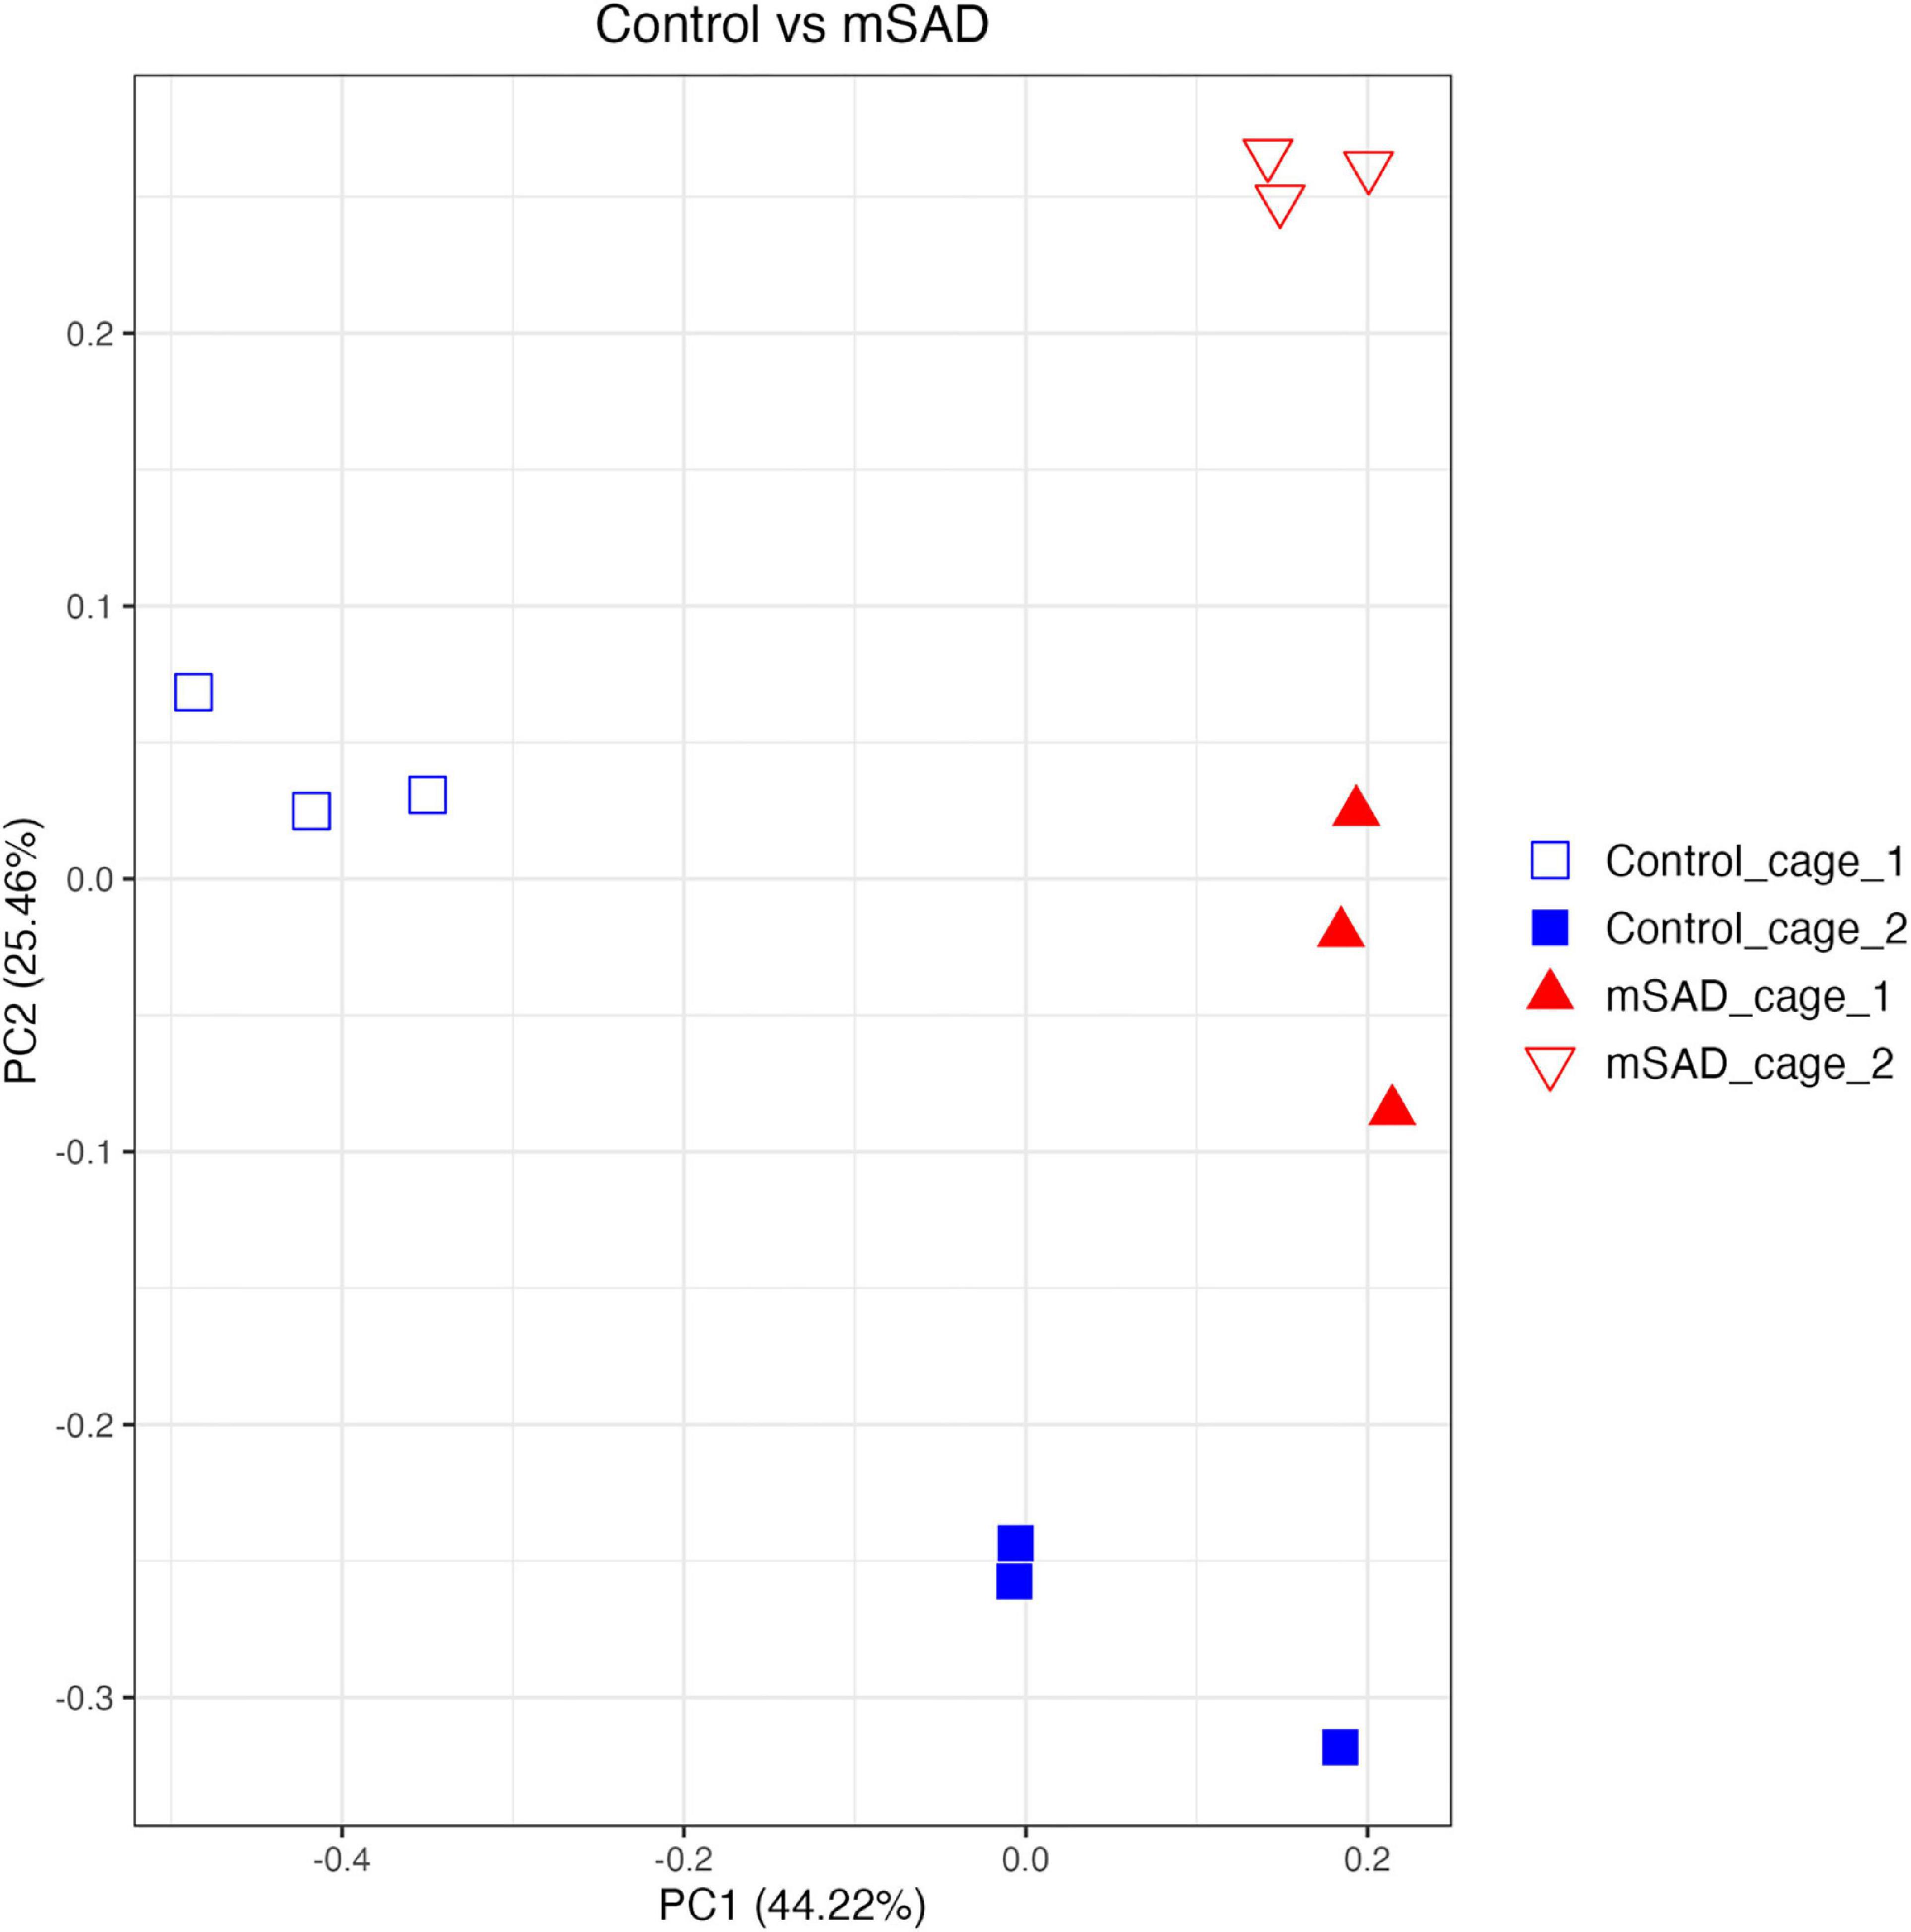
Figure 10. Beta diversity analysis of gut microbiota of mouse samples was observed across similarity metrics determined via QIIME2 (2021.11). A Bray–Curtis PCOA plot displays sample clustering patterns based on observed ASVs. plotted with R (ggplot package), and the q2-qiime diversity beta-group-significance. The group assignments are indicated as follows: control_cage_1 (blue open square; n = 3); control_cage_2 (blue square; n = 3); mSAD_cage_1 (red triangle; n = 3); mSAD_cage_2 (red open triangle; n = 3).
Obesity is a defining characteristic of metabolic syndrome and is primarily classified by increased weight gain and adiposity (39). mSAD-fed mice exhibited significantly higher weight gain and adiposity relative to CON mice, even though overall dry matter, protein, and calorie intake were similar. These data emphasize that the nutrient content of the diet, not necessarily the energy content, is important in controlling energy storage and allocation, leading to weight gain and alterations in other physiological outcomes associated with MetS. These data further suggest that specific nutrients or combinations of nutrients, primarily carbohydrates or fats that are typically associated with the induction of obesity and MetS in humans, are inducing obesity and MetS related co-morbidities in male C57BL/6J mice. Since protein intake was similar between the diet treatments, we suggest protein was not directly an effector of obesity and MetS. Consequently, human-relevant diets can be formulated for C57BL/6J mice to emulate the physiological outcomes associated with obesity and MetS observed in humans (2).
Previous studies using NHANES-based diets that reflect western consumption patterns further demonstrate the effect of diet quality on metabolic outcomes. The TWD, although similar to the mSAD, is different in its formulation and includes lower n-6: n-3 and saturated fat levels. Interestingly, average weekly calorie intakes of mSAD and TWD mice were relatively similar, but weight-related outcomes were dramatically different at the end of each study (3). Comparatively, the SAD contains n-6: n-3 and saturated fat levels more similar to the mSAD and induced weight gain in a similar manner to the mSAD (11). Intake of both saturated fat and omega-6 PUFAs have been associated with an increased risk for obesity (40). In the current study, mice fed the mSAD exhibited equivalent food intake to the AIN93M-fed controls in terms of total dry matter, total protein, and total energy, but differed substantially in intake of fat and carbohydrate quantity and quality, leading to an obese phenotype. We hypothesize that specific lipids or carbohydrates in the diet, or a complex ratio therein, affect body mass outcomes leading to a MetS phenotype. Furthermore, the fact that significant differences in specific growth rates were observed in the first week of feeding suggests that the metabolic triggers and cell signaling cascades associated with MetS phenotypes are induced rapidly and persist as long as the diet is consumed.
Glucose dysregulation and HFD are both associated with the development of type 2 diabetes (T2D) in rodent models and humans (41–43). Within 4 weeks of diet intake, mSAD-fed mice developed hyperglycemia, glucose intolerance, and reduced insulin sensitivity relative to CON mice. Increased adiposity in obese individuals is linked to elevated secretion of adipokines and pro-inflammatory cytokines, which may provide a mechanistic basis for the development of insulin resistance (44). A high fat/high carbohydrate diet has been associated with increased levels of TNFα and was shown to activate downstream pathways (45). Interestingly, TWD-fed C57BL/6J mice did not exhibit metabolic effects of glucose metabolism seen in mSAD-fed mice. In comparison, mice fed the SAD displayed fasting hyperglycemia and reduced glucose tolerance after 20 weeks of diet (11). Moreover, SAD-fed rats exhibit increased gene expression levels of pro-inflammatory mediator TNFα (46). Altogether, these data suggest that mSAD promotes a more rapid induction of hyperglycemia and insulin resistance as compared to TWD or the SAD.
A notable difference in the mSAD and SAD is the inclusion of HFCS as a replacement for sucrose. HFCS is found in numerous consumer products, and dietary exposure to sucrose or HFCS may produce different metabolic and physiological effects, even when controlled for energy intake (17). Previous studies have investigated the effects of HFCS-infused drinking water; however, HFCS was included as an ingredient in the mSAD and not supplemented in the water to limit the direct effects of palatability on water consumption. Sweetened water may promote the consumption of liquid calories in place of dietary calories, thereby limiting the intake of the diet (23). Fructose has been implicated in the development of T2D (14), NALFD (47), and gut dysbiosis (48); however, conflicting studies (18) highlight the importance of further investigation into the source of fructose as an underlying factor in the development of these disorders.
Analysis of overall fat distribution revealed significant increases in visceral gonadal adipose tissue (VAT) depots. Accumulation of VAT is strongly linked to the development of T2D (36, 49) and may provide further insight into metabolic alterations induced by mSAD feeding. Expansion of VAT depots in murine DIO models results in enhanced recruitment of macrophages to adipose tissue that exhibit a pro-inflammatory M1 phenotype when compared to controls (50). During advanced obesity, these macrophages manifest histologically as rings of F4/80+ cells surrounding adipocytes called crown-like structures, and nearly all adipose-tissue derived TNFα is produced by macrophages (51). TNFα is well known to directly decrease insulin sensitivity (52) through proinflammatory signaling via the NF-κβ and JNK pathways. We suggest the presence of CLS in fat depots concomitant with increased levels of TNFα in the colon are related to alterations in glucose metabolism in mSAD-fed mice.
The development of insulin resistance is thought to play a significant role in the progression of NAFLD, a common manifestation of MetS. A high-fat, low-carbohydrate diet promotes increasing levels of liver fat when compared to an isocaloric low-fat, high-carbohydrate diet (53). Diets high in saturated fat with low PUFA levels have also been shown to promote increases in liver fat (54). In the present study, two of six mSAD-fed mice displayed hepatic steatosis. Interestingly, one CON mouse exhibited a similar phenotype. Although the AIN-93M control diet is formulated to support basic health and reproduction of murine models, there is one reported instance of liver steatosis formation in response to AIN-93M consumption (55), indicating that consumption of AIN-93 may, in some cases, induce NAFLD. Consumption of the SAD diet has been reported to increase liver triglycerides; however, the presence of NAFLD was not evaluated (11, 46). Liver steatosis may be an outcome that develops over longer periods and additional studies that focus on human-relevant dietary induction of NAFLD are warranted.
Reports of gut dysbiosis associated with WD consumption have led to increased interest in the role of the microbiome in the development of obesity and MetS. Several studies have linked WD-induced pathologies to altered populations of microbes (1, 24, 56) and reversion of gut dysbiosis has been shown to attenuate WD-induced dysfunction (57). The limited amount of microbiome data reported from previous NHANES-based WD studies prompted us to investigate the composition of the fecal microbiome of mSAD-fed mice. The separation between control cage 1 and control cage 2 in the PCOA plot was of interest during the analyses. The two genera, Romboutsia and Faecalibaculum are shown to most likely be the primary components driving the separation of these cages. Interestingly, both of these genera of microbes belong the phylum Firmicutes and both have been identified in the gut of healthy patients and animals (58–61). Although these bacteria introduce variation between the control cages, we believe this variation does not represent an unhealthy population or that these animals have potential gut dysbiosis. Differences in microbial composition between diet groups were primarily of interest, as they may provide insight into physiological changes seen in mSAD mice. Similar to reported studies on diet-induced obesity, the fecal composition of mSAD mice was enriched with microbes from the Firmicutes phylum (62, 63). Increases in levels the Lachnospiraceae family were particularly interesting, as this family of microbes has been positively associated with multiple metabolic disorders, including alterations in glucose and lipid metabolism, onset of T2D, and diagnosis of NAFLD (64–68). Reduced levels of bacteria from the Akkermansia genus indicate a potential loss of protective microbes in the gut of mSAD mice. Akkermansia mucinophilia, the primary known species in this genus, is a mucin-degrading bacteria that has been documented to be altered under WD regimens (69). Levels of this species have shown to be inversely correlated with body weight in response to HFD (69) and reduced in models of type 2 diabetes, and administration of this species as a probiotic has shown to have protective effects on atherosclerosis, inflammation, and HFD-induced metabolic disorders (70, 71). Reduction of Akkermansia microbes in conjunction with altered glucose metabolism and increased body weight in mSAD mice agrees with existing reported data. The elevated presence of microbes from the Ileibacterium genus in the mSAD group may also be related to dietary intervention. This newly described genus was documented to be increased in response to HFD administration and positively correlated with serum lipid levels in a murine atherosclerosis model (72).
We recognize that microbial population dynamics observed alone cannot define the mechanism of action that resulted in increased weight gain, adiposity, and related co-morbidities. However, these trends lead us to hypothesize that shifts in microbial populations could result in a diet-dependent alteration of the metabolome. In fact, in a companion study, a metabolomic assessment of a Trp metabolite panel revealed diet-induced alterations in several Trp metabolites (24). Both nutrition and microbial populations are reported to be important in Trp metabolism and, as such, in maintaining systemic homeostasis including nutrient sensing, metabolic stress response, immunity (73), as well as neurological and behavioral interactions (24). Collectively, changes in diet, microbial populations and Trp metabolism could be important in the understanding progression of diet-induced metabolic disease and treatment options.
It is apparent that diet quality exerts pronounced effects on multiple physiological systems and signaling among these systems plays an integral role in the onset and development of metabolic disease (1, 41, 49, 74). The increased prevalence of obesity (75) and associated strain placed on the healthcare system (76) highlight the importance of developing research models that accurately reflect affected populations. Additionally, it is important to develop diets that initiate obesity and MetS to better understand the relation between diet and metabolic disease. Many previously established diets used to study DIO lacked relevant ingredients that reflect the consumption patterns that may ultimately induce and/or exacerbate metabolic disorders (1, 3, 77). The mSAD is formulated based upon the most recent data reflecting United States consumption patterns and induces pathologies consistent with MetS at a rate faster than SAD. We hypothesize the rapid development of MetS in C57BL/6J mice fed mSAD is due to either the inclusion of HFCS in the diets or interaction of carbohydrate and fat sources, leading to an aberrant metabolic cascade mediated by the gut-brain axis. We propose the mSAD diet induces the natural development of obesity-related pathologies and, therefore, becomes another important tool for improving rodent models of DIO and MetS. Moreover, this new diet can be reverse engineered to look for nutrient patterns and ratios contributing to disease outcomes, providing both a positive and negative control for future studies. This diet can also be used to address therapeutic targets and other interventions. We suggest that a new generation of diets can be developed in a variety of animal models, leading us to understand the basic universal cascades associated with consumption patterns leading to excessive weight gain and related co-morbidities.
The datasets presented in this study can be found in online repositories. The names of the repository/repositories and accession number(s) can be found below: https://www.ncbi.nlm.nih.gov/, PRJNA718626.
The animal study was reviewed and approved by Institutional Animal Care and Use Committee at the University of Alabama at Birmingham.
SW, GK, JB, CM, DS, MP, and MM conceived of, designed, and supervised the study. SC, CG, AC, GG, BVa, AM, MW, TB, WV, and LW assisted with data collection and interpretation. SC, CG, GG, and WV assisted with statistical analyses, interpretation, and presentation under supervision of SW, CM, JB, DS, and GK. SC prepared initial versions of the manuscript with all authors providing input and final approval of the submitted and published versions. All authors contributed to the article and approved the submitted version.
This research was supported by the UAB Diabetes Research Center (NIH P30 DK079626), the National Center for Advancing Translational Sciences (NIH UL1TR001417), and the UAB Nutrition and Obesity Research Center Lab Animal Nutrition Core [(P30DK056336), NIH MH079710, and NIH MH116896].
We thank the UAB Diabetes Research Center (NIH P30 DK079626) for providing pilot grant funding, the UAB Small Animal Phenotyping Core for body composition and indirect calorimetry measures, and the UAB Microbiome Institutional Research Core for microbiome analysis. The National Center for Advancing Translational Sciences, (NIH) is acknowledged for Bioinformatics support. This work is also supported by the UAB Nutrition and Obesity Research Center, the Lab Animal Nutrition Core (P30DK056336).
The authors declare that the research was conducted in the absence of any commercial or financial relationships that could be construed as a potential conflict of interest.
All claims expressed in this article are solely those of the authors and do not necessarily represent those of their affiliated organizations, or those of the publisher, the editors and the reviewers. Any product that may be evaluated in this article, or claim that may be made by its manufacturer, is not guaranteed or endorsed by the publisher.
The Supplementary Material for this article can be found online at: https://www.frontiersin.org/articles/10.3389/fnut.2022.929446/full#supplementary-material
1. Bortolin RC, Vargas AR, Gasparotto J, Chaves PR, Schnorr CE, Martinello KB, et al. A new animal diet based on human Western diet is a robust diet-induced obesity model: comparison to high-fat and cafeteria diets in term of metabolic and gut microbiota disruption. Int J Obes (Lond). (2018) 42:525–34. doi: 10.1038/ijo.2017.225
2. Hintze KJ, Benninghoff AD, Cho CE, Ward RE. Modeling the western diet for preclinical investigations. Adv Nutr. (2018) 9:263–71. doi: 10.1093/advances/nmy002
3. Monsanto SP, Hintze KJ, Ward RE, Larson DP, Lefevre M, Benninghoff AD. The new total Western diet for rodents does not induce an overweight phenotype or alter parameters of metabolic syndrome in mice. Nutr Res. (2016) 36:1031–44. doi: 10.1016/j.nutres.2016.06.002
4. Lin BH, Tobenna DA, Buzby JC, Bentley JT. U.S. Food Commodity Availability by Food Source, 1994-2008, ERR–221. Washington, DC: U.S. Department of Agriculture, Economic Research Service (2016).
5. Clifton P. Metabolic syndrome-role of dietary fat type and quantity. Nutrients. (2019) 11:1438. doi: 10.3390/nu11071438
6. Taskinen MR, Packard CJ, Borén J. Dietary fructose and the metabolic syndrome. Nutrients. (2019) 11:1987. doi: 10.3390/nu11091987
7. Reeves PG, Nielsen FH, Fahey GC Jr. AIN-93 purified diets for laboratory rodents: final report of the American institute of nutrition ad hoc writing committee on the reformulation of the AIN-76A rodent diet. J Nutr. (1993) 123:1939–51. doi: 10.1093/jn/123.11.1939
8. Nielsen FH. 90th anniversary commentary: the AIN-93 purified diets for laboratory rodents—the development of a landmark article in the journal of nutrition and its impact on health and disease research using rodent models. J Nutr. (2018) 148:1667–70. doi: 10.1093/jn/nxy121
9. Speakman JR. Use of high-fat diets to study rodent obesity as a model of human obesity. Int J Obes (Lond). (2019) 43:1491–2. doi: 10.1038/s41366-019-0363-7
10. National Center for Health Statistics. Diet/ Nutrition. (2019). Available online at: https://www.cdc.gov/nchs/fastats/diet.htm (accessed January 13, 2022).
11. Totsch SK, Meir RY, Quinn TL, Lopez SA, Gower BA, Sorge RE. Effects of a standard American diet and an anti-inflammatory diet in male and female mice. Eur J Pain. (2018) 22:1203–13. doi: 10.1002/ejp.1207
12. Bailey RL, Fulgoni VL, Cowan AE, Gaine PC. Sources of added sugars in young children, adolescents, and adults with low and high intakes of added sugars. Nutrients. (2018) 10:102. doi: 10.3390/nu10010102
13. Hu FB, Malik VS. Sugar-sweetened beverages and risk of obesity and type 2 diabetes: epidemiologic evidence. Physiol Behav. (2010) 100:47–54. doi: 10.1016/j.physbeh.2010.01.036
14. DiNicolantonio JJ, O’Keefe JH, Lucan SC. Added fructose: a principal driver of type 2 diabetes mellitus and its consequences. Mayo Clin Proc. (2015) 90:372–81. doi: 10.1016/j.mayocp.2014.12.019
15. Kisioglu B, Nergiz-Unal R. Potential effect of maternal dietary sucrose or fructose syrup on CD36, leptin, and ghrelin-mediated fetal programming of obesity. Nutr Neurosci. (2020) 23:210–20. doi: 10.1080/1028415X.2018.1491151
16. Ma X, Lin L, Yue J, Wu CS, Guo CA, Wang R, et al. Suppression of ghrelin exacerbates HFCS-induced adiposity and insulin resistance. Int J Mol Sci. (2017) 18:1302. doi: 10.3390/ijms18061302
17. Sadowska J, Bruszkowska M. Comparing the effects of sucrose and high-fructose corn syrup on lipid metabolism and the risk of cardiovascular disease in male rats. Acta Sci Pol Technol Aliment. (2017) 16:231–40.
18. Tsilas CS, de Souza RJ, Mejia SB, Mirrahimi A, Cozma AI, Jayalath VH, et al. Relation of total sugars, fructose and sucrose with incident type 2 diabetes: a systematic review and meta-analysis of prospective cohort studies. CMAJ. (2017) 189:E711–20. doi: 10.1503/cmaj.160706
19. USDA.Sugar and Sweeteners Yearbook Tables. (2022). Available online at: https://www.ers.usda.gov/data-products/sugar-and-sweeteners-yearbook-tables.aspx (accessed January 13, 2022).
20. Centers for Disease Control and Prevention. Health, United States. (2018). Available online at: https://www.cdc.gov/nchs/data/hus/hus18.pdf (accessed January 13, 2022).
21. Bray GA, Nielsen SJ, Popkin BM. Consumption of high-fructose corn syrup in beverages may play a role in the epidemic of obesity. Am J Clin Nutr. (2004) 79:537–43. doi: 10.1093/ajcn/79.4.537
22. White JS. Sucrose, HFCS, and fructose: history, manufacture, composition, applications, and production. In: JM Rippe editor. Fructose, High Fructose Corn Syrup, Sucrose and Health. New York, NY: Springer (2014). p. 13–33. doi: 10.1007/978-1-4899-8077-9_2
23. Pan JH, Kim HS, Beane KE, Montalbano AM, Lee JH, Kim YJ, et al. IDH2 deficiency aggravates fructose-induced NAFLD by modulating hepatic fatty acid metabolism and activating inflammatory signaling in female mice. Nutrients. (2018) 10:679. doi: 10.3390/nu10060679
24. Chakraborti A, Graham C, Chehade S, Vashi B, Umfress A, Kurup P, et al. High fructose corn syrup-moderate fat diet potentiates anxio-depressive behavior and alters ventral striatal neuronal signaling. Front Neurosci. (2021) 15:669410. doi: 10.3389/fnins.2021.669410
25. Kumar R, Eipers P, Little RB, Crowley M, Crossman DK, Lefkowitz EJ, et al. Getting started with microbiome analysis: sample acquisition to bioinformatics. Curr Protoc Hum Genet. (2014) 82:18.8.1–29 doi: 10.1002/0471142905.hg1808s82
26. Bolyen E, Rideout JR, Dillon MR, Bokulich NA, Abnet CC, Al-Ghalith GA, et al. Reproducible, interactive, scalable and extensible microbiome data science using QIIME 2. Nat Biotechnol. (2019) 37:852–7.
27. Callahan BJ, McMurdie PJ, Rosen MJ, Han AW, Johnson AJ, Holmes SP. DADA2: high-resolution sample inference from illumina amplicon data. Nat Methods. (2016) 13:581–3. doi: 10.1038/nmeth.3869
28. Katoh K, Standley DM. MAFFT multiple sequence alignment software version 7: improvements in performance and usability. Mol Biol Evol. (2013) 30:772–80. doi: 10.1093/molbev/mst010
29. Price MN, Dehal PS, Arkin AP. FastTree 2–approximately maximum-likelihood trees for large alignments. PLoS One. (2010) 5:e9490. doi: 10.1371/journal.pone.0009490
30. Faith DP. Conservation evaluation and phylogenetic diversity. Biol Conserv. (1992) 61:1–10. doi: 10.1016/0006-3207(92)91201-3
31. Shannon CE. A mathematical theory of communication. Bell Syst Tech J. (1948) 27:379–423. doi: 10.1002/j.1538-7305.1948.tb01338.x
33. Chao A. Nonparametric estimation of the number of classes in a population. Scand J Stat. (1984) 11:265–70.
34. Lozupone C, Lladser ME, Knights D, Stombaugh J, Knight R. UniFrac: an effective distance metric for microbial community comparison. ISME J. (2011) 5:169–72. doi: 10.1038/ismej.2010.133
35. Bokulich NA, Kaehler BD, Rideout JR, Dillon M, Bolyen E, Knight R, et al. Optimizing taxonomic classification of marker-gene amplicon sequences with QIIME 2’s q2-feature-classifier plugin. Microbiome. (2018) 6:90. doi: 10.1186/s40168-018-0470-z
36. Yilmaz P, Parfrey LW, Yarza P, Gerken J, Pruesse E, Quast C, et al. The SILVA and “all-species living tree project (LTP)” taxonomic frameworks. Nucleic Acids Res. (2014) 42:D643–8. doi: 10.1093/nar/gkt1209
37. Anderson MJ. A new method for non-parametric multivariate analysis of variance. Austr Ecol. (2001) 26:32–46. doi: 10.1046/j.1442-9993.2001.01070.x
38. R Core Team. R: A Language And Environment For Statistical Computing. Vienna: R Foundation for Statistical Computing (2020).
39. Zafar U, Khaliq S, Ahmad HU, Manzoor S, Lone KP. Metabolic syndrome: an update on diagnostic criteria, pathogenesis, and genetic links. Hormones (Athens). (2018) 17:299–313. doi: 10.1007/s42000-018-0051-3
40. Simopoulos AP. The importance of the omega-6/omega-3 fatty acid ratio in cardiovascular disease and other chronic diseases. Exp Biol Med (Maywood). (2008) 233:674–88. doi: 10.3181/0711-MR-311
41. Heydemann A. An overview of murine high fat diet as a model for type 2 diabetes mellitus. J Diabetes Res. (2016) 2016:2902351. doi: 10.1155/2016/2902351
42. Kahn SE, Hull RL, Utzschneider KM. Mechanisms linking obesity to insulin resistance and type 2 diabetes. Nature. (2006) 444:840–6. doi: 10.1038/nature05482
43. Marshall JA, Hamman RF, Baxter J. High-fat, low-carbohydrate diet and the etiology of non-insulin-dependent diabetes mellitus: the San Luis valley diabetes study. Am J Epidemiol. (1991) 134:590–603. doi: 10.1093/oxfordjournals.aje.a116132
44. Dyck DJ, Heigenhauser GJ, Bruce CR. The role of adipokines as regulators of skeletal muscle fatty acid metabolism and insulin sensitivity. Acta Physiol (Oxf). (2006) 186:5–16. doi: 10.1111/j.1748-1716.2005.01502.x
45. Hirosumi J, Tuncman G, Chang L, Görgün CZ, Uysal KT, Maeda K, et al. A central role for JNK in obesity and insulin resistance. Nature. (2002) 420:333–6. doi: 10.1038/nature01137
46. Totsch SK, Quinn TL, Strath LJ, McMeekin LJ, Cowell RM, Gower BA, et al. The impact of the standard American diet in rats: effects on behavior, physiology and recovery from inflammatory injury. Scand J Pain. (2017) 17:316–24. doi: 10.1016/j.sjpain.2017.08.009
47. Tetri LH, Basaranoglu M, Brunt EM, Yerian LM, Neuschwander-Tetri BA. Severe NAFLD with hepatic necroinflammatory changes in mice fed trans fats and a high-fructose corn syrup equivalent. Am J Physiol Gastrointest Liver Physiol. (2008) 295:G987–95. doi: 10.1152/ajpgi.90272.2008
48. Volynets V, Louis S, Pretz D, Lang L, Ostaff MJ, Wehkamp J, et al. Intestinal barrier function and the gut microbiome are differentially affected in mice fed a western-style diet or drinking water supplemented with fructose. J Nutr. (2017) 147:770–80. doi: 10.3945/jn.116.242859
49. Després JP. Body fat distribution and risk of cardiovascular disease: an update. Circulation. (2012) 126:1301–13. doi: 10.1161/CIRCULATIONAHA.111.067264
50. Rocha VZ, Folco EJ, Sukhova G, Shimizu K, Gotsman I, Vernon AH, et al. Interferon-gamma, a Th1 cytokine, regulates fat inflammation: a role for adaptive immunity in obesity. Circ Res. (2008) 103:467–76. doi: 10.1161/CIRCRESAHA.108.177105
51. Weisberg SP, McCann D, Desai M, Rosenbaum M, Leibel RL, Ferrante AW Jr. Obesity is associated with macrophage accumulation in adipose tissue. J Clin Invest. (2003) 112:1796–808. doi: 10.1172/JCI200319246
52. Hotamisligil GS, Murray DL, Choy LN, Spiegelman BM. Tumor necrosis factor alpha inhibits signaling from the insulin receptor. Proc Natl Acad Sci USA. (1994) 91:4854–8. doi: 10.1073/pnas.91.11.4854
53. Westerbacka J, Lammi K, Häkkinen AM, Rissanen A, Salminen I, Aro A, et al. Dietary fat content modifies liver fat in overweight nondiabetic subjects. J Clin Endocrinol Metab. (2005) 90:2804–9. doi: 10.1210/jc.2004-1983
54. Rosqvist F, Iggman D, Kullberg J, Cedernaes J, Johansson HE, Larsson A, et al. Overfeeding polyunsaturated and saturated fat causes distinct effects on liver and visceral fat accumulation in humans. Diabetes. (2014) 63:2356–68. doi: 10.2337/db13-1622
55. Farias Santos J, Suruagy Amaral M, Lima Oliveira S, Porto Barbosa J, Rego Cabral C Jr., Sofia Melo I, et al. Dietary intake of ain-93 standard diet induces Fatty liver with altered hepatic fatty acid profile in Wistar rats. Nutr Hosp. (2015) 31:2140–6.
56. Martinez-Medina M, Denizot J, Dreux N, Robin F, Billard E, Bonnet R, et al. Western diet induces dysbiosis with increased E coli in CEABAC10 mice, alters host barrier function favouring AIEC colonisation. Gut. (2014) 63:116–24. doi: 10.1136/gutjnl-2012-304119
57. Battson ML, Lee DM, Jarrell DK, Hou S, Ecton KE, Weir TL, et al. Suppression of gut dysbiosis reverses Western diet-induced vascular dysfunction. Am J Physiol Endocrinol Metab. (2018) 314:E468–77. doi: 10.1152/ajpendo.00187.2017
58. Ferreira-Halder CV, Faria AVS, Andrade SS. Action and function of Faecalibacterium prausnitzii in health and disease. Best Pract Res Clin Gastroenterol. (2017) 31:643–8.
59. Martín R, Miquel S, Benevides L, Bridonneau C, Robert V, Hudault S, et al. Functional characterization of novel Faecalibacterium prausnitzii strains isolated from healthy volunteers: a step forward in the use of F. prausnitzii as a next-generation probiotic. Front Microbiol. (2017) 8:1226. doi: 10.3389/fmicb.2017.01226
60. Milani C, Ticinesi A, Gerritsen J, Nouvenne A, Lugli GA, Mancabelli L, et al. Gut microbiota composition and Clostridium difficile infection in hospitalized elderly individuals: a metagenomic study. Sci Rep. (2016) 6:25945. doi: 10.1038/srep25945
61. Ricaboni D, Mailhe M, Khelaifia S, Raoult D, Million M. Romboutsia timonensis, a new species isolated from human gut. New Microbes New Infect. (2016) 12:6–7. doi: 10.1016/j.nmni.2016.04.001
62. Ley RE, Bäckhed F, Turnbaugh P, Lozupone CA, Knight RD, Gordon JI. Obesity alters gut microbial ecology. Proc Natl Acad Sci USA. (2005) 102:11070–5. doi: 10.1073/pnas.0504978102
63. Zacarías MF, Collado MC, ómez-Gallego CG, Flinck H, Aittoniemi J, Isolauri E, et al. Pregestational overweight and obesity are associated with differences in gut microbiota composition and systemic inflammation in the third trimester. PLoS One. (2018) 13:e0200305. doi: 10.1371/journal.pone.0200305
64. Kameyama K, Itoh K. Intestinal colonization by a Lachnospiraceae bacterium contributes to the development of diabetes in obese mice. Microbes Environ. (2014) 29:427–30. doi: 10.1264/jsme2.ME14054
65. Lippert K, Kedenko L, Antonielli L, Kedenko I, Gemeier C, Leitner M, et al. Gut microbiota dysbiosis associated with glucose metabolism disorders and the metabolic syndrome in older adults. Benef Microbes. (2017) 8:545–56. doi: 10.3920/BM2016.0184
66. Qin J, Li Y, Cai Z, Li S, Zhu J, Zhang F, et al. A metagenome-wide association study of gut microbiota in type 2 diabetes. Nature. (2012) 490:55–60. doi: 10.1038/nature11450
67. Salonen A, Lahti L, Salojärvi J, Holtrop G, Korpela K, Duncan SH, et al. Impact of diet and individual variation on intestinal microbiota composition and fermentation products in obese men. ISME J. (2014) 8:2218–30. doi: 10.1038/ismej.2014.63
68. Shen F, Zheng RD, Sun XQ, Ding WJ, Wang XY, Fan JG. Gut microbiota dysbiosis in patients with non-alcoholic fatty liver disease. Hepatobiliary Pancreat Dis Int. (2017) 16:375–81.
69. Everard A, Belzer C, Geurts L, Ouwerkerk JP, Druart C, Bindels LB, et al. Cross-talk between Akkermansia muciniphila and intestinal epithelium controls diet-induced obesity. Proc Natl Acad Sci USA. (2013) 110:9066–71. doi: 10.1073/pnas.1219451110
70. Li J, Lin S, Vanhoutte PM, Woo CW, Xu A. Akkermansia muciniphila protects against atherosclerosis by preventing metabolic endotoxemia-induced inflammation in Apoe-/- mice. Circulation. (2016) 133:2434–46. doi: 10.1161/CIRCULATIONAHA.115.019645
71. Wu F, Guo X, Zhang M, Ou Z, Wu D, Deng L, et al. An Akkermansia muciniphila subtype alleviates high-fat diet-induced metabolic disorders and inhibits the neurodegenerative process in mice. Anaerobe. (2020) 61:102138. doi: 10.1016/j.anaerobe.2019.102138
72. Gu Y, Zhang Y, Li M, Huang Z, Jiang J, Chen Y, et al. Ferulic acid ameliorates atherosclerotic injury by modulating gut microbiota and lipid metabolism. Front Pharmacol. (2021) 12:621339. doi: 10.3389/fphar.2021.621339
73. Madison A, Kiecolt-Glaser JK. Stress, depression, diet, and the gut microbiota: human-bacteria interactions at the core of psychoneuroimmunology and nutrition. Curr Opin Behav Sci. (2019) 28:105–10. doi: 10.1016/j.cobeha.2019.01.011
74. Chalasani N, Younossi Z, Lavine JE, Diehl AM, Brunt EM, Cusi K, et al. The diagnosis and management of non-alcoholic fatty liver disease: practice guideline by the American association for the study of liver diseases, American college of gastroenterology, and the American gastroenterological association. Hepatology. (2012) 55:2005–23. doi: 10.1002/hep.25762
75. CDC. Prevalence of Obesity Among Adults and Youth: United States, 2015-2016. (2017). Available online at: https://www.cdc.gov/nchs/data/databriefs/db288.pdf (accessed January 13, 2022).
76. Lehnert T, Sonntag D, Konnopka A, Riedel-Heller S, König HH. Economic costs of overweight and obesity. Best Pract Res Clin Endocrinol Metab. (2013) 27:105–15. doi: 10.1016/j.beem.2013.01.002
Keywords: obesity, metabolic syndrome, Western Diet, high fructose corn syrup, high fat diet
Citation: Chehade SB, Green GBH, Graham CD, Chakraborti A, Vashai B, Moon A, Williams MB, Vickers B, Berryhill T, Van Der Pol W, Wilson L, Powell ML, Smith DL Jr, Barnes S, Morrow C, Mukhtar MS, Kennedy GD, Bibb JA and Watts SA (2022) A modified standard American diet induces physiological parameters associated with metabolic syndrome in C57BL/6J mice. Front. Nutr. 9:929446. doi: 10.3389/fnut.2022.929446
Received: 26 April 2022; Accepted: 26 July 2022;
Published: 29 August 2022.
Edited by:
Manfredi Rizzo, University of Palermo, ItalyReviewed by:
Francesco Suriano, University of Gothenburg, SwedenCopyright © 2022 Chehade, Green, Graham, Chakraborti, Vashai, Moon, Williams, Vickers, Berryhill, Van Der Pol, Wilson, Powell, Smith, Barnes, Morrow, Mukhtar, Kennedy, Bibb and Watts. This is an open-access article distributed under the terms of the Creative Commons Attribution License (CC BY). The use, distribution or reproduction in other forums is permitted, provided the original author(s) and the copyright owner(s) are credited and that the original publication in this journal is cited, in accordance with accepted academic practice. No use, distribution or reproduction is permitted which does not comply with these terms.
*Correspondence: Stephen A. Watts, c2F3YXR0c0B1YWIuZWR1
Disclaimer: All claims expressed in this article are solely those of the authors and do not necessarily represent those of their affiliated organizations, or those of the publisher, the editors and the reviewers. Any product that may be evaluated in this article or claim that may be made by its manufacturer is not guaranteed or endorsed by the publisher.
Research integrity at Frontiers

Learn more about the work of our research integrity team to safeguard the quality of each article we publish.