- 1Centre for Nutrition and Food Science, Queensland Alliance for Agriculture and Food Innovation, The University of Queensland, Brisbane, QLD, Australia
- 2Jiangsu Key Laboratory of Crop Genetics and Physiology/State Key Laboratory of Hybrid Rice, College of Agriculture, Yangzhou University, Yangzhou, China
- 3Jiangsu Key Laboratory of Crop Genomics and Molecular Breeding/Jiangsu Co-innovation Center for Modern Production Technology of Grain Crops, Yangzhou University, Yangzhou, China
- 4Queensland Alliance for Agriculture and Food Innovation, The University of Queensland, Brisbane, QLD, Australia
Many properties of starch-containing foods are significantly statistically correlated with various structural parameters. The significance of a correlation is judged by the p-value, and this evaluation is based on the assumption of linear relationships between structural parameters and properties. We here examined the linearity assumption to see if it can be used to predict properties at conditions that are not close to those under which they were measured. For this we used both common domesticated rices (DRs) and Australian wild rices (AWRs), the latter having significantly different structural parameters and properties compared to DRs. The results showed that (1) the properties were controlled by more than just the amylopectin or amylose chain-length distributions or amylose content, other structural features also being important, (2) the linear model can predict the enthalpy ΔHg of both AWRs and DRs from the structural parameters to some extent but is often not accurate; it can predict the ΔHg of indica rices with acceptable accuracy from the chain length distribution and the amount of longer amylose chains (degree of polymerization > 500), and (3) the linear model can predict the stickiness of both AWRs and DRs to acceptable accuracy in terms of the amount of longer amylose chains. Thus, the commonly used linearity assumption for structure-property correlations needs to be regarded circumspectly if also used for quantitative prediction.
Introduction
To understand and improve the processing and quality (including nutritional properties) of starch-containing foods, it is important to have statistically valid and physically meaningful correlations between starch structure and functional properties. These correlations are often obtained using the p-values of starch structure-property relations, with a correlation taken as significant if p is less than a chosen value, typically 0.05 or 0.01. This involves the assumption that the relation between the selected properties and structural parameters are linear. While mathematically this has to hold over sufficiently small changes in structure and properties (this is simply from Taylor's Theorem, which is universally valid), this assumption is likely to become invalid with large changes. It would be useful if one could use the coefficients resulting from these correlations predictively, e.g., to see what fraction of amylose (Am) long chains would produce a desired reduction in the rate of digestion of a starch-based food to glucose, as a guide to plant breeding and variety selection. A badly inaccurate prediction here could prove a costly error for a plant breeder.
Here we examine the predictive power of this common hypothesis for an important food system: the relation between structural parameters and functional properties (such as gelatinization behavior) for rice samples with diverse ranges of structures and properties.
Rice (Oryza sativa L.) is a widely consumed staple food and can be divided into two commonly domesticated rice species: Oryza sativa L. (from Asia), Oryza glaberrima Steud (from Africa), and 24 wild species (1). Clearly, when testing the predictive properties of parameters found using linear model, one wants to have as wide a range of structures as possible to improve the accuracy of these relationships. Compared to domesticated rices (DRs), Australian wild rices (AWRs) have a relatively broad genetic base, which results in significantly different starch molecular fine structure and properties in AWRs (2, 3), and together with DRs, provide a wide spectrum of structure and properties.
Starch, the major component of rice, accounts for 69–87% of the grain on a dry basis (4). Starch is a glucose polymer, mainly composed of two polymer variants: amylose (Am) and amylopectin (Ap). Am is largely linear with a few long-chain branches while Ap is highly branched. While starch has multiple levels of structure, most properties of interest are determined by the chain-length distribution (CLD) of starch (the fine structure) of both Ap and Am. To give one of many examples of properties significantly correlated with starch molecular fine structural parameters, the digestion rate of retrograded rice starch has been found to be mainly controlled by the distribution of short to medium Am chains (5). Earlier work (6–10) reported linear regression models and parameter values relating starch fine structure [or, in some cases, just amylose content (AC)] to gelatinization, retrogradation and texture properties for a range of rices. Although the relationships between rice properties and starch structures have been intensively investigated, it has been found (10–13) that the relationships between AC and eating quality are dependent on the ranges of AC variation, which suggests that the ranges of structure played an important role in determining properties. The rather different structural parameters between AWRs and domesticated rices therefore suggest that inclusion of both will be useful in a test of the predictability of the linearity assumption.
The aim of this study is to find linear correlations between structural parameters and certain properties and determine how well each property is predicted by a linear fit. This involves the following.
(1) The composition of three AWRs and 70 DRs were studied.
(2) The CLDs of rice starch (obtained after enzymatic debranching of the whole starch) were characterized with size-exclusion chromatography (SEC) and the results were fitted to biosynthesis-based models. These reduce the structural data to a small number of biosynthesis-related parameters suited to the types of analysis pursued here.
(3) We measured the thermal properties of starch, the in-vitro digestibility of cooked rice flours, which were subsequently fitted to kinetic models, and the texture of cooked rices. These treatments provide a small number of parameters describing these properties, which are suitable for the present aims.
(4) Linear regression was performed between properties and their related structural parameters.
(5)All parameters from the linear fits were then used to predict properties not included in the original data set, to test how well the linear regression treatment can be extrapolated beyond the conditions under which the linear coefficients were obtained.
Materials and Methods
Materials
Rice types used in this study consisted of AWRs (S01–S03) and DRs (S04–S73) (Supplementary Table 1). Varieties of DRs comprised indica (S04–S13, S24–S31, S40–S43, S46–S53, S61–S67) and japonica (S14–S23, S32–S39, S44–S45, S54–S60, S68–S73). For performing the linear regressions, here rice samples were grouped into three categories [Group A (three AWRs, 10 indica rices and 10 japonica rices), Group B (three AWRs and 10 indica rices), Group C (three AWRs and 10 japonica rices)] for each property. These are: for thermal properties, in Group A, sample AWR S01–S03, DR S04–S13, and S14–S23, in Group B, sample AWR S01–S03 and DR S04–S13, and in Group C, sample AWR S01–S03 and DR S14–S23; for in vitro digestion properties, in Group A, sample AWR S01–S03, DR S04, S06, S13, S28–S29, S31, S40–S43, and S14, S17, S19, S21, S23, S37–S39, S44–S45, in Group B, sample AWR S01–S03 and DR S04, S06, S13, S28–S29, S31, S40–S43, in Group C, sample AWR S01–S03 and DR S14, S17, S19, S21, S23, S37–S39, S44–S45; for textural properties, in Group A, sample AWR S01–S03, DR S13, S31, S40–S43, S46–S47, S52–S53, and S37–S38, S44, S54–S60, in Group B, sample AWR S01–S03 and DR S13, S31, S40–S43, S46–S47, S52–S53, in Group C, sample AWR S01–S03 and DR S37–S38, S44, S54–S60. After the linear regressions were performed, different samples were used in Groups A, B, and C (described below) to test the predictability of the linear regressions at conditions that were not close to those used to find the linear correlations. The order of DR varieties was determined by the order of their properties. AWR S01, Oryza meridionalis (Taxa B) (T.B.) was collected at Global Positioning System (GPS) latitude S 15°29'48.6” and GPS longitude E: 144°18'47.6”, in Queensland, Australia, on 11th May 2018. AWR S02, Oryza officinalis (O.O.) and AWR S03, Oryza australiensis (O.A.) were both provided by Australian GeneBank without detailed information. The AWR was dehulled manually, followed by polishing with a rice polisher (Model Kett, Tokyo, Japan). These three AWR varieties are the only ones currently available. Collecting sufficient amounts of samples for characterization is not straightforward, as they grow in the wild interspersed with many other plants, requiring laborious manual collection in a geographically remote location. In addition, the important need to request permission from traditional owners, following the legal protocols ensuring that their rights are protected, is time-consuming.
Some DR data [chain-length distributions (CLDs), and textural properties] were obtained from the literature from sources which used the same methodology, while the thermal properties, and in-vitro digestibility was measured as part of the present study. All sample details are shown in Supplementary Table 1.
The DR starches, obtained under the same conditions as the AWR starches, were as follows. From Li et al. (14): indica rice variety: S13, S31, S40–S43, S46–47, S52–53, S61–62; japonica rice variety: S37–S38, S44, S54–S60, S68–S72. From Cheng Li and co-workers (unpublished; University of Shanghai for Science and Technology): indica rice varieties S63–S67. From Li et al. (unpublished, Yangzhou University): japonica rice varieties S39, S45, S73. From Zhu et al. (indica rice varieties S48–S51) (15). The collection details of all DRs are summarized in Supplementary Table 1. DR S04–S09, S11–S12, S14–S30, and S32–S36 were provided by the Suzhou Seed Store Center, China, in 2019, DR S10, S48–S51, S63–S67 were planted and harvested in PoLiu village, Lingshui County, Hainan Province, China in 2017, and DR S13, S31, S37–S47, S52–S62, S68–S73 were planted and harvested at the experimental field in Yangzhou University, Yangzhou City, Jiangsu Province, China in 2018. The DR kernels were dehusked using a rice huller (Model SY88-TH, Korea) and then polished with a rice polisher. Both AWRs and DRs were stored at 4°C in air-tight plastic bags before use.
Protease (from Streptomyces griseus type XIV) (P5147, ≥ 3.5 Units/mg solid), α-amylase from human saliva (A1031, 84 units/mg solid), pepsin from porcine gastric mucosa (P6887, 3,200–4,500 Units/mg protein), and pancreatin from porcine pancreas (P7545, 8 × USP) were purchased from Sigma-Aldrich Chemical Co. (St. Louis, MO, USA). Amyloglucosidase (from Aspergillus niger) (3,260 Units/mL) and isoamylase (from Pseudomonas sp.) (200 Units/mL) were purchased from Megazyme International Ltd. (Bray, Co. Wicklow, Ireland). Pullulan SEC standards with known peak molecular weights ranging from 180 to 1.22 × 10⁶ were obtained from Polymer Standards Service (PSS) GmbH (Mainz, Germany). Other chemical reagents were analytical grade and used as received.
Composition of Rice Grains
The total starch content was measured as previously described using a Megazyme total starch (AA/AMG) assay kit (16). The crude protein content was measured using a Leco CNS-2000 analyzer (Seminole, Florida, USA) (by the combustion method), and then calculated from the nitrogen content with a conversion factor of 5.95.
Starch Extraction From Rice Grains
The extraction of starch from the rice grains followed a previously described method (16). Briefly, rices were ground into flour using a cryo-grinder (MM400, Netsch, Germany, 10 s at a time, 6 times at 20 s−1) before being filtered with a 75-μm sieve. The flour was immersed in 0.45% sodium metabisulfite solution (the volume ratio of rice flour to solution being 1:3) at 4°C for 0.5 h. Proteins were removed by protease treatment [2.5 Units mL−1 of protease in tricine buffer (250 mM, pH 7.5)] at 37°C overnight. After centrifuging at 4,000 × g for 10 min, the supernatant was discarded. The treated flour was washed with deionized water six times, then twice precipitated in ethanol. Finally, the extracted starch was freeze-dried (SP Scientific, VirTis, BTP-9ESOOX, U.K.) for 48 h.
Characterization of Starch Molecular Structure
SEC was used to measure the CLDs of debranched starches as described in detail previously (17). SEC separates polymer molecules by molecular size, specifically the hydrodynamic radius (Rh). Briefly, native starch was dissolved in dimethyl sulfoxide (DMSO) with 0.5% (w/w) LiBr (DMSO/LiBr) at 80°C before centrifugation, the supernatant then mixed with absolute ethanol, and the resulting precipitate was debranched with isoamylase prior to freeze-drying. The freeze-dried sample was dissolved in DMSO/LiBr and the resulting supernatant was then injected into the SEC. The CLDs were obtained using a LC20AD SEC system (Shimadzu Corporation, Kyoto, Japan) equipped with three columns in sequence (PSS, Mainz, Germany): GRAM pre-column, GRAM 100 and GRAM 1000 columns, and a RID-10A refractive index detector (Shimadzu Corporation, Kyoto, Japan). DMSO/LiBr solution was used as the mobile phase with a flow rate of 0.6 mL/min.
Fitting Ap and Am CLDs to Models
The Ap and Am starch CLDs were each fitted to biosynthesis-based models using publicly available codes. This enables a reduction of the CLD data into a small number of biologically-relevant parameters, suitable for finding statistically valid correlations (18, 19). Briefly, both models divide the Ap and Am components in the CLD into different regions with different DP ranges (in the present case, three regions for Ap and two or three regions for Am, depending on CLD features such as peaks and shoulders). The chains in each region are assumed to be predominantly but not exclusively synthesized by a given “enzyme set.” Each enzyme set contains an isoform of starch synthase (SS), one or two isoforms of starch branching enzyme (SBE) and an isoform of starch debranching enzyme (DBE). For enzyme set i, the contribution to the CLD from this set can be calculated from the values of two parameters: βAm, i and hAm, i (i = 1, 2, …) for Am and βAp, i and hAp, i (i = 1, 2, 3) for Ap. The βi are the ratios of the activity of SBE to that of SS in set i and the hi are the relative activities of the SS in the enzyme set.
Thermal Properties
The gelatinization properties of rice starches were measured by differential scanning calorimetry (DSC; Netzsch, Ahlden, Germany). Starch (5 mg, dry weight basis) and water (at a weight ratio of 1:2) were weighed in a DSC aluminum crucible and sealed. After equilibrating at 4°C for 24 h and then at room temperature for 1 h, the crucibles were held at 20°C for 1 min in the DSC oven, and then heated from 20 to 100°C at a rate of 10°C/min, followed by cooling at 20°C/min from 100 to 20°C. An empty crucible was used as a reference. The onset temperature (To), peak temperature (Tp), conclusion temperature (Tc) and crystal melting enthalpy (ΔHg) were measured.
In vitro Digestion
An in-vitro digestion method used, namely that of Zhao et al. (3). Briefly, rice flour [0.5–1.27 mm, mimicking size during mastication (3), ~70 mg] was cooked with 2 mL of distilled water in 50-mL centrifuge tube in a boiling water bath for 30 min and then incubated in a 37°C water bath. Then 0.2 mL artificial saliva solution (250 U/mL pancreatic α-amylase in carbonate buffer at pH 7 containing 21.1 mM KCl, 1.59 mM CaCl2, and 0.2 mM MgCl2) was added to each tube and incubated for 20 s, followed by incubation with porcine pepsin (1 mg/mL) in HCl solution (1 mL, 0.02 M) for 30 min. The digesta were then neutralized with 1 mL NaOH (0.02 M) and mixed with 5 mL sodium acetate buffer (pH 6, 0.2 M) containing 200 mM CaCl2, 0.49 mM MgCl2 and 0.02% w/v NaN3. Pancreatin (2 mg/mL) and 28 U/mL amyloglucosidase in the same sodium acetate buffer solution (1 mL) were added to the digesta. After times ranging from 0 to 300 min, a 0.1 mL aliquot of solution was quickly transferred to a microcentrifuge tube containing 0.9 mL absolute ethanol, to stop the reaction. The glucose content of each sample was determined by the GOPOD method with a Megazyme D-Glucose (County Wicklow, Ireland) assay kit. The whole digestion progress was carried out at 37°C with constant shaking at 100 rpm. The in vitro digestion results were first fitted to a first order equation:
Here C(t) is the fraction of total starch digested at time t, C∞ is the fraction of starch digested at very long reaction time and k is the digestion rate coefficient of the starch. The digestion curves were further treated with the logarithm-of-slope (LoS) method, which identifies the region(s) following first-order loss kinetics (20), followed by being treated with two other methods [the non-linear least-squares (NLLS) method (21), and a parallel digestion model (22)] which are both based on the same principles as the LoS method and yield more precise values of the parameters k and C∞.
Textural Properties
The textural properties of cooked rice grains were measured using a texture analyzer (TA.XT plus, Stable Micro Systems Ltd., London, UK), equipped with a P36R cylindrical probe, following a previously described method (14). Briefly, polished AWR grains were cooked with MilliQ water (rice: water weight ratio 1:1.6) in a rice cooker. After cooling to room temperature, a 1 g cooked AWR sample was placed on the sample plate of the texture analyzer with single-grain thickness. A compression force program up to 70 % strain was applied to lower and withdraw the probe, at a speed of 1 mm/s to mimic oral chewing. This will of course break some or all of the rice cooked grains, as happens during chewing. Texture measurements were performed five times on the cooked AWR grains at room temperature.
The textural data of cooked DRs, obtained under the same conditions as the cooked AWRs, were those provided by the same sources as those providing the samples, detailed above.
Linear Regression
Three groups of starches {Group A [three AWRs and 20 domesticated rices (DRs)], Group B (three AWRs and 10 indica rices), Group C (three AWRs and 10 japonica rices)} (mentioned above) were used to build linear correlations between properties parameters and their related structural parameters by a backward multiple linear regression (related structural parameters of each property are from the literature) (4, 5, 14, 23–34). Two mathematical biosynthesis-based models for obtaining parameters were used to parameterize the data. Since the starch granular and crystalline structures are greatly disrupted by the cooking process, only grain composition and starch molecular structures need be considered here. The linearity assumption assumes that the ith property Pi is given in terms of structural parameters sj by:
Here the aij are constants whose values depend on the values of the sj and Pi. Non-linear behavior would be when one has to include terms in si sj, etc. to fit or to predict data with desired accuracy. Using very different types of starch (domesticated and wild varieties, in the present case) is useful for testing the extrapolation of linear parameterization to larger differences: different types of starch will have a wide “space” of structures and thereby a wider data range for improved testing of this assumption. After performing these linear regressions (p < 0.05) on the subset of our samples given above, another 16 DRs (8 indica and 8 japonica), were treated in the same way as the samples used to build the linear regressions and used in Groups A, B, and C, respectively. For thermal properties, sample DR S24–S31, and S32–S39 were used in Group A, samples DR S24–S31 were used in Group B, and samples DR S32–S39 were used in Group C. For in vitro digestion properties, samples DR S05, S10, S46–S51, and S18, S20, S22, S32–S36 were used in Group A, samples DR S05, S10, S46–S51 were used in Group B, and samples DR S18, S20, S22, S32–S36 were used in Group C. For textural properties, samples DR S10, S61–S67, and S39, S45, S68–S73 were used in Group A, samples DR S10, S61–S67 were used in Group B, and samples DR S39, S45, S68–S73 were used in Group C. These last were used to test the predictability of the linear regressions over significant displacements from the conditions used to find the linear correlations.
It is noted that this paper concerns structure-property relations; how these structures were formed (different growth conditions, etc.) is irrelevant to the present aims, although of interest in other contexts.
Statistical Analysis
Statistical analysis was conducted using SPSS software (version 28.0, SPSS Inc., Chicago, IL, USA). Analysis of Variance (ANOVA) was used to determine significant differences in starch molecular fine structural parameters, moisture content, AC and property parameters. A backward regression approach was employed in the multiple linear regression, and coefficient of determination (R2) and root mean square errors (RMSE) were used as indicator of significance for the regression models.
Results and Discussion
Compositions of Rice Grains
The chemical compositions of both AWRs and DRs are presented in Supplementary Table 1. No significant differences were seen in total starch content, total crude protein content and AC of AWRs compared to those of the DR samples. Since starch and protein together accounted for up to 92.5% on a dry basis, lipid content was not considered in linear models in this paper, but could be considered in future work to see if predictability could be improved.
Comparison of Starch Molecular Structural Parameters of AWRs and DRs
SEC weight distributions of debranched rice starch are shown in Figure 1, plotted as the weight distributions w(logX), which are the weight (not molecular weight) of chains as a function of their degree of polymerization (DP) X. Normalization of such distributions is arbitrary; here, the data were normalized to the highest Ap branch peak. Generally, chains shorter than DP 100 are taken as Ap branches and those longer than DP 100 as Am branches (18). All rice varieties have similar CLDs: two large Ap peaks and one small Am peak, as commonly seen. The first Ap peak around DP 13–14 are Ap chains confined to a single lamella in the native starch, while the second Ap peak about DP 36–38 are trans-lamellae Ap chains traversing two or more lamella in the native starch. These Ap and Am CLDs were parameterized using two biosynthesis-based models (18, 19). Fitting results for AWRs and typical examples of one indica rice and one japonica rice are presented in Supplementary Figure 1, and all model-based fitting parameters used to build structure-property relations are given in Tables 1–3. Biosynthesis of shorter Ap chains is dominated by the model applied to “Ap region 1,” with the model parameters βAp, 1 and hAp, 1, medium ones by βAp, 2 and hAp, 2, and longer ones by βAp, 3 and hAp, 3. Biosynthesis of shorter Am chains are dominated by “Am region 1” with parameters βAm, 1 and hAm, 1, and longer ones by βAm, 2 and hAm, 2. Large differences among the CLD fitting parameters were observed for different starches.
(1) In the SEC results used to build structure-thermal properties relations (Figure 1A and Table 1), generally, AWR starches had higher βAm, 2 than those of domesticated ones, consistent with AWR starches having shorter Am long chains (especially fewer X > 5,000 in AWR). This lower amount for X > 5,000 in AWR starches could be due to the lower enzyme activity of an isoform of granule-bound starch synthase (19).
(2) The SEC results (Figure 1B and Table 2) showed that AWR starches used here also had higher βAm, 2 than those of domesticated ones. The hAm, 1 and hAm, 2 values were generally in the order indica rice starches>AWR starches>japonica rice starches, which might be because of the different activity of an isoform of SS in different starches (19).
(3) The SEC results used to build structure-textural properties relations (Figure 1C and Table 3) showed that, generally, AWR starches had both higher βAm, 1 and higher βAm, 2 compared to domesticated ones.
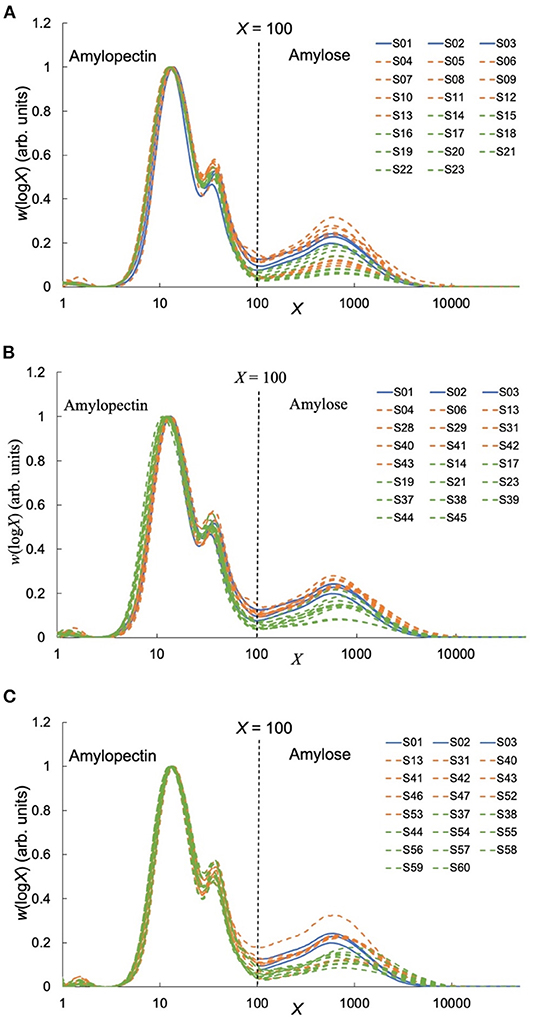
Figure 1. Size-Exclusion Chromatography (SEC) results. Values of w(logX), of debranched starch from AWRs and DRs. (A) Results used to build structure-thermal properties relations, (B) results used to build structure-in vitro digestion properties relations, (C) results used to build structure-textural properties relations. The debranched DR starch data obtained under the same conditions as the AWR starches are retrieved from the literature (Supplementary Table 1). AWRs consist of S01–S03, indica variety contains S04–S13, S28–S29, S31, S40–S43, S46–S47, S52–S53 and japonica variety contains S14–S23, S37–S39, S44–S45, S54–S60, respectively.
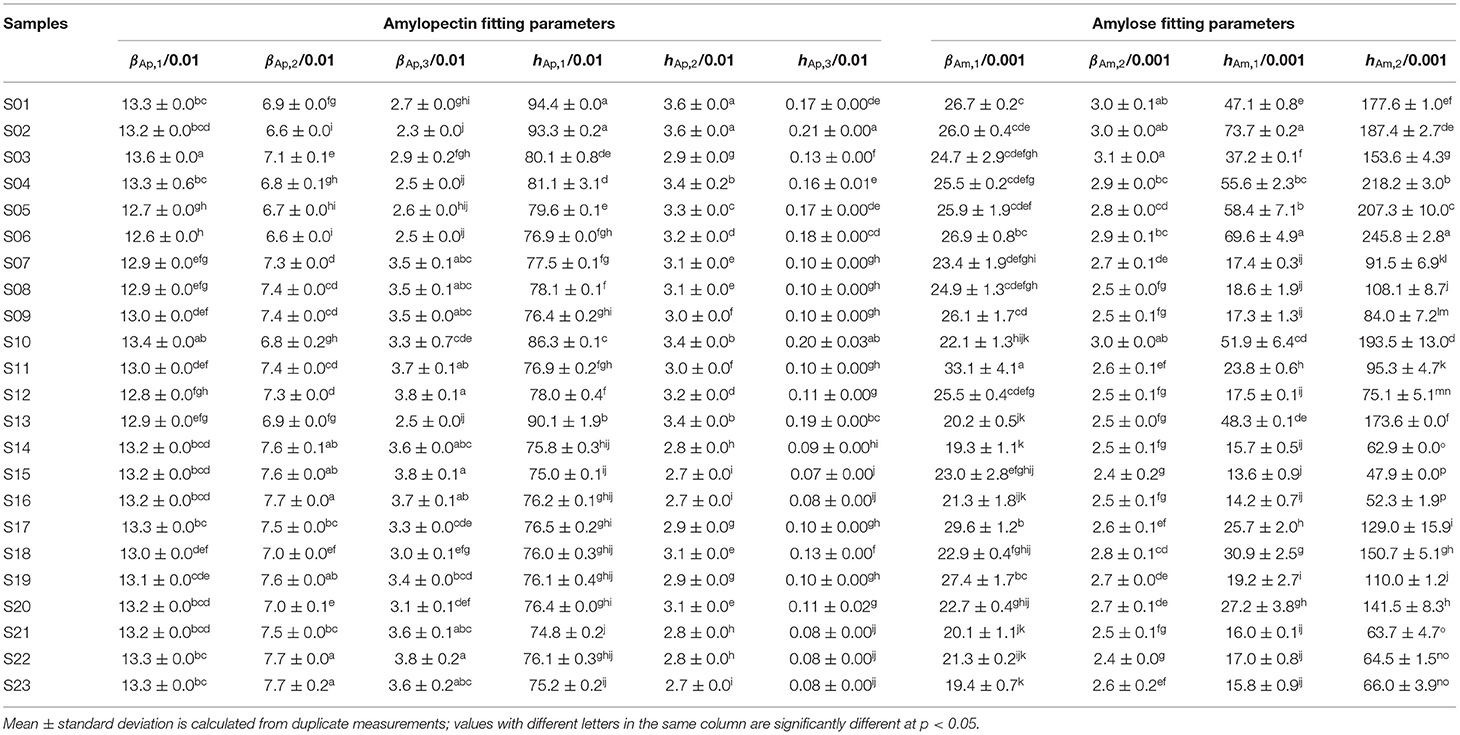
Table 1. Structural parameters of rice starches for building linear regression models of structure-thermal properties.
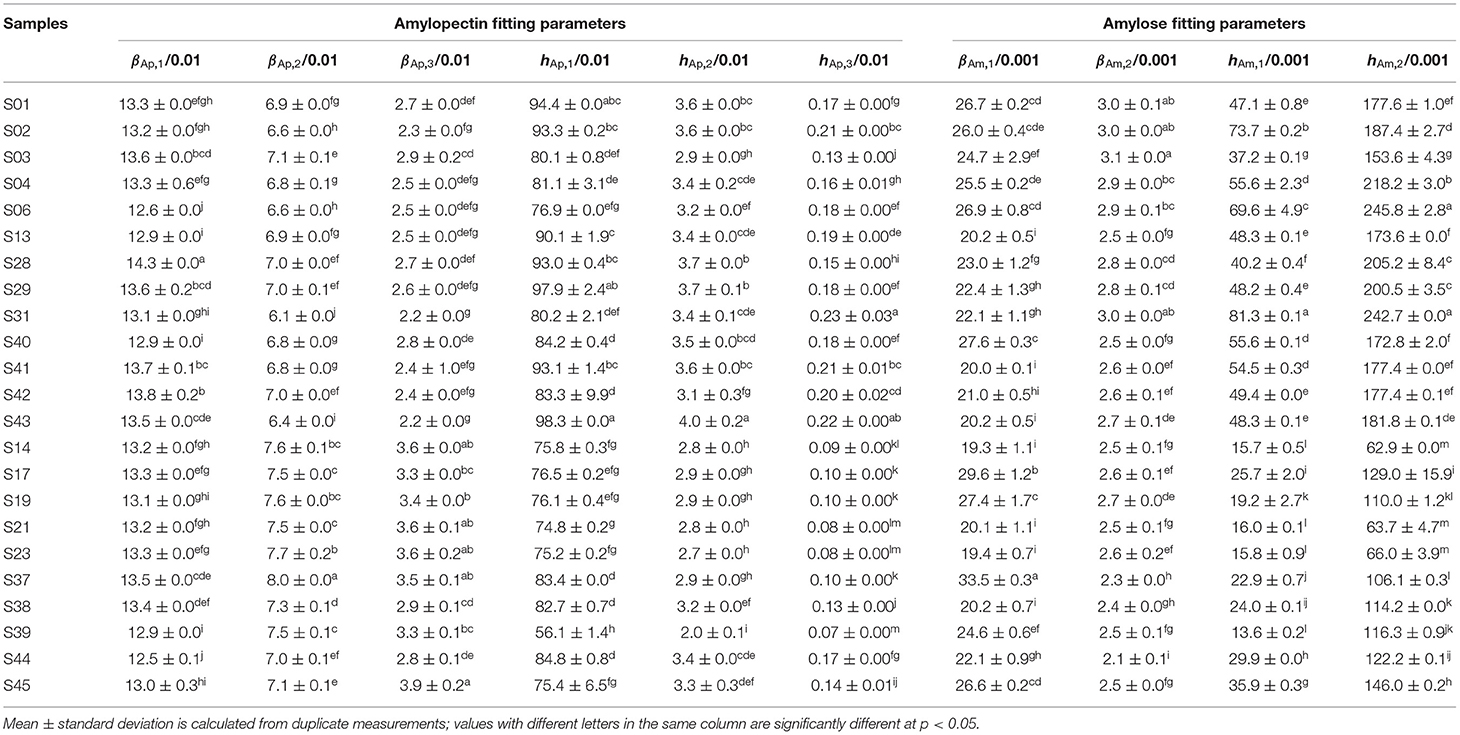
Table 2. Structural parameters of rice starches for building linear regression models of structure-in vitro digestion properties.
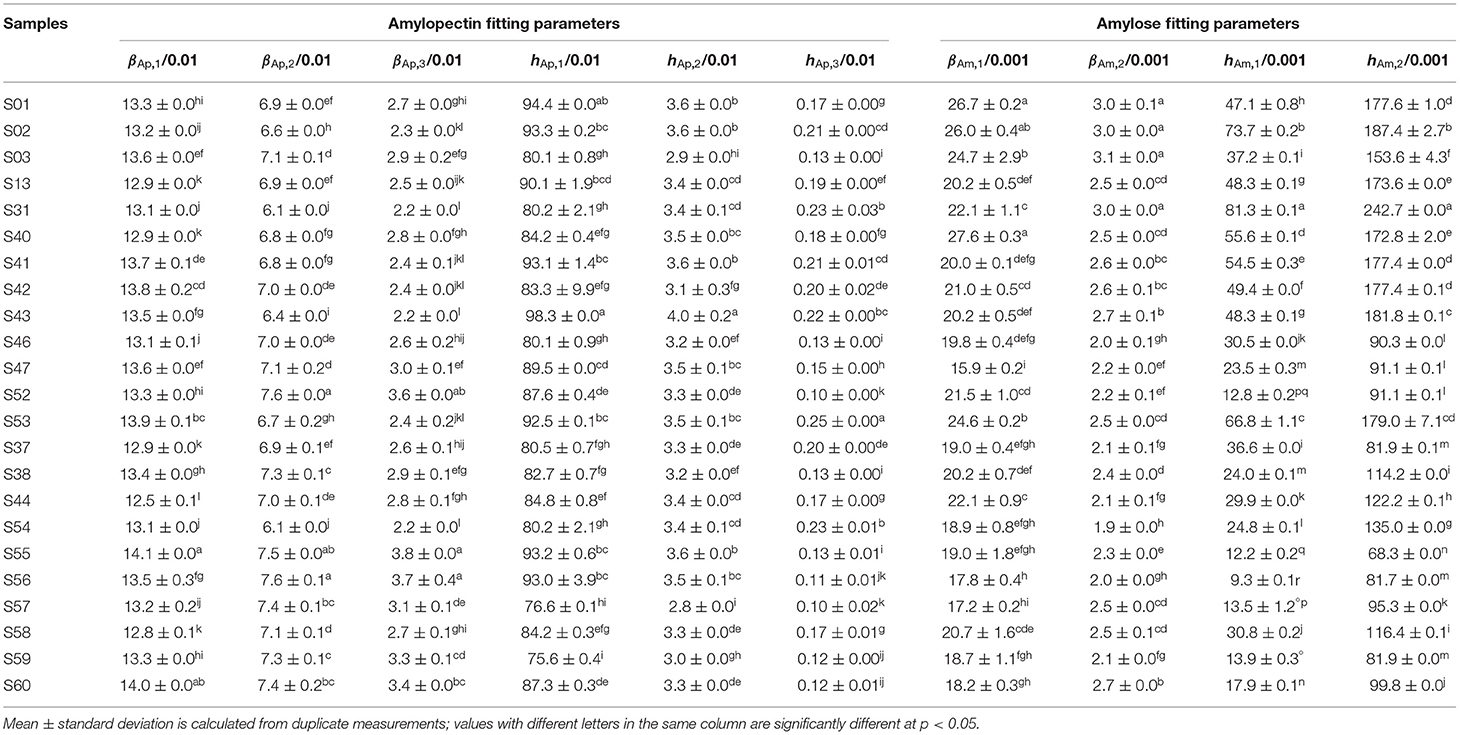
Table 3. Structural parameters of rice starches for building linear regression models of structure-textural properties.
These noticeable differences in structural properties are all desirable from the point of view of providing a wide “space” of structural parameters to test the linearity assumption, which is the aim of the present paper.
Comparison of Thermal Properties of AWRs and DRs
The thermal data of different starches are shown in Figure 2. The trends seen here are similar to those seen elsewhere, for which explanations have been given in the literature (34–38), and thus will not be discussed further. Generally, the AWR starches had higher gelatinization temperatures (To and Tp) than those of DR starches, showing that AWR starches had more ordered crystallinity than DR starches. The AWR starches had higher ΔHg than those of DR starches, but the ACs of AWR starches were in the range of those of DR.
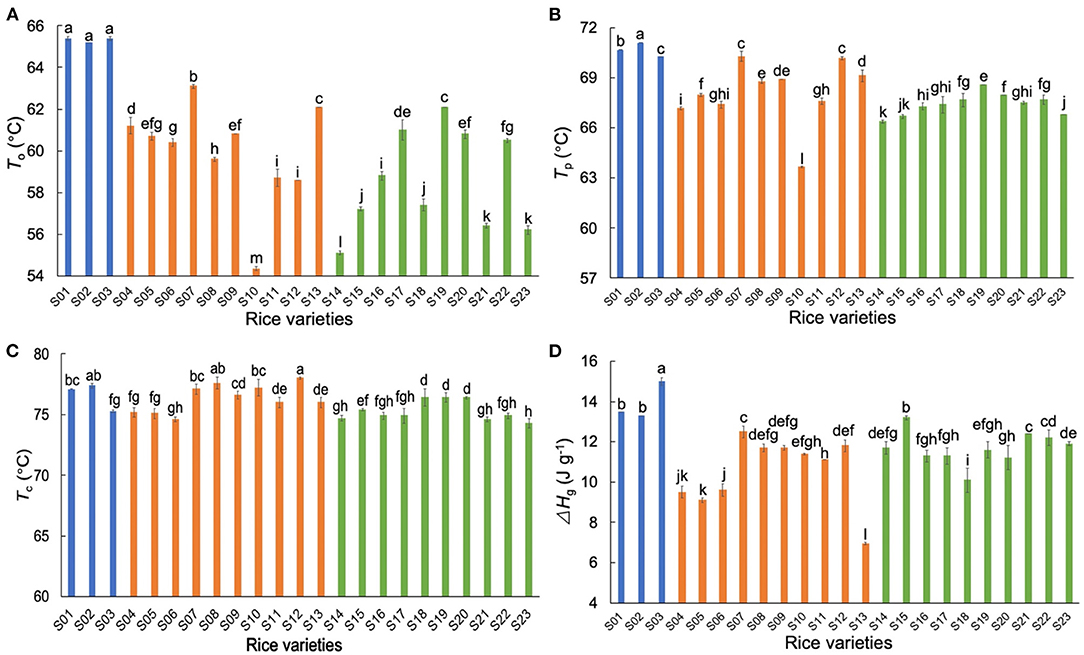
Figure 2. Comparison of thermal properties of native Australian Wild Rice (AWR) and Domesticated Rice (DR) starches. (A–D) The onset temperature (To), the peak temperature (Tp), the conclusion temperature (Tc), and the crystal melting enthalpy (ΔHg), respectively. Blue, orange and green: Australian wild (S01–S03), indica (S04–S13), and japonica rices (S14–S23), respectively. All data were from triplicate measurements. The same letters mean no significant difference (p < 0.05).
Comparison of in-vitro Digestibility Properties of AWRs and DRs
The in-vitro digestion curves of typical rice flours are shown in Supplementary Figure 2. Supplementary Figure 3 shows digestion data fitted to two models: a sequential model (both LoS and NLLS methods) (21) and a parallel model (22). The LoS plots shown in the Supplementary Figure 3A show that the digestion of both AWR flours and DR flours followed first-order kinetics. Similar results were obtained by Zou et al. (39). The LoS plots of rice flours were fitted with two-phase digestion kinetics (two linear regions with different slopes) (40) for different concentrations of α-amylase. The digestion rate coefficients and the fractions of starch undigested at long reaction times of all rices are shown in Figure 3. In the LoS method, kL is the digestion rate coefficient of starch of LoS and CL∞ is the percentage of starch digested at long times. Generally, the values of kL of AWR flours were the slowest among all samples. The AC had significant negative correlations with kL (41) and the AC was in the order of indica rice varieties > AWRs > japonica rice varieties. This indicated that AC was the dominant but not sole factor determining kL. No obvious differences can be seen in CL∞ between AWR flours and DR flours.
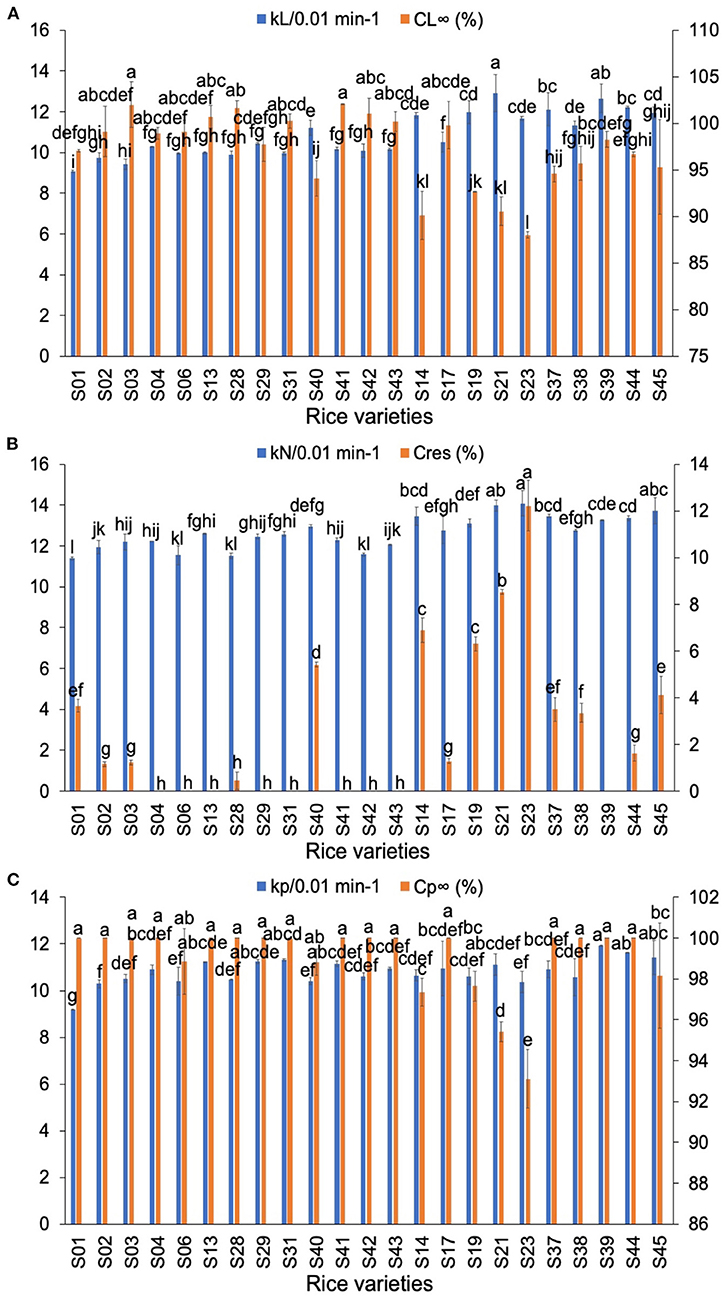
Figure 3. Comparison of in-vitro digestibility parameters of Australian Wild Rices (AWRs) and Domesticated Rices (DRs). (A) The digestion parameters calculated from logarithm of slopes (LoS), (B) the digestion parameters calculated from non-linear least-squares (NLLS), (C) the digestion parameters calculated from parallel models. AWRs consist of S01–S03, indica variety contains S04, S06, S13, S28–S29, S31, S40–S43, and japonica variety contains S14, S17, S19, S21, S23, S37–S39, S44–S45, respectively. kL, kN, and kp are the digestion rate coefficients of starch of LoS, NLLS, and parallel models, respectively. CL∞ is the percentage of starch digested at very long reaction time of LoS. Cres is the fraction of residual starch (starch remaining after an extended digestion period). Cp∞ is the percentage of starch digested at very long reaction time of parallel models. All data were from duplicate measurements. The same letters mean no significant difference (p < 0.05).
In the NLLS model, the value(s) of kN is/are the digestion rate coefficient(s) of starch of NLLS over the first-order region(s) and Cres is the fraction of residual starch (starch remaining after an extended digestion period). Generally, the kN values were in the order of AWRs < indica rice varieties < japonica rice varieties. There were no significant differences in Cres between AWR flours and DR flours. In the parallel digestion model, kp is the digestion rate coefficient of starch and Cp∞ is the fraction of starch digested at very long reaction time. Generally, the kp of AWR flours were slightly less than the DR counterparts. No clear differences were found in Cp∞ between AWR flours and DR flours.
Generally, the AWR flours had slower digestion rate coefficients, but no noticeable differences in digestion degree, compared to DRs.
Comparison of Textural Properties of AWRs and DRs
The texture results for different rices are shown in Figure 4. Apart from hardness and stickiness, it has been shown (42) that, for cooked rice, other attributes are not significant in texture profile analysis measurements. Therefore, only hardness and stickiness were significant as textural properties here. AWRs had neither higher nor lower hardness compared to those of DRs while AWRs had lower stickiness than those of japonica rices. The results are in agreement with the finding that hardness was not only affected by AC (3, 42): the hardness of AWRs with higher AC were not higher than those of japonica rice varieties with lower AC.
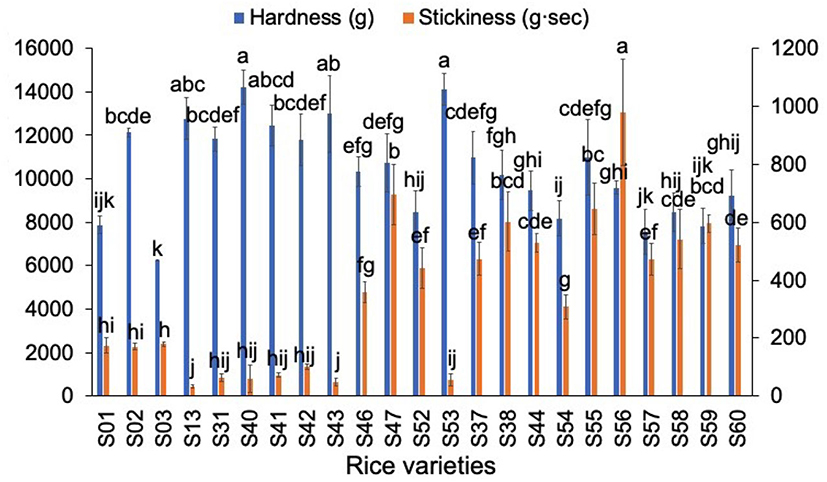
Figure 4. Comparison of textural parameters of Australian Wild Rices (AWRs) and Domesticated Rices (DRs). AWRs consist of S01–S03, indica variety contains S13, S31, S40–S43, S46–S47, S52–S53 and japonica variety contains S37–S38, S44, S54–S60, respectively. All data were from five times measurements. The same letters mean no significant difference (p < 0.05).
Multiple Linear Regression Between Starch Molecular Structure and Properties
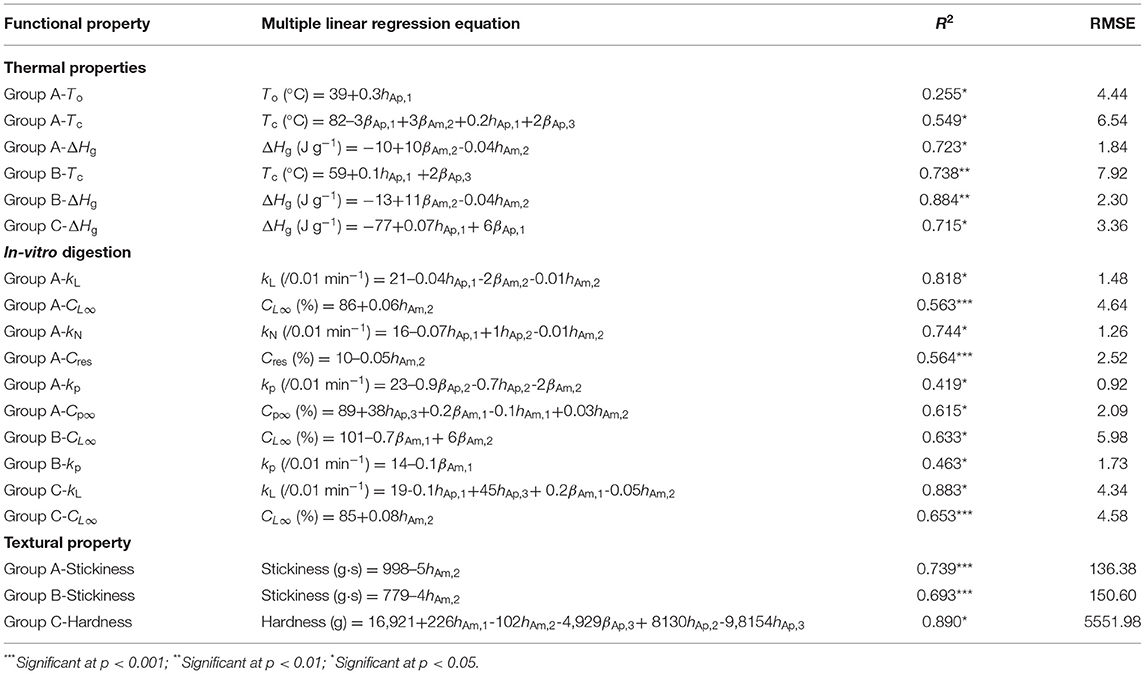
AWRs had significant differences in structure and properties compared to those of DRs, and thus are useful for structure-property linear regressions and in testing the linearity assumption implicit in finding correlations from these. Although AC plays an important role in determining thermal, in-vitro digestibility and textural parameters, Am CLD fitting parameters can better explain the mechanisms of these three properties (27, 30, 31, 43). The linear regression results for rice properties based on their related starch molecular fine structure are shown in Table 4, and tests of the suitability of these linear regression models are presented in Figures 5–7. The parameters with insignificant regression coefficients are not shown.
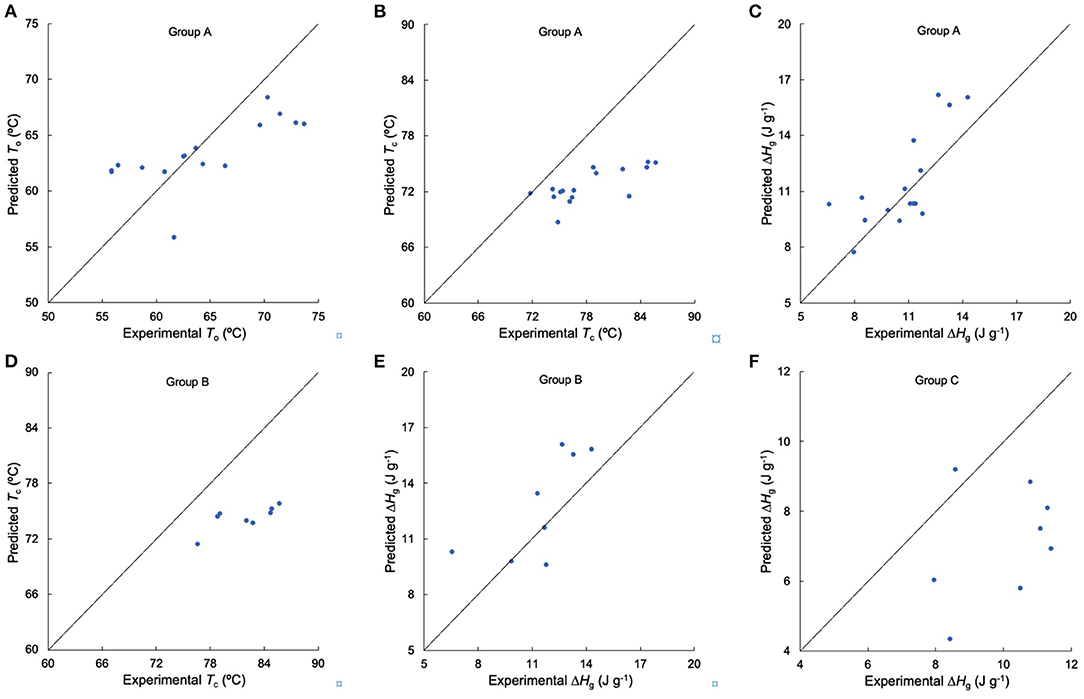
Figure 5. Testing the suitability of linear regression models for thermal properties. (A–C) Comparison of experimental and predicted To, Tc, and ΔHg from Group A, respectively, (D,E) comparison of experimental and predicted Tc, and ΔHg from Group B, respectively, (F) comparison of experimental and predicted ΔHg from Group C. Samples DR S24–S31 and S32–S39 were used in Group A, samples DR S24–S31 were used in Group B, and samples DR S32–S39 were used in Group C.
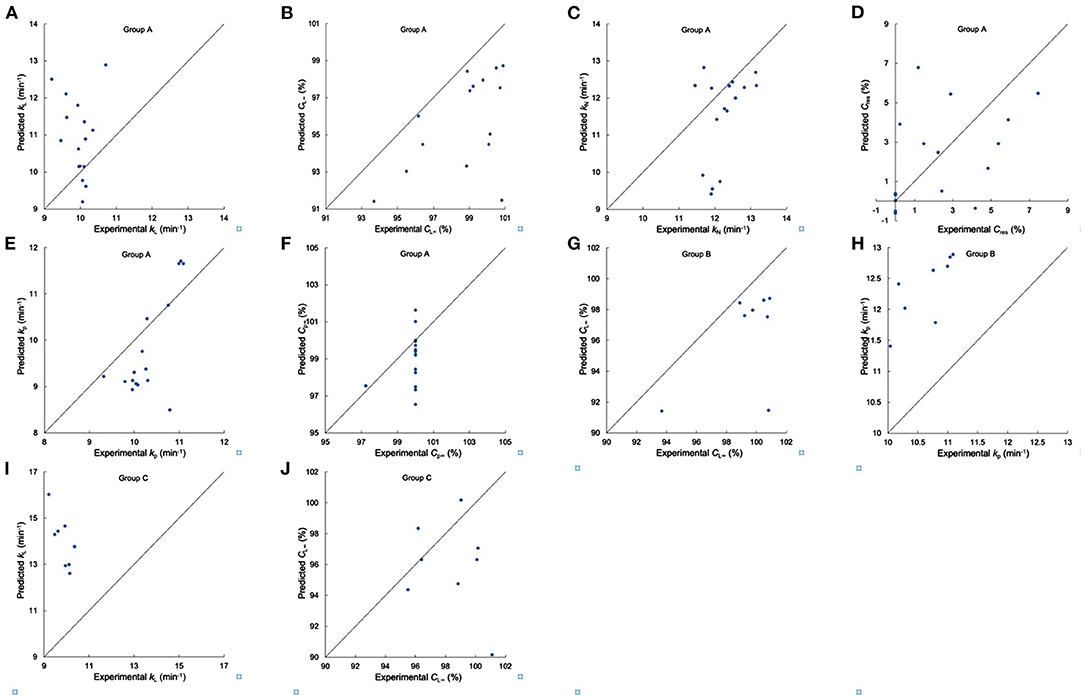
Figure 6. Testing the suitability of linear regression models for in vitro digestion properties. (A–F) Comparison of experimental and predicted kL, CL∞, kN, Cres, kp and Cp∞ from Group A, respectively, (G,H) comparison of experimental and predicted CL∞, and kp from Group B, respectively, (I,J) comparison of experimental and predicted kL and CL∞ from Group C. Samples DR S05, S10, S46–S51, and S18, S20, S22, S32–S36 were used in Group A, samples DR S05, S10, S46–S51 were used in Group B, and samples DR S18, S20, S22, S32–S36 were used in Group C.
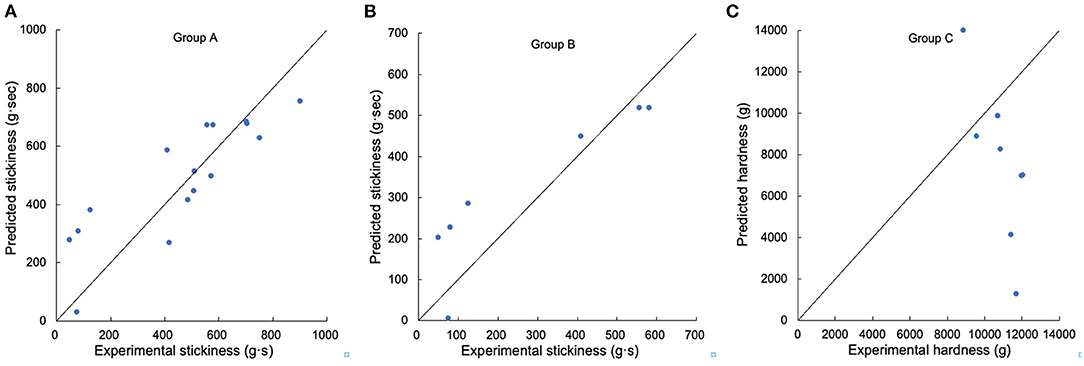
Figure 7. Testing the suitability of linear regression models for textural properties. (A) Comparison of experimental and predicted stickiness from Group A, (B) comparison of experimental and predicted stickiness from Group B, (C) comparison of experimental and predicted hardness from Group C. Samples DR S10, S61–S67, and S39, S45, S68–S73 were used in Group A, samples DR S10, S61–S67 were used in Group B, and samples DR S39, S45, S68–S73 were used in Group C.
The process for testing the applicability of the linearity assumption is as follows. Take Group A-ΔHg as an example (as stated above, Group A for thermal properties consisted of samples AWR S01–S03, DR S04–S13, and S14–S23). It has been reported that ΔHg were significantly correlated with βAp, 1, βAp, 2, βAp, 3, hAp, 1, βAm, 2 and hAm, 2 in rice starches (5, 24, 28, 34). The CLDs of these rice starches were characterized with SEC and the results were fitted to biosynthesis-based models, as discussed above. Here, we measured the thermal properties and calculated ΔHg of these rice starches (Figure 2 and Supplementary Table 2). We obtained linear correlation coefficients between ΔHg and its related structural parameters (βAp, 1, βAp, 2, βAp, 3, hAp, 1, βAm, 2 and hAm, 2) by a backward regression approach. We applied a linear regression model for Group A-ΔHg to yield ΔHg (J g−1) = −10+10βAm, 2 −0.04hAm, 2 (p < 0.05, R2 = 0.723, RMSE = 1.84, as shown in Table 4). If p > 0.05, the linear regression model would not be reliable. Finally, this linear fit was then used to predict ΔHg values not included in the original data set (another 16 DRs, sample DR S24–S31, and S32–S39 for Group A-ΔHg) (Figure 5C). It was found that this linear model can predict Group A-ΔHg with acceptable accuracy, because all predicted data were on or very close to the lines for experiment = predicted. If the predicted data were far away from this line, that means the linear model cannot predict the property to acceptable accuracy. The method used to build linear models between structure and property in rices can also be applicable to other cereals. The objective of the present paper is to see if linear models, commonly used to find structure-property correlations, could be used predictively. An example might be as a guide to rice breeders to try developing major changes in a structural characteristic, such as greatly increased chain lengths and hence slower digestibility. A typical case was studied; if acceptable predictability were to be found in this one case, then it would be useful to perform this simple procedure in more cases. If not, then of course the linearity assumption cannot be used predictively.
For thermal properties (Table 4), To, and Tp had significant correlations with βAp, 1, βAp, 2, hAp, 1, hAp, 2, hAm, 1 and hAm, 2, while Tc and ΔHg were significantly correlated with βAp, 1, βAp, 2, βAp, 3, hAp, 1, βAm, 2 and hAm, 2 (5, 24, 26–28, 30, 31, 34). In terms of the thermal properties in Group A, the linear model can predict To and ΔHg with varying degrees of accuracy (Am and Ap structure accounted for 25.5 and 72.3% of the total variation of To, and ΔHg, respectively), while the linear model cannot predict Tc to acceptable accuracy. In addition, the linear model can acceptably predict ΔHg of Group B in terms of the CLDs of long-to-extra long Am chains (X > 500) (βAm, 2 and hAm, 2), but cannot predict that of Group C to acceptable accuracy. This might be because, as shown in Table 4, the linear regression models for Group A – ΔHg and Group B-ΔHg had similar structural parameters, but different from those of Group C – ΔHg. The R2 of linear regression of the Tc results for Group B was higher than that for Group A, but the number of variables in establishing linear regression of Group B was less than that of Group A. This suggests that although using similar varieties can improve the accuracy of linear regression analysis of structure-property relations, this may overlook important structural parameters, by restricting the “space” of structures. Compared to the linear regression model for gelatinization properties which confined the Am structural parameters to AC alone (6), our study considered more Am CLD structural parameters in the linear regression. The value of hAp, 1 was the most frequent significant variable in structure-thermal relations. This is because Ap chains with DP 13–24 can form double helices (44, 45).
For in-vitro digestibility properties, the values of kL, kN, and kp had significant correlations with βAp, 2, hAp, 1, hAp, 2, hAp, 3, βAm, 1, βAm, 2, hAm, 1, hAm, 2 and protein content, while CL∞, Cres, Cp∞ were significantly and positively/negatively correlated with βAp, 2, hAp, 3, βAm, 1, βAm, 2, hAm, 1, hAm, 2 and protein content (5, 23, 29, 30, 32, 33). Digestibility parameters of rice flour used to test the suitability of linear regression models for in vitro digestion properties are shown in Supplementary Table 3. All digestion rate coefficients for Group A flours, the kL, kN, kp values, showed slight differences among the varieties tested, which were different from the case for the digestion of pure starches (which can be ascribed to a number of reasons not discussed here because they are not relevant to the aims of the present paper) (5). Nearly all Cp∞ values are 100% and CL∞ values are smaller than their Cp∞ counterparts. The linear model cannot predict digestion parameters of Group A to acceptable accuracy for any of the three digestion models. The values of kp of Group B flours and the kL values of Group C flours showed very slight differences among the varieties tested. The linear model cannot predict CL∞ or kp of Group B and kL or CL∞ of Group C to acceptable accuracy.
For texture properties, hardness had significant correlations with βAp, 2, βAp, 3, hAp, 2, hAp, 3, hAm, 1, hAm, 2 and protein content, while stickiness was significantly correlated with βAp, 2, βAp, 3, hAp, 2, hAp, 3, βAm, 1, hAm, 1, hAm, 2 and protein content (4, 14, 25). For Group A textural properties, the linear model can predict stickiness fairly accurately (the amount of long-to-extra long Am chains (X > 500) (hAm, 2) accounted for 73.9% of the total variation of stickiness). The linear regression value of R2 was always much lower than 1, but some linear regression models cannot be applied to additional samples, suggesting that the properties were controlled by more than just the CLDs, such as other structural features and food components also being important. The linear model cannot predict either Group B stickiness or Group C hardness to acceptable accuracy.
In conclusion, it is apparent that while the assumption of structure-property linearity is useful for determining statistical correlations, it is only occasionally useful for quantitative prediction of these properties. The linearity assumption is often only applicable for changes close to the conditions under which the linear coefficients are determined.
Data Availability Statement
The original contributions presented in the study are included in the article/Supplementary Material, further inquiries can be directed to the corresponding author/s.
Author Contributions
YZ: conceptualization, methodology, investigation, formal analysis, writing—original draft, and writing—review and editing. RH: conceptualization, supervision, and writing—review and editing. RG: conceptualization, supervision, formal analysis, and writing—review and editing. All authors contributed to the article and approved the submitted version.
Funding
The authors acknowledge the financial support of a University of Queensland Research Training Scholarship, China Scholarship Council Scholarship and National Natural Science Foundation of China grant C1304013151101138 – a project funded by the Priority Academic Program of Jiangsu Higher Education Institutions.
Conflict of Interest
The authors declare that the research was conducted in the absence of any commercial or financial relationships that could be construed as a potential conflict of interest.
Publisher's Note
All claims expressed in this article are solely those of the authors and do not necessarily represent those of their affiliated organizations, or those of the publisher, the editors and the reviewers. Any product that may be evaluated in this article, or claim that may be made by its manufacturer, is not guaranteed or endorsed by the publisher.
Acknowledgments
The authors appreciate the contribution of Dr. Enpeng Li and Dr. Songnan Li to the study.
Supplementary Material
The Supplementary Material for this article can be found online at: https://www.frontiersin.org/articles/10.3389/fnut.2022.916751/full#supplementary-material
Abbreviations
Am, amylose; Ap, amylopectin; AWRs, Australian wild rices; DRs, domesticated rices; CLD, chain length distribution; DP, degree of polymerization; SEC, size-exclusion chromatography; LoS, logarithm of slope; NLLS, non-linear least-squares.
References
1. Brar DS, Khush GS. Wild relatives of rice: a valuable genetic resource for genomics and breeding research. In: Mondal TK, Henry RJ, editors. The Wild Oryza Genomes. Cham: Springer International Publishing (2018). p. 1–25.
2. Waters DLE, Nock CJ, Ishikawa R, Rice N, Henry RJ. Chloroplast genome sequence confirms distinctness of Australian and Asian wild rice. Ecol Evol. (2012) 2:211–17. doi: 10.1002/ece3.66
3. Zhao Y, Henry RJ, Gilbert RG. Starch structure-property relations in Australian wild rices compared to domesticated rices. Carbohydr Polym. (2021) 271:118412. doi: 10.1016/j.carbpol.2021.118412
4. Tao K, Yu W, Gilbert RG. High-amylose rice: starch molecular structural features controlling cooked rice texture and preference. Carbohydr Polym. (2019) 219:251–60. doi: 10.1016/j.carbpol.2019.05.031
5. Gong B, Cheng L, Gilbert RG, Li C. Distribution of short to medium amylose chains are major controllers of in vitro digestion of retrograded rice starch. Food Hydrocoll. (2019) 96:634–43. doi: 10.1016/j.foodhyd.2019.06.003
6. Patindol J, Gu X, Wang YJ. Chemometric analysis of the gelatinization and pasting properties of long-grain rice starches in relation to fine structure. Starch Stärke. (2009) 61:3–11. doi: 10.1002/star.200800022
7. Patindol J, Gu X, Wang YJ. Chemometric analysis of cooked rice texture in relation to starch fine structure and leaching characteristics. Starch Stärke. (2010) 62:188–97. doi: 10.1002/star.200900181
8. Srichuwong S, Isono N, Jiang H, Mishima T, Hisamatsu M. Freeze–thaw stability of starches from different botanical sources: correlation with structural features. Carbohydr Polym. (2012) 87:1275–9. doi: 10.1016/j.carbpol.2011.09.004
9. Li W, Li C, Gu Z, Qiu Y, Cheng L, Hong Y, et al. Relationship between structure and retrogradation properties of corn starch treated with 1,4-α-glucan branching enzyme. Food Hydrocoll. (2016) 52:868–75. doi: 10.1016/j.foodhyd.2015.09.009
10. Liu Q, Tao Y, Cheng S, Zhou L, Tian J, Xing Z, et al. Relating amylose and protein contents to eating quality in 105 varieties of Japonica rice. Cereal Chem. (2020) 97:1303–12. doi: 10.1002/cche.10358
11. Zhang C, Zhou L, Zhu Z, Lu H, Zhou X, Qian Y, et al. Characterization of grain quality and starch fine structure of two japonica rice (Oryza sativa) cultivars with good sensory properties at different temperatures during the filling stage. J Agric Food Chem. (2016) 64:4048–57. doi: 10.1021/acs.jafc.6b00083
12. Zhang C, Chen S, Ren X, Lu Y, Liu D, Cai X, et al. Molecular structure and physicochemical properties of starches from rice with different amylose contents resulting from modification of OsGBSSI activity. J Agric Food Chem. (2017) 65:2222–32. doi: 10.1021/acs.jafc.6b05448
13. Zhang C, Yang Y, Chen Z, Chen F, Pan L, Lu Y, et al. Characteristics of grain physicochemical properties and the starch structure in rice carrying a mutated ALK/SSIIa gene. J Agric Food Chem. (2020) 68:13950–9. doi: 10.1021/acs.jafc.0c01471
14. Li C, Ji Y, Li E. Understanding the influences of rice starch fine structure and protein content on cooked rice texture. Starch Stärke. (2021) 2100253. doi: 10.1002/star.202100253
15. Zhu J, Yu W, Zhang C, Zhu Y, Xu J, Li E, et al. New insights into amylose and amylopectin biosynthesis in rice endosperm. Carbohydr Polym. (2019) 230:115656. doi: 10.1016/j.carbpol.2019.115656
16. Zhao Y, Tan X, Wu G, Gilbert RG. Using molecular fine structure to identify optimal methods of extracting starch. Starch Stärke. (2020) 72:1900214. doi: 10.1002/star.201900214
17. Vilaplana F, Gilbert RG. Characterization of branched polysaccharides using multiple-detection size separation techniques. J Sep Sci. (2010) 33:3537–54. doi: 10.1002/jssc.201000525
18. Wu AC, Morell MK, Gilbert RG. A parameterized model of amylopectin synthesis provides key insights into the synthesis of granular starch. PLoS ONE. (2013) 8:e65768. doi: 10.1371/journal.pone.0065768
19. Nada SS, Zou W, Li C, Gilbert RG. Parameterizing amylose chain-length distributions for biosynthesis-structure-property relations. Anal Bioanal Chem. (2017) 409:6813–19. doi: 10.1007/s00216-017-0639-5
20. Butterworth PJ, Warren FJ, Grassby T, Patel H, Ellis PR. Analysis of starch amylolysis using plots for first-order kinetics. Carbohydr Polym. (2012) 87:2189–97. doi: 10.1016/j.carbpol.2011.10.048
21. Yu W, Tao K, Gilbert RG. Improved methodology for analyzing relations between starch digestion kinetics and molecular structure. Food Chem. (2018) 264:284–92. doi: 10.1016/j.foodchem.2018.05.049
22. Li H, Dhital S, Gidley MJ, Gilbert RG. A more general approach to fitting digestion kinetics of starch in food. Carbohydr Polym. (2019) 225:115244. doi: 10.1016/j.carbpol.2019.115244
23. Syahariza ZA, Sar S, Tizzotti M, Hasjim J, Gilbert RG. The importance of amylose and amylopectin fine structures for starch digestibility in cooked rice grains. Food Chem. (2013) 136:742–9. doi: 10.1016/j.foodchem.2012.08.053
24. Tikapunya T, Zou W, Yu W, Powell PO, Fox GP, Furtado A, et al. Molecular structures and properties of starches of Australian wild rice. Carbohydr Polym. (2017) 172:213–22. doi: 10.1016/j.carbpol.2017.05.046
25. Li H, Yang J, Yan S, Lei N, Wang J, Sun B. Molecular causes for the increased stickiness of cooked non-glutinous rice by enzymatic hydrolysis of the grain surface protein. Carbohydr Polym. (2019) 216:197–203. doi: 10.1016/j.carbpol.2019.04.031
26. Tao K, Li C, Yu W, Gilbert RG, Li E. How amylose molecular fine structure of rice starch affects functional properties. Carbohydr Polym. (2019) 204:24–31. doi: 10.1016/j.carbpol.2018.09.078
27. Li C, Gong B. Insights into chain-length distributions of amylopectin and amylose molecules on the gelatinization property of rice starches. Int J Biol Macromol. (2020) 155:721–9. doi: 10.1016/j.ijbiomac.2020.04.006
28. Li C, Hu Y, Huang T, Gong B, Yu W.-W. A combined action of amylose and amylopectin fine molecular structures in determining the starch pasting and retrogradation property. Int J Biol Macromol. (2020) 164:2717–25. doi: 10.1016/j.ijbiomac.2020.08.123
29. Li C, Gong B, Huang T, Yu W.-W. In vitro digestion rate of fully gelatinized rice starches is driven by molecular size and amylopectin medium-long chains. Carbohydr Polym. (2021) 254:117275. doi: 10.1016/j.carbpol.2020.117275
30. Li C, Hu Y, Gu F, Gong B. Causal relations among starch fine molecular structure, lamellar/crystalline structure and in vitro digestion kinetics of native rice starch. Food Funct. (2021) 12:682–95. doi: 10.1039/D0FO02934C
31. Li C, Hu Y, Li E. Effects of amylose and amylopectin chain-length distribution on the kinetics of long-term rice starch retrogradation. Food Hydrocoll. (2021) 111:106239. doi: 10.1016/j.foodhyd.2020.106239
32. Li C. Consecutive reaction kinetics model reveals the nature of long-term rice amylopectin retrogradation characteristics. Food Chem. (2022) 369:131000. doi: 10.1016/j.foodchem.2021.131000
33. Li C, Hu Y. Modeling of in vitro digestogram by consecutive reaction kinetics model reveals the nature of starch digestive characteristics. Food Hydrocoll. (2022) 124:107203. doi: 10.1016/j.foodhyd.2021.107203
34. Li E, Cao P, Cao W, Li C. Relations between starch fine molecular structures with gelatinization property under different moisture content. Carbohydr Polym. (2022) 278:118955. doi: 10.1016/j.carbpol.2021.118955
35. Cooke D, Gidley MJ. Loss of crystalline and molecular order during starch gelatinisation: origin of the enthalpic transition. Carbohydr Res. (1992) 227:C103–12. doi: 10.1016/0008-6215(92)85063-6
36. Lopez-Rubio A, Flanagan BM, Gilbert EP, Gidley MJ. A novel approach for calculating starch crystallinity and its correlation with double helix content: a combined XRD and NMR study. Biopolymers. (2008) 89:761–8. doi: 10.1002/bip.21005
37. Gomand SV, Lamberts L, Gommes CJ, Visser RG, Delcour JA, Goderis B. Molecular and morphological aspects of annealing-induced stabilization of starch crystallites. Biomacromolecules. (2012) 13:1361–70. doi: 10.1021/bm3000748
38. Vamadevan V, Bertoft E, Soldatov DV, Seetharaman K. Impact on molecular organization of amylopectin in starch granules upon annealing. Carbohydr Polym. (2013) 98:1045–55. doi: 10.1016/j.carbpol.2013.07.006
39. Zou W, Butardo VM, Toutounji M, Luo J, Farahnaky A, Blanchard C. Harnessing particle disintegration of cooked rice grains for predicting glycaemic index. Carbohydr Polym. (2020) 248:116789. doi: 10.1016/j.carbpol.2020.116789
40. Li C, Cao P, Wu P, Yu W, Gilbert RG, Li E. Effects of endogenous proteins on rice digestion during small intestine (in vitro) digestion. Food Chem. (2020) 344:128687. doi: 10.1016/j.foodchem.2020.128687
41. Li N, Guo Y, Zhao S, Kong J, Qiao D, Lin L, et al. Amylose content and molecular-order stability synergistically affect the digestion rate of indica rice starches. Int J Biol Macromol. (2020) 144:373–9. doi: 10.1016/j.ijbiomac.2019.12.095
42. Li H, Gilbert RG. Starch molecular structure: the basis for an improved understanding of cooked rice texture. Carbohydr Polym. (2018) 195:9–17. doi: 10.1016/j.carbpol.2018.04.065
43. Li C, Luo JX, Zhang CQ, Yu WW. Causal relations among starch chain-length distributions, short-term retrogradation and cooked rice texture. Food Hydrocoll. (2020) 108:106064. doi: 10.1016/j.foodhyd.2020.106064
44. Yuryev VP, Krivandin AV, Kiseleva VI, Wasserman LA, Genkina NK, Fornal J, et al. Structural parameters of amylopectin clusters and semi-crystalline growth rings in wheat starches with different amylose content. Carbohydr Res. (2004) 339:2683–91. doi: 10.1016/j.carres.2004.09.005
45. Koroteeva DA, Kiseleva VI, Krivandin AV, Shatalova OV, Blaszczak W, Bertoft E, et al. Structural and thermodynamic properties of rice starches with different genetic background. Part 2. Defectiveness of different supramolecular structures in starch granules. Int J Biol Macromol. (2007) 41:534–47. doi: 10.1016/j.ijbiomac.2007.07.005
Keywords: rice, linear correlation, starch, molecular structure, properties
Citation: Zhao Y, Henry RJ and Gilbert RG (2022) Testing the Linearity Assumption for Starch Structure-Property Relationships in Rices. Front. Nutr. 9:916751. doi: 10.3389/fnut.2022.916751
Received: 10 April 2022; Accepted: 02 May 2022;
Published: 23 May 2022.
Edited by:
Hongyan Li, Beijing Technology and Business University, ChinaReviewed by:
Lijun Sun, Northwest A&F University, ChinaTao Huang, Ningbo University, China
Binjia Zhang, Huazhong Agricultural University, China
Copyright © 2022 Zhao, Henry and Gilbert. This is an open-access article distributed under the terms of the Creative Commons Attribution License (CC BY). The use, distribution or reproduction in other forums is permitted, provided the original author(s) and the copyright owner(s) are credited and that the original publication in this journal is cited, in accordance with accepted academic practice. No use, distribution or reproduction is permitted which does not comply with these terms.
*Correspondence: Robert G. Gilbert, Yi5naWxiZXJ0QHVxLmVkdS5hdQ==
 Yingting Zhao
 Robert J. Henry
 Robert G. Gilbert