
94% of researchers rate our articles as excellent or good
Learn more about the work of our research integrity team to safeguard the quality of each article we publish.
Find out more
REVIEW article
Front. Nutr., 22 June 2022
Sec. Nutritional Epidemiology
Volume 9 - 2022 | https://doi.org/10.3389/fnut.2022.890730
 Xin-yu Fang1,2
 Liang-wei Qi1,2
 Hai-feng Chen1,2
 Peng Gao1,2
 Qin Zhang1,2
 Rui-xue Leng1,2
 Yin-guang Fan1,2
 Bao-zhu Li1
 Hai-feng Pan1,2
 Dong-qing Ye1,2*
With the worldwide epidemics of hyperuricemia and associated gout, the diseases with purine metabolic disorders have become a serious threat to human public health. Accumulating evidence has shown that they have been linked to increased consumption of fructose in humans, we hereby made a timely review on the roles of fructose intake and the gut microbiota in regulating purine metabolism, together with the potential mechanisms by which excessive fructose intake contributes to hyperuricemia and gout. To this end, we focus on the understanding of the interaction between a fructose-rich diet and the gut microbiota in hyperuricemia and gout to seek for safe, cheap, and side-effect-free clinical interventions. Furthermore, fructose intake recommendations for hyperuricemia and gout patients, as well as the variety of probiotics and prebiotics with uric acid-lowering effects targeting the intestinal tract are also summarized to provide reference and guidance for the further research.
In recent years, the prevalence and incidence of hyperuricemia and gout is increasing, and the age of onset has shifted to an earlier life (1–3). The rate of hyperuricemia prevalence more than doubled between the 1960s and the 1990s and continued to increase steadily afterwards until at least 2016 (3, 4), reaching to ~21%. As a result, between 1997–2012, the global gout prevalence rate increased from 1.5 to 2.5% (5). The increasing incidence of hyperuricemia and its associated co-morbidities (e.g., gout, type 2 diabetes, and cardiovascular disease) in the general population worldwide has greatly increased the public health burden on society (6). As a major public health issue, their need for clinical interventions has attracted significant interest. It is well-known that the consumption of sweeteners, mostly fructose, has increased dramatically after the Industrial Revolution, leading to a dietary shift in the world population (7). Given fructose consumption can stimulate the catabolism of adenine nucleotides to increase uric acid (UA) levels, the association between increased intake of fructose in the dietary profile and the risk of hyperuricemia and gout has been noted and confirmed by many studies, although some studies have inconsistent results (8–10). Besides, since ~25% of UA is excreted into the gut and further metabolized by gut bacteria, the gut microbiota nowadays has become a new target to understand the pathogenesis of hyperuricemia and gout (11). As diet shifts are important factors in the formation and modification of gut microbiota, which plays a key role in drug therapy, understanding the interactive roles of fructose and gut microbiota in hyperuricemia and gout are imperative to seek safe and effective clinical application. Therefore, this review provides an overview of the relationship among fructose intake, gut microbiota metabolism, and hyperuricemia or gout, as well as further discussion of their connective mechanisms. Moreover, the potential role of probiotics, prebiotics and fructose intake recommendations in the prevention and management of hyperuricemia or gout are further summarized.
The progression of hyperuricemia and gout includes four pathophysiological stages: the development of hyperuricemia, the deposition of monosodium urate crystals, gout flares caused by the acute inflammation to deposited crystals, and advanced disease featured with tophi (11).
The hallmark of gout is the concentration of serum uric acid (SUA), whose solubility threshold is well-known to be affected by temperature, pH, and sodium concentration (11). In general, the definition of hyperuricemia is established when the concentration of SUA reachs 6.8 mg/dl (416 mmol/l), which is equivalent to the solubility threshold of urate at pH of 7.4 and temperature of 37°C (11, 12) in human. However, the definition of hyperuricemia varies with age and gender (13). It has been defined as SUA>7.0 mg/dL (420 mmol/l) in men; >6.0 mg/dL (360 mmol/l) in women; and >5.5 mg/dL (330 mmol/l) in children and adolescents (13). Uric acid (UA) is the final catabolic product of human exogenous and endogenous purine nucleotide metabolism (14). In most mammals, UA produced by metabolism can be degraded by uricase into 5-hydroxyisoourate and allantoin to be eliminated from the body (15). However, humans and great apes who lack uricase because of its mutation or inactivation during evolution, have higher circulating urate concentrations (16). Hyperuricemia can result from excessive purine intake, purine metabolism in the body, or mainly by renal and intestinal underexcretion (17), which is an important step in the development of gout. However, only about 36% of patients with hyperuricemia will eventually develop into patients with gout, whereas most remain in a state of asymptomatic hyperuricemia (18, 19). Therefore, hyperuricemia is generally considered asymptomatic in the absence of inflammatory episodes (gout flares) caused by monosodium urate (MSU) crystals.
Asymptomatic hyperuricemia is highly prevalent worldwide, ranging from 2.6 to 36% in different populations, and it has been increasing for decades (4, 20). Epidemiological and experimental data obtained over the past few decades show solid correlations between asymptomatic hyperuricemia and hypertension (HTN), renal disease, cardiovascular events, type 2 diabetes (T2DM), and other metabolic diseases. A meta-analysis of 55,607 patients found a dose-dependent relationship between serum urate and HTN; for every 1 mg/dl increase in SUA, the relative risk of HTN increased 1.13 times (21). The meta-analysis of Li et al. that reviewed 190,718 participants in 13 observational cohort studies inferred that elevated serum uric acid levels are associated with the onset of chronic kidney disease [OR = 2.35 (1.59–3.46)] (22). Krishnan et al. conducted a follow-up study of 5,012 diabetes-free participants aged 18–30 years for 15 years and reported that asymptomatic hyperuricemia is an independent risk factor for T2DM and insulin resistance [HR = 1.87 (1.33–2.62) and 1.36 (1.23–1.51), respectively] (23). Two large-scale meta-analyses that explored the correlation between the incidence of T2DM and serum urate also found similar results, suggesting that for every 1 mg/dl increase in serum urate, the combined relative risk of T2DM increases by 6–11% (24, 25). Another meta-analysis includes six studies of 5,686 patients with acute myocardial infarction showed that patients with hyperuricemia are more likely to have major adverse cardiac events [RR = 3.44 (2.33–5.08)] and in-hospital mortality [RR = 2.10 (1.03–4.26)] (26). Cell culture and animal studies further prove that hyperuricemia may be related to renal failure, hypertension, and metabolic syndrome (15, 27). Therefore, the researchers then conducted Mendelian randomized studies to confirm the causal association; however, the inconsistent results led to the causal link among hyperuricemia and kidney disease, hypertension, diabetes, or other metabolic diseases remains controversial (28–30). Indeed, the time interval from the onset of hyperuricemia to that of cardiovascular and renal comorbidities is long, making it unclear whether hyperuricemia is a risk marker for non-gout diseases or independent causal factors. In addition, although hyperuricemia is earlier than comorbidities, reverse causality cannot be ruled out. Moreover, the population with heterogeneous and environmental factors are not considered in the Mendelian randomization study. Also, there is a lack of understanding of the potential impact of genetic polymorphisms on the urate-related biological mechanisms.
The causality between hyperuricemia and comorbidities such as kidney disease, cardiovascular events, and diabetes is still not entirely resolved. However, given the rising prevalence of asymptomatic hyperuricemia, as well as metabolic and renal diseases, it is vital to explore the pathogenesis of hyperuricemia, especially the risk factors that can be manipulated.
Gout flare is the most significant and unique manifestation of gout, leading to the extreme pain of synovitis in the joints and surrounding areas, soft tissues and other organs bounded by monosodium urate (MSU) crystal deposits (31). Theoretically, once the SUA level reaches the solubility threshold, it can precipitate as needle-like crystals and cause inflammation. In fact, even in hyperuricemia patients whose SUA concertation is higher than 10 mg/dL, only 50% of them had a gout flare over 15 years (32). Therefore, it is suggested that hyperuricemia is necessary but insufficient to induce gout, and additional molecular/gene factors can affect the formation of MSU. Approximately 25% of patients with hyperuricemia have MSU, and it often occurs in the first metatarsophalangeal joint (19).
MSU crystals are a potential trigger for inflammation, but the mechanism of how MSU crystals induce inflammatory response has not been fully elucidated. Activation of PYD domains-containing protein 3 (NLRP3) inflammasomes in macrophages and monocytes by MSU is recognized as central to the initiation of the gout flare (33). NLRP3 inflammasome is a cytoplasmic protein complex involved in the maturation and expression of pro-inflammatory cytokines such as IL-1β, IL-33, and IL-18 (34). In the last decade, trials of inflammation-modifying treatments, such as IL-1β inhibition, have been tested as a treatment for gout with successful outcomes (35). The activation of NLRP3 inflammasome has been described as a dual-signal initiation process. The first signal stimulates NF-κB through TLR4 and TLR2 and synthesizes pro-IL-1β and inflammasome components (36). The second activation signal is more specific and is mediated by MSU crystal, causing the assembly of inflammasomes. The oligomerization of NLRP3 inflammasomes leads to the activation of Caspase-1, which proteolyzes pro-IL-1β into biologically active IL-1β. Then, IL-1β interacts with IL-1β receptors, triggering a downstream signal cascade including pro-inflammatory cytokines and chemokines, causing the recruitment of neutrophils and other cells to the site of crystal deposition (37).
Acute gout attacks, especially in the early stages of the disease, are self-limiting by nature (38). Current research shows that there are multiple mechanisms involved in the spontaneous resolution of acute gout, including protective protein-encapsulated crystals, and changes in the expression balance of pro-inflammatory and anti-inflammatory factors when the cell population in the inflammatory joint changes (39). After years of acute intermittent gout, advanced gout characterized by tophi, chronic gouty synovitis, and structural damage in joints usually occurs. The cytokines, chemokines, proteases and oxidants involved in acute inflammation induced by UA can cause chronic inflammation, leading to chronic synovitis, cartilage loss and bone erosion (40).
In addition to the excruciating arthritic pain and premature death, gout is associated with a high frequency of comorbidities, such as insulin resistance syndrome, hypertension, obesity, nephropathy, and cardiovascular disorders. The prevalence of comorbidities with increasing duration of gout is associated with all components of metabolic syndrome (41). Prospective studies have consistently shown that patients with hypertension have an increased risk of gout (42–44). According to the third NHANES (spelt out its whole names), abdominal obesity and T2D prevalence were found higher in gout patients (respectively 62.9 and 33.1%) than that in non-gout patients (respectively 35.3 and 10.8%) (45). Moreover, in prospective studies, gout also increases the risk of T2D, and diabetes reduces the risk of gout (46, 47), which can be partly explained by the increased excretion of urate in urine of diabetic patients (48). In addition, the prevalence of CKD in stage 3 or above in gout patients is estimated to be 24% and (49) gout prevalence was found to increase from 16.0 to 35.6% for CKD patients (50). Moreover, various heart diseases are independently associated with gout, which lead to increased frequency of cardiovascular deaths (51, 52).
Therefore, comorbidities of gout must be given special attention for the disease because they may contribute to the critical prognosis of gout patients and complicate the management of gout. Furthermore, deep understanding of the underlying molecular mechanism of gout flare is incredibly crucial.
Increasing our understanding of the correlation between fructose intake and hyperuricemia is important because fructose consumption has risen dramatically in the last 40 years and constitutes a large proportion of the daily caloric intake in the modern diet (7). The total fructose consumption rate in the US increased by 33% from 1978 to 2004, and the most significant increase was among people aged 19–22 years old with a mean increase in added fructose intake of 33 and 30 g/d, respectively (53). The overall estimated mean total fructose comprising energy intake also increased, from 8.1% in 1978 to 9.1% in 2004 (53). The consumption of added sugars (half of which is likely fructose) gradually decreased after that but remained at 17% of total energy intake, which is still far above the recommended upper limit of 10% (54). In the non-US populations, fructose consumption also showed a similar trend. In 1968–2007, sugar consumption rose gradually from 56 to 65 g/d, and the most impressive rise was in Asia from 30 to 45 g/d with a 50% increase (55). In recent years, the intake of added sugars has also declined or stabilized, but the amounts consumed still represents 10%-13% of total calorie intake (56). Moreover, intake of added sugars (up to 19% of total energy) of school-age children and adolescents was higher than that of younger children or adults (56).
Interestingly, the prevalence of gout and hyperuricemia have been found a similar trend during the overlapping period. In the US, the prevalence of gout and hyperuricemia was more than doubled between the 1960s and the 1990s, and then continued to increase steadily, at least until 2007–2008, and began to stabilize for the next 10 years (4). Studies in other countries over a similar period have shown a steady increase in the prevalence of gout and hyperuricemia. According to the nationally representative New Zealand Health Survey, the overall prevalence of gout among those aged 15 years or older nearly doubled from 1.6% in 2011–2012 to 2.9% in 2015–2016 (4). Using administrative health declarations, another study in the Canadian population found that the prevalence of gout in the overall population rose from 2.4% in 2000 to 3.8% in 2012 (57). In addition, a study based on the general practice population in the UK also found an increase from 2.03% in 2007 to 2.49% in 2012 (5). In line with the data from the western countries, a systematic review showed that the prevalence of gout in China from 2000 to 2014 has risen to 1.1% (3).
It's not surprising to found that a large number of epidemiological studies and interventive experiments have focused on exploring the association between fructose intake and gout or hyperuricemia; however, inconsistent results were obtained. Due to the lack of an effective calculation method used to determine total fructose intake, most epidemiological articles on the association between dietary fructose and gout mainly focus on fructose-containing foods and gout. As we all know, food sources containing fructose sugar include non-alcoholic beverages (SSBs), fruits and fruit products, dairy products, cereals and cereal products, as well as candies, chocolates, and desserts (58). Since 1970, high fructose corn syrup (HFCS) has become the most popular sucrose substitute in most soft drinks and fruit drinks, baked goods, canned fruits, jams and jellies, and dairy products due to its low price and higher sweetness (59). As a result, soft drink consumption has increased dramatically. For instance, from 1977 to 1997, American adults' consumption of soft drinks increased by 61%, and sweetened soft drinks became the largest single food source in the American diet (60). Naturally, the association between SSBs and gout or hyperuricemia has received the greatest attention and has been most studied. Two large prospective studies containing a total of 125,299 participants over an average of 17 years of follow-up have identified a significant association between SSB consumption and increased risk of gout [RR = 1.62 (1.28, 2.03)] (61, 62). Another systematic review and meta-analysis (58) assessed essential food sources of fructose-containing sugars with incident gout. The results have documented that there was moderate certainty of evidence that SSB intake was associated with a 208% increase in gout incident; fruit juice has a relatively low rate of gout, which is related to a 77% increase in gout; and that fruit intake was not associated with gout incident (58).
Through a 10-year follow-up observation of the cohort from 2008 to 2018, the actual age of onset of gout in China was 4.14 years younger, and sugar-sweetened soft drinks was found as an independent predictor of early-onset gout (63). Additionally, many studies have shown that high fructose or fructose-containing food intake is linked to increases in SUA concentration, which leading to the development of gout. According to the NHANES 2001-02 database, Gao et al. found that men's intake of more added sugar or sugar-sweetened beverages was associated with higher plasma uric acid concentration, while women did not; Intake of fruit juice, which contains a lot of naturally occurring sugars, however, was not related to plasma uric acid (64). Besides, two meta-analyses have also disclosed that SSB intake was associated with raised SUA (65, 66). In contrast, using data of added sugar disappearance and naturally-occurring sugar contents to assign conversion factors to food groups to determine individual fructose intake, NHANES 1999-2004 survey failed to disclosed the relationship between dietary fructose intake and a higher risk of hyperuricemia (67). To some extent, several reasons may appear to account for these inconsistences. Firstly, fruits are demonstrated not to increase the risk for gout or hyperuricemia (9). The nutrients present in the fruits such as vitamin C, epicatechin, flavonols, potassium and fiber can change the effects of fructose and uric acid. Furthermore, people who consume a lot of fruits usually reduce their intake of refined sugar, so total fructose intake may be low. Secondly, the amount of fructose contained in the fruits and vegetables was not separately analyzed in the NHANES 1999–2004 survey. Lastly, the calculation method used to determine total fructose intake in the survey is somehow lack of accuracy because the data for naturally-occurring sucrose contents for most foods are not available.
Besides, a series of intervention trials exploring the relationship between fructose administration and serum uric acid concentration produced inconsistence results. MacDonald et al. noticed that within 90 min after 9 healthy young men drank a pure fructose beverage (1 g/kg body weight), the serum uric acid concentration increased by about 10% (68). Consistently, Emmerson demonstrated that in three healthy men, after ingesting 250–290 g/d fructose, the serum uric acid concentration was 8–41% higher than that of glucose (69). Likewise, another two fructose infusion studies (0.5 g/kg BW, in 8 healthy young men and 4 gout patients) also observed elevated SUA levels (70). However, other studies failed to repeat these results. For example, in the Turku Sugar Study in Finland, 35 healthy subjects ingested added fructose at a level of 2.1 kg/month (about 70 g/d) for 22 consecutive months, and there was no significant increase in serum uric acid concentration or uric acid excretion (71). Other studies also reported that long-term (1–6 months) intake of added fructose (11–18% of daily calories) has no effect on the serum uric acid concentration of diabetic patients (72–76).
Along the same line, Crapo et al. (77). observed that in 11 normal participants, 24% of daily calories given to fructose for 2 weeks did not increase SUA concentration and urine excretion. Narins and his colleagues reported that adding fructose at a fructose intake of 100 g/day for 5 days did not lead to an increase in serum uric acid concentration in healthy adults (70). In addition, Turner et al. have found that there was no increase in serum uric acid after drinking beverages containing 90–154 g of fructose in 6 patients with high triglycerides (78). Similarly, Curreri's study showed that in 20 young men, 100 g of fructose infusion did not cause an increase in SUA (79). For the inconsistent results observed in the intervention trial, one possible explanation may be the difference between the subjects and the study protocol. Another important point is that comparison with co-intake of other carbohydrates (such as glucose), and with the intake of fructose alone may have very different absorption, metabolism and physiological effects. For example, Riby et al. documented the synergistic effect of glucose for fructose malabsorption (80). In the daily diet, fructose is rarely taken alone. In this study, dietary fructose intake is found to be related to other sugars, and the Pearson and Spearman correlation coefficient between fructose intake and total sugar intake is 0.94 (P < 0.001). In summary, despite the inconsistent results in the literatures, most studies have shown that high fructose intake can lead to hyperuricemia. Therefore, the mechanism of the influence of fructose intake on SUA concentration and the occurrence of hyperuricemia deserves more attention.
The essence of hyperuricemia is the result of the imbalance between UA production and excretion. Interestingly, fructose is the only common ingested carbohydrate that produces uric acid during metabolism (81). Fructose is a kind of hexose, and its chemical formula C6H12O6 is the same as glucose. It differs from glucose in that it has a ketone group at position 2 of the carbon chain, while there is an aldehyde group at position 1 of the glucose carbon chain. In solution, it can exist in the form of α or β pyranoside and furanoside rings. The content of fructose and glucose in ordinary sucrose is generally in a 1:1 ratio. High fructose corn syrup also contains a mixture of fructose and glucose. The outcomes of systemic fructose homeostasis are mainly 2-folds: intestinal absorption and clearance, the latter of which is generally considered to be mainly mediated by the liver (~55–71%) and the kidney (<20%) (82).
Figure 1 has depicted the details of fructose metabolism in the body. Once the body directly ingests pure fructose or HFCS, or fructose is produced from the digestion of sucrose on the brush border membrane, it will be transported from the lumen to the enterocyte via a specific fructose transporter GLUT5, which is located at the apical pole of the enterocyte. Subsequently, fructose is firstly absorbed and metabolized by the small intestine in an insulin-independent manner (83). In the first step, fructose is rapidly phosphorylated under the action of fructokinase [also known as ketohexokinase (KHK)] to form fructose-1-phosphate. This process requires ATP to provide a molecule of phosphate to be converted into ADP. In the second step, fructose-1-phosphate is decomposed by aldolase B into glyceraldehyde and dihydroxyacetone phosphate. In the final step, trikinase catalyzes the phosphorylation of glyceraldehyde by ATP to form glyceraldehyde- 3-phosphate (83). In this process, the rapid phosphorylation of fructose into fructose 1-phosphate reduces the intracellular levels of ATP, GTP and phosphate, leading to the accumulation of AMP (84). The decrease of intracellular GTP and phosphate activates AMP deaminase, and the accumulation of fructose 1-phosphate has did the same effect. AMP generates IMP under the action of AMP deaminase. IMP levels rise, and it is metabolized along with GMP to generate uric acid (85). In turn, uric acid inhibits AMP-activated protein kinase, thereby promoting more AMP metabolism by AMP deaminase. Influencing aldose reductase and increasing the expression and activity of fructokinase at the same time can stimulate fructose production further (86–88). In addition, the accumulation of IMP, GDP and GMP inhibits aldolase B, further enhances fructokinase activity and stimulates ATP conversion (84). As uric acid accumulates, xanthine oxidase is inhibited, but it may be at the cost of continuous activation upstream of the AMP deaminase pathway (89).
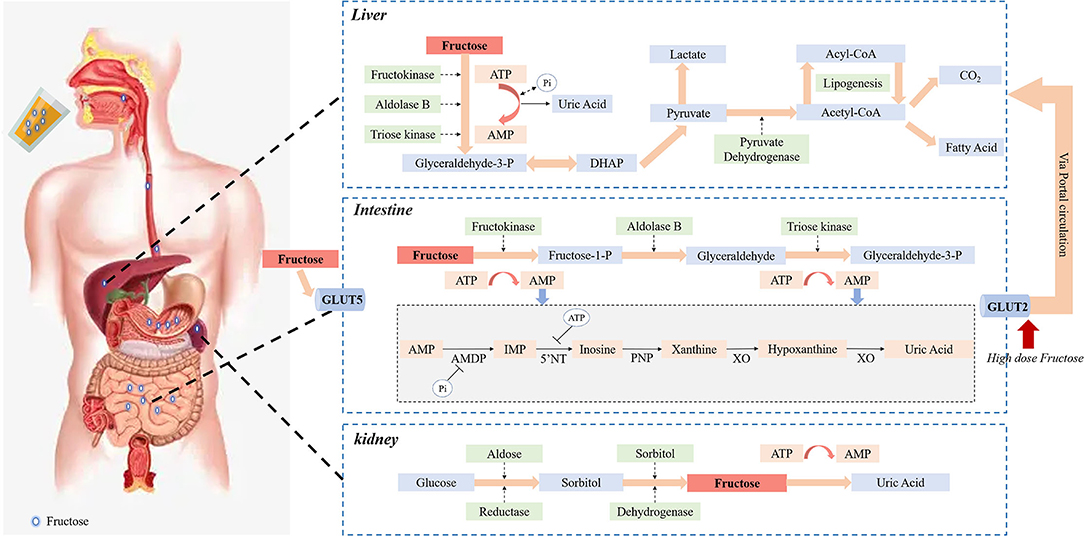
Figure 1. Fructose metabolism in the body. The fructose ingested by the body will be first transported to the enterocyte via GLUT5, and then absorbed and metabolized in an insulin-independent manner. Through all the processes of metabolism in the small intestine, uric acid is produced. The rapid phosphorylation of fructose into fructose 1-phosphate requires ATP to provide a phosphate molecule, which reduces intracellular levels of ATP, GTP, and phosphate, leading to the accumulation of AMP and activation of AMP deaminase. AMP generates IMP under the action of AMP deaminase. IMP levels are elevated, which is metabolized with GMP to produce uric acid. Uric acid, in turn, inhibits AMP-activated protein kinases, which promotes more AMP metabolism through AMP deaminase, resulting in more uric acid production. The extent to which fructose enters the liver through the small intestine depends on the amount of fructose ingested. Fructose metabolism appears to be a saturation process in the intestinal, with only high doses of dietary fructose spreading to the portal circulation through the transporter GLUT2 and further extracted by the liver. Fructose and eventual metabolism in the liver produce pyruvate and acetyl-CoA, leading to adipogenesis, and the metabolic processes accompanied by rapid depletion of intracellular ATP and Pi and the production of corresponding uric acid. Renal proximal straight tubule expression of fructokinase and aldolase B is the main site of fructose metabolism under physiological conditions, continuous intake of large amounts of fructose leads to renal metabolism exceeding the threshold, resulting in a large amount of ATP depletion and inflammatory response, and finally a large amount of uric acid production and tubular damage. In addition, endogenous fructose obtained by the polyol pathway in the kidneys may be another potential mechanism for causing kidney damage and uric acid production.
After fructose absorption and clearance, the remaining fructose inside the enterocyte diffuses into the portal circulation via a transport GLUT2 located at the basolateral pole of the enterocyte (90) and is further extracted by the liver rapidly and efficiently. Considering that the liver presents a high level of fructose catabolism enzymes (like KHK) expression and the sensitivity to fructose, it has generally been assumed to be the leading site of fructose metabolism (91). However, this notion has recently been challenged. Researchers (92, 93) have discovered that the small intestine shields the liver from fructose exposure. Most of the fructose intake is metabolized through the small intestine of mice. Using isotope tracers and mass spectrometry in mice, it was surprising that most dietary fructose has been converted into glucose and various organic acids in the portal vein, which connects the small intestine to the liver (93). The extent to which unmetabolized fructose enters the liver through the small intestine depends on the absorption and clearance rate of fructose in the small intestine. When ingesting low-dose fructose (< 0.5 g kg−1), about 90% of fructose phosphorylation occurs in the jejunum, duodenum, or ileum. In contrast, intake of high doses of fructose (≥1 g kg-1) will saturate the absorption and catabolism of fructose in the small intestine, causing fructose to overflow into the liver (>30%) (92, 93). Namely, intestinal fructose metabolism seems to be a saturated process, allowing only high doses of dietary fructose to enter the liver. Most of the entered fructose is rapidly phosphorylated in the liver, and under the action of three key enzymes, glyceraldehyde 3-phosphate, an intermediate product of the glycolysis pathway, is generated (92). After that, the metabolic pathways of fructose and glucose in the liver are qualitatively similar and finally metabolized to produce pyruvate and acetyl-CoA, leading to lipogenesis (82). Another consequence of the fructolysis is the rapid depletion of intracellular ATP and Pi and the production of corresponding uric acid.
Another important organ for fructose metabolism is the kidney. The proximal straight tubule is the main site of fructose metabolism under physiological conditions. There, the glucose transporter 5 expressed at the top of the cell membrane mediates the absorption of fructose in the urine, which is then metabolized by fructose kinase in the cytoplasm. However, fructose metabolism is not limited to the proximal straight tubules; the proximal curved tubules have also been recorded. In fact, the proximal tubules express fructokinase and aldolase B, the latter being easily induced (94). On the contrary, continuous intake of a large amount of fructose may cause the physiological mechanism of the kidney to metabolize fructose to exceed the threshold. As a result, a large amount of ATP consumption and inflammatory reactions occur, and ultimately lead to a large amount of uric acid production and renal tubular damage (95). In addition to exogenous fructose, fructose can be synthesized from glucose through the polyol pathway. Glucose is converted to fructose in two steps in the polyol pathway. Firstly, aldose reductase regulates the conversion of glucose to sorbitol. Subsequently, sorbitol dehydrogenase catalyzes the oxidation of sorbitol to fructose. The endogenous fructose obtained via the polyol pathway in the kidney may be a potential mechanism for causing kidney damage (96). In mice with acute ischemic kidney injury, an increase in the concentration of aldose reductase, sorbitol, and endogenous fructose was found in the renal cortex, indicating that the polyol pathway was significantly activated. Moreover, polyol pathway restriction can limit acute ischemic kidney injury and promote recovery after kidney injury (97).
Based on the metabolism of fructose, it is can be concluded that fructose intake could induce UA synthesis through increasing of ATP decomposition as a precursor of UA, and increased insulin level following fructose intake has also been shown to raise of urate reuptake and reduce the excretion of UA in kidney. More specifically, fructose is rapidly phosphorylated upon intake, which is thought to lead to ATP depletion and the subsequent AMP accumulation (98). And the lack of free phosphate leads to AMP convert to IMP, thus resulting in the production of UA and the amelioration of UA levels in the serum (98). High fructose levels and associated decrease in ATP in the body will increase the compensatory effect of purine nucleotide synthesis, which subsequently results in further overproduction of UA in the presence of additional fructose (99). In addition, high fructose levels induce hyperinsulinemia and insulin resistance, which may lead to further elevated circulating UA levels via reducing UA excretion (96).
Given that ~30% of UA was excreted by the gastrointestinal (GI) tract, it is not surprising that gout or hyperuricemia-related studies have focused on the analysis of gut microbiota in recent years. The GI tract provides one of the largest interfaces (250–400 m2) among the host, environmental factors, and antigens in the human body (100). Over 1014 microorganisms have been inhabiting the GI tract, which offers many benefits to the host through a series of physiological functions. However, there is potential for these mechanisms to be destroyed as a result of an altered microbial composition, known as dysbiosis or dysregulation, which are associated with a variety of diseases (101–103). As for hyperuricemia, the gut microbiota is known to be involved in the metabolism of purines and uric acid. For example, the key enzyme in the oxidative metabolism of purines, xanthine dehydrogenase, was proved to be secreted by the Escherichia coli group of human intestinal bacteria (104–106). Proteus bacteria can secrete xanthine dehydrogenase to convert purines into UA (104). Lactobacillus can reduce the absorption of purines in the intestine, prevent the increase levels of serum UA and further induce hyperuricemia (107). Common members of the human gut microbiota, Lactobacillus and Pseudomonas, are found to be active in the synthesis of key enzymes (such as uricase) in the catabolism of UA (108). Moreover, the study also found that various indigenous microorganisms in the human gut secrete uric acid transporters, thereby affecting the excretion of UA (109). Therefore, intestinal microbiota can potentially affect the production and excretion of UA, thereby participating in the pathogenesis of hyperuricemia or gout.
Indeed, recent sequencing studies have shown special changes in microbial gene richness and diversity in gout subjects when compared to healthy controls (110). The abundance of Bacteroides caccae and B. xylanisolvens was significantly enriched in gout subjects, while those of Faecalibacterium prausnitzii and Bifidobacterium pseudocatenulatum was reduced (110). Further metagenomes study also found that the abundances of Prevotella, Fusobacterium, and Bacteroides were increased in gout patients, whereasthat of Enterobacteriaceae and butyrate-producing species were decreased (111). Also, imbalanced intestinal flora was observed in the rat model of nephropathy induced by hyperuricemia using the 16S rRNA technology (112). Flavobacterium, Myroides, Corynebacterium, Alcaligenaceae, Oligella and other conditional pathogens increased greatly in the rat model group, whereas Blautia and Roseburia, and the SCFAs producing bacteria diminished significantly (112).
Diet is one of the well-known significant factors that impact the composition of gut microbiota. A high-fiber diet appears to be involved in the increased abundance of Rominococcus bromii (113) and depletion of Frimicutes /Bacteroidetes (F/B) ratio (114), leading to the high production of SCFAs and butyrate in the host (113, 114). Diet supplemented with high-fat in mice indicated an association with the enrichment in F/B ratio, Ruminococcus and Rickenellaceae, as well as thedepletion in Lactobacillus, Bifidobacterium, and Prevotella (115, 116). In addition, artificial sweeteners were demonstrated to have deleterious effects on the composition of the gut microbiota, resulting in the rise in Fecal Bifidobacteria, Lactobacilli, propionate and reduction in Bifidobacteria, Lactobacilli, and Bacteroides (117, 118). Diet supplemented with a high-fructose syrup (HFS) compared to a fruit-rich diet can induce significant differences in the composition of the microbiota, resulting in a lower abundance of Firmicutes and Ruminococcus and a higher Bacteroidetes abundance (119).
Collectively, these research results made us comes up with a new question, that is, how does diet affect the interaction between the human body and its gut microbiota? Unfortunately, there is a lack of evidence to investigate the impact of fructose-rich diets on gut microbiota and the subsequent effects of high-fructose diet-induced effects on gout/hyperuricemia. An animal study in Rats with intragastrical administration of a high-dose fructose to increase uric acid resulted in an increased abundance of Lachnospira, Parasutterella, Marvinbryantia, and Blantia (120). However, a cross-over intervention study of 26 healthy adults who consumed either orange juice (OJ) or caffeine-free cola in -between 3 meals per day within 2 weeks, have found that beverage did not induce microbial changes and the uric acid level was decreased in the OJ group (121). The result makes sense since the complex nutrients which may have a positive effect on gut microbiota and stimulate UA excretion do exist in the OJ. Therefore, further studies with large-sample and other experimental conditions (e.g., different sources and forms of fructose, various doses and durations) might be needed.
How does fructose-mediated microbiota population shift affect the onset of gout/ hyperuricemia? To elucidate this doubt, the prerequisite is to understand the host-gut microbiota metabolic interactions (100). The composition and activity of the gut microbiota are subject to complex interactions that depend on the host's genome, nutrition, and lifestyle. On the other hand, the metabolism and homeostasis of the resident microbiota are closely related to the health of the host.
Recent studies found that high-dose fructose intake with the capability of inducing the overproduction of plasm inflammatory cytokines, such as IL-6, TNF-α, MIP-2, and IL-1β, decreased the level of anti-inflammatory marker IL-10 in rats (120, 122). Furthermore, excessive fructose intake alters the composition of the intestinal microbiota and impairs intestinal barrier function via reduction expression of TJ proteins, thereby triggering the inflammatory process (123, 124). As a complex, multi-gene inherited auto-inflammatory disorder, innate inflammatory pathways deservedly played a crucial role in the pathogenesis of gout (125). IL-1β is considered to be the core of gout inflammation. By stimulating pro-inflammatory cytokines and chemokines and up-regulating adhesion molecules on endothelial cells, inflammatory cells (like neutrophils and monocytes) are recruited to the MSU crystal deposition site, ensuing a positive feedback loop of inflammation, leading to ongoing inflammation (126). MSU crystals can stimulate the recruited monocytes to produce TNF-α (127). TNF-α facilitates the activation of caspase-1 by ATP via its receptors TNFR1 and TNFR2, leading to the activation of the NLRP3 inflammasome, which leads to the severity of gout. In addition, TNF-α can also promote the synthesis of pro-IL-1β mRNA, thereby promoting the production of IL-1β (128, 129).
Interestingly, these inflammatory reactions, which play a key role in the pathogenesis of gout, are also important factors for shaping and maintaining the homeostasis of intestinal flora. For instance, NLRP3 knockout mice exhibit both quantity and composition alterations in the microbiota, including a significant decrease in the F/B ratio (130) and only detected members of the genera Mycobacterium and Collinsella (131). In addition, the trafficking of immune cells following the increased release of inflammatory factors has been widely confirmed to synergistically promote the disruption of the intestinal mucosal barrier, thereby affecting the homeostasis of the intestinal flora (132). In turn, inflammatory reactions are influenced by gut microbiota and its products. The absence of microbiota is correlated with decreased production of SCFAs, especially acetate, which is necessary for inflammasome assembly and IL-1β production, and it is dependent on the activation of GPR43 (133), whose signal transduction can regulate the production of ROS (134) following activation of the NLRP3 inflammasome (135). Another interesting study found that gut dysbacteriosis can increase intestinal permeability and promote the translocation of bacteria or bacterial products, such as lipopolysaccharide [LPS (136)]. High levels of serum LPS can induce chronic inflammation and increase the risk of hyperuricemia (137). The high levels of LPS sustained in gout are positively related to the abundance of Gram-negative bacteria in the intestine, especially Proteobacteria (138). In addition, LPS is also a metabolite of the intestinal microbiota. Abnormal levels of LPS in blood circulation are usually accompanied by an increase in XO activity, which is an important enzyme in purine oxidation metabolism Furthermore, a recent study has stated that there were consistent associations between gut bacteria and immune cell dynamics, especially in the taxa of Faecalibacterium, Ruminococcus 2, and Akkermansia (139).
Additionally, the homeostasis of intestinal microbes will lead to changes in the metabolome, which are mainly manifested as the up-regulation of glucose, acetate, succinate and some amino acids, and the down-regulation of α- ketoisocaproate, phenylalanine, valine and citrulline (140). These metabolites are shown to be related to UA excretion, purine metabolism and inflammation. For example, acetate, succinate and glucose, materials that are involved in energy metabolism, can provide energy for intestinal epithelial cells, promote UA excretion and thereby relieve hyperuricemia (141). Glycine and aspartate are associated with the biosynthesis of purine nucleosides, and their abnormal expression leads to disorders of purine metabolism in patients with gout, thereby promoting the risk of disease (142). Besides, researches have shown that indigenous microbes in the human gut can secret key transporters to mediate UA absorption (109, 143–145). These transporters include ABCG2, SLC2A9, SLC16A9, SLC17A4, SLC17A1, SLC17A3, SLC22A11, SLC22A12, and SLC16A9, which in turn affect the absorption and metabolism of fructose. When the absorption of fructose in the intestine changes, the concentration of fructose in the lumen will also change, thereby affecting the ecology of intestinal microbes (90).
Moreover, the concept of oxygen metabolism and oxygen barrier in shaping the composition of the gut microbiota has recently been proposed (146). High fructose intake will increase the permeability of intestinal epithelial cells (147), resulting in increased oxygen levels in the lumen and following the destroy of living environment of epithelial anaerobes, which can further be facultative anaerobes or potential Aerobic bacteria provide the advantage of ecological selection, making them more competitive when expanding (148). For example, pathogenic bacteria such as Salmonella undergo aerobic proliferation under the destruction of anaerobic bacteria (147). These pieces of evidence support that oxygen levels can act as a shaper of the host's regulation of the gut microbiota. Overall, while understanding of the relationship among the microbiome, fructose, and gout or hyperuricemia has increased, more data are necessary to draw more concise and causal conclusions.
The central strategy for effective, long-term management for gout or hyperuricemia is continuous urate-lowering therapy (ULT) to decrease the SUA level (12). However, the low efficacy of or poor adherence to ULT has already placed a long-term disease burden on society (149). Evidence from a systematic review (150) that accumulated 18 observational studies from 1974 to 2016 showed that the non-adherence rate is as high as 21.5–82.6% and the non-persistence rate (with a pause of at least 30 days during treatment) even reaches 54–87%. Thus, seeking safe, effective, and side-effect-free ways to prevent or treat HUA is of great significance in the management of gout or hyperuricemia.
Recently, the use of probiotics and prebiotics as alternative methods to treat hyperuricemia or gout without causing adverse side effects is being evaluated (Table 1). Probiotics are substances that are composed of yeast or live bacteria and have multiple health effects. They are considered potential natural treatments due to their beneficial effects in regulating the intestinal microbiota (158). Some evidence suggests that probiotic supplements can significantly prevent the accumulation of UA (159–161). Indeed, a diet rich in probiotics was shown to maintain the balance of the intestinal flora caused by HUA, increase the abundance of bifidobacteria and lactobacilli, and reduce serum levels of UA and LPS and XO activity (162). Moreover, some prebiotics that can exert an anti-HUA effect via the alteration of gut microbiota have been studied. For example, the reduction of Bacteroides and Bifidobacteria found in the HUA rat model can be subsequently restored by supplementing with tuna oligopeptides (TMOP). Furthermore, after transplanting the fecal microbiota of TMOP-treated mice, the phenotypes of hyperuricemia and renal inflammation were attenuated, indicating that the beneficial effects of TMOP on HUA are at least partially mediated by intestinal microbes (163). In addition, prebiotics can also reduce chronic inflammation in the host by regulating the intestinal microbiota, thereby alleviating hyperuricemia. For instance, sunflower head enzyme hydrolysate (SHEH) can alleviate HUA by promoting the recovery of the disturbance of intestinal flora composition and reducing the level of circulatory system LPS (164). Dendrobium officinale leaf extract can inhibit UA through the intestinal microbiota-LPS-TLRs/NF-κB axis to effectively treat HUA (165). Similarly, a growing body of studies from China has shown that many herbs and phytochemicals such as six kinds of dendrobium officinale, stevia residue extract, chicory, mangiferin and tigogenin, can play a prebiotic role in the prevention and treatment of HUA (166–170).
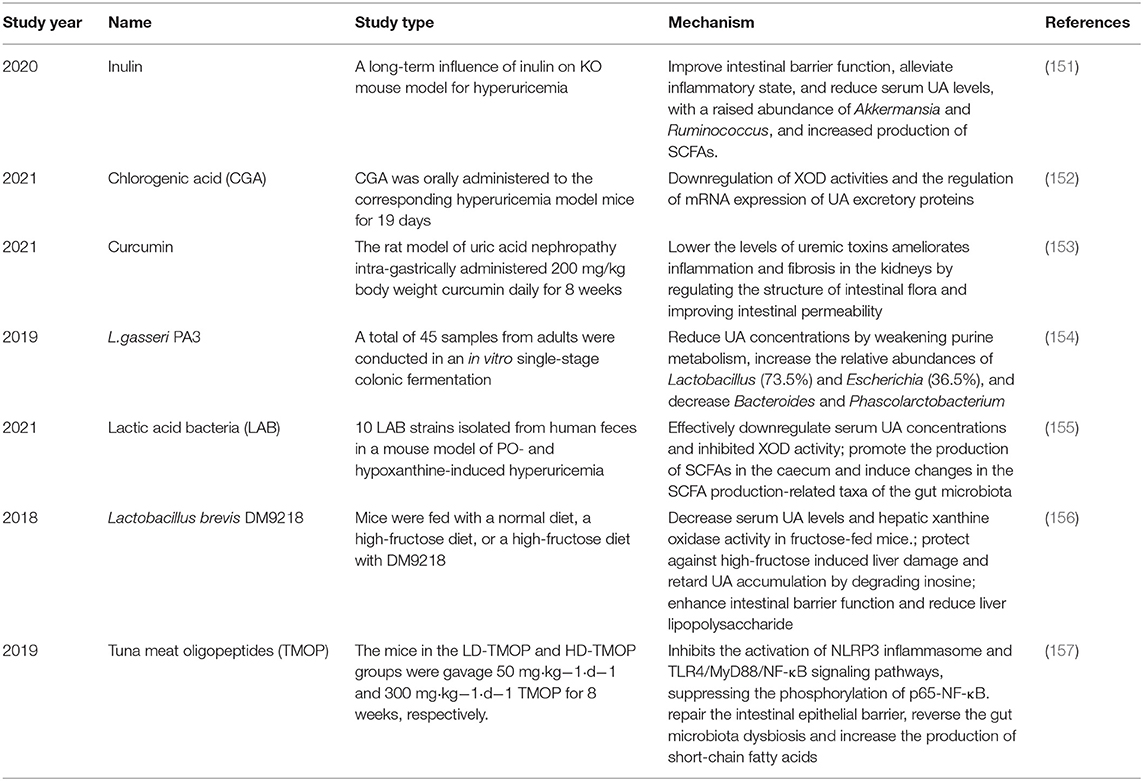
Table 1. Probiotics and prebiotics in management of hyperuricemia and gout.
Furthermore, a few studies (171, 172) recently have evaluated the effect of urate-lowering therapy with the synbiotic addition on the treatment of patients with gout. An addition of a synbiotic was demonstrated to have a more pronounced urate-lowering effect and was combined with a decrease in the level of CRP, IL-1β, IL-6, IL-8, IL-10, and TNFα (171, 172). Collectively, prebiotics and probiotics can maintain the balance of intestinal microbiota composition, inhibit XO activity and UA reabsorption, promote UA excretion, regulate intestinal epithelial cell proliferation, and relieve chronic inflammation to achieve the prevention and treatment of hyperuricemia and gout. However, we should notice the difference in UA metabolism between humans and experimental animals, such as rats; thus, additional clinical trials with large samples are needed to elucidate the potential of the probiotics in the prevention and treatment of patients with gout.
Besides, patients often have questions about dietary management of gout or hyperuricemia. Due to UA being a byproduct of fructose metabolism, fructose intake has gained increased attention in gout or hyperuricemia management. Fructose is the main component of sucrose and an important sweetener used in food production. It is found in many foods, including soft drinks, ketchup, barbecue (BBQ) sauce, fruits, etc.
Among them, the impact of SSBs on gout or hyperuricemia has received the greatest attention, and it is can be concluded that there was moderate certainty of evidence that SSBs have a deleterious effect on gout or hyperuricemia (65, 66).
Over 100 years ago, diets low in fructose as a mean to prevent gout has already been prescribed, and that sweeter fruit should not be taken was being suggested (173). However, natural fruit currently is considered to be healthy food, and the data with natural fruit effect on gout are mixed. To date, a number of studies have explored the relationship between fruit consumption and hyperuricemia. For instance, Tanya et al. explored the association between individual dietary components and the SUA level using a meta-analysis and indicated that cheese and non-citrus fruit intake were associated with lower SUA levels (66). Although a series of studies have reported a protective effect of fruit intake on gout (66, 174–177), one problem that cannot be ignored is that people who eat a lot of fruit usually eat a healthier diet with lower refined sugar content. Indeed, a prospective study (61) conducted in 2008 on 46,393 people without a history of gout showed that the multivariate relative risk of gout attacks for a daily serving of orange or apple for a month was significantly higher than the risk of less than one serving. And a meta-analysis that systematically explored the relation between fruit and incident gout and hyperuricemia, found that fruit intake was not associated with gout incident (58).
To explain the result of the paradox and to obtain a piece of advice on whether to eat fruit, several reasons should be considered. Firstly, the study design has affected the results. The measurement of the total fruit intake is obtained through retrospective questionnaire surveys or interviews in the above studies, resulting in an insufficient accuracy of the measurement. Secondly, the inconsistency of research in different countries may be related to latitude and longitude. The climate is a well-known factor to affects the sugar content of fruits. For example, as the fruit matures, the vitamin C content decreases and the sugar content increases (178). Thirdly, the effect of fruit on hyperuricemia may be far more complicated than we thought. Vitamin C has been reported to carry the ability to reduce serum UA concentrations (179, 180). Some types of cherries were demonstrated to reduce flares of gout (181, 182). Other crucial nutrients in fruits, including potassium, anthocyanins, catechins and flavonoids, could play an important role in lessening the pathological effects of UA and fructose (9).
Since the effect of fruit on hyperuricemia is so complicated, what about fruit juice? It is suggested that patients with gout or hyperuricemia should avoid food high in HFCS, like soft drinks. But whether the fructose-containing fruit juice often compared to soft drinks at the same amounts, has a negative impact on gout or not? To date, few studies have evaluated the effect of fruit juice on UA metabolism and produced some interesting results. One of the interesting results is that consumption of orange juice was related to a higher incidence of gout, but apple juice, grapefruit juice, tomato juice and others were not (62). Another data from a large-sample prospective cohort study, however, has explored the effect of orange juice and other fruit juices and found that both orange juice and total fruit juice were associated with the risk of gout (61). And in a meta-analysis study, it was found that fruit juice is related to a 77% increase in gout (68). But in the NHANES (2001-02), intake of fruit juice, which contains a lot of naturally occurring sugars, was revealed not to be related to SUA (64). It is postulated that fructose concentration in different juice may be the main reason.
Taken together, though the data about the effect of natural fruit and fruit juice on the risk of hyperuricemia and gout are somehow mixed, it is recommended to reduce the intake of refined sugars and fruit juices in the management of gout patients, and encourage the intake of natural fruits, especially cherries, non-citrus fruit, and less ripe fruit in which fructose content is low. In addition, probiotics in the prevention or treatment of hyperuricemia or gout is still in its infancy. Regulating the intestinal flora and maintaining intestinal homeostasis via the use of probiotics and prebiotics or even fecal transplantation may be a new intestinal microecological treatment method for hyperuricemia and gout. If these findings are replicated in future randomized controlled trials, are substantial.
A recent alarming increase in the hyperuricemia subjects with associated gout and other detrimental metabolic diseases has sparked extensive research in the field. This review provides a pivotal role of the high-dose fructose intake and gut microbiota in the pathogenesis of hyperuricemia and gout. Excessive fructose (especially in refined sugar and fruit juice) intake alters the gut microbiota composition and impairs intestinal barriers function through a series of inflammatory reactions, which play key roles in the pathogenesis of hyperuricemia and gout. In turn, the inflammatory reactions triggered by high-dose fructose intake also have a significant impact on the shaping and maintaining of the intestinal flora homeostasis, which is critical for the catabolism of purines and UA. The results described suggest that it might be safe, effective and side-effect-free approach for the prevention or treatment of hyperuricemia and gout to limit specific fructose intake and improve the composition of gut microbiota or target characteristic metabolites of beneficial bacteria via the use of probiotics or prebiotics. Nevertheless, the mechanism by which fructose intake interacts with the gut microbiota has not been fully elucidated. Current research evidence mostly comes from animal experiments, the differences between humans and experimental animals (such as rats) limit the extrapolation of the results. Therefore, further clinical trials are needed to clarify its specific mechanism. In addition, some probiotics or prebiotics that have been shown useful in the treatment of hyperuricemia and gout are mixed extracts, and the mechanisms by which they mediate resistance to hyperuricemia and gout involve multiple targets and multiple pathways. Further identification of the specific components involved in lowering UA is needed to provide a broader range of selection of effective treatments for hyperuricemia and gout in the future. And whether the role of the gut microbiota is necessary or synergistic needs to be further clarified through integrated multiomic approaches. Also, the safety and effects of the application of probiotics in clinical use need verification. Besides, more prospective studies are necessary in the future to evaluate intake of various fructose-containing food sources in different populations and their relationship to gout and hyperuricemia. These future directions will help identify the extent to which our foods and probiotics regulate the risk of hyperuricemia and gout, which will further inform health care professionals, policymakers, and help develop improved dietary guidelines for the prevention and management of gout and hyperuricemia.
D-qY: ideas. X-yF: ideas and writing the initial draft. L-wQ, H-fC, PG, and QZ: literature collection. R-xL, Y-gF, B-zL, and H-fP: writing—review and editing. All authors contributed to the article and approved the submitted version.
This study was supported by the National Natural Science Foundation of China (82073652).
The authors declare that the research was conducted in the absence of any commercial or financial relationships that could be construed as a potential conflict of interest.
All claims expressed in this article are solely those of the authors and do not necessarily represent those of their affiliated organizations, or those of the publisher, the editors and the reviewers. Any product that may be evaluated in this article, or claim that may be made by its manufacturer, is not guaranteed or endorsed by the publisher.
1. Cea SL, Rothenbacher D, Choi HK, Garcia RL. Contemporary epidemiology of gout in the UK general population. Arthritis Res. Ther. (2011) 13:R39. doi: 10.1186/ar3272
2. Arromdee E, Michet CJ, Crowson CS, O'Fallon WM, Gabriel SE. Epidemiology of gout: is the incidence rising? J Rheumatol. (2002) 29:2403–6. doi: 10.1097/00002281-200211000-00016
3. Liu R, Han C, Wu D, Xia X, Gu J, Guan H, et al. Prevalence of hyperuricemia and gout in Mainland China from 2000 to 2014: a systematic review and meta-analysis. Biomed Res Int. (2015) 2015:762820. doi: 10.1155/2015/762820
4. Chen-Xu M, Yokose C, Rai SK, Pillinger MH, Choi HK. Contemporary prevalence of gout and hyperuricemia in the United States and decadal trends: the National Health and Nutrition Examination Survey, 2007-2016. Arthritis Rheumatol. (2019) 71:991–9. doi: 10.1002/art.40807
5. Kuo CF, Grainge MJ, Mallen C, Zhang W, Doherty M. Rising burden of gout in the UK but continuing suboptimal management: a nationwide population study. Ann Rheum Dis. (2015) 74:661–667. doi: 10.1136/annrheumdis-2013-204463
6. Ekpenyong CE, Daniel N. Roles of diets and dietary factors in the pathogenesis, management and prevention of abnormal serum uric acid levels. PharmaNutrition. (2015) 3:29–45. doi: 10.1016/j.phanu.2014.12.001
7. Douard V, Ferraris RP. The role of fructose transporters in diseases linked to excessive fructose intake. J Physiol. (2013) 591:401–14. doi: 10.1113/jphysiol.2011.215731
8. Olofsson C, Anderstam B, Bragfors-Helin AC, Eriksson M, Qureshi AR, Lindholm B, et al. Effects of acute fructose loading on levels of serum uric acid-a pilot study. Eur J Clin Invest. (2019) 49:e13040. doi: 10.1111/eci.13040
9. Nakagawa T, Lanaspa MA, Johnson RJ. The effects of fruit consumption in patients with hyperuricaemia or gout. Rheumatology. (2019) 58:1133–41. doi: 10.1093/rheumatology/kez128
10. Siqueira JH, Mill JG, Velasquez-Melendez G, Moreira AD, Barreto SM, Bensenor IM, et al. Sugar-sweetened soft drinks and fructose consumption are associated with hyperuricemia: cross-sectional analysis from the brazilian longitudinal study of adult health (ELSA-Brasil). Nutrients. (2018) 10:981. doi: 10.3390/nu10080981
11. Pascart T, Liote F. Gout: state of the art after a decade of developments. Rheumatology. (2019) 58:27–44. doi: 10.1093/rheumatology/key002
12. Dalbeth N, Gosling AL, Gaffo A, Abhishek A. Gout. LANCET. (2021) 397:1843–55. doi: 10.1016/S0140-6736(21)00569-9
13. Chang PY, Chang YW, Lin YF, Fan HC. Sex-specific association of uric acid and kidney function decline in Taiwan. J Pers Med. (2021) 11:415. doi: 10.3390/jpm11050415
14. Zhang WZ. Why does hyperuricemia not necessarily induce gout? Biomolecules. (2021) 11. doi: 10.3390/biom11020280
15. Johnson RJ, Bakris GL, Borghi C, Chonchol MB, Feldman D, Lanaspa MA, et al. Hyperuricemia, acute and chronic kidney disease, hypertension, and cardiovascular disease: report of a scientific workshop organized by the national kidney foundation. Am J Kidney Dis. (2018) 71:851–65. doi: 10.1053/j.ajkd.2017.12.009
16. Kratzer JT, Lanaspa MA, Murphy MN, Cicerchi C, Graves CL, Tipton PA, et al. Evolutionary history and metabolic insights of ancient mammalian uricases. Proc Natl Acad Sci USA. (2014) 111:3763–8. doi: 10.1073/pnas.1320393111
17. Rahimi-Sakak F, Maroofi M, Rahmani J, Bellissimo N, Hekmatdoost A. Serum uric acid and risk of cardiovascular mortality: a systematic review and dose-response meta-analysis of cohort studies of over a million participants. BMC Cardiovasc Disord. (2019) 19:218. doi: 10.1186/s12872-019-1215-z
18. Lin KC, Lin HY, Chou P. The interaction between uric acid level and other risk factors on the development of gout among asymptomatic hyperuricemic men in a prospective study. J Rheumatol. (2000) 27:1501–5. doi: 10.1097/00124743-200006000-00008
19. Dalbeth N, House ME, Aati O, Tan P, Franklin C, Horne A, et al. Urate crystal deposition in asymptomatic hyperuricaemia and symptomatic gout: a dual energy CT study. Ann Rheum Dis. (2015) 74:908–11. doi: 10.1136/annrheumdis-2014-206397
20. Nagahama K, Iseki K, Inoue T, Touma T, Ikemiya Y, Takishita S. Hyperuricemia and cardiovascular risk factor clustering in a screened cohort in Okinawa, Japan. Hypertens Res. (2004) 27:227–33. doi: 10.1291/hypres.27.227
21. Grayson PC, Kim SY, LaValley M, Choi HK. Hyperuricemia and incident hypertension: a systematic review and meta-analysis. Arthritis Care Res. (2011) 63:102–10. doi: 10.1002/acr.20344
22. Li L, Yang C, Zhao Y, Zeng X, Liu F, Fu P. Is hyperuricemia an independent risk factor for new-onset chronic kidney disease?: A systematic review and meta-analysis based on observational cohort studies. BMC Nephrol. (2014) 15:122. doi: 10.1186/1471-2369-15-122
23. Krishnan E, Pandya BJ, Chung L, Hariri A, Dabbous O. Hyperuricemia in young adults and risk of insulin resistance, prediabetes, and diabetes: a 15-year follow-up study. Am J Epidemiol. (2012) 176:108–16. doi: 10.1093/aje/kws002
24. Kodama S, Saito K, Yachi Y, Asumi M, Sugawara A, Totsuka K, et al. Association between serum uric acid and development of type 2 diabetes. Diabetes Care. (2009) 32:1737–42. doi: 10.2337/dc09-0288
25. Lv Q, Meng XF, He FF, Chen S, Su H, Xiong J, et al. High serum uric acid and increased risk of type 2 diabetes: a systemic review and meta-analysis of prospective cohort studies. PLoS ONE. (2013) 8:e56864. doi: 10.1371/journal.pone.0056864
26. Yan L, Liu Z, Zhang C. Uric acid as a predictor of in-hospital mortality in acute myocardial infarction: a meta-analysis. Cell Biochem Biophys. (2014) 70:1597–601. doi: 10.1007/s12013-014-0101-7
27. Zhu Y, Peng X, Ling G. An update on the animal models in hyperuricaemia research. Clin Exp Rheumatol. (2017) 35:860–4.
28. Kei A, Koutsouka F, Makri A, Elisaf M. Uric acid and cardiovascular risk: what genes can say. Int J Clin Pract. (2018) 72:1–7. doi: 10.1111/ijcp.13048
29. Parsa A, Brown E, Weir MR, Fink JC, Shuldiner AR, Mitchell BD, et al. Genotype-based changes in serum uric acid affect blood pressure. Kidney Int. (2012) 81:502–7. doi: 10.1038/ki.2011.414
30. Robinson PC, Choi HK, Do R, Merriman TR. Insight into rheumatological cause and effect through the use of Mendelian randomization. Nat Rev Rheumatol. (2016) 12:486–96. doi: 10.1038/nrrheum.2016.102
31. Bodofsky S, Merriman TR, Thomas TJ, Schlesinger N. Advances in our understanding of gout as an auto-inflammatory disease. Semin Arthritis Rheum. (2020) 50:1089–100. doi: 10.1016/j.semarthrit.2020.06.015
32. Dalbeth N, Phipps-Green A, Frampton C, Neogi T, Taylor WJ, Merriman TR. Relationship between serum urate concentration and clinically evident incident gout: an individual participant data analysis. Ann Rheum Dis. (2018) 77:1048–52. doi: 10.1136/annrheumdis-2017-212288
33. Martinon F, Petrilli V, Mayor A, Tardivel A, Tschopp J. Gout-associated uric acid crystals activate the NALP3 inflammasome. Nature. (2006) 440:237–41. doi: 10.1038/nature04516
34. Broz P, Dixit VM. Inflammasomes: mechanism of assembly, regulation and signalling. Nat Rev Immunol. (2016) 16:407–20. doi: 10.1038/nri.2016.58
35. Schlesinger N, Mysler E, Lin HY, De Meulemeester M, Rovensky J, Arulmani U, et al. Canakinumab reduces the risk of acute gouty arthritis flares during initiation of allopurinol treatment: results of a double-blind, randomised study. Ann Rheum Dis. (2011) 70:1264–71. doi: 10.1136/ard.2010.144063
36. Bauernfeind FG, Horvath G, Stutz A, Alnemri ES, MacDonald K, Speert D, et al. Cutting edge: NF-kappaB activating pattern recognition and cytokine receptors license NLRP3 inflammasome activation by regulating NLRP3 expression. J Immunol. (2009) 183:787–91. doi: 10.4049/jimmunol.0901363
37. Aglietti RA, Dueber EC. Recent insights into the molecular mechanisms underlying pyroptosis and gasdermin family functions. Trends Immunol. (2017) 38:261–71. doi: 10.1016/j.it.2017.01.003
38. Cronstein BN, Terkeltaub R. The inflammatory process of gout and its treatment. Arthritis Res Ther. (2006) 8(Suppl. 1):S3. doi: 10.1186/ar1908
39. Mccarty DJ. Pathogenesis and treatment of crystal-induced inflammation. Arthritis Allied Condit. (1979).
40. Dalbeth N, Choi HK, Joosten L, Khanna PP, Matsuo H, Perez-Ruiz F, et al. Gout. Nature Reviews Disease Primers. (2019) 5:69. doi: 10.1038/s41572-019-0115-y
41. Kuo CF, Grainge MJ, Mallen C, Zhang W, Doherty M. Comorbidities in patients with gout prior to and following diagnosis: case-control study. Ann Rheum Dis. (2016) 75:210–217. doi: 10.1136/annrheumdis-2014-206410
42. Choi HK, Ford ES, Li C, Curhan G. Prevalence of the metabolic syndrome in patients with gout: the Third National Health and Nutrition Examination Survey. Arthritis Rheum. (2007) 57:109–15. doi: 10.1002/art.22466
43. Choi HK, Atkinson K, Karlson EW, Curhan G. Obesity, weight change, hypertension, diuretic use, and risk of gout in men: the health professionals follow-up study. Arch Intern Med. (2005) 165:742–8. doi: 10.1001/archinte.165.7.742
44. McAdams-DeMarco MA, Maynard JW, Baer AN, Coresh J. Hypertension and the risk of incident gout in a population-based study: the atherosclerosis risk in communities cohort. J Clin Hypertens. (2012) 14:675–9. doi: 10.1111/j.1751-7176.2012.00674.x
45. Lyngdoh T, Vuistiner P, Marques-Vidal P, Rousson V, Waeber G, Vollenweider P, et al. Serum uric acid and adiposity: deciphering causality using a bidirectional Mendelian randomization approach. PLoS ONE. (2012) 7:e39321. doi: 10.1371/journal.pone.0039321
46. Rho YH, Lu N, Peloquin CE, Man A, Zhu Y, Zhang Y, et al. Independent impact of gout on the risk of diabetes mellitus among women and men: a population-based, BMI-matched cohort study. Ann Rheum Dis. (2016) 75:91–95. doi: 10.1136/annrheumdis-2014-205827
47. Pan A, Teng GG, Yuan JM, Koh WP. Bidirectional association between diabetes and gout: the Singapore Chinese Health Study. Sci Rep. (2016) 6:25766. doi: 10.1038/srep25766
48. Lytvyn Y, Skrtic M, Yang GK, Yip PM, Perkins BA, Cherney DZ. Glycosuria-mediated urinary uric acid excretion in patients with uncomplicated type 1 diabetes mellitus. Am J Physiol Renal Physiol. (2015) 308:F77–83. doi: 10.1152/ajprenal.00555.2014
49. Roughley MJ, Belcher J, Mallen CD, Roddy E. Gout and risk of chronic kidney disease and nephrolithiasis: meta-analysis of observational studies. Arthritis Res Ther. (2015) 17:90. doi: 10.1186/s13075-015-0610-9
50. Jing J, Kielstein JT, Schultheiss UT, Sitter T, Titze SI, Schaeffner ES, et al. Prevalence and correlates of gout in a large cohort of patients with chronic kidney disease: the German Chronic Kidney Disease (GCKD) study. Nephrol Dial Transplant. (2015) 30:613–21. doi: 10.1093/ndt/gfu352
51. Clarson LE, Hider SL, Belcher J, Heneghan C, Roddy E, Mallen CD. Increased risk of vascular disease associated with gout: a retrospective, matched cohort study in the UK clinical practice research datalink. Ann Rheum Dis. (2015) 74:642–7. doi: 10.1136/annrheumdis-2014-205252
52. Clarson LE, Chandratre P, Hider SL, Belcher J, Heneghan C, Roddy E, et al. Increased cardiovascular mortality associated with gout: a systematic review and meta-analysis. Eur J Prev Cardiol. (2015) 22:335–43. doi: 10.1177/2047487313514895
53. Marriott BP, Cole N, Lee E. National estimates of dietary fructose intake increased from 1977 to 2004 in the United States. J Nutr. (2009) 139:1228S−35S. doi: 10.3945/jn.108.098277
54. Powell ES, Smith-Taillie LP, Popkin BM. Added sugars intake across the distribution of US children and adult consumers: 1977-2012. J Acad Nutr Diet. (2016) 116:1543–50. doi: 10.1016/j.jand.2016.06.003
55. Tappy L, Le KA. Metabolic effects of fructose and the worldwide increase in obesity. Physiol Rev. (2010) 90:23–46. doi: 10.1152/physrev.00019.2009
56. Newens KJ, Walton J. A review of sugar consumption from nationally representative dietary surveys across the world. J Human Nutr Dietetics. (2016) 29:225–40. doi: 10.1111/jhn.12338
57. Rai SK, Avina-Zubieta JA, McCormick N, De Vera MA, Shojania K, Sayre EC, et al. The rising prevalence and incidence of gout in British Columbia, Canada: population-based trends from 2000 to 2012. Semin Arthritis Rheum. (2017) 46:451–6. doi: 10.1016/j.semarthrit.2016.08.006
58. Ayoub-Charette S, Liu Q, Khan TA, Au-Yeung F, Blanco MS, de Souza RJ, et al. Important food sources of fructose-containing sugars and incident gout: a systematic review and meta-analysis of prospective cohort studies. BMJ Open. (2019) 9:e24171. doi: 10.1136/bmjopen-2018-024171
59. Tappy L, Le KA, Tran C, Paquot N. Fructose and metabolic diseases: new findings, new questions. Nutrition. (2010) 26:1044–9. doi: 10.1016/j.nut.2010.02.014
60. Apovian Caroline M. Sugar-sweetened soft drinks, obesity, and Type 2 diabetes. JAMA. (2004) 292:978–9. doi: 10.1001/jama.292.8.978
61. Choi HK, Curhan G. Soft drinks, fructose consumption, and the risk of gout in men: prospective cohort study. BMJ. (2008) 336:309–12. doi: 10.1136/bmj.39449.819271.BE
62. Choi HK, Willett W, Curhan G. Fructose-rich beverages and risk of gout in women. JAMA. (2010) 304:2270–8. doi: 10.1001/jama.2010.1638
63. Gao Q, Cheng X, Merriman TR, Wang C, Cui L, Zhang H, et al. Trends in the manifestations of 9754 gout patients in a Chinese clinical center: a 10-year observational study. Joint Bone Spine. (2021) 88:105078. doi: 10.1016/j.jbspin.2020.09.010
64. Gao X, Qi L, Qiao N, Choi HK, Curhan G, Tucker KL, et al. Intake of added sugar and sugar-sweetened drink and serum uric acid concentration in US men and women. Hypertension. (2007) 50:306–12. doi: 10.1161/HYPERTENSIONAHA.107.091041
65. Ebrahimpour-Koujan S, Saneei P, Larijani B, Esmaillzadeh A. Consumption of sugar-sweetened beverages and serum uric acid concentrations: a systematic review and meta-analysis. J Human Nutr Dietet. (2021) 34:305–13. doi: 10.1111/jhn.12796
66. Major TJ, Topless RK, Dalbeth N, Merriman TR. Evaluation of the diet wide contribution to serum urate levels: meta-analysis of population based cohorts. BMJ. (2018) 363:k3951. doi: 10.1136/bmj.k3951
67. Sun SZ, Flickinger BD, Williamson-Hughes PS, Empie MW. Lack of association between dietary fructose and hyperuricemia risk in adults. Nutr Metab. (2010) 7:16. doi: 10.1186/1743-7075-7-16
68. Macdonald I, Keyser A, Pacy D. Some effects, in man, of varying the load of glucose, sucrose, fructose, or sorbitol on various metabolites in blood. Am J Clin Nutr. (1978) 31:1305–11. doi: 10.1093/ajcn/31.8.1305
69. Emmerson BT. Effect of oral fructose on urate production. Ann Rheum Dis. (1974) 33:276–80. doi: 10.1136/ard.33.3.276
70. Narins RG, Weisberg JS, Myers AR. Effects of carbohydrates on uric acid metabolism. Metab Clin Exp. (1974) 23:455–65. doi: 10.1016/0026-0495(74)90093-6
71. Huttunen JK, Makinen KK, Scheinin A. Turku sugar studies XI. effects of sucrose, fructose and xylitol diets on glucose, lipid and urate metabolism. Acta Odontol Scand. (1976) 34:345–51. doi: 10.3109/00016357609004646
72. Osei K, Falko J, Bossetti BM, Holland GC. Metabolic effects of fructose as a natural sweetener in the physiologic meals of ambulatory obese patients with type II diabetes. Am J Med. (1987) 83:249–55. doi: 10.1016/0002-9343(87)90693-0
73. Osei K, Bossetti B. Dietary fructose as a natural sweetener in poorly controlled type 2 diabetes: a 12-month crossover study of effects on glucose, lipoprotein and apolipoprotein metabolism. Diabet Med. (1989) 6:506–11. doi: 10.1111/j.1464-5491.1989.tb01218.x
74. Anderson JW, Story LJ, Zettwoch NC, Gustafson NJ, Jefferson BS. Metabolic effects of fructose supplementation in diabetic individuals. Diabetes Care. (1989) 12:337–44. doi: 10.2337/diacare.12.5.337
75. Koh ET, Ard NF, Mendoza F. Effects of fructose feeding on blood parameters and blood pressure in impaired glucose-tolerant subjects. J Am Diet Assoc. (1988) 88:932–8. doi: 10.1016/S0002-8223(21)07931-1
76. Grigoresco C, Rizkalla SW, Halfon P, Bornet F, Fontvieille AM, Bros M, et al. Lack of detectable deleterious effects on metabolic control of daily fructose ingestion for 2 mo in NIDDM patients. Diabetes Care. (1988) 11:546–50. doi: 10.2337/diacare.11.7.546
77. Crapo PA, Kolterman OG. The metabolic effects of 2-week fructose feeding in normal subjects. Am J Clin Nutr. (1984) 39:525–34. doi: 10.1093/ajcn/39.4.525
78. Turner JL, Bierman EL, Brunzell JD, Chait A. Effect of dietary fructose on triglyceride transport and glucoregulatory hormones in hypertriglyceridemic men. Am J Clin Nutr. (1979) 32:1043–50. doi: 10.1093/ajcn/32.5.1043
79. Curreri PW, Pruitt BJ. Absence of fructose-induced hyperuricaemia in men. Lancet. (1970) 1:839. doi: 10.1016/S0140-6736(70)92436-0
80. Riby JE, Fujisawa T, Kretchmer N. Fructose absorption. Am J Clin Nutr. (1993) 58(5 Suppl):748S−53S. doi: 10.1093/ajcn/58.5.748S
81. Kaneko C, Ogura J, Sasaki S, Okamoto K, Kobayashi M, Kuwayama K, et al. Fructose suppresses uric acid excretion to the intestinal lumen as a result of the induction of oxidative stress by NADPH oxidase activation. Biochim Biophys Acta Gen Subj. (2017) 1861:559–66. doi: 10.1016/j.bbagen.2016.11.042
82. Mayes PA. Intermediary metabolism of fructose. Am J Clin Nutr. (1993) 58(5 Suppl):754S−65S. doi: 10.1093/ajcn/58.5.754S
83. George TA, Iancu CV, Nguyen TT, Kim D, Choe JY. Inhibition of human GLUT1 and GLUT5 by plant carbohydrate products; insights into transport specificity. Sci Rep. (2015) 5:12804. doi: 10.1038/srep12804
84. Woods HF, Eggleston LV, Krebs HA. The cause of hepatic accumulation of fructose 1-phosphate on fructose loading. Biochem J. (1970) 119:501–10. doi: 10.1042/bj1190501
85. Lanaspa MA, Cicerchi C, Garcia G, Li N, Roncal-Jimenez CA, Rivard CJ, et al. Counteracting roles of AMP deaminase and AMP kinase in the development of fatty liver. PLoS ONE. (2012) 7:e48801. doi: 10.1371/journal.pone.0048801
86. Cicerchi C, Li N, Kratzer J, Garcia G, Roncal-Jimenez CA, Tanabe K, et al. Uric acid-dependent inhibition of AMP kinase induces hepatic glucose production in diabetes and starvation: evolutionary implications of the uricase loss in hominids. FASEB J. (2014) 28:3339–50. doi: 10.1096/fj.13-243634
87. Zhang Y, Hong Q, Huang Z, Xue P, Lv Y, Fu B, et al. ALDR enhanced endothelial injury in hyperuricemia screened using SILAC. Cell Physiol Biochem. (2014) 33:479–90. doi: 10.1159/000358628
88. Lanaspa MA, Sanchez-Lozada LG, Cicerchi C, Li N, Roncal-Jimenez CA, Ishimoto T, et al. Uric acid stimulates fructokinase and accelerates fructose metabolism in the development of fatty liver. PLoS ONE. (2012) 7:e47948. doi: 10.1371/journal.pone.0047948
89. Tan S, Radi R, Gaudier F, Evans RA, Rivera A, Kirk KA, et al. Physiologic levels of uric acid inhibit xanthine oxidase in human plasma. Pediatr Res. (1993) 34:303–7. doi: 10.1203/00006450-199309000-00013
90. Ferraris RP, Choe JY, Patel CR. Intestinal absorption of fructose. Annu Rev Nutr. (2018) 38:41–67. doi: 10.1146/annurev-nutr-082117-051707
91. Zhang D, Tong X, VanDommelen K, Gupta N, Stamper K, Brady GF, et al. Lipogenic transcription factor ChREBP mediates fructose-induced metabolic adaptations to prevent hepatotoxicity. J Clin Investigat. (2017) 127:2855–67. doi: 10.1172/JCI89934
92. Leong I. Metabolism: the small intestine - a new player in fructose metabolism. Nat Rev Endocrinol. (2018) 14:190. doi: 10.1038/nrendo.2018.20
93. Jang C, Hui S, Lu W, Cowan AJ, Morscher RJ, Lee G, et al. The small intestine converts dietary fructose into glucose and organic acids. Cell Metab. (2018) 27:351–61. doi: 10.1016/j.cmet.2017.12.016
94. Burch HB, Choi S, Dence CN, Alvey TR, Cole BR, Lowry OH. Metabolic effects of large fructose loads in different parts of the rat nephron. J Biol Chem. (1980) 255:8239–44. doi: 10.1016/S0021-9258(19)70637-1
95. Caliceti C, Calabria D, Roda A, Cicero A. Fructose intake, serum uric acid, and cardiometabolic disorders: a critical review. Nutrients. (2017) 9:395. doi: 10.3390/nu9040395
96. Nakagawa T, Johnson RJ, Andres-Hernando A, Roncal-Jimenez C, Sanchez-Lozada LG, Tolan DR, et al. Fructose production and metabolism in the kidney. J Am Soc Nephrol. (2020) 31:898–906. doi: 10.1681/ASN.2019101015
97. Andres-Hernando A, Li N, Cicerchi C, Inaba S, Chen W, Roncal-Jimenez C, et al. Protective role of fructokinase blockade in the pathogenesis of acute kidney injury in mice. Nat Commun. (2017) 8:14181. doi: 10.1038/ncomms14181
98. Lanaspa MA, Tapia E, Soto V, Sautin Y, Sanchez-Lozada LG. Uric acid and fructose: potential biological mechanisms. Semin Nephrol. (2011) 31:426–32. doi: 10.1016/j.semnephrol.2011.08.006
99. Zhang C, Li L, Zhang Y, Zeng C. Recent advances in fructose intake and risk of hyperuricemia. Biomed Pharmacother. (2020) 131:110795. doi: 10.1016/j.biopha.2020.110795
100. Nicholson JK, Holmes E, Kinross J, Burcelin R, Gibson G, Jia W, et al. Host-gut microbiota metabolic interactions. Science. (2012) 336:1262–7. doi: 10.1126/science.1223813
101. Nishino K, Nishida A, Inoue R, Kawada Y, Ohno M, Sakai S, et al. Analysis of endoscopic brush samples identified mucosa-associated dysbiosis in inflammatory bowel disease. J Gastroenterol. (2018) 53:95–106. doi: 10.1007/s00535-017-1384-4
102. Arthur JC, Perez-Chanona E, Muhlbauer M, Tomkovich S, Uronis JM, Fan TJ, et al. Intestinal inflammation targets cancer-inducing activity of the microbiota. Science. (2012) 338:120–3. doi: 10.1126/science.1224820
103. Jie Z, Xia H, Zhong SL, Feng Q, Li S, Liang S, et al. The gut microbiome in atherosclerotic cardiovascular disease. Nat Commun. (2017) 8:845. doi: 10.1038/s41467-017-00900-1
104. Roxon JJ, Ryan AJ, Wright SE. Reduction of tartrazine by a Proteus species isolated from rats. Food Cosmet Toxicol. (1966) 4:419–26. doi: 10.1016/S0015-6264(66)80583-7
105. Sathisha KR, Khanum SA, Chandra JN, Ayisha F, Balaji S, Marathe GK, et al. Synthesis and xanthine oxidase inhibitory activity of 7-methyl-2-(phenoxymethyl)-5 H -[1,3,4]thiadiazolo[3,2- a]pyrimidin-5-one derivatives. Bioorganic Med Chem. (2011) 19:211–20. doi: 10.1016/j.bmc.2010.11.034
106. Crane JK, Naeher TM, Broome JE, Boedeker EC. Role of host xanthine oxidase in infection due to enteropathogenic and Shiga-toxigenic Escherichia coli. Infect Immun. (2013) 81:1129–39. doi: 10.1128/IAI.01124-12
107. Yamada N, Iwamoto C, Kano H, Yamaoka N, Fukuuchi T, Kaneko K, et al. Evaluation of purine utilization by Lactobacillus gasseri strains with potential to decrease the absorption of food-derived purines in the human intestine. Nucleosides Nucleotides Nucleic Acids. (2016) 35:670–6. doi: 10.1080/15257770.2015.1125000
108. Hsieh CY, Lin HJ, Chen CH, Lai EC, Yang YK. Chronic kidney disease and stroke. Lancet Neurol. (2014) 13:1071. doi: 10.1016/S1474-4422(14)70199-1
109. Hosomi A, Nakanishi T, Fujita T, Tamai I. Extra-renal elimination of uric acid via intestinal efflux transporter BCRP/ABCG2. PLoS ONE. (2012) 7:e30456. doi: 10.1371/journal.pone.0030456
110. Guo Z, Zhang J, Wang Z, Ang KY, Huang S, Hou Q, et al. Intestinal microbiota distinguish gout patients from healthy humans. Sci Rep. (2016) 6:20602. doi: 10.1038/srep20602
111. Chu Y, Sun S, Huang Y, Gao Q, Xie X, Wang P, et al. Metagenomic analysis revealed the potential role of gut microbiome in gout. NPJ Biofilms Microbiomes. (2021) 7:66. doi: 10.1038/s41522-021-00235-2
112. Pan L, Han P, Ma S, Peng R, Wang C, Kong W, et al. Abnormal metabolism of gut microbiota reveals the possible molecular mechanism of nephropathy induced by hyperuricemia. Acta Pharmaceutica Sinica B. (2020) 10:249–61. doi: 10.1016/j.apsb.2019.10.007
113. Abell GC, Cooke CM, Bennett CN, Conlon MA, McOrist AL. Phylotypes related to Ruminococcus bromii are abundant in the large bowel of humans and increase in response to a diet high in resistant starch. FEMS Microbiol Ecol. (2008) 66:505–15. doi: 10.1111/j.1574-6941.2008.00527.x
114. De Filippo C, Cavalieri D, Di Paola M, Ramazzotti M, Poullet JB, Massart S, et al. Impact of diet in shaping gut microbiota revealed by a comparative study in children from Europe and rural Africa. Proc Natl Acad Sci USA. (2010) 107:14691–6. doi: 10.1073/pnas.1005963107
115. Cani PD, Bibiloni R, Knauf C, Waget A, Neyrinck AM, Delzenne NM, et al. Changes in gut microbiota control metabolic endotoxemia-induced inflammation in high-fat diet-induced obesity and diabetes in mice. Diabetes. (2008) 57:1470–81. doi: 10.2337/db07-1403
116. Kim KA, Gu W, Lee IA, Joh EH, Kim DH. High fat diet-induced gut microbiota exacerbates inflammation and obesity in mice via the TLR4 signaling pathway. PLoS ONE. (2012) 7:e47713. doi: 10.1371/journal.pone.0047713
117. Beards E, Tuohy K, Gibson G. A human volunteer study to assess the impact of confectionery sweeteners on the gut microbiota composition. Br J Nutr. (2010) 104:701–8. doi: 10.1017/S0007114510001078
118. Abou-Donia MB, El-Masry EM, Abdel-Rahman AA, McLendon RE, Schiffman SS. Splenda alters gut microflora and increases intestinal p-glycoprotein and cytochrome p-450 in male rats. J Toxicol Environ Health A. (2008) 71:1415–29. doi: 10.1080/15287390802328630
119. Beisner J, Gonzalez-Granda A, Basrai M, Damms-Machado A, Bischoff SC. Fructose-induced intestinal microbiota shift following two types of short-term high-fructose dietary Phases. Nutrients. (2020) 12:3444. doi: 10.3390/nu12113444
120. Wang Y, Qi W, Song G, Pang S, Peng Z, Li Y, et al. High-fructose diet increases inflammatory cytokines and alters gut microbiota composition in rats. Mediators Inflamm. (2020) 2020:6672636. doi: 10.1155/2020/6672636
121. Busing F, Hagele FA, Nas A, Dobert LV, Fricker A, Dorner E, et al. High intake of orange juice and cola differently affects metabolic risk in healthy subjects. Clin Nutr. (2019) 38:812–9. doi: 10.1016/j.clnu.2018.02.028
122. Prince PD, Lanzi CR, Toblli JE, Elesgaray R, Oteiza PI, Fraga CG, et al. Dietary (-)-epicatechin mitigates oxidative stress, NO metabolism alterations, and inflammation in renal cortex from fructose-fed rats. Free Radic Biol Med. (2016) 90:35–46. doi: 10.1016/j.freeradbiomed.2015.11.009
123. Do MH, Lee E, Oh MJ, Kim Y, Park HY. High-glucose or -fructose diet cause changes of the gut microbiota and metabolic disorders in mice without body weight change. Nutrients. (2018) 10:761. doi: 10.3390/nu10060761
124. Li JM, Yu R, Zhang LP, Wen SY, Wang SJ, Zhang XY, et al. Dietary fructose-induced gut dysbiosis promotes mouse hippocampal neuroinflammation: a benefit of short-chain fatty acids. Microbiome. (2019) 7:98. doi: 10.1186/s40168-019-0713-7
125. Martinon F, Burns K, Tschopp J. The inflammasome: a molecular platform triggering activation of inflammatory caspases and processing of proIL-beta. Mol Cell. (2002) 10:417–26. doi: 10.1016/S1097-2765(02)00599-3
126. Hachicha M, Naccache PH, McColl SR. Inflammatory microcrystals differentially regulate the secretion of macrophage inflammatory protein 1 and interleukin 8 by human neutrophils: a possible mechanism of neutrophil recruitment to sites of inflammation in synovitis. J Exp Med. (1995) 182:2019–25. doi: 10.1084/jem.182.6.2019
127. di Giovine FS, Malawista SE, Thornton E, Duff GW. Urate crystals stimulate production of tumor necrosis factor alpha from human blood monocytes and synovial cells. cytokine mRNA and protein kinetics, cellular distribution. J Clin Invest. (1991) 87:1375–81. doi: 10.1172/JCI115142
128. Amaral FA, Bastos LF, Oliveira TH, Dias AC, Oliveira VL, Tavares LD, et al. Transmembrane TNF-alpha is sufficient for articular inflammation and hypernociception in a mouse model of gout. Eur J Immunol. (2016) 46:204–11. doi: 10.1002/eji.201545798
129. Chapman PT, Yarwood H, Harrison AA, Stocker CJ, Jamar F, Gundel RH, et al. Endothelial activation in monosodium urate monohydrate crystal-induced inflammation: in vitro and in vivo studies on the roles of tumor necrosis factor alpha and interleukin-1. Arthritis Rheum. (1997) 40:955–65. doi: 10.1002/art.1780400525
130. Pahwa R, Balderas M, Jialal I, Chen X, Luna RA, Devaraj S. Gut microbiome and inflammation: a study of diabetic inflammasome-knockout mice. J Diabetes Res. (2017) 2017:6519785. doi: 10.1155/2017/6519785
131. Hirota SA, Ng J, Lueng A, Khajah M, Parhar K, Li Y, et al. NLRP3 inflammasome plays a key role in the regulation of intestinal homeostasis. Inflamm Bowel Dis. (2011) 17:1359–72. doi: 10.1002/ibd.21478
132. Luissint AC, Parkos CA, Nusrat A. Inflammation and the intestinal barrier: leukocyte-epithelial cell interactions, cell junction remodeling, mucosal repair. Gastroenterology. (2016) 151:616–32. doi: 10.1053/j.gastro.2016.07.008
133. Vieira AT, Macia L, Galvao I, Martins FS, Canesso MC, Amaral FA, et al. A role for gut microbiota and the metabolite-sensing receptor gpr43 in a murine model of gout. Arthritis Rheumatol. (2015) 67:1646–56. doi: 10.1002/art.39107
134. Maslowski KM, Vieira AT, Ng A, Kranich J, Sierro F, Yu D, et al. Regulation of inflammatory responses by gut microbiota and chemoattractant receptor GPR43. Nature. (2009) 461:1282–6. doi: 10.1038/nature08530
135. Dostert C, Petrilli V, Van Bruggen R, Steele C, Mossman BT, Tschopp J. Innate immune activation through Nalp3 inflammasome sensing of asbestos and silica. Science. (2008) 320:674–7. doi: 10.1126/science.1156995
136. Xu D, Lv Q, Wang X, Cui X, Zhao P, Yang X, et al. Hyperuricemia is associated with impaired intestinal permeability in mice. Am J Physiol Gastrointest Liver Physiol. (2019) 317:G484–92. doi: 10.1152/ajpgi.00151.2019
137. Kunitskaia NA, Kozina LS, Utkin AK, Utkina AA. The peculiarities of chronic inflammation in elderly patients with gout and metabolic syndrome. Adv Gerontol. (2013) 26:161.
138. Xi Y, Yan J, Li M, Ying S, Shi Z. Gut microbiota dysbiosis increases the risk of visceral gout in goslings through translocation of gut-derived lipopolysaccharide. Poult Sci. (2019) 98:5361–73. doi: 10.3382/ps/pez357
139. Schluter J, Peled JU, Taylor BP, Markey KA, Smith M, Taur Y, et al. The gut microbiota is associated with immune cell dynamics in humans. Nature. (2020) 588:303–7. doi: 10.1038/s41586-020-2971-8
140. Shao T, Shao L, Li H, Xie Z, He Z, Wen C. Combined signature of the fecal microbiome and metabolome in patients with gout. Front Microbiol. (2017) 8:268. doi: 10.3389/fmicb.2017.00268
141. Nieuwdorp M, Gilijamse PW, Pai N, Kaplan LM. Role of the microbiome in energy regulation and metabolism. Gastroenterology. (2014) 146:1525–33. doi: 10.1053/j.gastro.2014.02.008
142. Wang J, Chen Y, Zhong H, Chen F, Regenstein J, Hu X, et al. The gut microbiota as a target to control hyperuricemia pathogenesis: potential mechanisms and therapeutic strategies. Crit Rev Food Sci Nutr. (2021) 22:1–11. doi: 10.1080/10408398.2021.1874287
143. DeBosch BJ, Kluth O, Fujiwara H, Schurmann A, Moley K. Early-onset metabolic syndrome in mice lacking the intestinal uric acid transporter SLC2A9. Nat Commun. (2014) 5:4642. doi: 10.1038/ncomms5642
144. Nakayama A, Matsuo H, Shimizu T, Ogata H, Takada Y, Nakashima H, et al. Common missense variant of monocarboxylate transporter 9 (MCT9/SLC16A9) gene is associated with renal overload gout, but not with all gout susceptibility. Hum Cell. (2013) 26:133–6. doi: 10.1007/s13577-013-0073-8
145. Xu X, Li C, Zhou P, Jiang T. Uric acid transporters hiding in the intestine. Pharm Biol. (2016) 54:3151–5. doi: 10.1080/13880209.2016.1195847
146. Litvak Y, Byndloss MX, Baumler AJ. Colonocyte metabolism shapes the gut microbiota. Science. (2018) 362:eaat9076. doi: 10.1126/science.aat9076
147. Rivera-Chavez F, Zhang LF, Faber F, Lopez CA, Byndloss MX, Olsan EE, et al. Depletion of butyrate-producing clostridia from the gut microbiota drives an aerobic luminal expansion of salmonella. Cell Host Microbe. (2016) 19:443–54. doi: 10.1016/j.chom.2016.03.004
148. Chang CS, Kao CY. Current understanding of the gut microbiota shaping mechanisms. J Biomed Sci. (2019) 26:59. doi: 10.1186/s12929-019-0554-5
149. Shields GE, Beard SM. A systematic review of the economic and humanistic burden of gout. Pharmacoeconomics. (2015) 33:1029–47. doi: 10.1007/s40273-015-0288-5
150. Scheepers L, van Onna M, Stehouwer C, Singh JA, Arts I, Boonen A. Medication adherence among patients with gout: a systematic review and meta-analysis. Semin Arthritis Rheum. (2018) 47:689–702. doi: 10.1016/j.semarthrit.2017.09.007
151. Guo Y, Yu Y, Li H, Ding X, Li X, Jing X, et al. Inulin supplementation ameliorates hyperuricemia and modulates gut microbiota in Uox-knockout mice. Eur J Nutr. (2021) 60:2217–30. doi: 10.1007/s00394-020-02414-x
152. Zhou X, Zhang B, Zhao X, Lin Y, Wang J, Wang X, et al. Chlorogenic acid supplementation ameliorates hyperuricemia, relieves renal inflammation, and modulates intestinal homeostasis. Food Funct. (2021) 12:5637–49. doi: 10.1039/D0FO03199B
153. Xu X, Wang H, Guo D, Man X, Liu J, Li J, et al. Curcumin modulates gut microbiota and improves renal function in rats with uric acid nephropathy. Ren Fail. (2021) 43:1063–75. doi: 10.1080/0886022X.2021.1944875
154. Xiang S, Fu J, Ye K, Zheng Y, Zhu X, Chen J, et al. Effect of Lactobacillus gasseri PA3 on gut microbiota in an in vitro colonic simulation. Food Sci Nutr. (2019) 7:3883–91. doi: 10.1002/fsn3.1236
155. Ni C, Li X, Wang L, Li X, Zhao J, Zhang H, et al. Lactic acid bacteria strains relieve hyperuricaemia by suppressing xanthine oxidase activity via a short-chain fatty acid-dependent mechanism. Food Funct. (2021) 12:7054–67. doi: 10.1039/D1FO00198A
156. Wang H, Mei L, Deng Y, Liu Y, Wei X, Liu M, et al. Lactobacillus brevis DM9218 ameliorates fructose-induced hyperuricemia through inosine degradation and manipulation of intestinal dysbiosis. Nutrition. (2019) 62:63–73. doi: 10.1016/j.nut.2018.11.018
157. Han J, Wang X, Tang S, Lu C, Wan H, Zhou J, et al. Protective effects of tuna meat oligopeptides (TMOP) supplementation on hyperuricemia and associated renal inflammation mediated by gut microbiota. FASEB J. (2020) 34:5061–76. doi: 10.1096/fj.201902597RR
158. Gareau MG, Sherman PM, Walker WA. Probiotics and the gut microbiota in intestinal health and disease. Nat Rev Gastroenterol Hepatol. (2010) 7:503–14. doi: 10.1038/nrgastro.2010.117
159. Chen RJ, Chen MH, Chen YL, Hsiao CM, Chen HM, Chen SJ, et al. Evaluating the urate-lowering effects of different microbial fermented extracts in hyperuricemic models accompanied with a safety study. J Food Drug Anal. (2017) 25:597–606. doi: 10.1016/j.jfda.2016.07.003
160. Garcia-Arroyo FE, Gonzaga G, Munoz-Jimenez I, Blas-Marron MG, Silverio O, Tapia E, et al. Probiotic supplements prevented oxonic acid-induced hyperuricemia and renal damage. PLoS ONE. (2018) 13:e202901. doi: 10.1371/journal.pone.0202901
161. Li M, Yang D, Mei L, Yuan L, Xie A, Yuan J. Screening and characterization of purine nucleoside degrading lactic acid bacteria isolated from Chinese sauerkraut and evaluation of the serum uric acid lowering effect in hyperuricemic rats. PLoS ONE. (2014) 9:e105577. doi: 10.1371/journal.pone.0105577
162. Cao T, Li X, Mao T, Liu H, Tian Z. Probiotic therapy alleviates hyperuricemia in C57BL/6 mouse model. Biomed Res. (2017) 28:2244–9.
163. Han B, Gong M, Li Z, Qiu Y, Zou Z. NMR-based metabonomic study reveals intervention effects of polydatin on potassium oxonate-induced hyperuricemia in rats. Oxid Med Cell Longev. (2020) 2020:6943860. doi: 10.1155/2020/6943860
164. Gang LA, Xc A, Xiang LA, Jz A, Xl B. Sunflower head enzymatic hydrolysate relives hyperuricemia by inhibiting crucial proteins (xanthine oxidase, adenosine deaminase, uric acid transporter1) and restoring gut microbiota in mice. J Funct Foods. (2020) 72:104055. doi: 10.1016/j.jff.2020.104055
165. Lou XJ, Wang YZ, Lei SS, He X, Lu TT, Zhan LH, et al. Beneficial effects of macroporous resin extract of dendrobium candidum leaves in rats with hyperuricemia induced by a high-purine diet. Evid Based Complement Alternat Med. (2020) 2020:3086106. doi: 10.1155/2020/3086106
166. Guo LF, Chen X, Lei SS, Li B, Zhang NY, Ge HZ, et al. Effects and mechanisms of dendrobium officinalis six nostrum for treatment of hyperuricemia with hyperlipidemia. Evid Based Complement Alternat Med. (2020) 2020:2914019. doi: 10.1155/2020/2914019
167. Mehmood A, Zhao L, Wang C, Hossen I, Raka RN, Zhang H. Correction: stevia residue extract increases intestinal uric acid excretion via interactions with intestinal urate transporters in hyperuricemic mice. Food Funct. (2020) 11:2764. doi: 10.1039/D0FO90011G
168. Wang Y, Lin Z, Zhang B, Nie A, Bian M. Cichorium intybus L. promotes intestinal uric acid excretion by modulating ABCG2 in experimental hyperuricemia. Nutr Metab. (2017) 14:38. doi: 10.1186/s12986-017-0190-6
169. Xiang-Wei XU, Niu YF, Gao LH, Ling LI, Lin H. Analysis of hypouricemic mechanism of mangiferin based on intestinal urate transporter ABCG2. Chin J Exp Tradit Med Formulae. (2018) 24:145–9.
170. Zhang Y, Jin L, Liu J, Wang W, Yu H, Li J, et al. Effect and mechanism of dioscin from Dioscorea spongiosa on uric acid excretion in animal model of hyperuricemia. J Ethnopharmacol. (2018) 214:29–36. doi: 10.1016/j.jep.2017.12.004
171. Kondratiuk VE, Tarasenko OM, Karmazina OM, Taranchuk VV. Impact of the synbiotics and urate-lowering therapy on gut microbiota and cytokine profile in patients with chronic gouty arthritis. J Med Life. (2020) 13:490–8. doi: 10.25122/jml-2020-0065
172. Tarasenko O, Kondratiuk V, Taranchuk V, Karmazina O, Karmazin Y. [; The effect of complex reducing therapy with the addition of a synbiotic on the dynamics of clinical and laboratory parameters in patients with chronic gouty arthritis]. Georgian Med News. (2020) (304–305):48–56.
173. Nakagawa T, Tuttle KR, Short RA, Johnson RJ. Hypothesis: fructose-induced hyperuricemia as a causal mechanism for the epidemic of the metabolic syndrome. Nat Clin Pract Nephrol. (2005) 1:80–6. doi: 10.1038/ncpneph0019
174. Williams PT. Effects of diet, physical activity and performance, and body weight on incident gout in ostensibly healthy, vigorously active men. Am J Clin Nutr. (2008) 87:1480–7. doi: 10.1093/ajcn/87.5.1480
175. Appel LJ, Moore TJ, Obarzanek E, Vollmer WM, Svetkey LP, Sacks FM, et al. A clinical trial of the effects of dietary patterns on blood pressure. DASH Collaborative Research Group. N Engl J Med. (1997) 336:1117–24. doi: 10.1056/NEJM199704173361601
176. Juraschek SP, Gelber AC, Choi HK, Appel LJ, Miller ER. Effects of the Dietary Approaches to Stop Hypertension (DASH) diet and sodium intake on serum uric acid. Arthritis Rheumatol. (2016) 68:3002–9. doi: 10.1002/art.39813
177. Rai SK, Fung TT, Lu N, Keller SF, Curhan GC, Choi HK. The Dietary Approaches to Stop Hypertension (DASH) diet, western diet, and risk of gout in men: prospective cohort study. BMJ. (2017) 357:j1794. doi: 10.1136/bmj.j1794
178. Pineli LL, Moretti CL, Rodrigues JS, Ferreira DB, Chiarello MD. Variations in antioxidant properties of strawberries grown in Brazilian savannah and harvested in different seasons. J Sci Food Agric. (2012) 92:831–8. doi: 10.1002/jsfa.4654
179. Gao X, Curhan G, Forman JP, Ascherio A, Choi HK. Vitamin C intake and serum uric acid concentration in men. J Rheumatol. (2008) 35:1853–8.
180. Huang HY, Appel LJ, Choi MJ, Gelber AC, Charleston J, Norkus EP, et al. The effects of vitamin C supplementation on serum concentrations of uric acid: results of a randomized controlled trial. Arthritis Rheum. (2005) 52:1843–7. doi: 10.1002/art.21105
181. Jacob RA, Spinozzi GM, Simon VA, Kelley DS, Prior RL, Hess-Pierce B, et al. Consumption of cherries lowers plasma urate in healthy women. J Nutr. (2003) 133:1826–9. doi: 10.1093/jn/133.6.1826
Keywords: fructose, gut microbiota, hyperuricemia, gout, interaction
Citation: Fang X-y, Qi L-w, Chen H-f, Gao P, Zhang Q, Leng R-x, Fan Y-g, Li B-z, Pan H-f and Ye D-q (2022) The Interaction Between Dietary Fructose and Gut Microbiota in Hyperuricemia and Gout. Front. Nutr. 9:890730. doi: 10.3389/fnut.2022.890730
Received: 06 March 2022; Accepted: 14 April 2022;
Published: 22 June 2022.
Edited by:
Ren-You Gan, Institute of Urban Agriculture (CAAS), ChinaReviewed by:
Rongrong Li, Peking Union Medical College Hospital (CAMS), ChinaCopyright © 2022 Fang, Qi, Chen, Gao, Zhang, Leng, Fan, Li, Pan and Ye. This is an open-access article distributed under the terms of the Creative Commons Attribution License (CC BY). The use, distribution or reproduction in other forums is permitted, provided the original author(s) and the copyright owner(s) are credited and that the original publication in this journal is cited, in accordance with accepted academic practice. No use, distribution or reproduction is permitted which does not comply with these terms.
*Correspondence: Dong-qing Ye, eWRxQGFobXUuZWR1LmNu
Disclaimer: All claims expressed in this article are solely those of the authors and do not necessarily represent those of their affiliated organizations, or those of the publisher, the editors and the reviewers. Any product that may be evaluated in this article or claim that may be made by its manufacturer is not guaranteed or endorsed by the publisher.
Research integrity at Frontiers
Learn more about the work of our research integrity team to safeguard the quality of each article we publish.