 Lianlong Yu
 Han Zhou
 Fengjia Zheng1
 Jian Song
 Yutong Lu
 Xiao Yu
 Changsheng Zhao
94% of researchers rate our articles as excellent or good
Learn more about the work of our research integrity team to safeguard the quality of each article we publish.
Find out more
ORIGINAL RESEARCH article
Front. Nutr., 28 June 2022
Sec. Nutritional Epidemiology
Volume 9 - 2022 | https://doi.org/10.3389/fnut.2022.885704
This article is part of the Research TopicPrecision Nutrition, Diet Quality, Health Behavior Change, Gut Microbiota, and Environmental Sustainability to target the Management of ObesityView all 7 articles
To evaluate association between overweight/obesity and sugar-sweetened beverages (SSB) types, SSB sugar, among children and adolescents. A total of 1,068 children and 751 adolescents were identified from a provincial survey conducted in Shandong, China. χ2 tests, logistic regression, restricted cubic spline (RCS), mediation analysis, pathway analysis, and ordinary least square (OLS) regression were applied to test association among overweight/obesity, SSB sugar, SSB types, and a set of factors. The mean daily SSB intake for children and adolescents was 210.7 and 208 ml, respectively. The threshold of SSB sugar consumption causing overweight/obesity was around 25 g/day and verified by RCS based on logistic regression. Approximately, 44.8% of the study subjects consumed more than 25 g/day of SSB sugar. SSB sugar intake above 25 g/day resulted in higher risk of overweight/obesity (OR = 1.391, 95% CI, 1.115–1.734). The effects of all types of SSBs on overweight/obesity were fully mediated by SSB sugar (p < 0.05), except for milk. Consumption of any types of SSBs had a positive impact on SSB sugar intake in both children and adolescents. Any type of SSB intake was a risk factor in excessive intake of SSB sugar (OR > 1, p < 0.05). In particular, milk powder, tea, and tea-flavored drinks, and carbonated have greater ORs for excessive intake of SSB sugar (OR = 76.08, 8.879, 4.355, p < 0.05, respectively). It was found that the effect of SSB on overweight/obesity was mediated by the intake of SSB sugar, and the effects of various SSBs were different according to multiple linear regression and pathway analysis (p < 0.05, respectively).
The prevalence of obesity in children and adolescents was increasing year by year in countries around the world, and the burden of various chronic diseases caused by this has become a serious public health problem (1). More than 380 million children and adolescents worldwide were suffering from obesity and related chronic diseases (2). Shandong Province was a coastal province in eastern China. As of 2020, the total population of Shandong has reached 101.06 million. Worryingly, the prevalence of overweight and obesity among children and adolescents in Shandong Province was 15.05 and 9.23%, respectively, in (3). According to previous reports in the literature, consumption of sugar-sweetened beverages (SSB) may be one of the causes of overweight and obesity (4–6). Some papers have also shown that high SSB intake was strongly associated with youth overweight and obesity (7–10). In the past years, SSB intake has increased among United States youth (11), which has become a major source of calories in the diets (12). The daily consumption of SSBs among people over 1 year old in South Korea increased from an average of 86.6 grams to 184.5 grams from 2008 to 2018, and the consumption more than doubled in 10 years (13). In the past decades, the SSBs consumption in Chinese children and adolescents has increased significantly. Meanwhile, SSBs were risk factors in obesity and hypertension in children and adolescents. In recent years, the prevalence of obesity and hypertension among Chinese children and adolescents has also increased (14).
On the contrary, some of the studies focused on contributing calories of the SSB (15). Because they believed that the main reason SSB cause overweight/obesity was providing body with surplus energy. Nevertheless, the dose-response relationship between overweight/obesity and SSB sugar intake has been less investigated in children and adolescents. The threshold at which SSBs sugar contributes to overweight and obesity also needs to explore. It was also unclear whether SSBs sugar played a dominant role in causing overweight/obesity. Meanwhile, the contribution of different types of SSB to the risk of excess sugar was also an issue that needs to be clarified. All of these would guide SSB types choice of children and adolescents.
Therefore, the objectives of this study were to investigate the relationship between overweight/obesity SSBs and SSB sugar, and to explore whether SSBs affect overweight/obesity directly or mediated through SSB sugar, and whether the type of SSB affects SSB sugar intake and overweight/obesity in children (6–12 years) and adolescents (13–18 years old).
The data for this study were derived from the SSB consumption data collected by the Shandong Provincial Center for Disease Control and Prevention from 2013 to 2016. The data were based on a cross-sectional survey of multistage stratified regional probability sampling of individual children aged 6–18. Samples were drawn from ten cities in Shandong Province using a hierarchical multistage clustering random process. The investigation cities included Jinan, Qingdao, Dongying, Jining, Laiwu, Liaocheng, Linyi, Taian, Weifang, and Yantai. According to geographical location, eating habits, and economic conditions, 10 survey sites were selected in Shandong Province, primary and secondary schools were randomly sampled, and classes were randomly sampled according to grade distribution. The male-to-female ratio was 1:1, and the urban-rural population ratio was 1:2. The final study population included 1,068 children aged 6–18 and 751 adolescents, which included SSB intake and height and weight data. This study was reviewed by the Ethics Committee of the Shandong Provincial Center for Disease Control and Prevention.
Sugar-sweetened beverages were defined as beverages that contain added caloric sweeteners, such as sugar or high-fructose corn syrup (16, 17). According to the food category in FCT (food composition table) 2002/2004 and actual situation in the Chinese market, SSBs were classified as follows: carbonated, fruit vegetable juice, vegetable protein drink, tea and tea-flavored drinks, coffee, milk (containing added sugar), milk powder, yogurt, milk-containing drinks and cheese, all of which containing added sugar.
The 24-h SSB recall method was used to estimate SSB consumption levels among 6–18 years old children. A 24-h recall for 3 days was performed on each subject by uniformly trained investigators. The investigation was completed in the presence of the children’s guardians. At the same time, for children with insufficient cognitive ability, their guardians completed the information response. In this survey, weight was measured using a uniform and calibrated scale, the subjects were asked to wear light clothing, measurements were accurate to 0.1 kg, height was measured using a portable range finder, the subjects were asked to wear no shoes, and measurements were accurate to 0.1 cm. BMI was equal to weight (kg) divided by height (meters) squared. In this study, height and weight were measured using uniformly purchased medical-grade equipment, and the investigators were uniformly trained medical staff. For χ2 tests, three weight status categories (normal, overweight, and obesity) were classified based on the Chinese standard reported by Group of China Obesity Task Force (18). For logistic regression analysis, a positive outcome for the outcome variable was defined as being overweight or obesity. SSB intake was dichotomized by ≥ 200 ml/day based on SSB consumption distribution and daily SSB consumption packaging units. And SSB sugar intake was dichotomized by ≥ 25 g/day based on the suggestion of “Dietary Guidelines for Chinese Residents” (19).
Demographically, SSB composition and types of SSB were gathered as exposure variables. Demographic factors included age (6–18 years), gender, region (urban and rural), and weight status. The weight status of children and adolescents was divided using the unified Chinese standard “China’s Growth Chart,” which was based on the age- and gender-specific body mass index (BMI, kg/m2) distribution of the large population, and the weight status was divided into normal weight (≥5 to <85%), overweight (≥85 to <90%), and obese (≥90%) (18). Consumption variables included SSB intake of various categories. Analysis of SSB sugar intake was based on Chinese FCT 2002/2004 and the China FCD system.
Chi-square tests were used to compare the percentage of gender, child and adolescents, and region in different weight statuses (normal, overweight, and obesity). Odds ratios (ORs) and 95% confidence intervals (CIs) for overweight/obesity-related variables were estimated by logistic regression models. Multivariable logistic regression models were adjusted for possible confounding factors: gender, age, region, SSB intake, SSB categories. The relationships between SSB sugar intake and SSB categories were assessed by multiple linear regression models, adjusting for sex, age, and region. Restricted cubic spline (RCS) based on logistic regression equation models was used to evaluate the associations between levels of SSB sugar intake and overweight/obesity. Mediation analysis and pathway analysis were utilized to assess the relationship among SSB consumption, SSB sugar intake, and overweight/obese. R4.1.2 was used for data statistical analyses and graphing. P-value < 0.05 was considered statistically significant.
The average of SSB consumption among 6–18-year-old children and adolescents was 209.6 ml/day, 203.8 ml/day for males, 215.4 ml/day for females, 210.7 ml/day for those aged 6–12 years, and 208 ml/day for those aged 13–18 years. Overall, SSB intake for each quartile was 60.5 ml/day for Q1, 152.1 ml/day for Q2, 278.6 ml/day for Q3, and 450 ml/day for the 90th percentile. Sugar intake (from SSB) of ≥ 25 g/day was found in 44.8% of the children and adolescents. Figure 1 shows the intake of SSB sugar in different gender and age groups. Table 1 shows demographic characteristics and weight status (normal, overweight, and obesity). Based on χ2 tests, there were differences in the distribution of weight status among different types of gender, age groups, and regions. Table 2 showed the consumption of different types of beverages by children and adolescents.
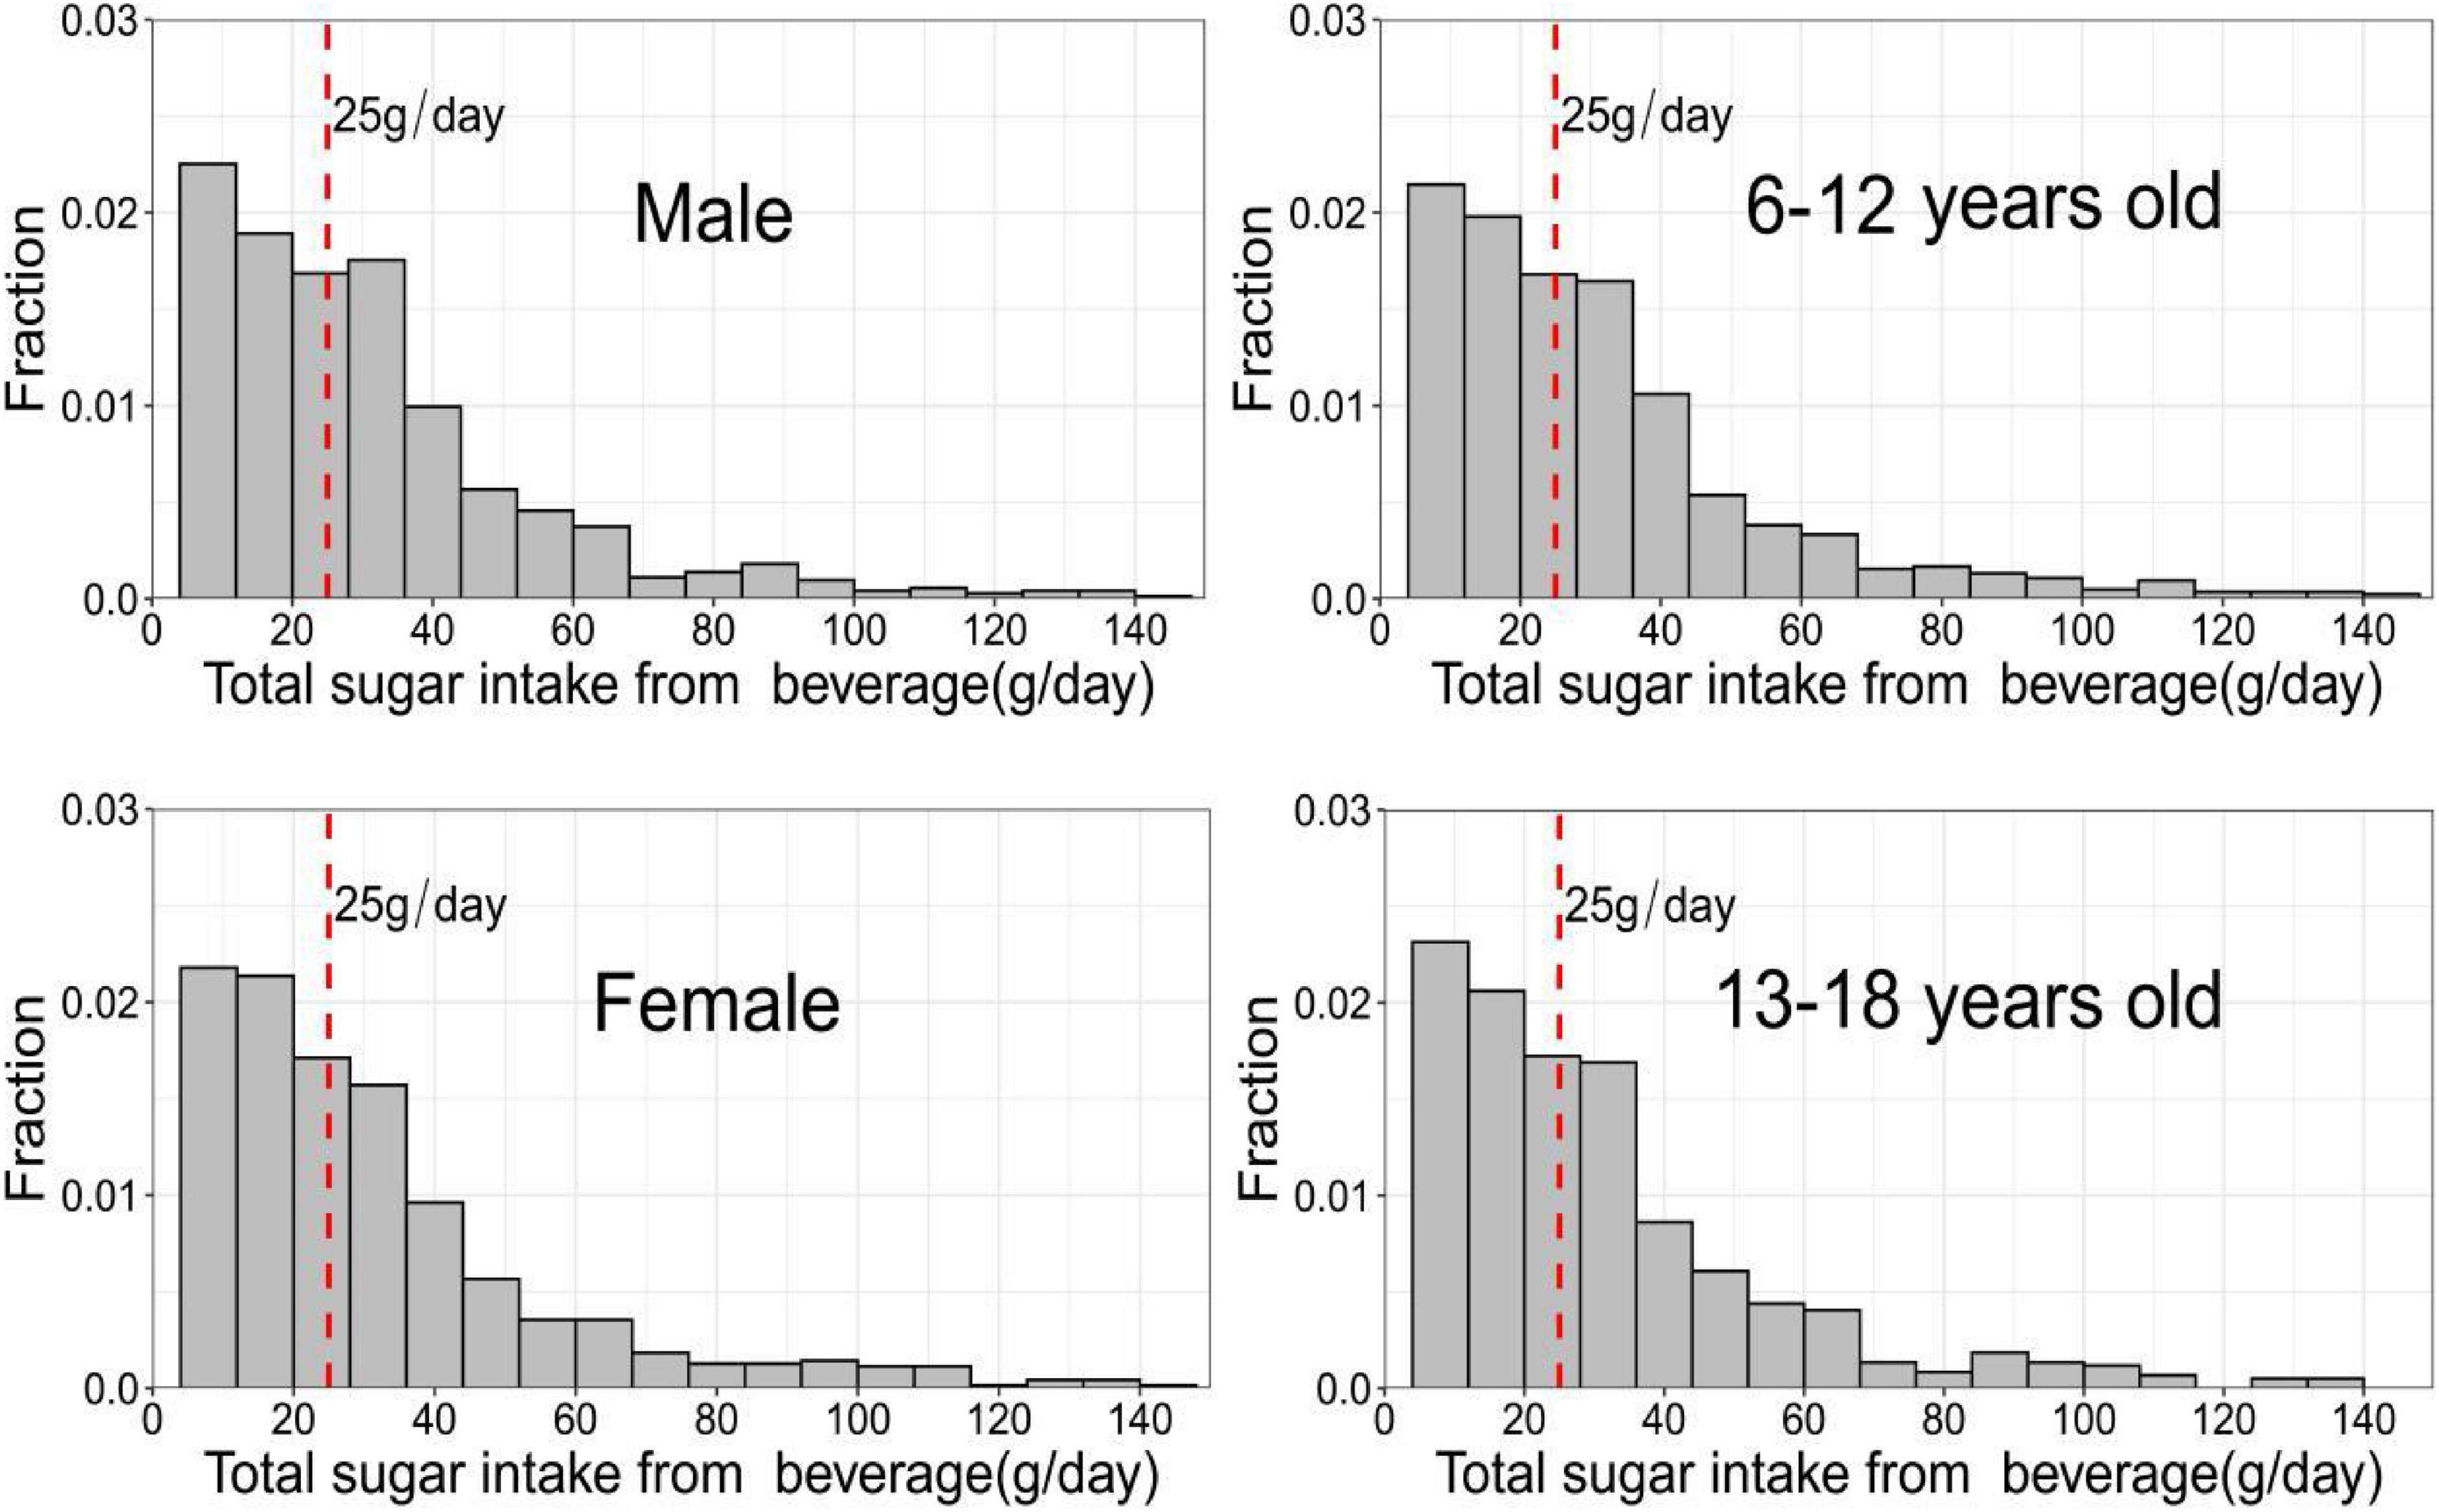
Figure 1. Sugar intake from beverages in different age and gender groups.
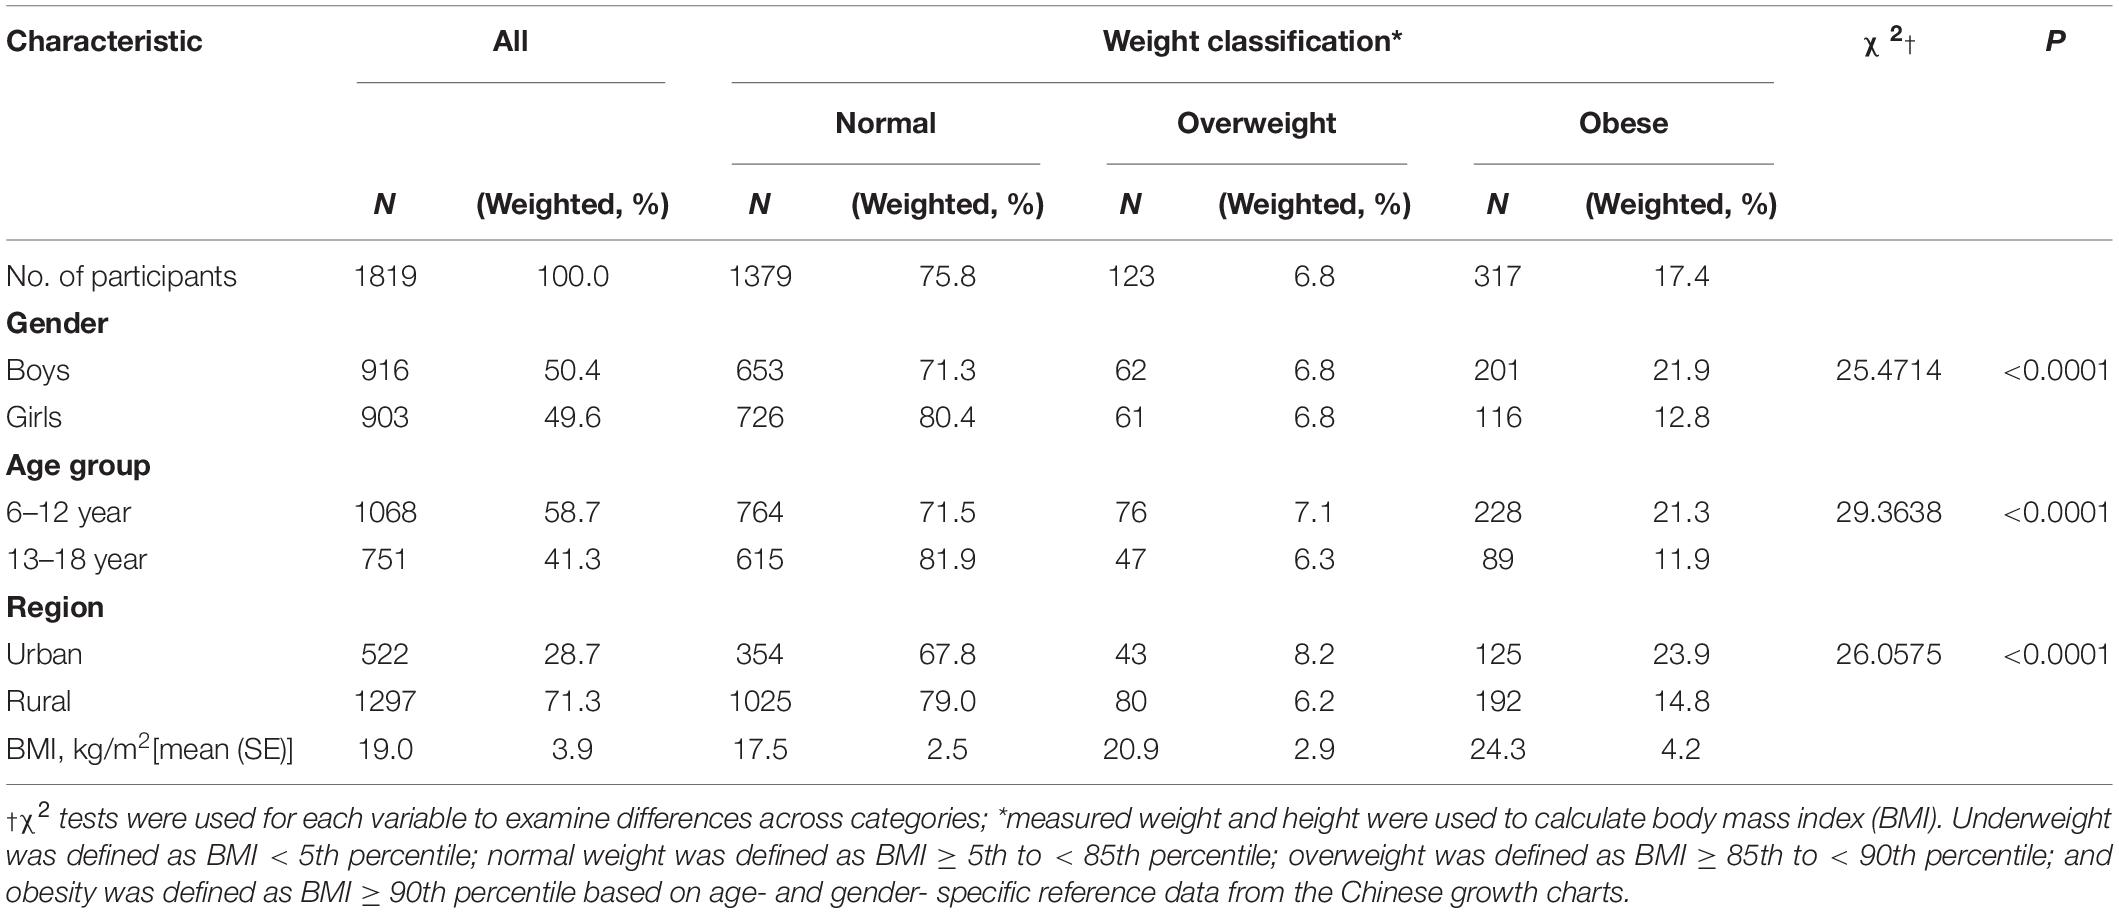
Table 1. Characteristics of study subjects and their associations with weight status among 6–18 years in Shandong, China.
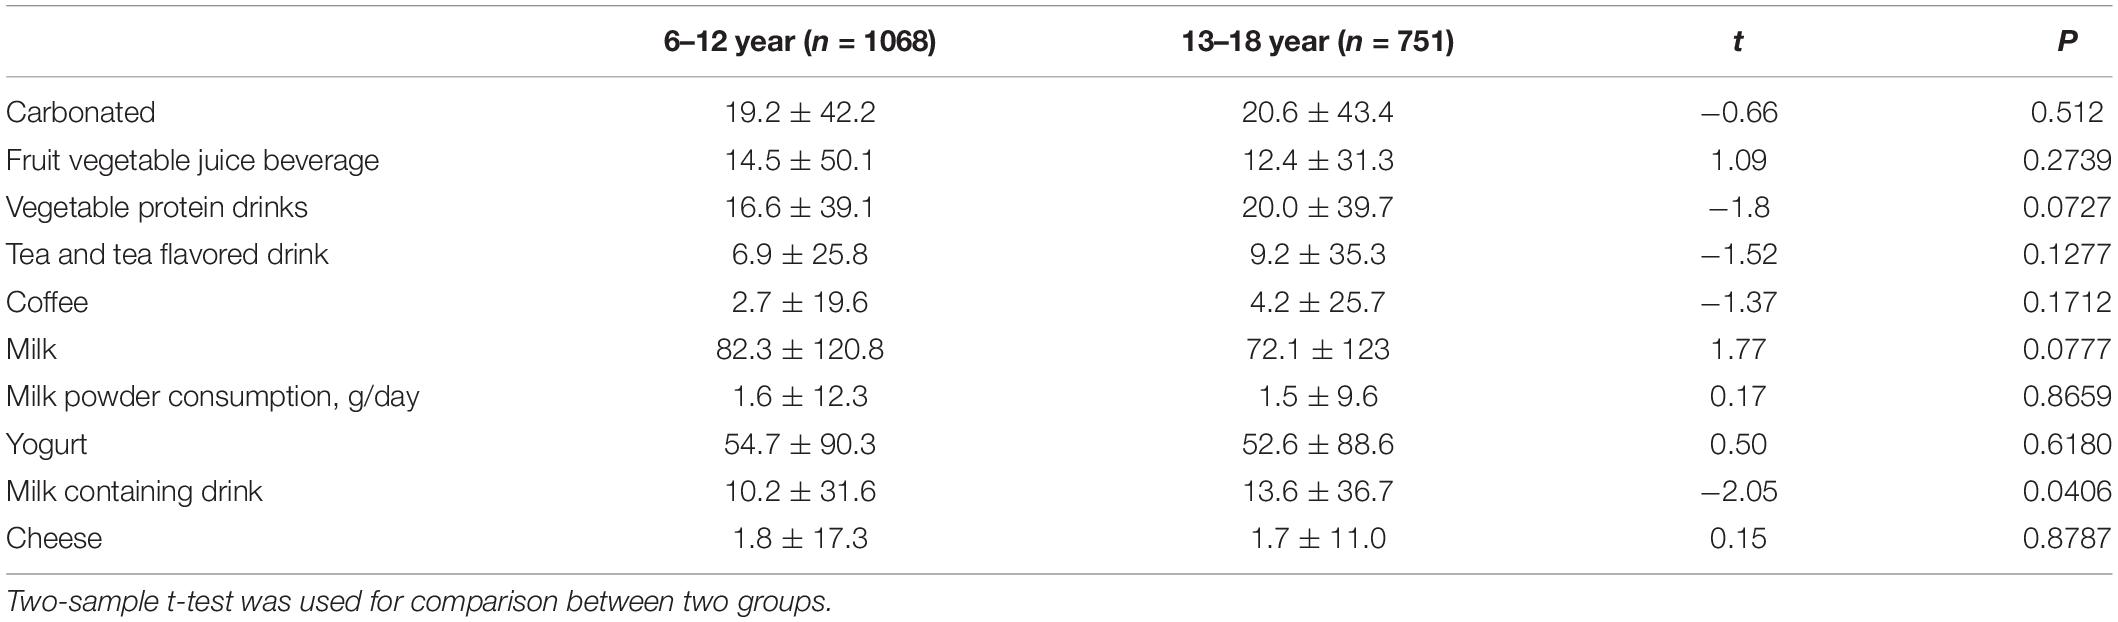
Table 2. Consumption of various types of SSBs in children and adolescents (mean ± SD).
Meanwhile, based on the t-test, SSB sugar intake, total SSB consumption, and some kinds of SSB consumption differed significantly by weight classification (data not shown). As shown in Table 3, there were differences in the results of univariate and multivariate logistic regression analyses. In univariate logistic regression results, the OR for overweight/obesity was significantly different by gender, age group, region, summary SSB intake, fruit and vegetable juice intake, vegetable protein beverage intake, and sugar intake (from SSB). However, the adjusted OR for overweight/obese in multivariable logistic regression analysis did not differ significantly by intake of fruit and vegetable juice and vegetable protein drinks. The RCS using P25 (9.06 g/day) of SSB sugar intake as the reference line showed that the risk of overweight/obesity was increased when the intake was > 25 g (Figure 2).
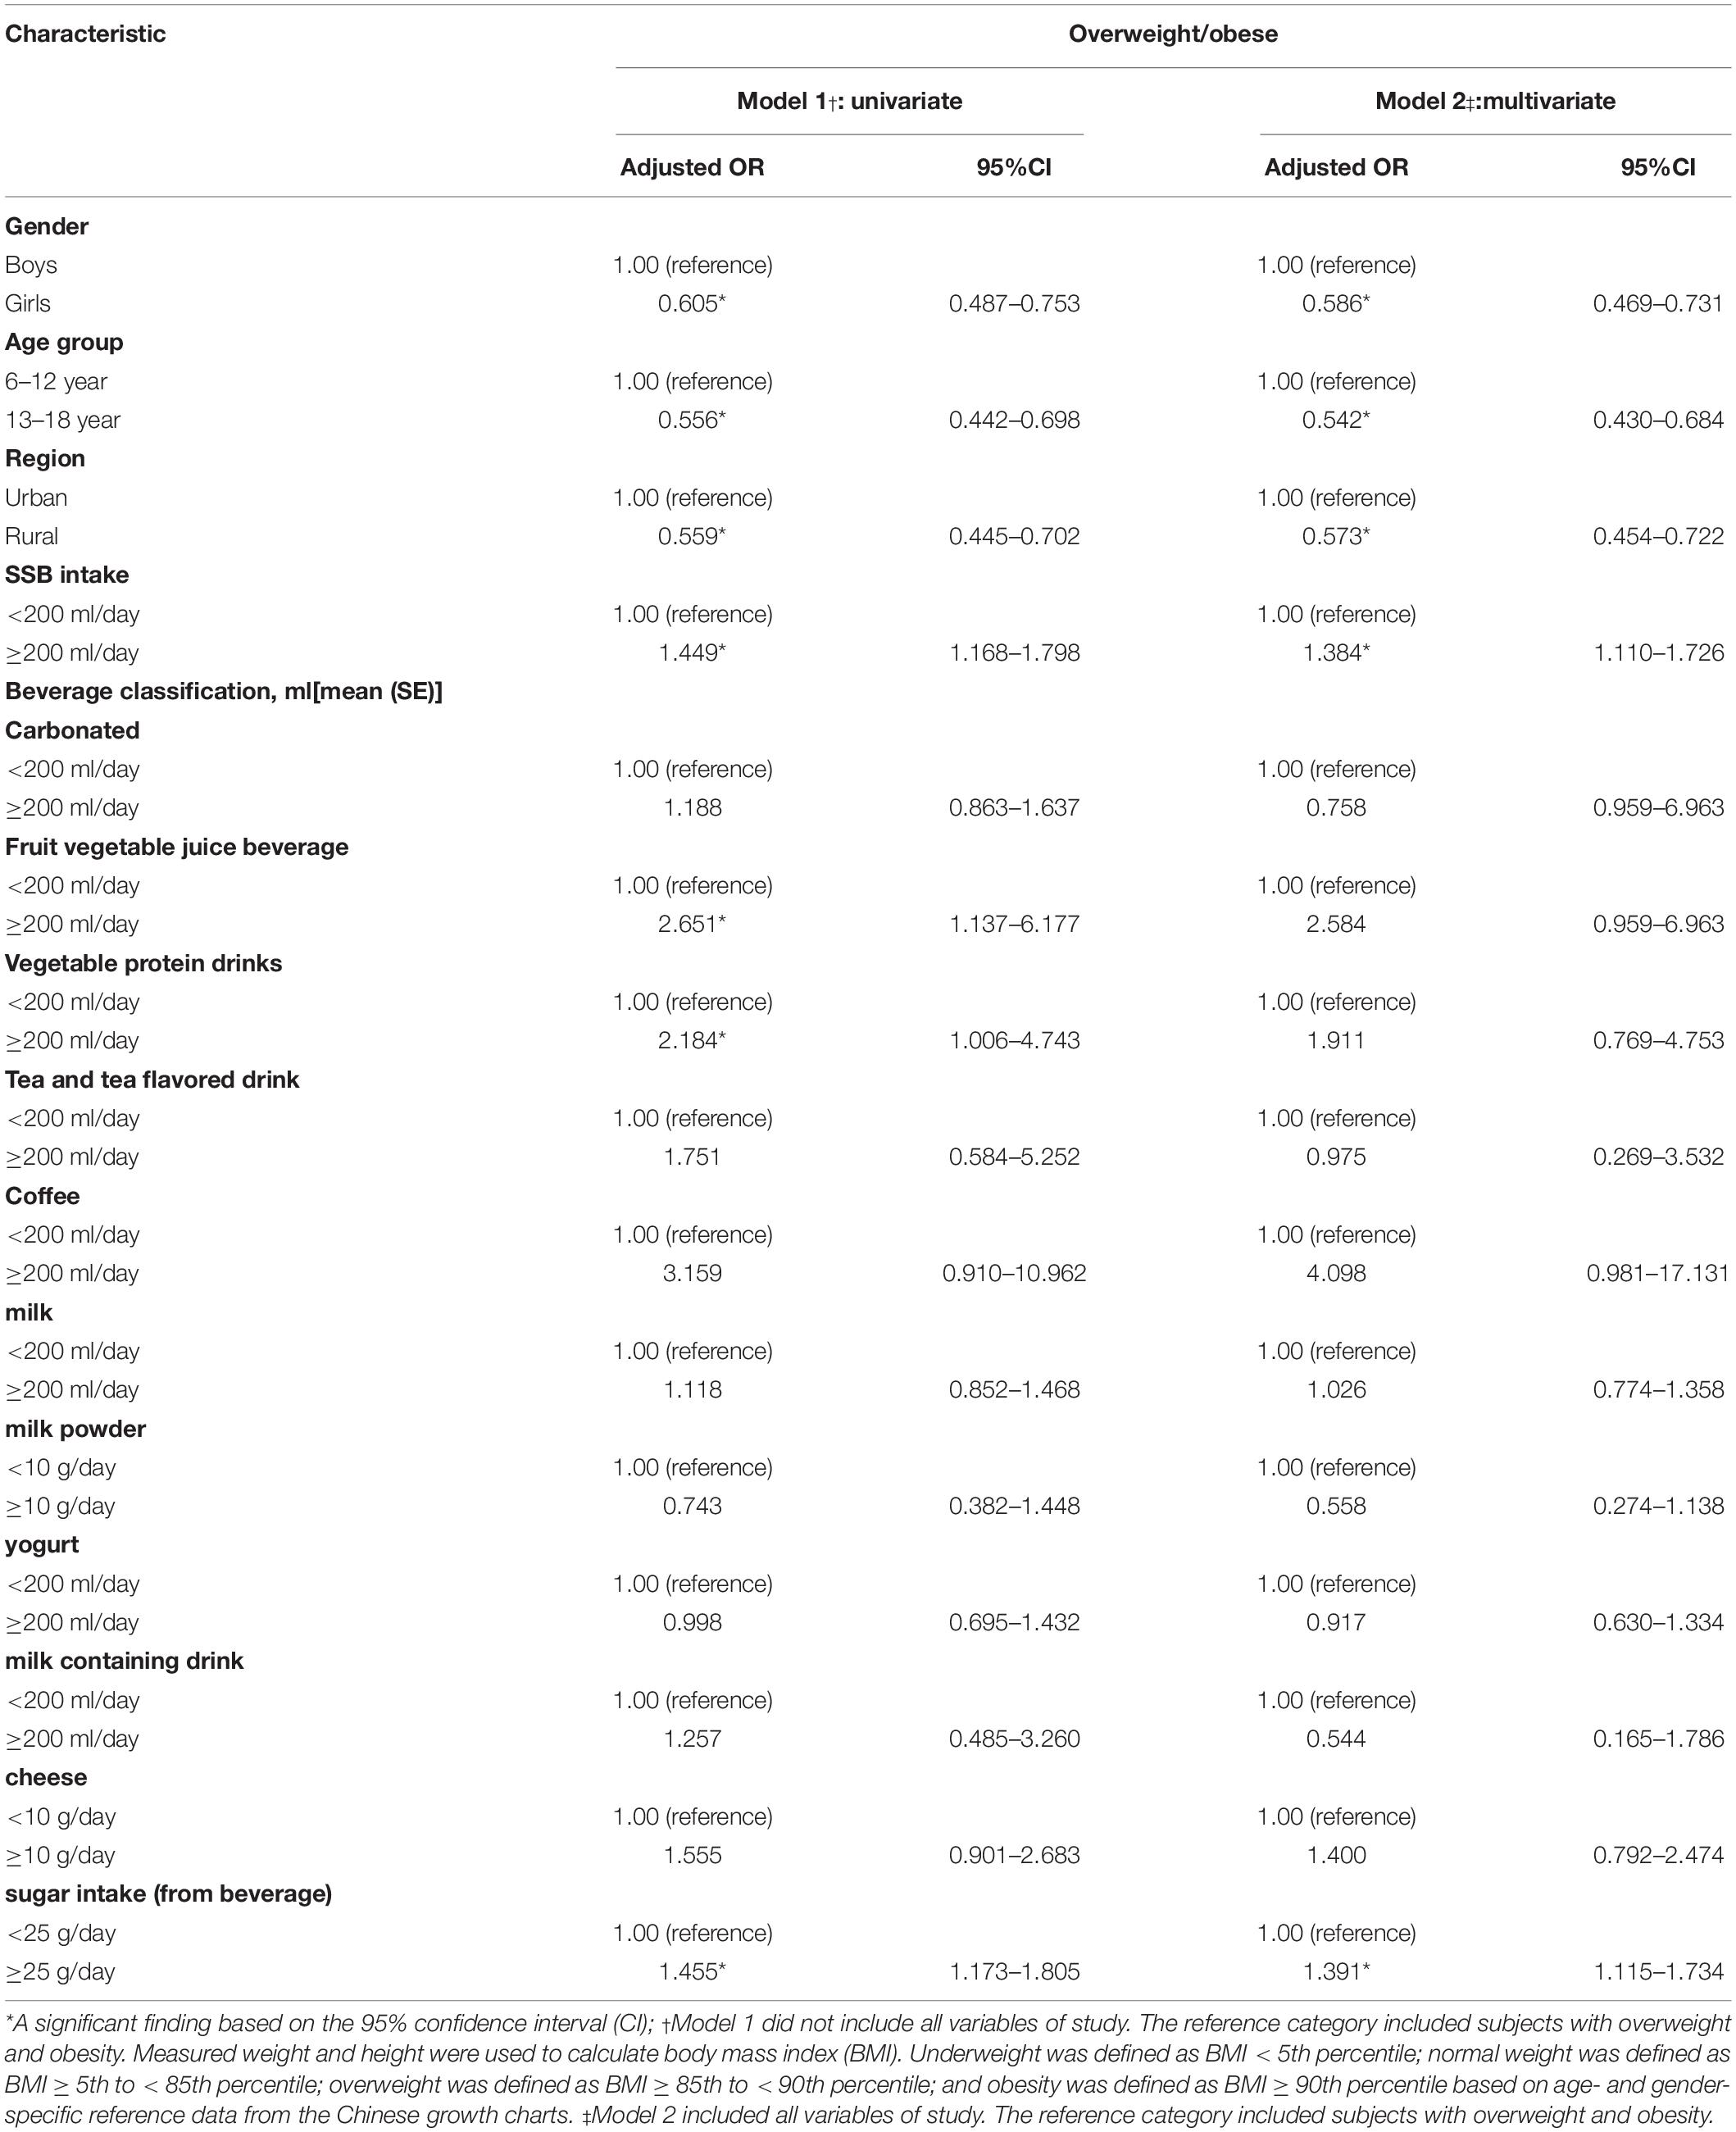
Table 3. Adjusted odds ratios for variables associated with overweight/obese among 6–18 years in Shandong, China.
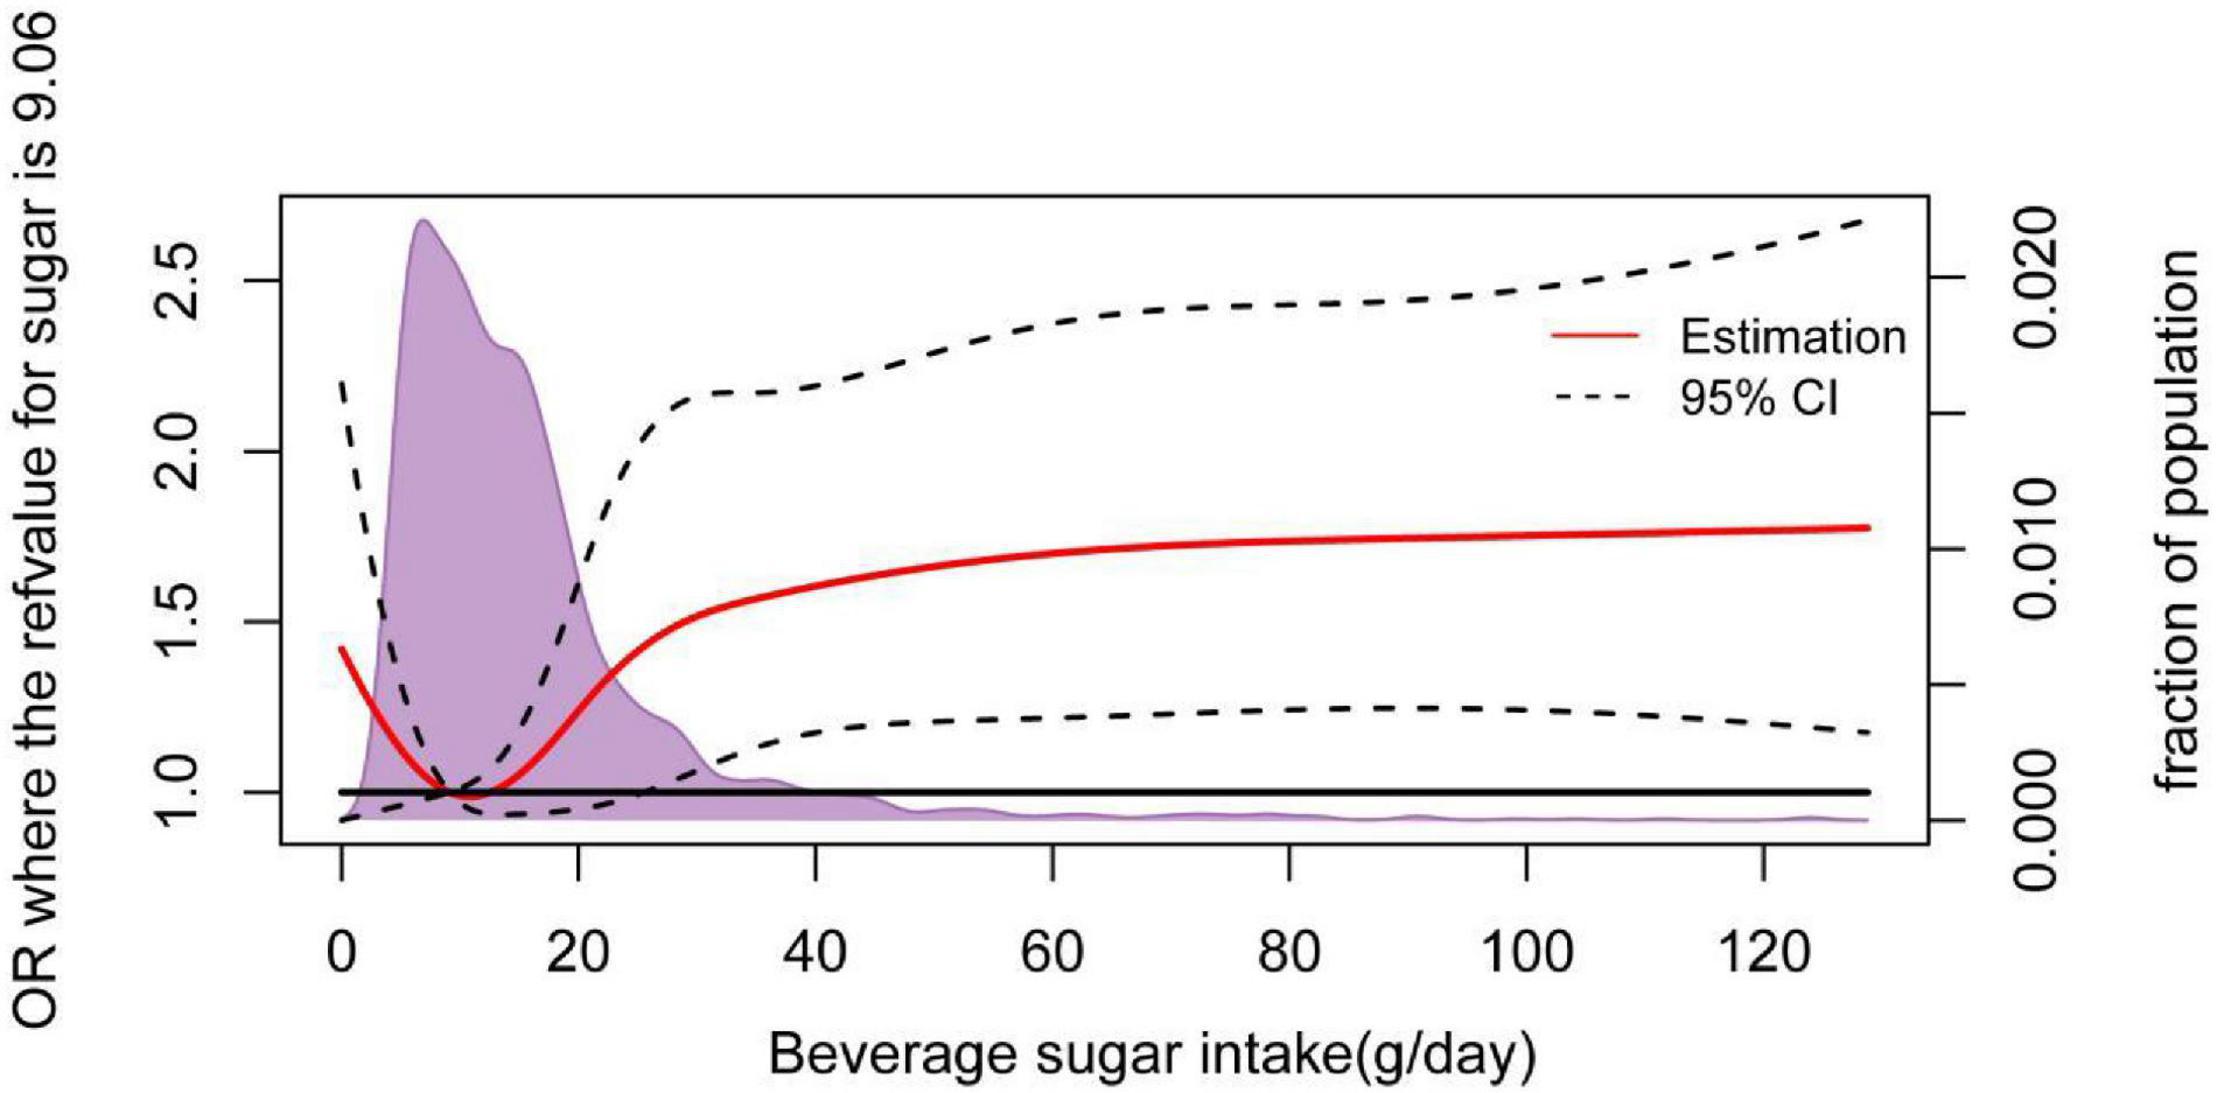
Figure 2. An adjusted odds ratio for beverage sugar intake and overweight/obesity using restricted cubic spline (RCS) analysis. The RCS model adjusted for age, gender, and region. The solid red line is the multivariate adjusted hazard ratio, and the dashed line shows the 95% confidence interval from restricted cubic spline regression. The unassociated reference line is shown in solid bold based on the basic and beverage consumption data, gathered by the Shandong Center for Disease Control and Prevention from 2013 to 2016.
According to the food composition database source from Chinese FCT 2002/2004 and the China FCD system, the mean sugar content of carbonated, fruit vegetable juice, vegetable protein drinks, tea and tea-flavored drinks, coffee, milk (containing added sugar), milk powder, yogurt, milk-containing drinks, and cheese was 13.8 g/100 ml, 9.1 g/100 ml, 5.9 g/100 ml, 10.7 g/100 ml, 10.5 g/100 ml, 5.9 g/100 ml, 58.4 g/100 g, 11.4 g/100 ml, 11.4 g/100 ml, 12.6 g/100 ml. Among them, the sugar intake from milk, yogurt, and carbonated drinks was higher, and there were different types of SSBs consumption in different age groups and types of gender. Figure 3 shows sugar sources in SSBs for different age and gender groups.
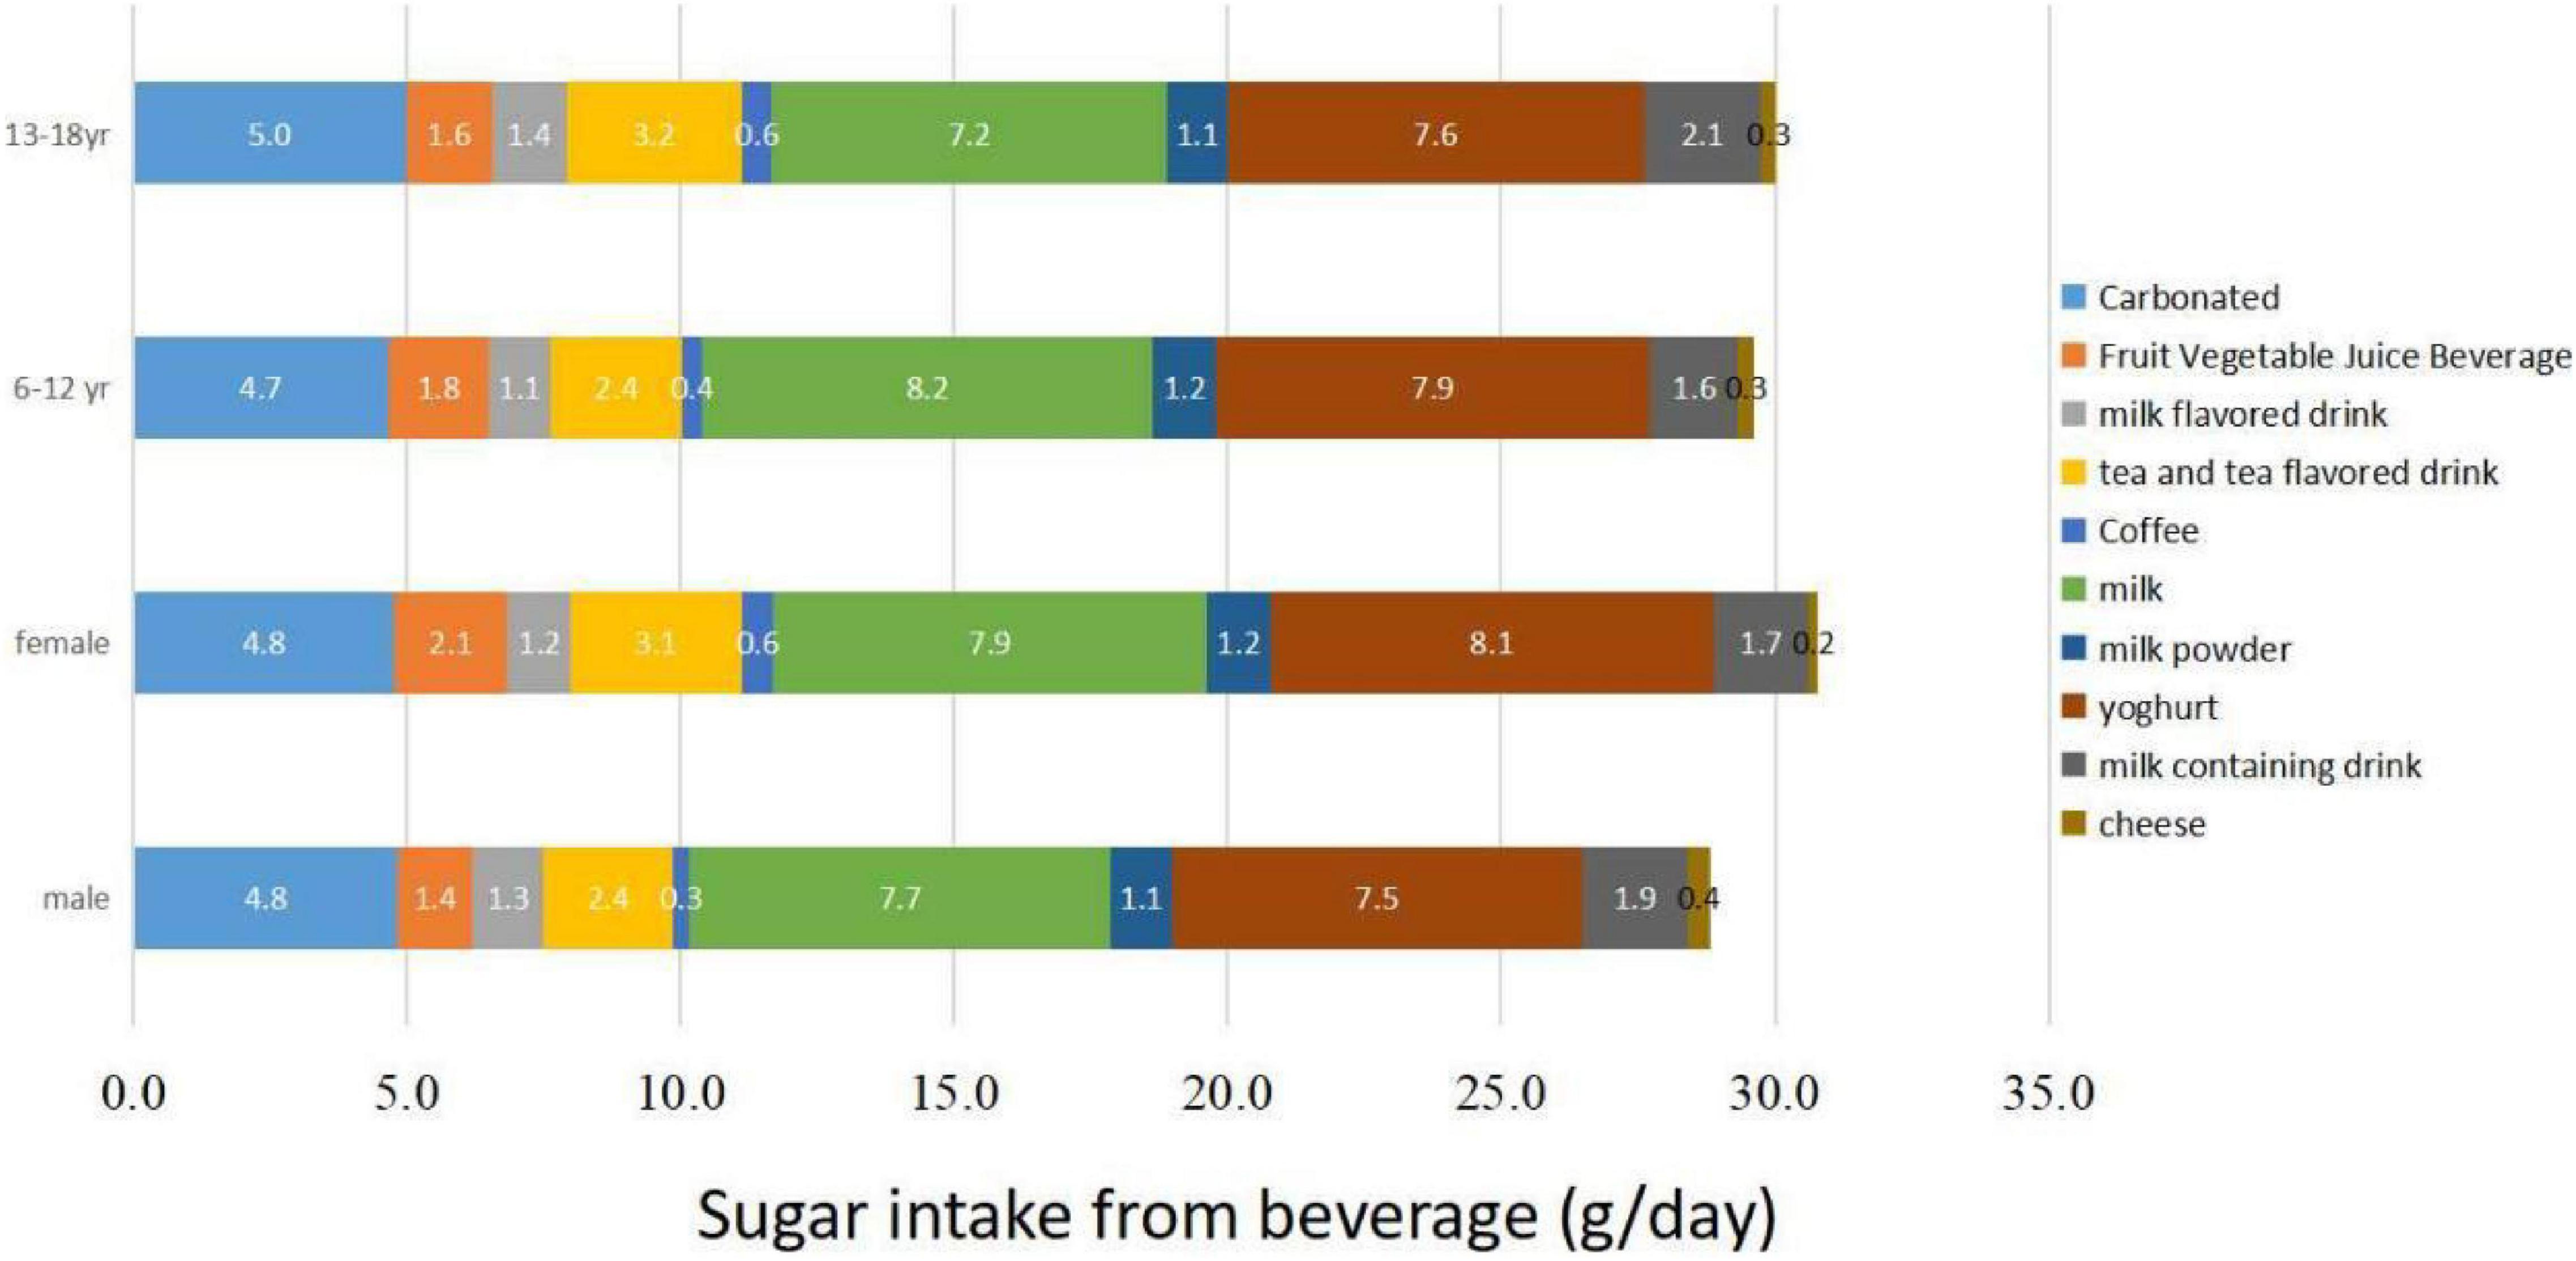
Figure 3. Beverage sources of sugar in different age and gender groups.
Table 4 shows the consumption of different SSB categories for children and adolescents and the relationship between different SSB categories and total SSB sugar intake. The relationships were tested using multiple linear regression models in this table. Based on the linear regression model adjusted for sex, BMI and region, the consumption of carbonated, fruit vegetable juice, vegetable protein drinks, tea and tea-flavored drinks, coffee, milk, milk powder, yogurt, milk-containing drinks, and cheese has positive effect on sugar intake (a source from SSB) both in children and adolescents. As shown in Table 5, all types of SSB intake were risk factors in excessive SSBs sugar intake (≥25 g/day) in children and adolescents (OR > 1, p < 0.05).
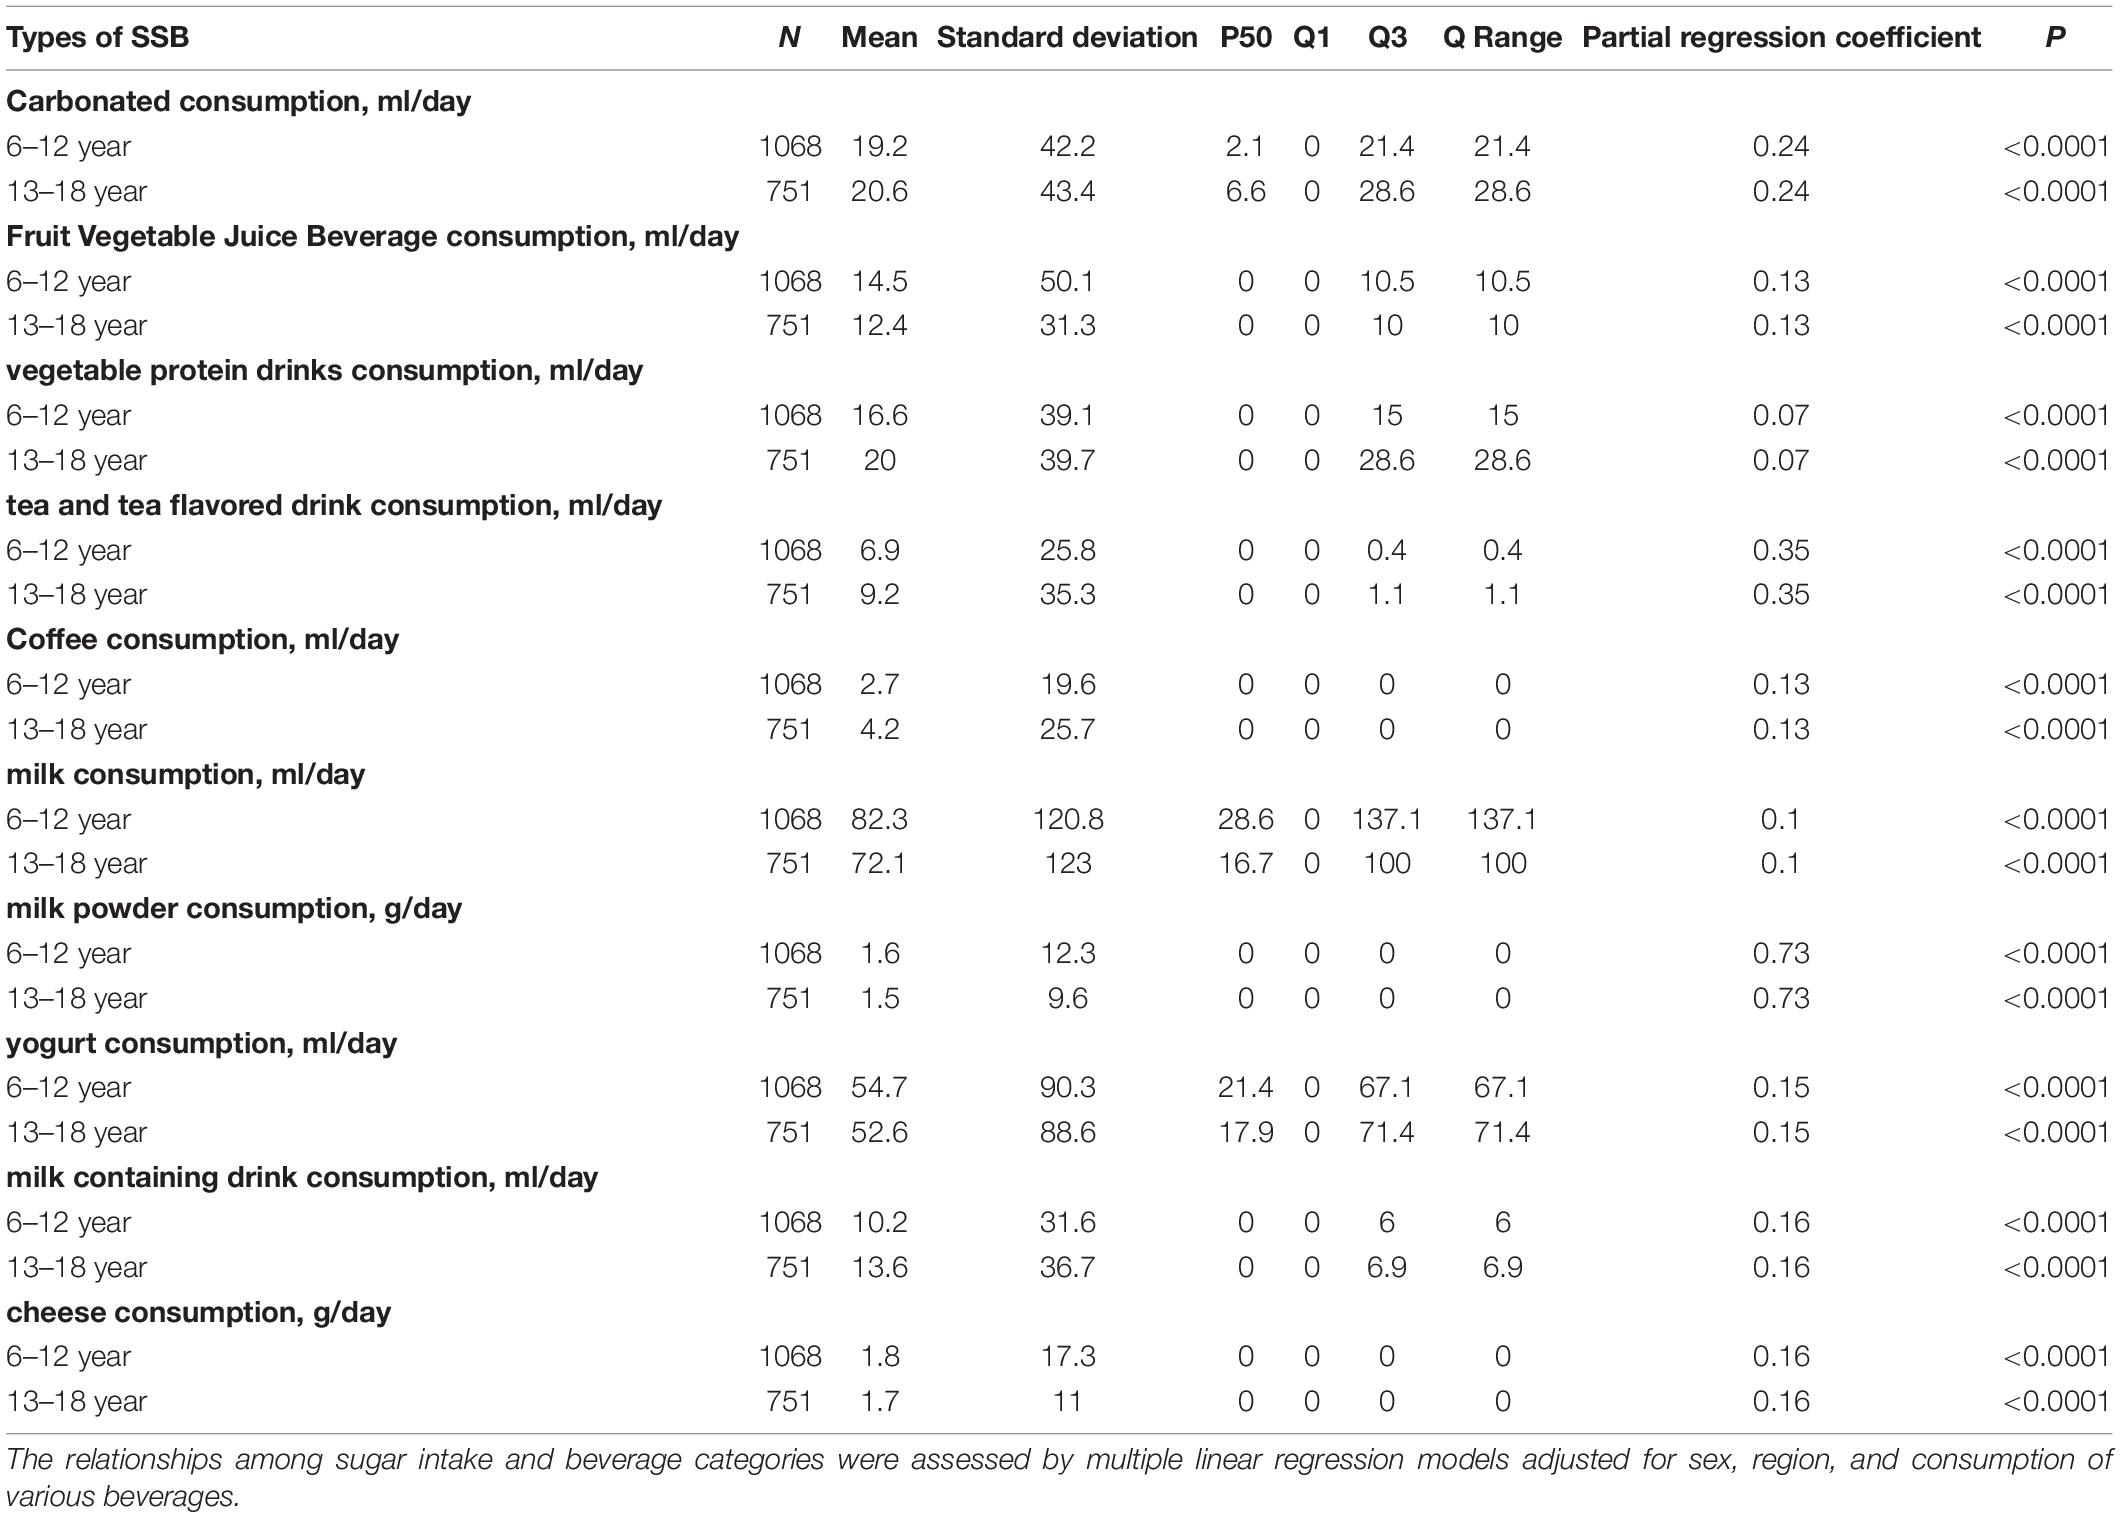
Table 4. Relationships between sugar intake from SSB and different types of beverage consumption among 6–18 years in Shandong, China.
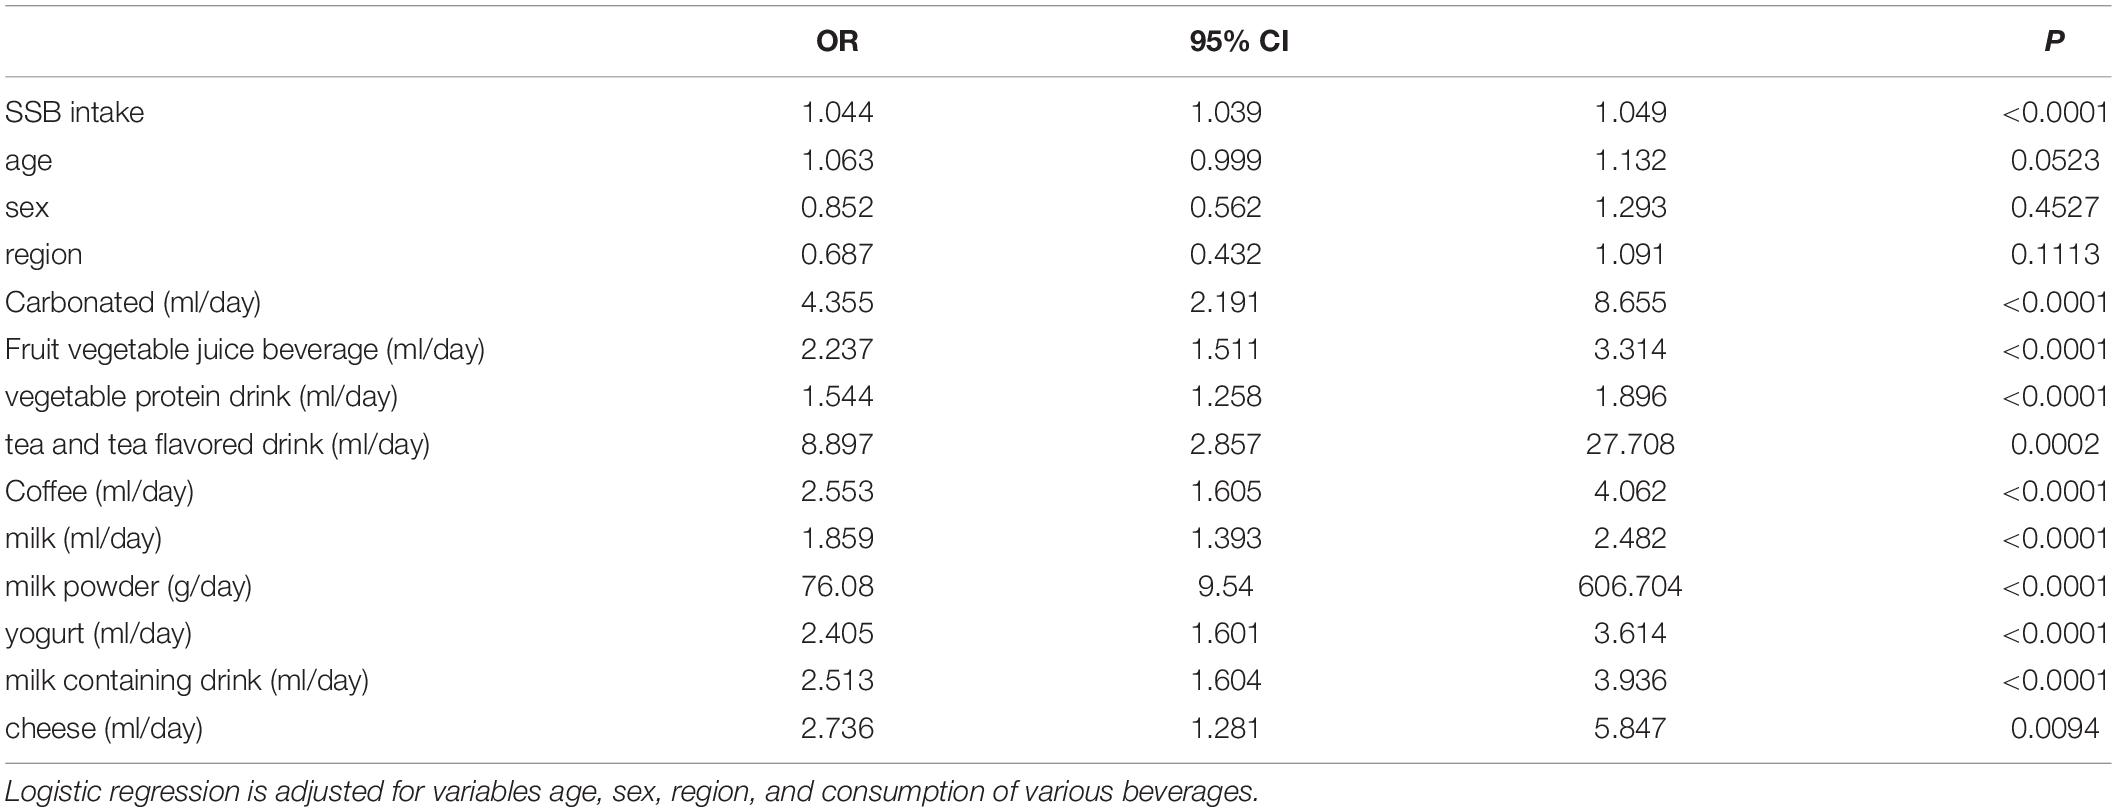
Table 5. Logistic regression analysis of relationship between excessive SSB sugar intake (≥25 g/day) and consumption of intake of various beverages.
The direct effects of all types of SSBs on overweight/obesity were not statistically significant (p > 0.05), except for milk. The indirect effects of all types of SSBs on overweight and obesity through sugar were statistically significant (p < 0.05). By testing for mediating effects, we found that sugar exerted a full mediating effect on overweight/obesity (p < 0.05) in all types of SSB, except for milk. Figure 4 shows the path analysis diagram with standardized estimates for the relationship between the types of SSB, SSB sugar intake, and overweight/obesity. The one-sided arrows from different types of SSB sugar intake to overweight/obesity represent the regression coefficients; SSB sugar intake was positively correlated with overweight/obesity in children and adolescents (β = 0.1075, p < 0.05).
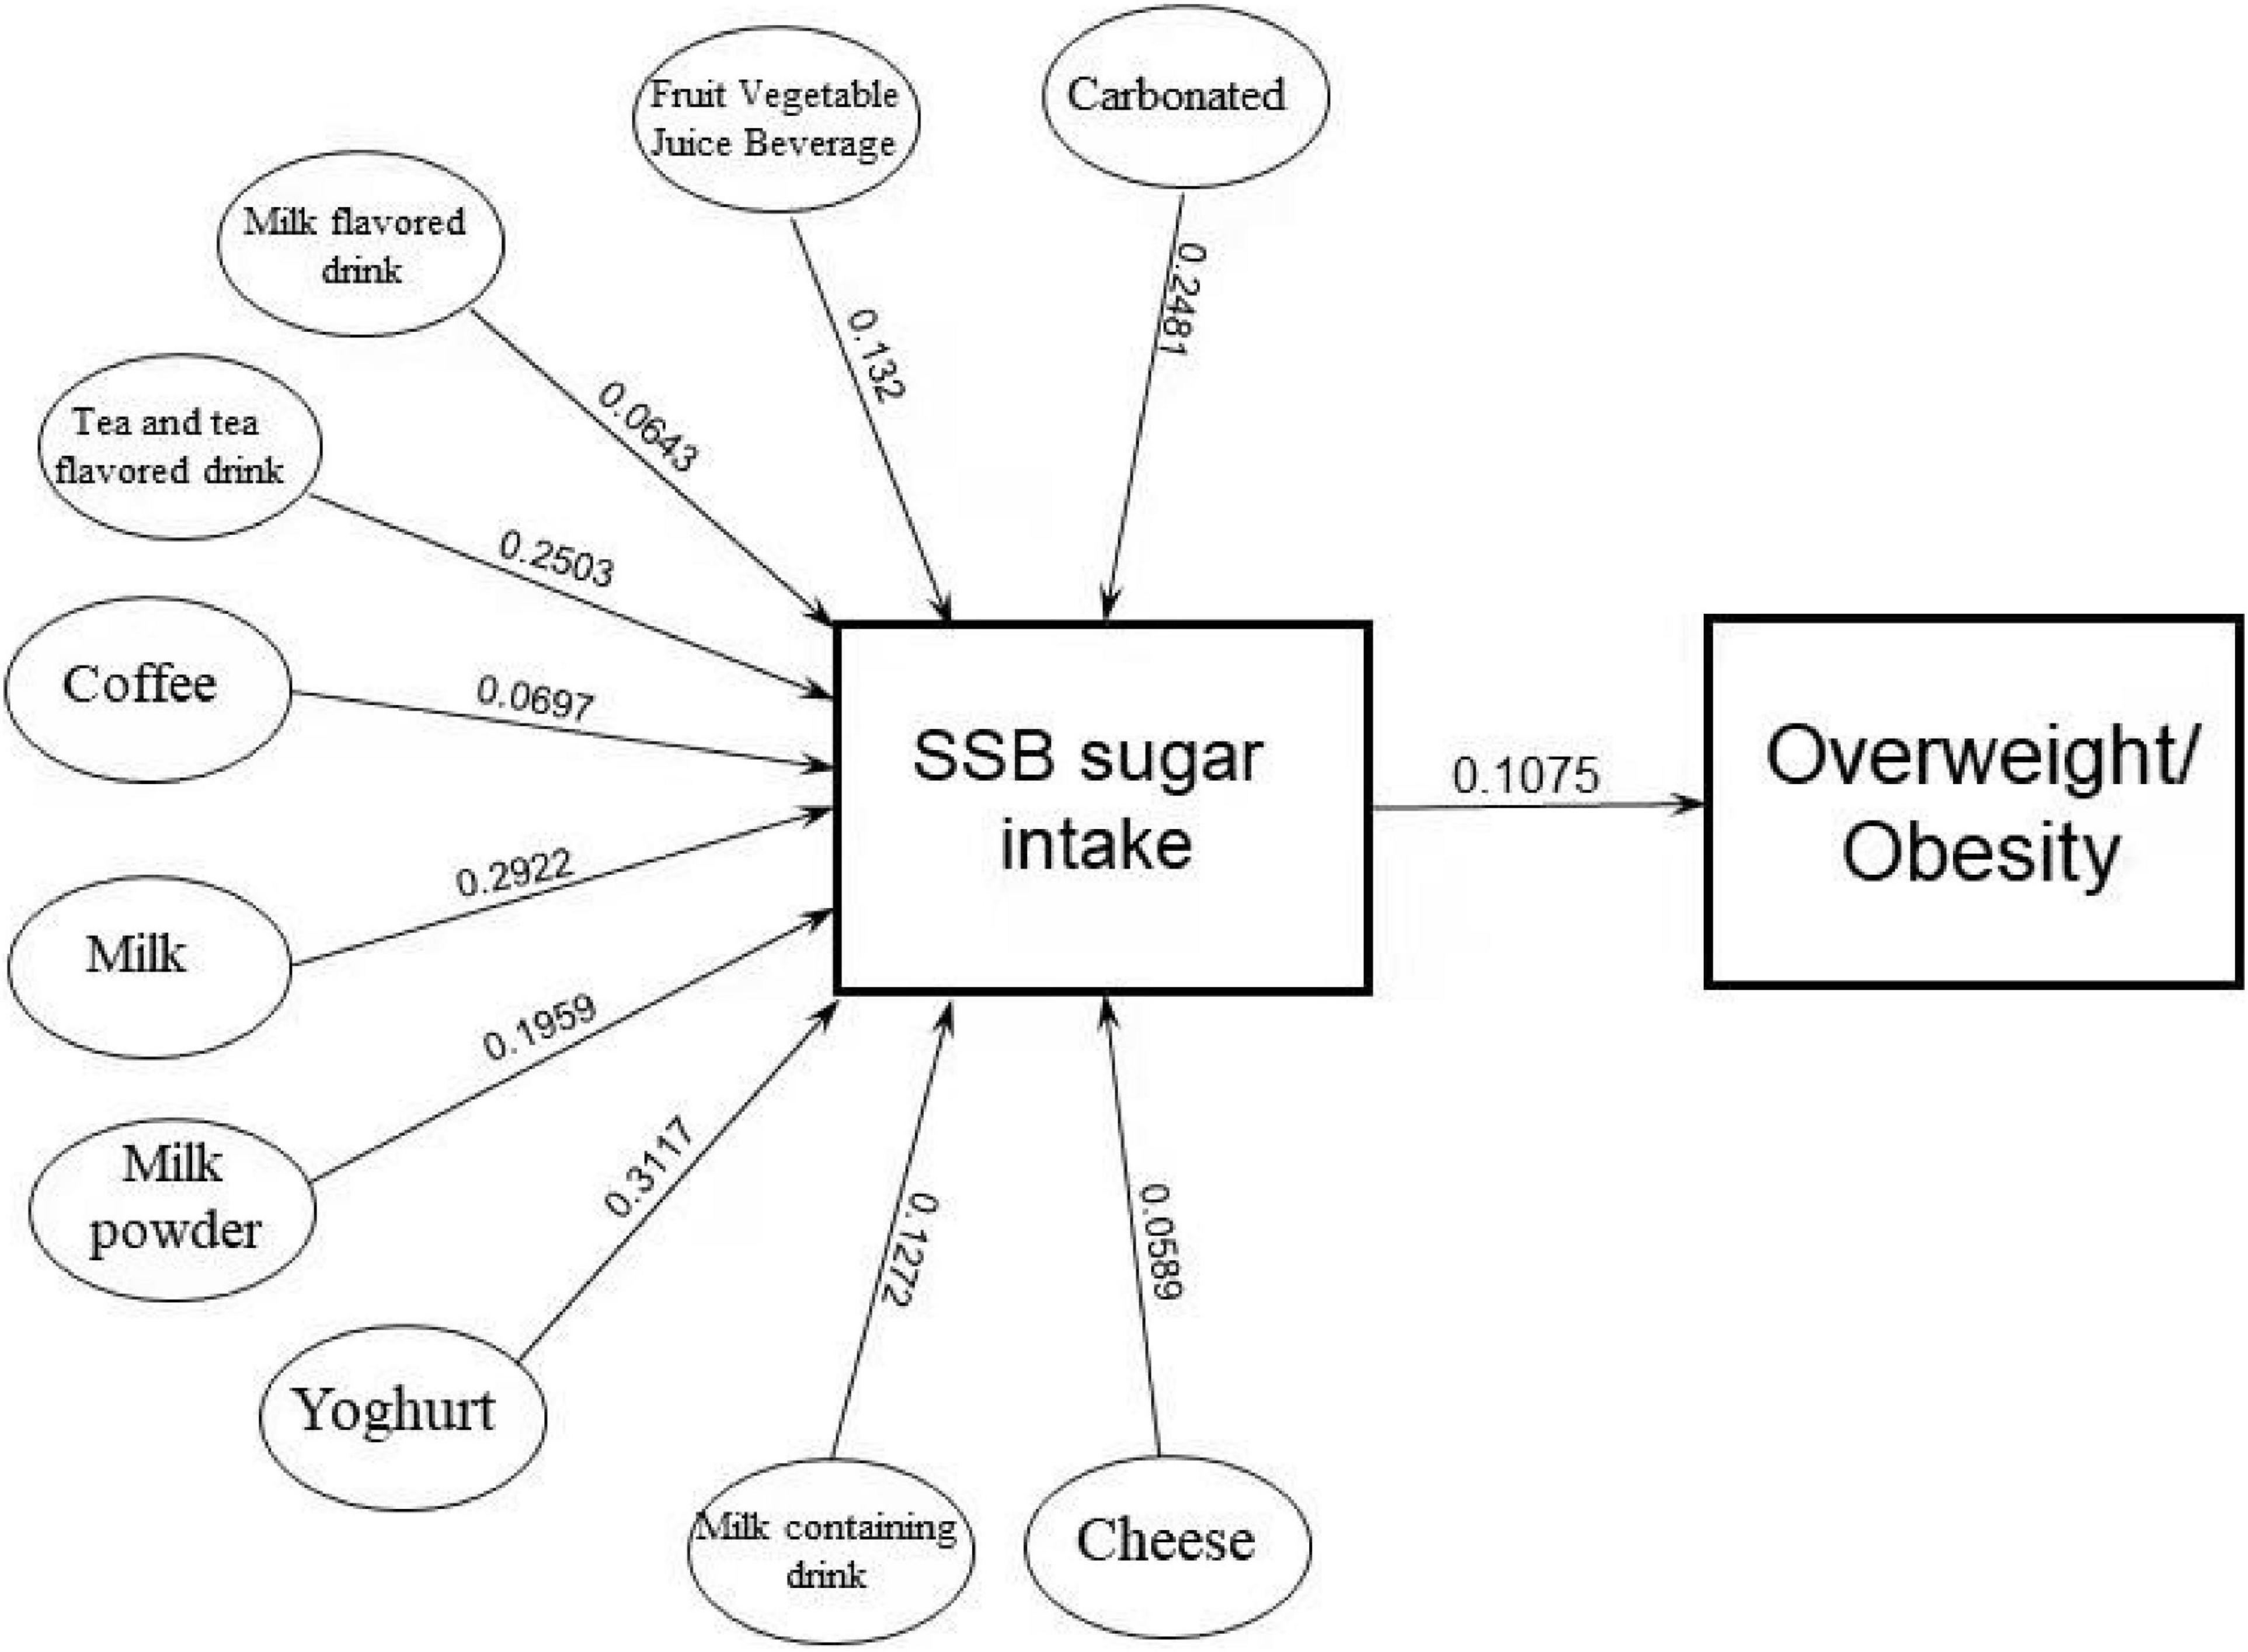
Figure 4. Standardized estimation of the relationship of types of SSB, SSB sugar intake, and overweight/obesity.
In a previous study (20, 21), the prevalence of overweight/obesity was increasing significantly both in urban and rural areas from 1985 to 2014 in Shandong, China. The prevalence of overweight and obesity increased from less than 1% in 1985 to nearly 20% in 2014. In our study, the overweight and obesity status among children and adolescents, the rural area was more serious than the urban area significantly (p < 0.0001). Meanwhile, the overweight and obesity status in boys and children were more serious, respectively, than girls and adolescents (p < 0.0001). Girls were associated with a lower OR for overweight and obesity (OR = 0.586). Similar phenomena have been observed in adolescents (OR = 0.542) and the rural area (OR = 0.573). These findings were similar to studies of the weight status of children and adolescents across China (22, 23).
The consumption of SSBs has been reported as a risk factor in overweight and obesity in previous reviews (24–26). Reducing SSB consumption among obese and overweight youth may help to curb childhood obesity (27). On the contrary, some of the studies were not designed to evaluate whether SSB contributes to overweight and obesity (27–29) other than their role in contributing calories. In their views, it was unclear whether SSB intake, as part of current diet, was associated with obesity, and, if so, whether this association was because SSB was a significant contributor to calories, or because of other reasons that may be related to SSB consumption [e.g., socioeconomic status (30, 31), physical condition (32)].
In our study, high SSB intake (≥200 ml/day) was associated with a higher OR for overweight and obesity (OR = 1.384, p < 0.05), and SSB sugar intake (OR = 1.391, p < 0.05) (Table 3). This was in agreement with studies that were reported by Brunkwall L, Hu Fb, and Bremer AA (24, 33, 34). RCS results suggest that SSB sugar intake of more than 25 g/day increased the risk of overweight/obesity, which was consistent with the dietary guidelines for Chinese residents, recommending that sugar intake should not exceed 25 g/day.
In our discovery, the effects of all types of SSBs on overweight/obesity were fully mediated by SSB sugar, except for milk. This explains why previous studies have shown that different types of beverages have different effects on overweight/obesity. In previous studies, the consumption of tea, milk-flavored beverages, and fruit and vegetable juice beverages was not associated with overweight and obesity (35–38). Similarly, Junichi R Sakaki’s study also found that the consumption of orange juice was well correlated with height growth, but not with excessive weight gain (39). Additionally, few studies have tested the relationships between overweight/obesity and SSB sugar intake. Meanwhile, few studies mentioned the contribution of SSB categories to the sugar intake. In order to test the sugar intake from SSB, we gathered the data of sugar content in SSB from Chinese FCT 2002/2004 and the China FCD system. In our study, consumption of any type of SSB had a positive effect on SSB sugar intake in children and adolescents, suggesting that consumption of any type of SSB could cause an increasing SSB sugar intake.
The results of mediation analysis and pathway analysis showed that sugar exerted a full mediating effect on overweight/obesity (p < 0.05) in all types of SSB, except for milk. The intake of different types of SSBs could cause the increase of SSB sugar intake, and the increase of SSB sugar intake was a risk factor in overweight/obesity in children and adolescents. The results of logistics regression analysis showed that any type of SSB intake was a risk factor in excessive intake of SSB sugar (≥25 g/day) (OR > 1, p < 0.05). This implied that excessive consumption of sugary beverages, especially sugar, was a risk factor in overweight/obesity in children and adolescents. In previous studies (40), some scholars have also encouraged children to use plain water instead of SSB consumption, because higher SSB sugar intake might lead to excess calories in the diet, and SSB sugar intake itself was an adverse factor in reducing overall dietary quality. The strength of our study was to clarify that the reason for the overweight/obesity of SSBs was entirely due to the sugar in SSBs, not other components. At the same time, we also analyzed the risk of excessive SSB sugar intake caused by various beverages (Table 5).
According to the consumption of SSB drinks in Shandong province from 2013 to 2016, the average daily SSB intake was 210.7 and 208 ml in children and adolescents, respectively. The effects of all types of SSBs on overweight/obesity were fully mediated by SSB sugar, except for milk. There might be a dose-response relationship between overweight/obesity and SSB sugar intake, and daily intake of SSB sugar over 25 g was a risk factor in overweight/obesity in children and adolescents. There were 44.8 percent of children and adolescents, consuming 25 grams or more of sugar per day. SSB sugar intake, which was a harmful factor in overweight/obesity, was influenced by the SSB types significantly. Since the consumption of any type of SSB had a positive effect on SSB sugar intake and any type of SSB intake was a risk factor in excessive SSB sugar intake, we recommend reducing the consumption of all types of SSBs, especially those with a higher sugar content.
The main limitation of our study was the lack of data in dietary energy intake and physical activity among these children and adolescents. We tried to verify their impact with pre-experiments and found that the impact was limited and did not affect the trend of the results. We hope that future studies to be conducted will address this area.
The datasets presented in this article are not readily available because the copyright of the dataset is currently owned by the Shandong Center for Disease Control and Prevention and The Second Hospital of Shandong University, and has not been fully disclosed yet.
LY and CZ: conceptualization. LY and HZ: formal analysis. LY, FZ, and JS: investigation. LY, HZ, and FZ: methodology. LY, YL, and XY: validation. LY: writing – original draft preparation. HZ and CZ: writing – review, and editing. All authors contributed to the article and approved the submitted version.
The authors declare that the research was conducted in the absence of any commercial or financial relationships that could be construed as a potential conflict of interest.
All claims expressed in this article are solely those of the authors and do not necessarily represent those of their affiliated organizations, or those of the publisher, the editors and the reviewers. Any product that may be evaluated in this article, or claim that may be made by its manufacturer, is not guaranteed or endorsed by the publisher.
We thank all the team members and all the participants.
1. Pan XF, Wang L, Pan A. Epidemiology and determinants of obesity in China. Lancet Diabetes Endocrinol. (2021) 9:373–92. doi: 10.1016/S2213-8587(21)00045-0
2. Salamonowicz MM, Zalewska A, Maciejczyk M. Oral consequences of obesity and metabolic syndrome in children and adolescents. Dent Med Probl. (2019) 56:97–104. doi: 10.17219/dmp/102620
3. Qin W, Wang L, Xu L, Sun L, Li J, Zhang J, et al. An exploratory spatial analysis of overweight and obesity among children and adolescents in Shandong, China. BMJ Open. (2019) 9:e028152. doi: 10.1136/bmjopen-2018-028152
4. Qin P, Li Q, Zhao Y, Chen Q, Sun X, Liu Y, et al. Sugar and artificially sweetened beverages and risk of obesity, type 2 diabetes mellitus, hypertension, and all-cause mortality: a dose-response meta-analysis of prospective cohort studies. Eur J Epidemiol. (2020) 35:655–71. doi: 10.1007/s10654-020-00655-y
5. Ebbeling CB, Feldman HA, Steltz SK, Quinn NL, Robinson LM, Ludwig DS. Effects of sugar-sweetened, artificially sweetened, and unsweetened beverages on cardiometabolic risk factors, body composition, and sweet taste preference: a randomized controlled trial. J Am Heart Assoc. (2020) 9:e015668. doi: 10.1161/JAHA.119.015668
6. von Philipsborn P, Stratil JM, Burns J, Busert LK, Pfadenhauer LM, Polus S, et al. Environmental interventions to reduce the consumption of sugar-sweetened beverages and their effects on health. Cochrane Database Syst Rev. (2019) 6:CD012292. doi: 10.1002/14651858.CD012292.pub2
7. Trude ACB, Surkan PJ, Cheskin LJ, Gittelsohn JA. multilevel, multicomponent childhood obesity prevention group-randomized controlled trial improves healthier food purchasing and reduces sweet-snack consumption among low-income African-American youth. Nutr J. (2018) 17:96. doi: 10.1186/s12937-018-0406-2
8. Conlon BA, Mcginn AP, Isasi CR, Mossavar-Rahmani Y, Lounsbury DW, Ginsberg MS, et al. Home environment factors and health behaviors of low-income overweight, and obese youth. Am J Health Behav. (2019) 43:420–36. doi: 10.5993/AJHB.43.2.17
9. Fontes AS, Pallottini AC, Vieira DADS, Fontanelli MM, Marchioni DM, Cesar CLG, et al. Demographic, socioeconomic and lifestyle factors associated with sugar-sweetened beverage intake: a population-based study. Rev Bras Epidemiol. (2020) 23:e200003. doi: 10.1590/1980-549720200003
10. Sylvetsky AC, Visek AJ, Turvey C, Halberg S, Weisenberg JR, Lora K, et al. Parental concerns about child and adolescent caffeinated sugar-sweetened beverage intake and perceived barriers to reducing consumption. Nutrients. (2020) 12:885. doi: 10.3390/nu12040885
11. Federal Trade Commission. Marketing Food to Children and Adolescents: A Review of Industry Expenditures, Activities, and self-Regulation. Washington, DC: Federal Trade Commission (2008). 149 p.
12. Cooper CC. Pouring on the pounds: the persistent problem of sugar-sweetened beverage intake among children and adolescents. NASN Sch Nurse. (2021) 36:137–41. doi: 10.1177/1942602X20953905
13. Hwang SB, Park S, Jin GR, Jung JH, Park HJ, Lee SH, et al. Trends in beverage consumption and related demographic factors and obesity among Korean children and adolescents. Nutrients. (2020) 12:2651. doi: 10.3390/nu12092651
14. GuiZ H, Zhu YN, Cai L, Sun FH, Ma YH, Jing J, et al. Sugar-sweetened beverage consumption and risks of obesity and hypertension in chinese children and adolescents: a national cross-sectional analysis. Nutrients. (2017) 9:1302. doi: 10.3390/nu9121302
15. Trumbo PR, Rivers CR. Systematic review of the evidence for an association between sugar-sweetened beverage consumption and risk of obesity. Nutr Rev. (2014) 72:566–74. doi: 10.1111/nure.12128
16. McGuire S. Scientific report of the 2015 dietary guidelines advisory committee. Washington, DC: US departments of agriculture and health and human services, 2015. Adv Nutr. (2016) 7:202–4. doi: 10.3945/an.115.011684
17. Bergallo P, Castagnari V, Fernández A, Mejía R. Regulatory initiatives to reduce sugar-sweetened beverages (SSBs) in Latin America. PLoS One. (2018) 13:e0205694. doi: 10.1371/journal.pone.0205694
18. Group of China Obesity Task Force. Body mass index reference norm for screening overweight and obesity in Chinese children and adolescents. Zhonghua liu xing bing xue za zhi. (2004) 25:97–102.
19. Chinese Nutrition Society. Dietary Guidelines for Chinese Residents (2016). Beijing: People’s Medical Publishing House (2016). 108 p.
20. Zhang YX, Wang ZX, Zhao JS, Chu ZH. Trends in overweight and obesity among rural children and adolescents from 1985 to 2014 in Shandong. China. Eur J Prev Cardiol. (2016) 23:1314–20. doi: 10.1177/2047487316643830
21. Zhang YX, Wang ZX, Zhao JS, Chu ZH. Prevalence of overweight and obesity among children and adolescents in shandong, China: Urban-rural disparity. J Trop Pediatr. (2016) 62:293–300. doi: 10.1093/tropej/fmw011
22. Ma S, Hou D, Zhang Y, Yang L, Sun J, Zhao M, et al. Trends in abdominal obesity among Chinese children and adolescents, 1993-2015. J Pediatr Endocrinol Metab. (2020) 34:163–9. doi: 10.1515/jpem-2020-0461
23. Zhang L, Chen J, Zhang J, Wu W, Huang K, Chen R, et al. Regional disparities in obesity among a heterogeneous population of Chinese children and adolescents. JAMA Netw Open. (2021) 4:e2131040. doi: 10.1001/jamanetworkopen.2021.31040
24. Bremer AA, Byrd RS, Auinger P. Differences in male and female adolescents from various racial groups in the relationship between insulin resistance-associated parameters with sugar-sweetened beverage intake and physical activity levels. Clin Pediatr (Phila). (2010) 49:1134–42. doi: 10.1177/0009922810379043
25. Rhee JJ, Mattei J, Campos H. Association between commercial and traditional sugar-sweetened beverages and measures of adiposity in Costa Rica. Public Health Nutr. (2012) 15:1347–54. doi: 10.1017/S1368980012001000
26. Martí Del Moral A, Calvo C, Martínez A. Consumo de alimentos ultraprocesados y obesidad: una revisión sistemática [Ultra-processed food consumption and obesity-a systematic review]. Nutr Hosp. (2021) 38:177–85. doi: 10.20960/nh.03151
27. Ranjani H, Pradeepa R, Mehreen TS, Anjana RM, Anand K, Garg R, et al. Determinants, consequences and prevention of childhood overweight and obesity: an Indian context. Indian J Endocrinol Metab. (2014) 18:S17–25. doi: 10.4103/2230-8210.145049
28. Marshall TA, Van Buren JM, Warren JJ, Cavanaugh JE, Levy SM. Beverage consumption patterns at age 13 to 17 years are associated with weight, height, and body mass index at age 17 years. J Acad Nutr Diet. (2017) 117:698–706. doi: 10.1016/j.jand.2017.01.010
29. Brand-Miller JC, Barclay AW. Declining consumption of added sugars and sugar-sweetened beverages in Australia: a challenge for obesity prevention. Am J Clin Nutr. (2017) 105:854–63. doi: 10.3945/ajcn.116.145318
30. Malik VS, Hu FB. The role of sugar-sweetened beverages in the global epidemics of obesity and chronic diseases. Nat Rev Endocrinol. (2022) 21:1–14. doi: 10.1038/s41574-021-00627-6
31. Drewnowski A. The real contribution of added sugars and fats to obesity. Epidemiol Rev. (2007) 29:160–71. doi: 10.1093/epirev/mxm011
32. Nicklas TA, O’Neil CE, Liu Y. Intake of added sugars is not associated with weight measures in children 6 to 18 years: national health and nutrition examination surveys 2003-2006. Nutr Res. (2011) 31:338–46. doi: 10.1016/j.nutres.2011.03.014
33. Brunkwall L, Chen Y, Hindy G, Rukh G, Ericson U, Barroso I, et al. Sugar-sweetened beverage consumption and genetic predisposition to obesity in 2 Swedish cohorts. Am J Clin Nutr. (2016) 104:809–15. doi: 10.3945/ajcn.115.126052
34. Hu FB. Resolved: there is sufficient scientific evidence that decreasing sugar-sweetened beverage consumption will reduce the prevalence of obesity and obesity-related diseases. Obes Rev. (2013) 14:606–19. doi: 10.1111/obr.12040
35. Bergholdt HK, Nordestgaard BG, Ellervik C. Milk intake is not associated with low risk of diabetes or overweight-obesity: a Mendelian randomization study in 97,811 Danish individuals. Am J Clin Nutr. (2015) 102:487–96. doi: 10.3945/ajcn.114.105049
36. Fayet-Moore F. Effect of flavored milk vs plain milk on total milk intake and nutrient provision in children. Nutr Rev. (2016) 74:1–17. doi: 10.1093/nutrit/nuv031
37. Jones AC, Kirkpatrick SI, Hammond D. Beverage consumption and energy intake among Canadians: analyses of 2004 and 2015 national dietary intake data. Nutr J. (2019) 18:60. doi: 10.1186/s12937-019-0488-5
38. Papandreou D, Andreou E, Heraclides A, Rousso I. Is beverage intake related to overweight and obesity in school children? Hippokratia. (2013) 17:42–6.
39. Sakaki JR, Li J, Melough MM, Ha K, Tamimi RM, Chavarro JE, et al. Orange juice intake and anthropometric changes in children and adolescents. Public Health Nutr. (2021) 24:4482–9. doi: 10.1017/S1368980020003523
Keywords: children, adolescents, overweight, obesity, sugar-sweetened beverages
Citation: Yu L, Zhou H, Zheng F, Song J, Lu Y, Yu X and Zhao C (2022) Sugar Is the Key Cause of Overweight/Obesity in Sugar-Sweetened Beverages (SSB). Front. Nutr. 9:885704. doi: 10.3389/fnut.2022.885704
Received: 28 February 2022; Accepted: 06 June 2022;
Published: 28 June 2022.
Edited by:
Paola Gualtieri, Tor Vergata University of Rome, ItalyReviewed by:
Rudo Mapanga, Nazarbayev University, KazakhstanCopyright © 2022 Yu, Zhou, Zheng, Song, Lu, Yu and Zhao. This is an open-access article distributed under the terms of the Creative Commons Attribution License (CC BY). The use, distribution or reproduction in other forums is permitted, provided the original author(s) and the copyright owner(s) are credited and that the original publication in this journal is cited, in accordance with accepted academic practice. No use, distribution or reproduction is permitted which does not comply with these terms.
*Correspondence: Changsheng Zhao, emhhb2Noc2hzZEAxNjMuY29t
†These authors have contributed equally to this work and share first authorship
Disclaimer: All claims expressed in this article are solely those of the authors and do not necessarily represent those of their affiliated organizations, or those of the publisher, the editors and the reviewers. Any product that may be evaluated in this article or claim that may be made by its manufacturer is not guaranteed or endorsed by the publisher.
Research integrity at Frontiers
Learn more about the work of our research integrity team to safeguard the quality of each article we publish.