 Mohammad Reza Pakravan-Charvadeh
 Cornelia Butler Flora
 Ali Emrouznejad
- 1Department of Agricultural Economics and Rural Development, Lorestan University, Khorramabad, Iran
- 2Department of Sociology, Kansas State University, Manhattan, KS, United States
- 3Department of Sociology, Iowa State University, Ames, IA, United States
- 4Surrey Business School, Faculty of Arts and Social Sciences, University of Surrey, Guildford, United Kingdom
Background: Paying particular attention to sustainable food consumption in low-income households is essential for increasing human health. Due to the growing population globally, this concept will likely become more serious soon.
Methods: Following the importance of optimizing food consumption for sustainability, in this study, a novel methodology is introduced for calculating nutrient intake efficiency and determining choices of food in different locations. The impact of socio-economic factors on nutrition efficiency is assessed. Data Envelopment Analysis (DEA) as a well-known linear programming (LP) and a Tobit model are used to achieve the goals. Household Consumption and Expenditure Surveys (HCESs) of 30,000 rural and urban Iranian households in all provinces in 2016 are analyzed. A Nutrient Efficiency Map (NEM) of Iran was depicted by GIS software.
Results: The results showed that many townships had nutrient efficiency scores of less than 70%. Northeast townships had the lowest scores, with an efficiency score of less than 50%. Overall, townships have lower efficiency in the North (seaside cities), East (desert cities), and North East (isolated cities) when compared with other areas.
Conclusion: Therefore, it is suggestible that the government should modify the support policies and the protection packages based on social, geographical, and cultural status.
Introduction
The availability of healthy foods, nowadays, is a global concern. It depends on diverse, sustainable food systems. Therefore, paying particular attention to sustainable food available for consumption in low-income households is essential for ensuring a healthy population (1). This can be achieved through choosing the best combination of food groups (2). Sustainable consumption of foods prevents or mitigates the loss of resources and thus translates into a considerable improvement in food security (3).
Using Food Consumption Optimization (FCO), to choose the best combination of food ingredients, can lead to a decrease in household expenditure while nutrition is optimized. Households become more efficient in allocating limited food expenditures, leading to increased nutrient efficiency. The FCO reduces nutritionally inefficient food consumption that is at least partly caused by inaccurate or insufficient knowledge. Nutritional knowledge can be a critical policy component to combat malnutrition and to improve diet. Knowledge gaps exist in different regions and for different commodities, and these discrepancies may lead to a qualitative change in households’ diet from healthy to unhealthy status. Increasing attention to food diversity and nutrient characteristics has two substantial benefits in improving the quality of life: first, it allows households to avoid unhealthy diets and thus second, it reduces the adjustable risk for non-communicable disease-related mortality worldwide (4). As Khan (5) shows, adopting the mortality-related axiom of biological stress in poverty measurement leads to a more accurate measure of poverty headcount ratio. The first benefit of increasing diverse nutrient intake is decreasing the impacts of poverty. The second benefit of avoiding less nutritious food is monetary savings. Methods of food group selection, preparation, and combination affect human health and reduce the prevalence of such diseases as diabetes, heart attacks, and strokes, among other non-communicable diseases (6).
Data Envelopment Analysis (DEA), a well-known linear programming (LP) application that was initially proposed by Charnes et al. (7), is a method for measuring the relative performance of homogenous Decision-Making Units (DMUs) with multiple inputs and outputs (8). The Tobit model is a technique for determining associated factors with calculated efficiency. This model, first reported by Tobin (9), has been widely used to determine effective factors on efficiency (10). Tobit regression is frequently used by economists to analyze discontinuous dependent variables and to analyze dependent variables that subject to known upper or lower bounds (11). Table 1 shows some studies in which the DEA approach was carried out in Health-Agricultural-Public systems for optimization.
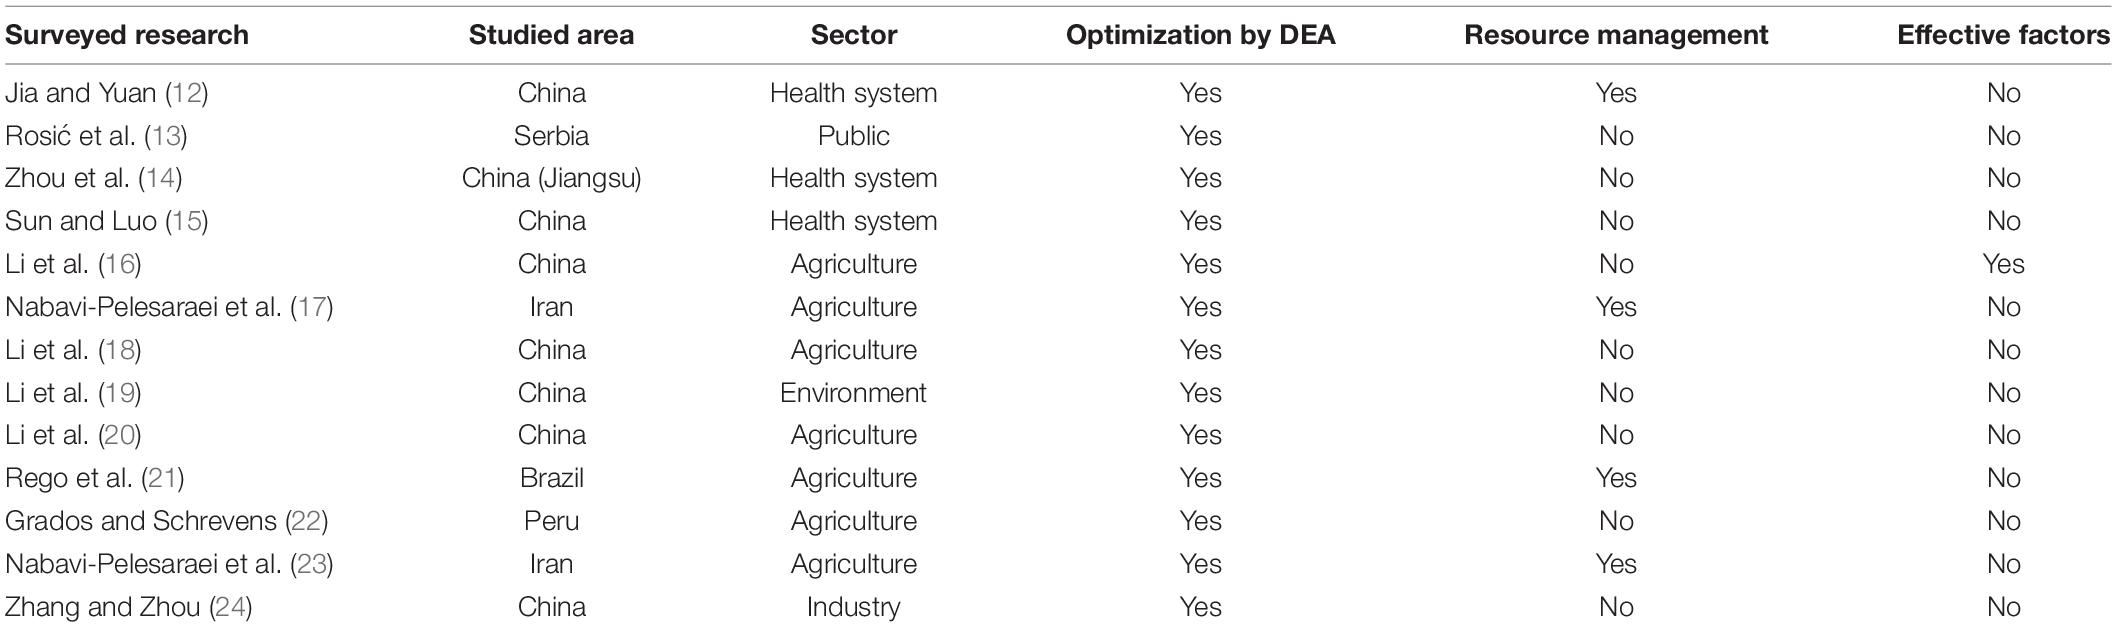
Table 1. The application of the data envelopment analysis (DEA) approach in health-agricultural-public systems.
Considering the urgent need to increase human health, this paper is aimed to:
➢ Develop a novel DEA and regression model to measure food consumption efficiency.
➢ Determining the best combination of food groups for nutrient security using current food resources consumed by Iranian households.
➢ Identifying factors associated with nutrient efficiency by Tobit model.
➢ Proposing a method for depicting the geographical plot of nutrient efficiency for both rural and urban areas.
Materials and Methods
Sample Description
Data and information are gathered from the Statistical Centre of Iran (SCI), which is responsible for the collection of the Iranian household expenditures and income annually through a questionnaire with proven reliability and validity. The SCI survey includes the consumption of 167 food ingredients within a household. The respondent is either the breadwinner or a member aware of the consumption of all household members, able to answer all questions on behalf of the breadwinner (2).
We used the household data to measure nutrient intake. Inputs and outputs for each province were calculated by averaging household data in each province. Information of about 30,000 rural and urban households was gathered in 2016. All 167 food ingredients were divided into 14 food groups to calculate nutrient content consumed by households (25) in 316 townships. The coefficients of the nutrient content of food ingredients extracted from the National Nutrition and Food Technology Research Institute (NNFTRI) were used.
Nutrient Intake Evaluation
Nutrient intake, such as calories, protein, calcium, iron, vitamin A, and vitamin C, was used to identify households’ nutrient status. Assuming a linear function, adult nutrient intake can be calculated by Eqs. 1, 2:
Where yi is the level of nutrient intake of each household member in a day; Zij is the amount of i-th food group consumed by the j-th person in a day, and Bj is the nutrient contents of j-th foodstuffs. By dividing this matrix into the average number of household members (26) in each province, the matrix of nutrient intake for a person per year was calculated. Optimization of food available for consumption was calculated by DEA as shown in Figure 1.
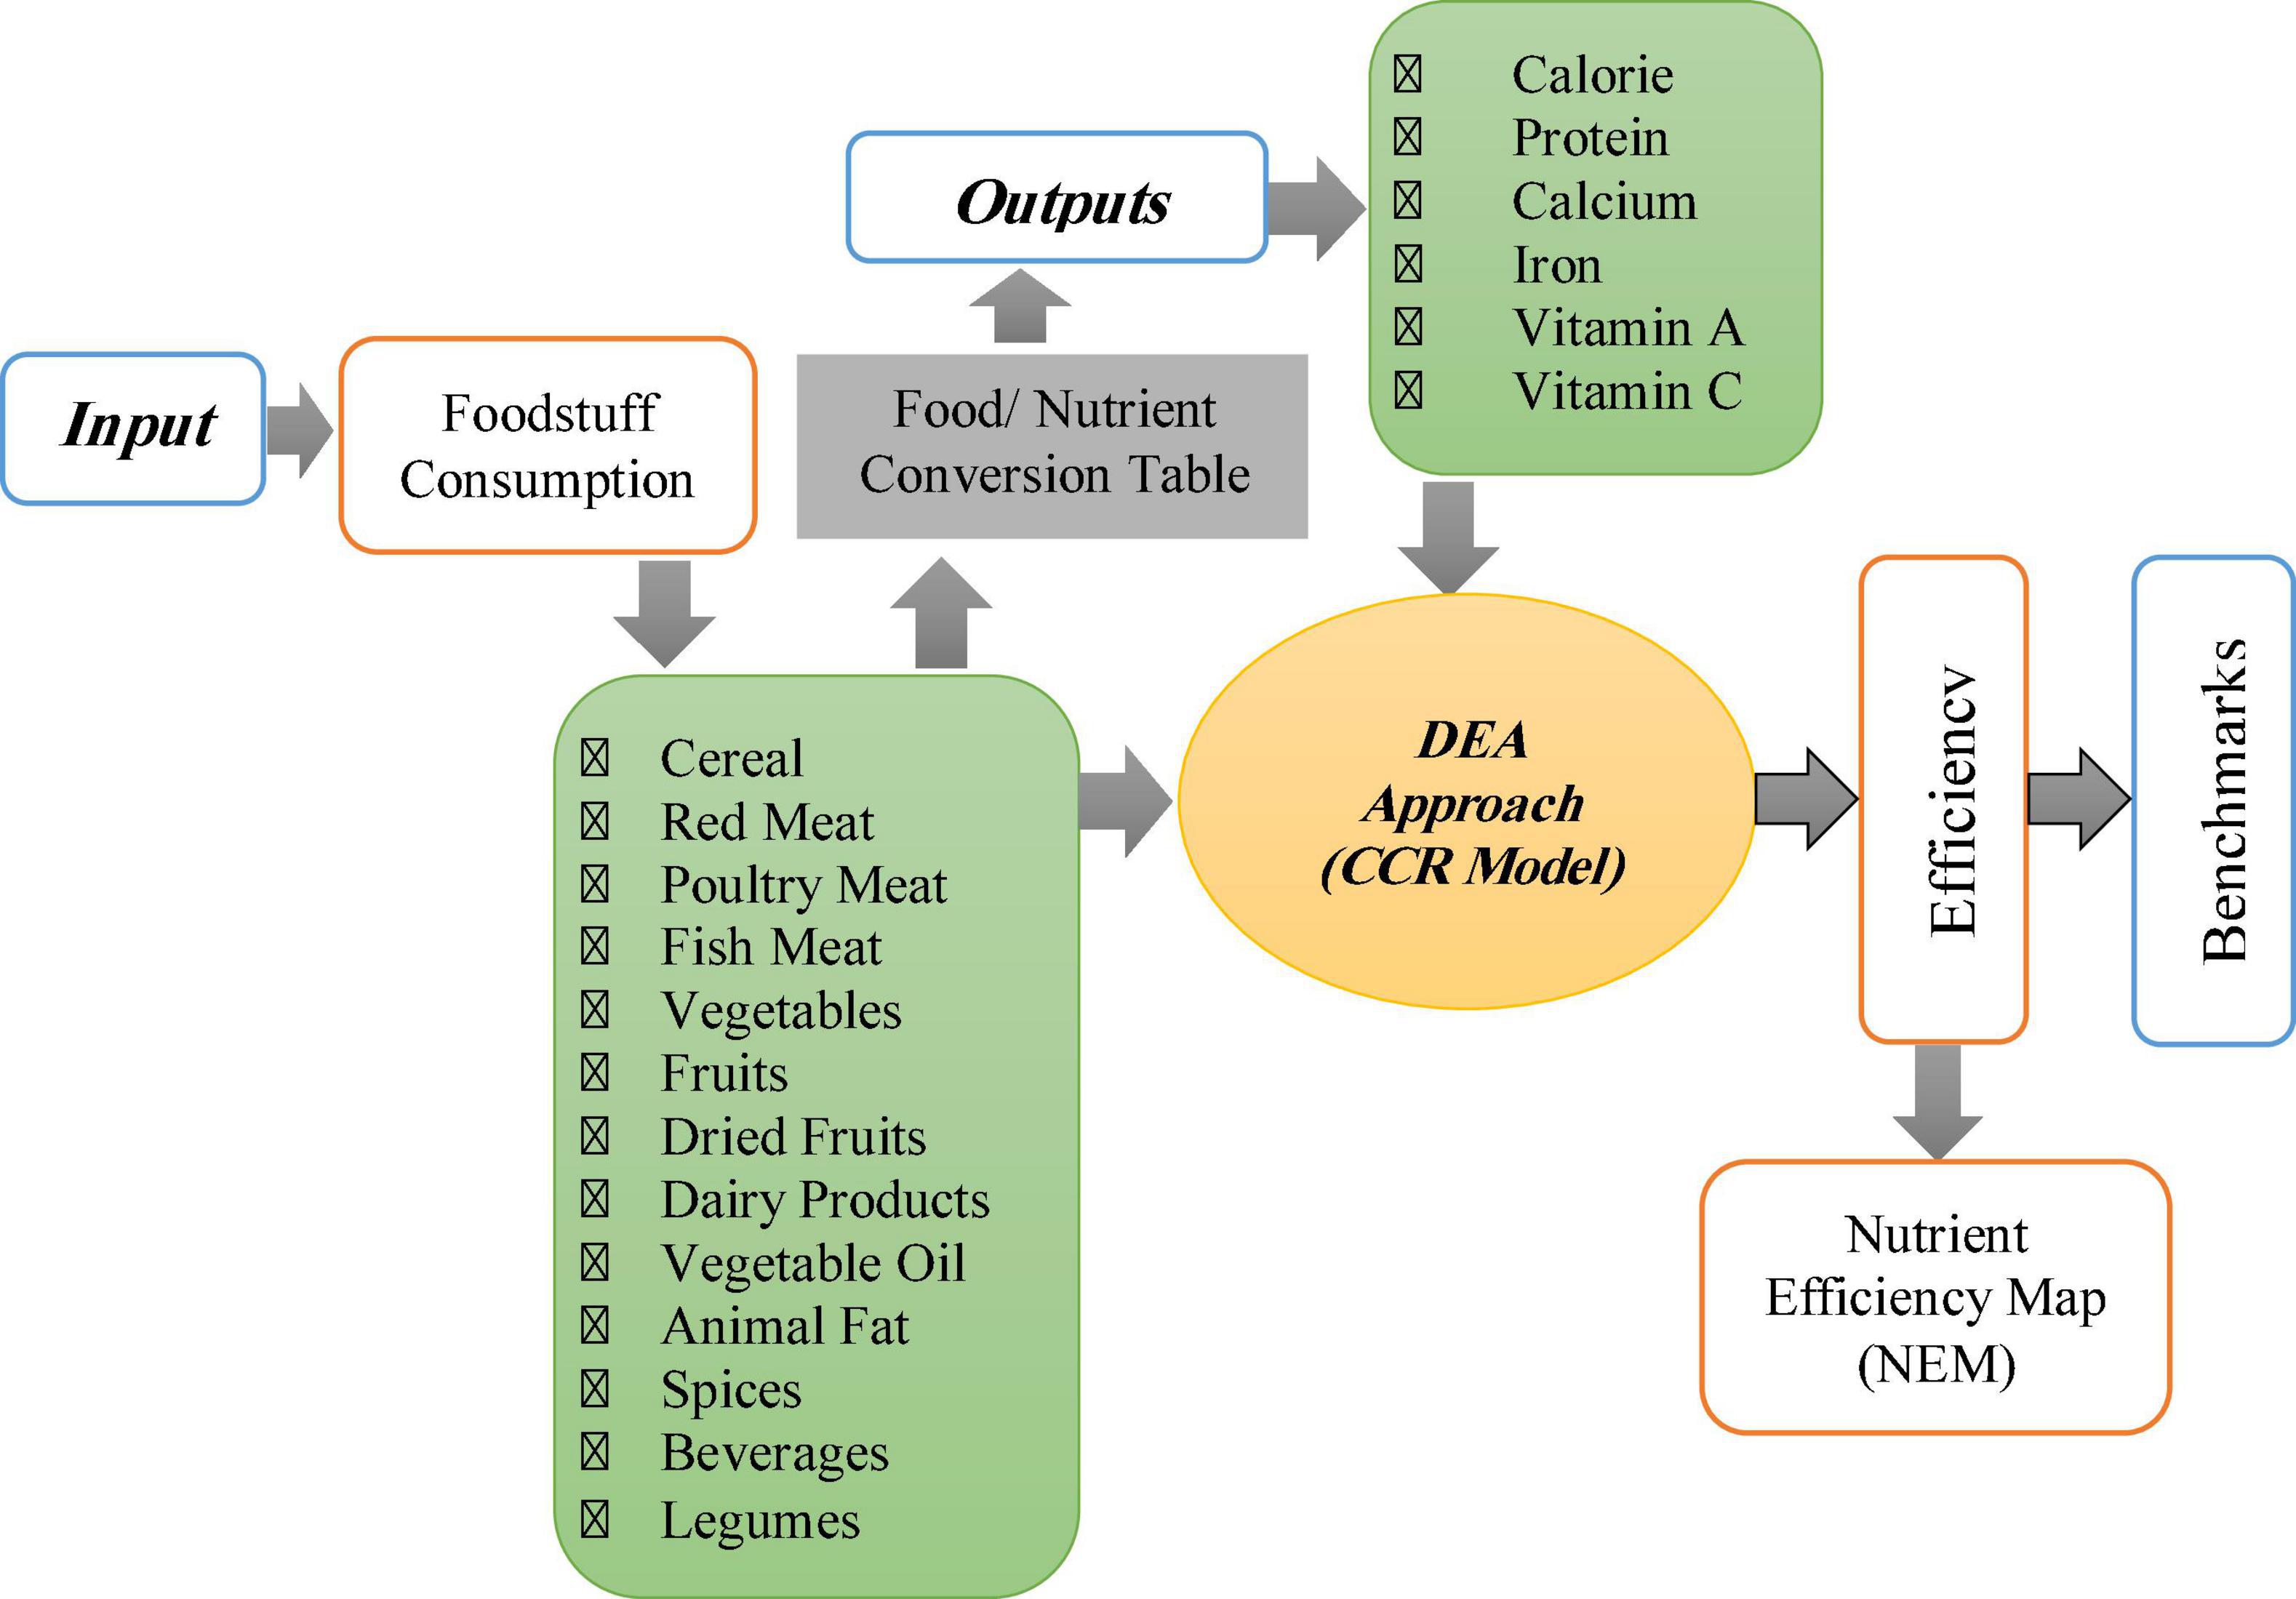
Figure 1. The conceptual framework of the extraction of nutrient intake efficiency for Iranian households.
Data Envelopment Analysis
There are two main DEA models that refer to constant and variable returns to scale (CRS and VRS). We will be using a CRS model, since increasing consumption will increase output (here is nutrient intake) with the same ratio (27). In respect to orientation, the aim of this assessment is on reducing unnecessary food consumption, and hence input orientation was assumed to minimize the food consumption and identify the level of food overconsumption. Consider a set of n DMUs, where DMUj has a consumption plan (Xj, Yj) with Xj = (x1j,x2j,…,xmj) inputs (food groups) and Yj = (y1j,y2j,…,ysj) outputs (nutrients intake). Suppose that xij(i = 1,2,…,m) is the quantity of food group i consumed by household j (DMUj) and yrj(r = 1,2,…,s)is the quantity of nutrient intake by household j (DMUj) (28). Therefore, the following DEA model can be used to measure nutrition intake efficiency.
Where the optimal θ* represents the efficiency in the input-oriented model; are the slacks of food ingredients and macro and micronutrients, respectively; n represents the number of households; j = 1,2,…, 30,000 represents indexes for households; m represents the number of food ingredients; i = 1,2,…, m represents an index for food ingredients; s represents the number of macro- and micronutrients, r = 1, 2, …, s represents an index for nutrient intake, and λ is called the intensity vector. Household is efficient if and only if θ* = 1 and for all i and r. Household is weakly efficient if θ* = 1, and at least one of the slack is non-zero (i.e., or for some i or r).
Associated Factors With Nutrient Efficiency: A Generalized Linear Model
Table 2 shows variables that are chosen as potential determinants of nutrient efficiency based on the related literature review.
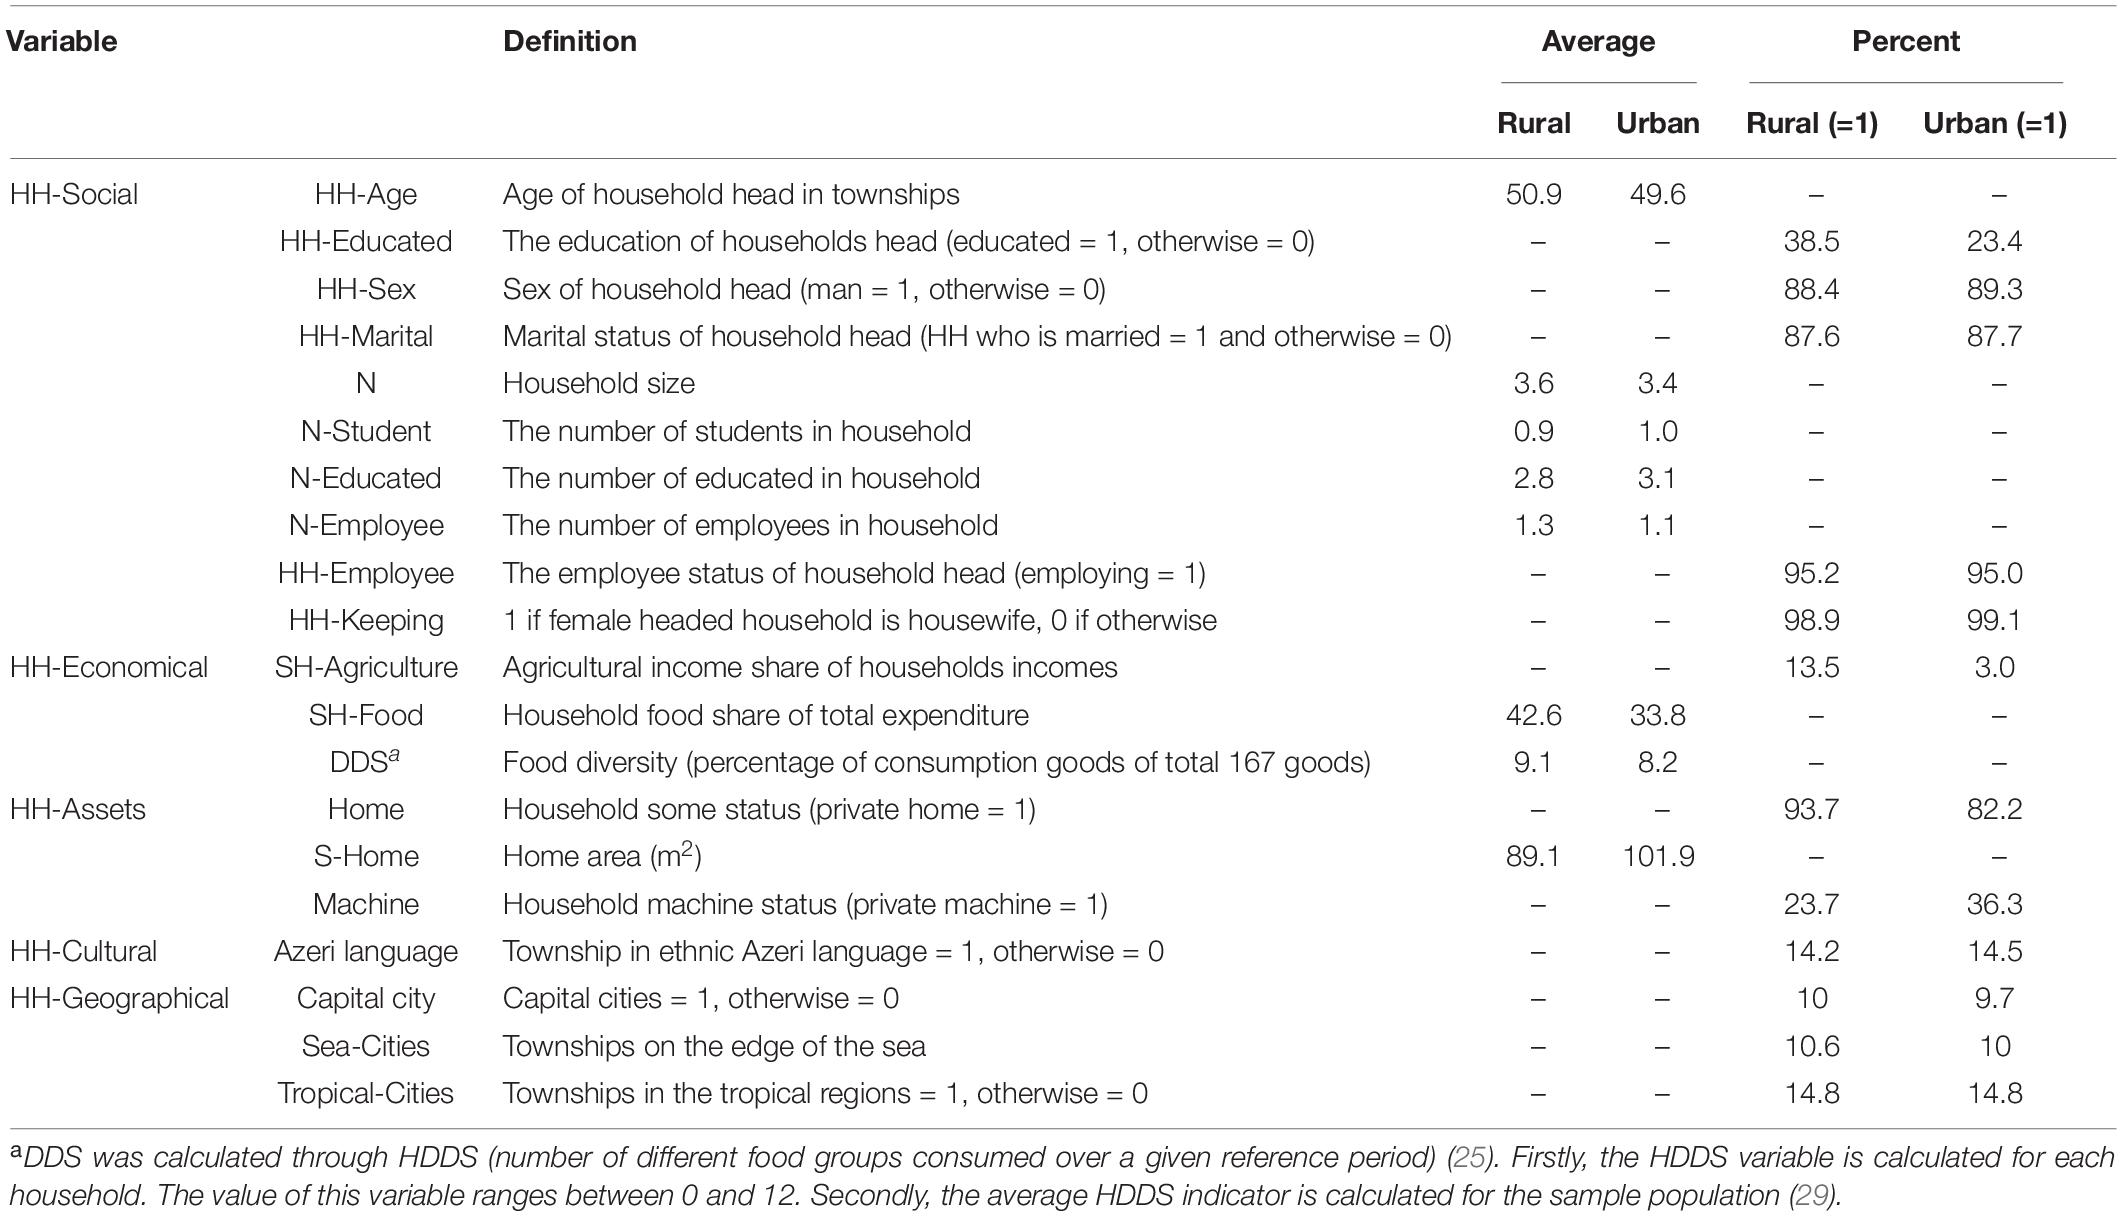
Table 2. Definition of variables used in GLM.
In the second stage of the analysis, we used a censored regression (Tobit) to assess associated factors with nutrient efficiency:
Where θi is the efficiency calculated from solving the mathematical programming problem 2 above and used as a dependent variable and W is a (R×1) vector of independent variables related to attributes of the households in the townships. The dependent variable has two values as follows:
Where θ* is a latent variable. Table 2 summarizes the statistical description of all factors used in this study.
Results
Nutrient Intake Efficiency Analysis
In the first step, we calculated the average nutrition intake of an individual in the urban and rural areas. There is a significant difference among all nutrient intakes between rural and urban areas. As can be seen in Table 3, the nutrient intake of an individual in the rural areas was greater than in urban areas, except for vitamin A and C. The calorie intake of an individual is 3,615/cal/per person in rural areas, while the intake of this macronutrient is 3,280/cal/per person in urban areas.
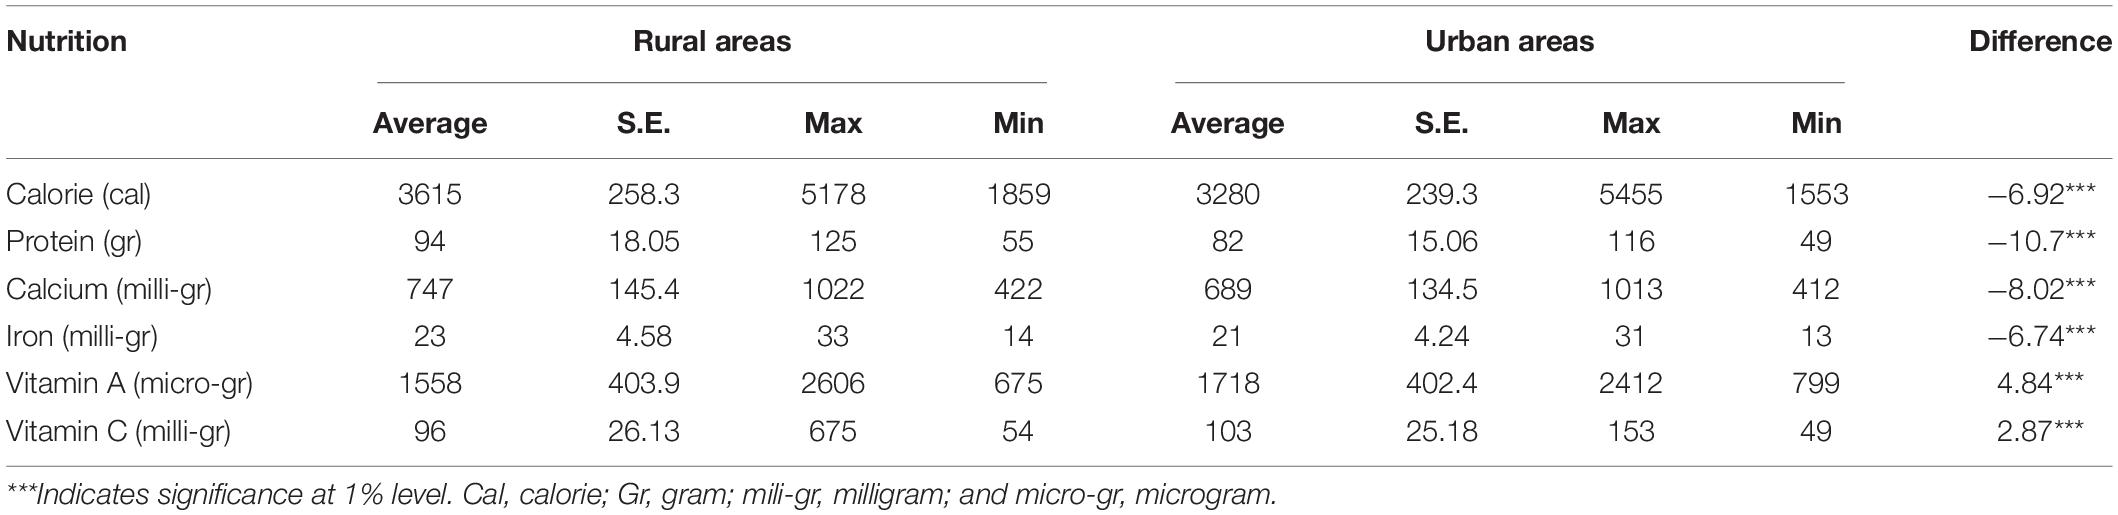
Table 3. The calculated nutrient intake in rural and urban areas in Iran.
Intake of all macro- and micronutrients is really important to be healthy. Table 4 shows that the average foodstuff consumption of rural households is greater than in urban areas. According to the results, the average consumption of all food groups in the rural area was greater than in the urban area. As Table 4 shows, the most important part of the difference between calorie intake between individuals in rural and urban areas is related to the consumption of cereal.
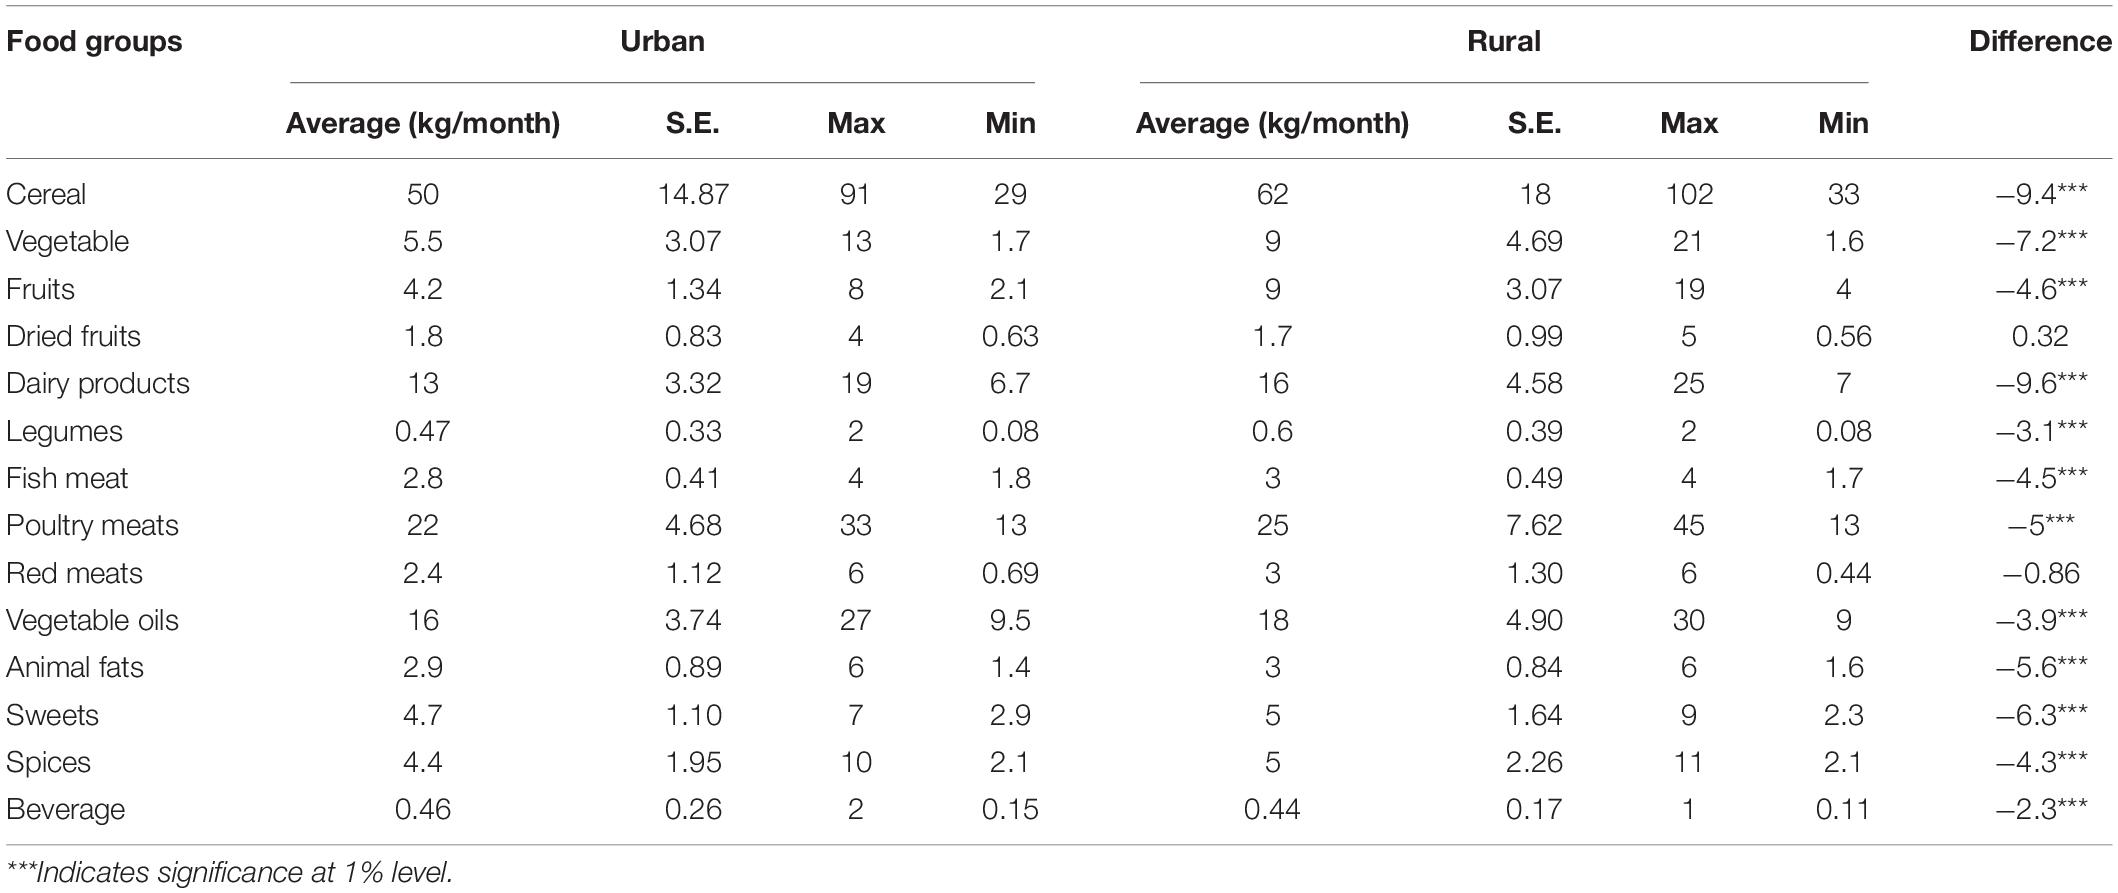
Table 4. Descriptive statistical analysis of measured food ingredients by the households in urban and rural areas in Iran.
The nutrient efficiency of all townships was estimated using DEA. Townships with a score of 100 had the best nutrient consumption efficiency. Then, the provincial score was calculated by averaging the efficiency score of townships within each province. Table 5 shows the average efficiency score of each province. According to the DEA calculated scores in the different townships in all provinces, the average efficiency in Alborz, East Azerbaijan, Chaharmahal and Bakhtiari, Kerman, Khuzestan, Qazvin, Tehran, Yazd, and Zanjan is different between rural and urban areas. This result may be related to the optimized food consumption of the households or the work of rural residents, which requires more calories than urban work.
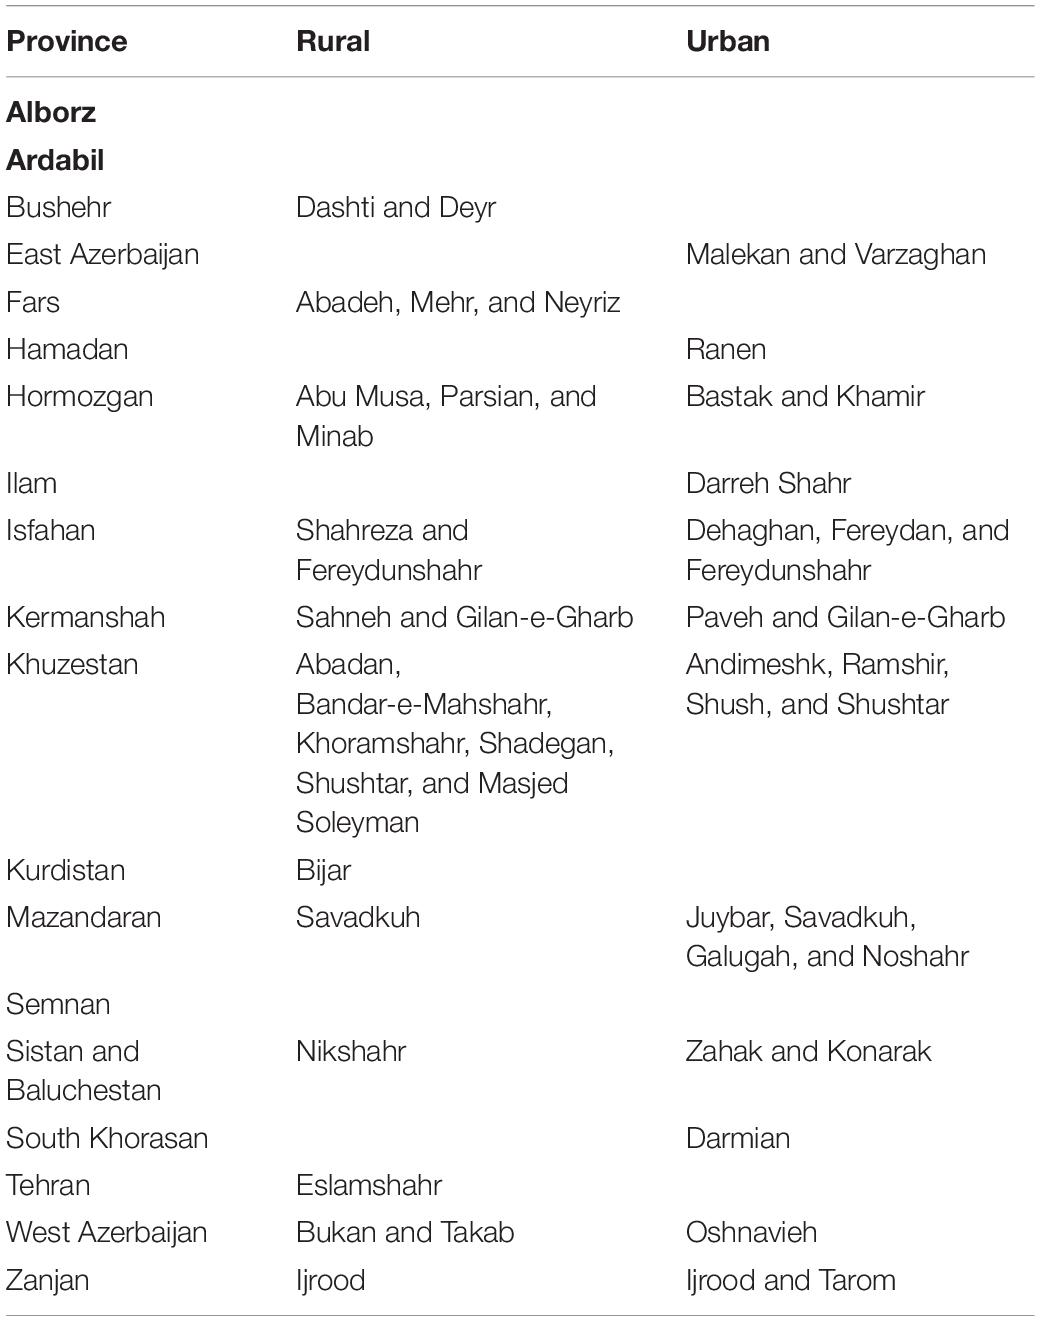
Table 5. Townships with full efficiency in the rural and urban areas in Iran [identified by the calculated data envelopment analysis (DEA) score in the study].
Rural and urban nutrient efficiency was compared by the province in the form of a map (see NEM in Figures 2, 3).
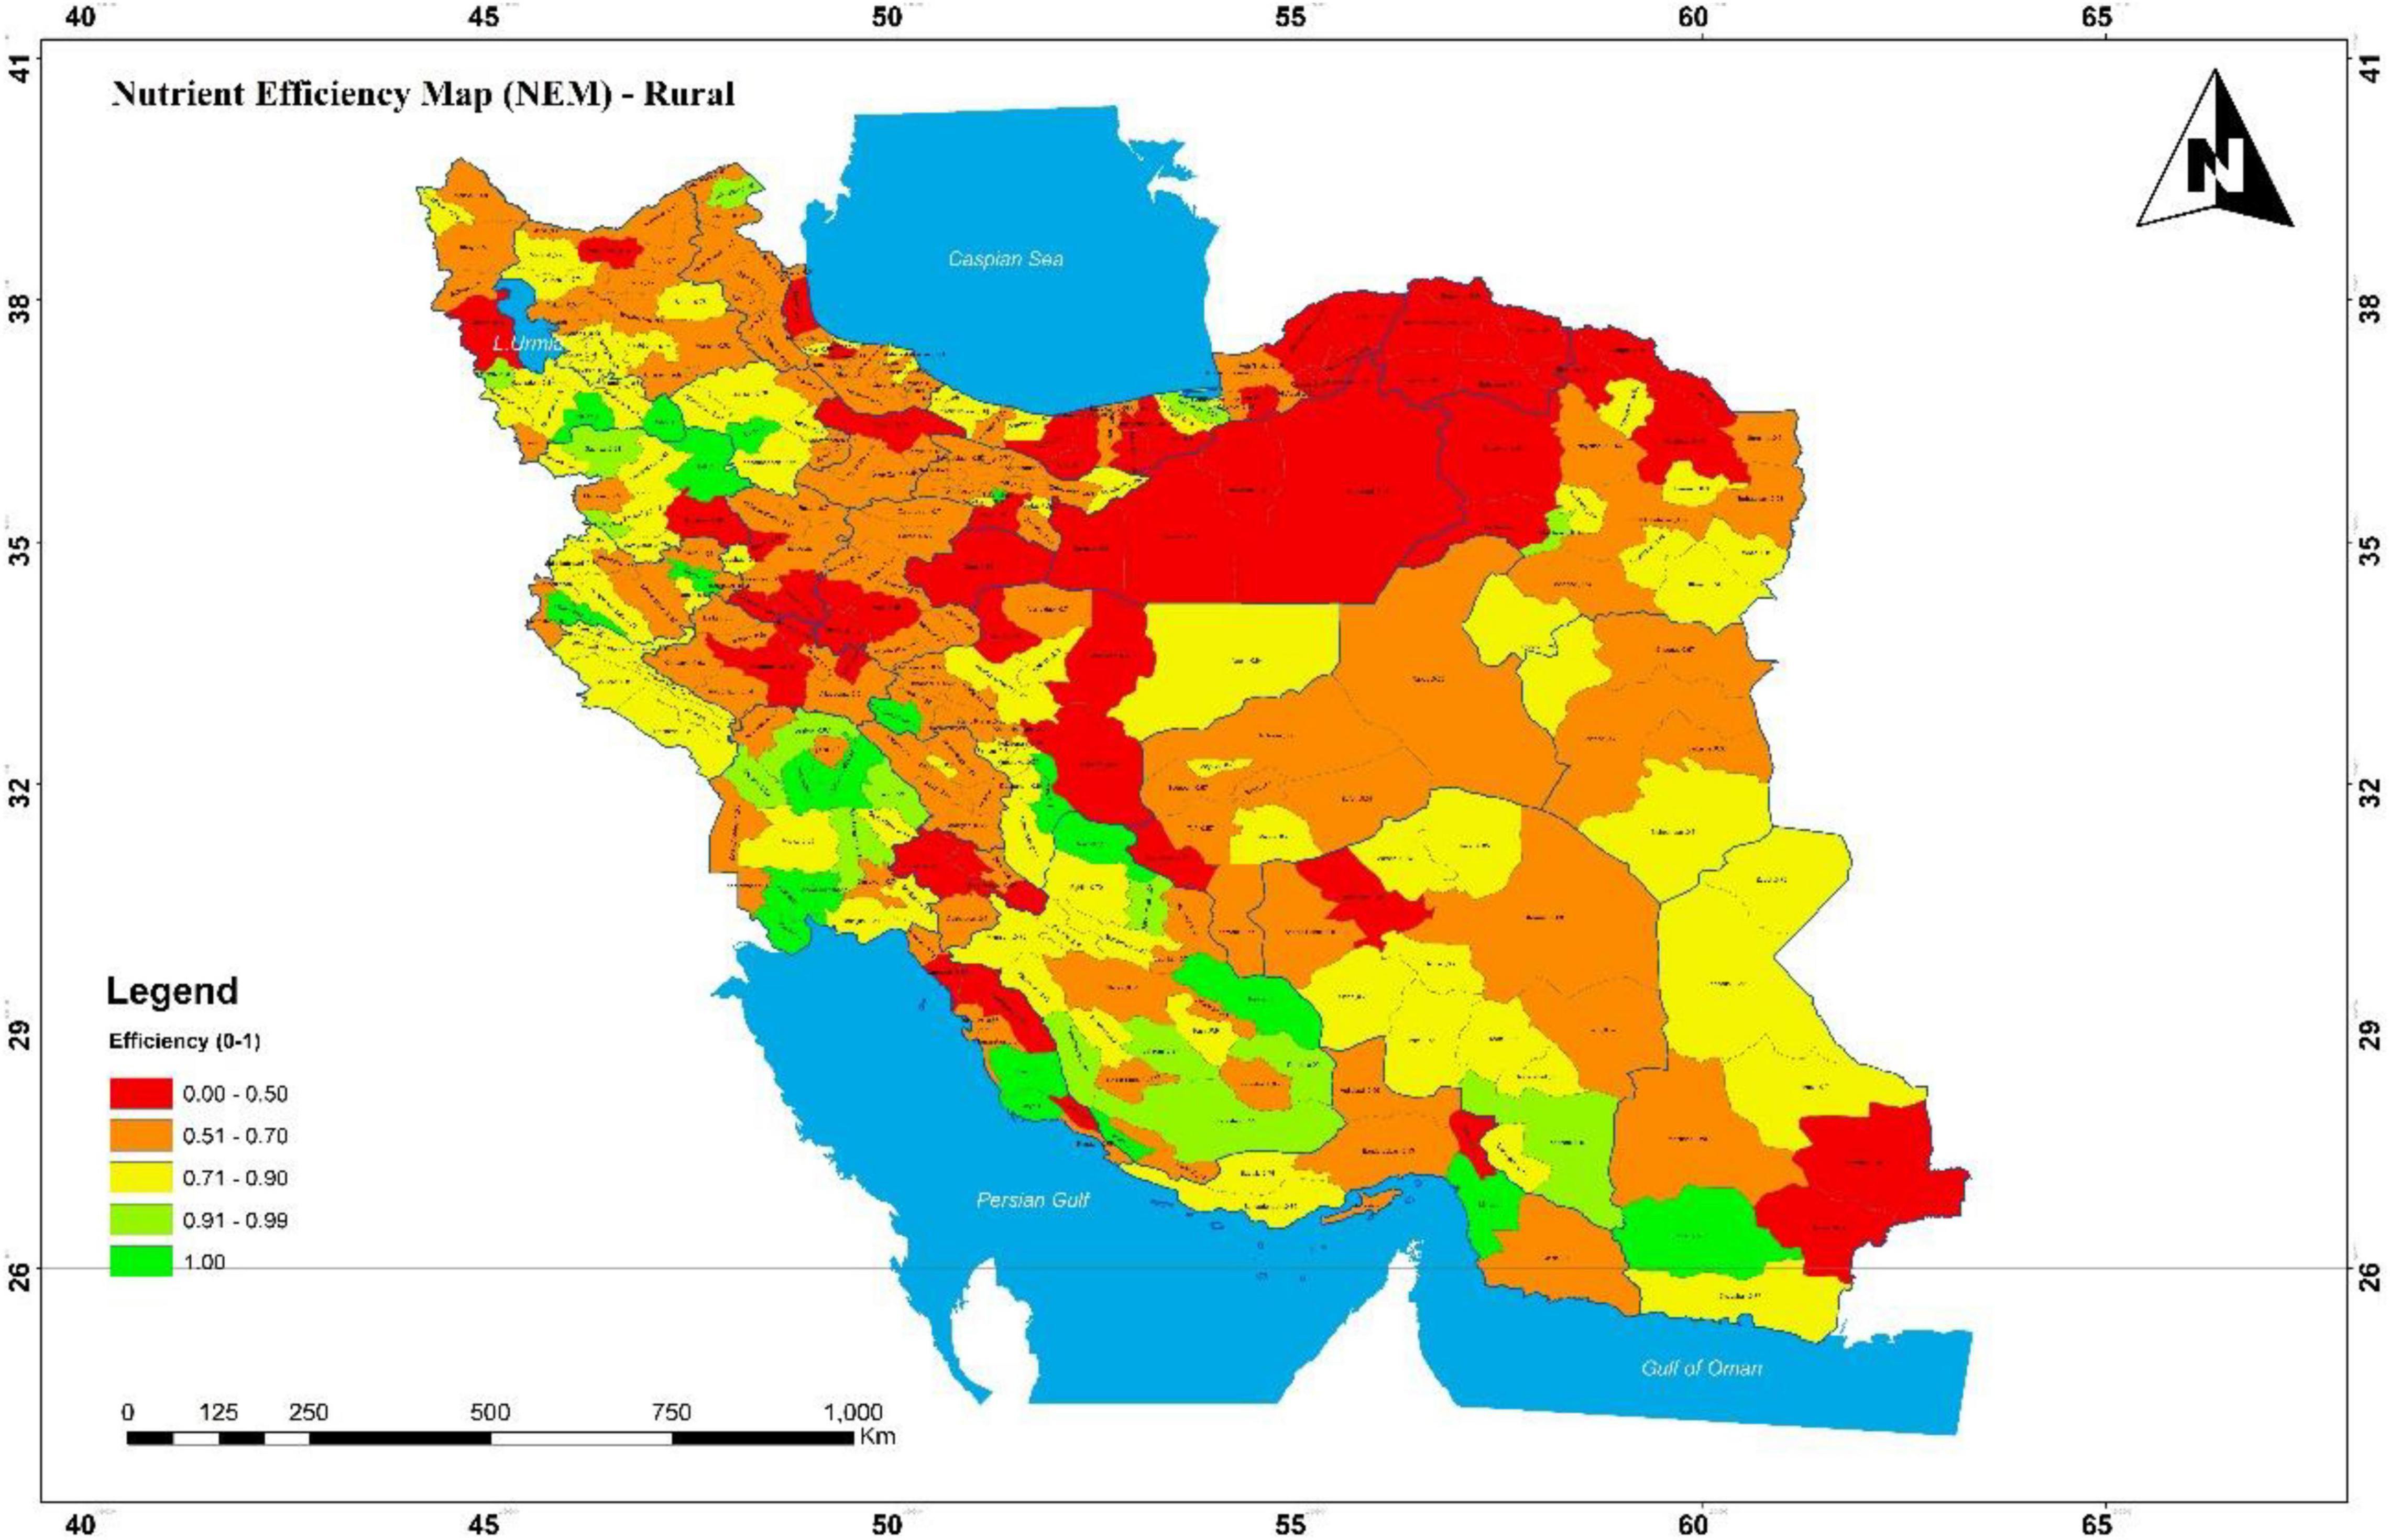
Figure 2. Nutrient intake efficiency map (NIEM) in the rural area in Iran, 2016.
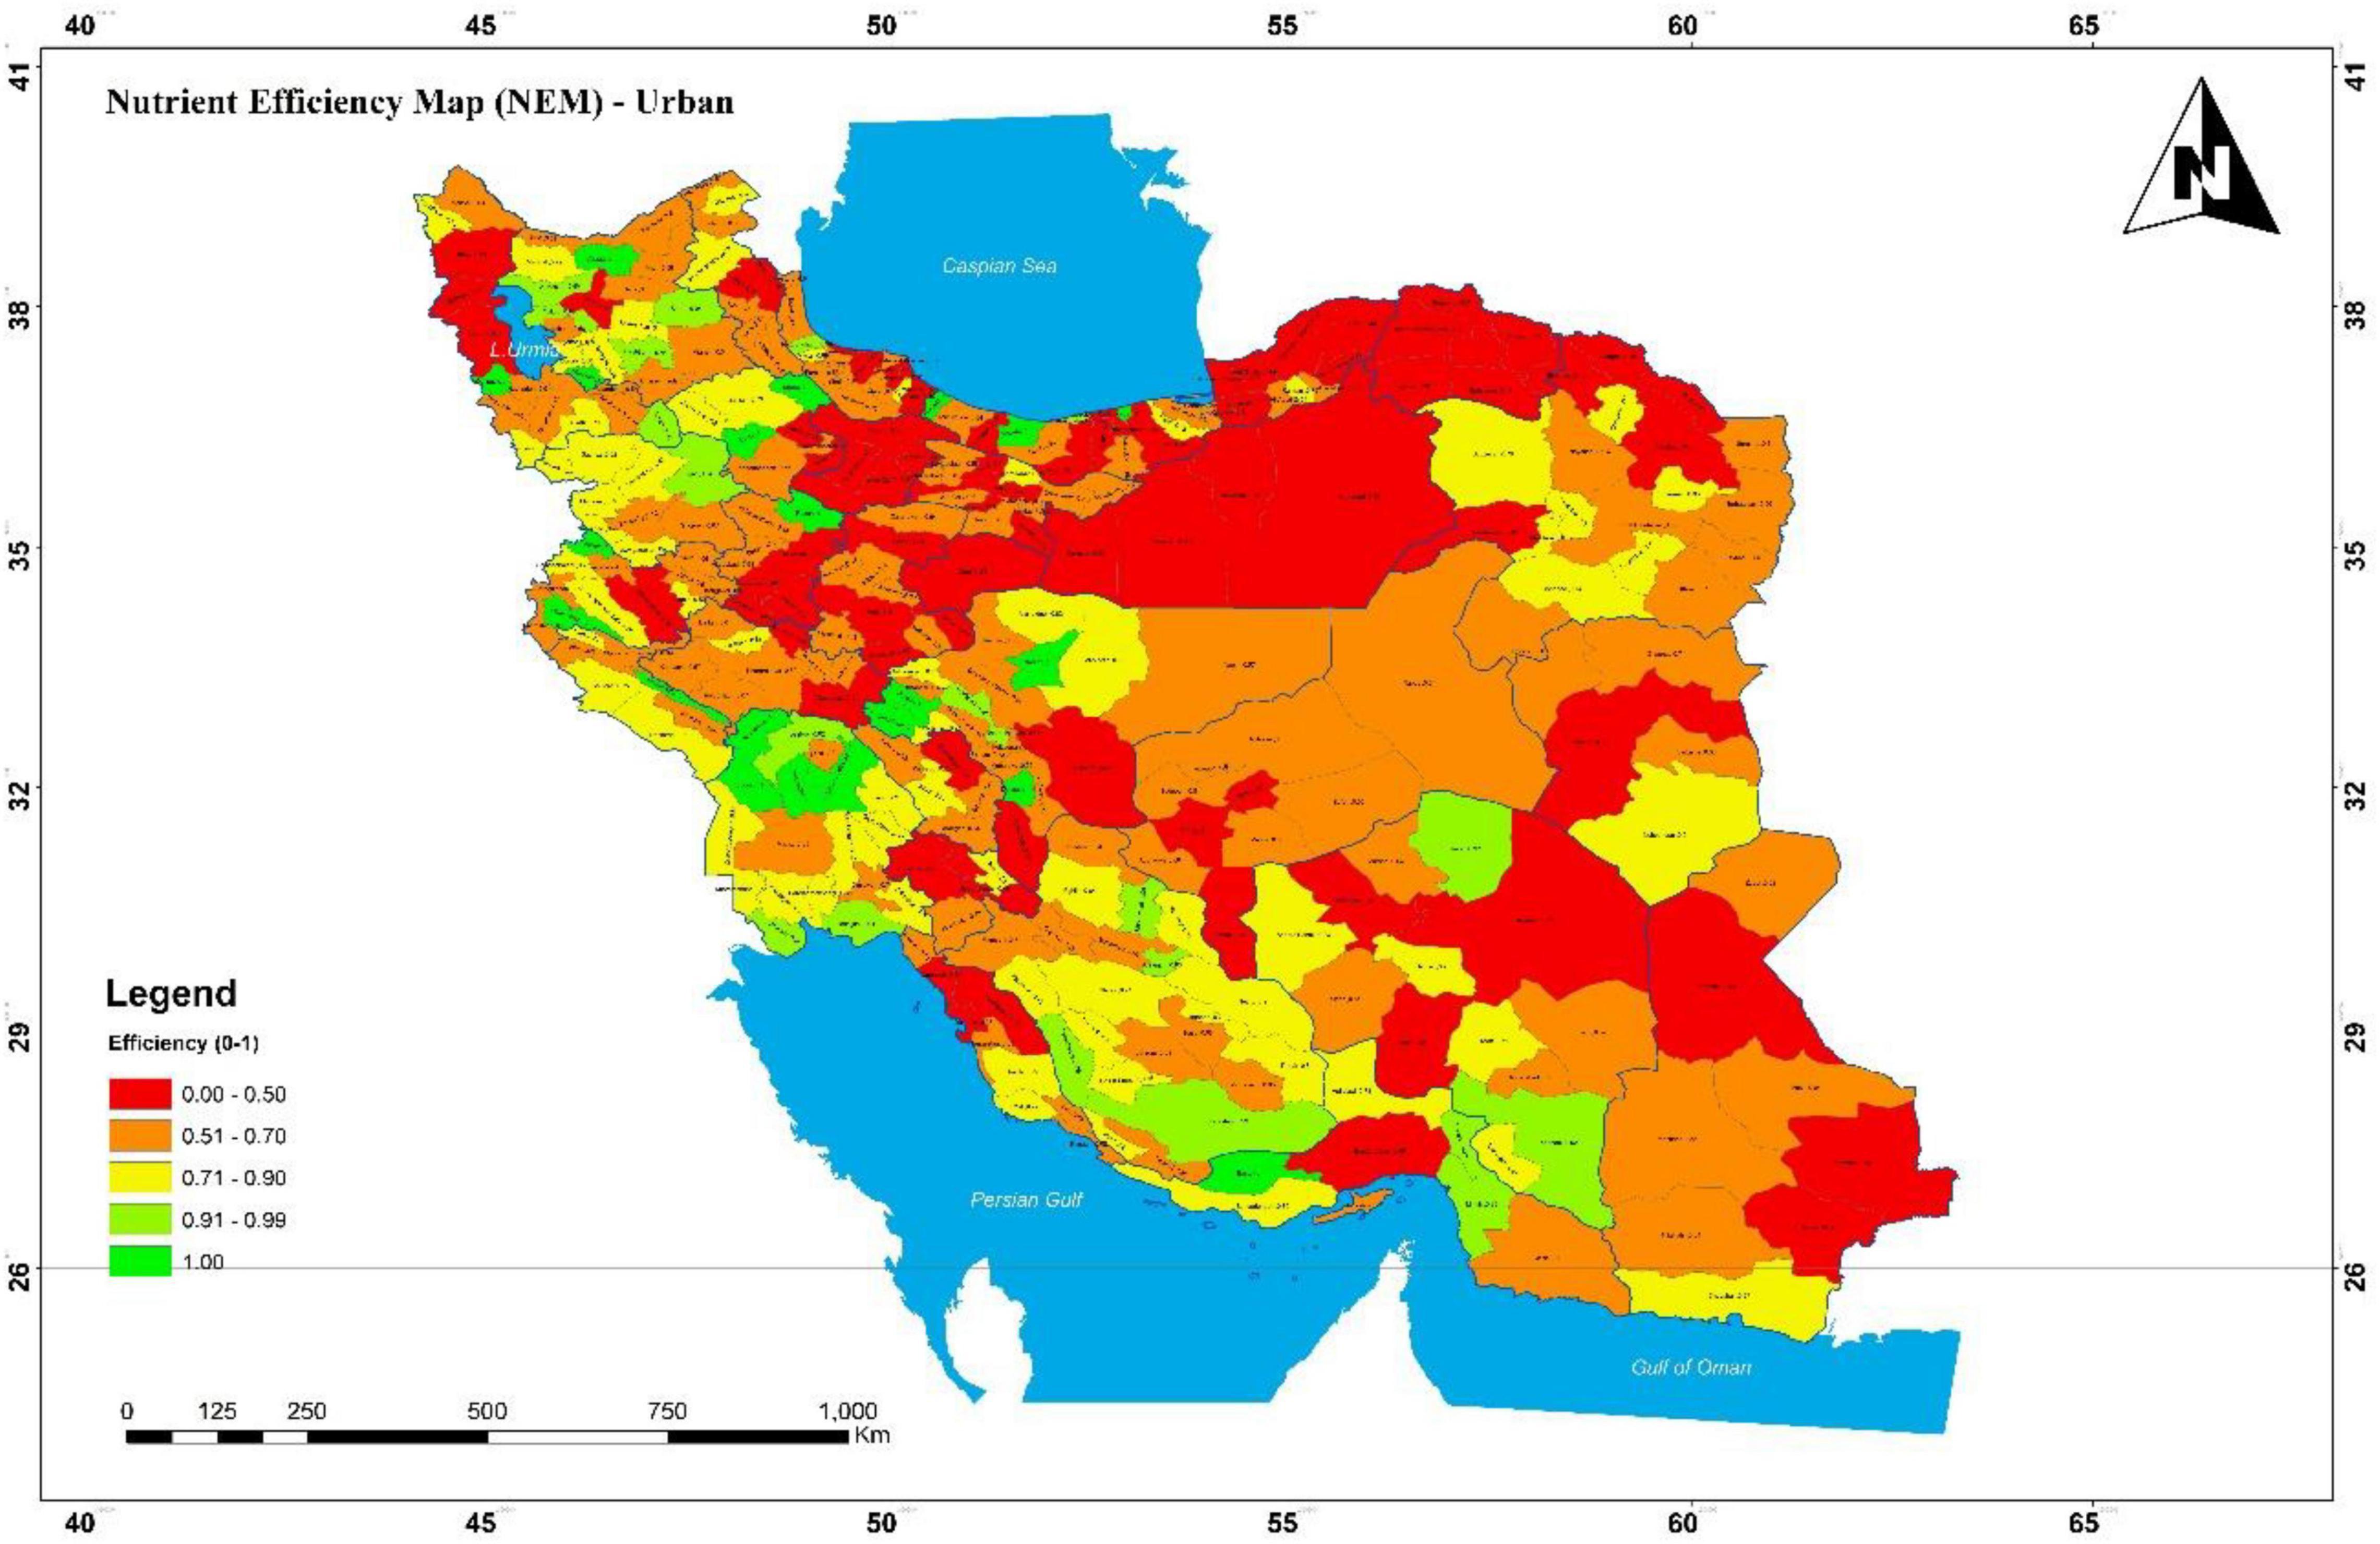
Figure 3. Nutrient intake efficiency map in the urban area in Iran, 2016.
This map has been developed using GIS software, encompassing a broad range of applications using a combination of digital maps and geo-referenced data. Many rural townships had efficiency scores of less than 70%, which are even lower in the Northeast. North, East, and Northeast townships had low urban nutritional efficiency, even lower than their rural areas. In central Iran, rural areas were more nutrient efficient than urban areas. Khuzestan had the highest efficiency in both rural and urban areas, followed by Fars, while Qom was the lowest. Comparison of two areas in Figure 4 demonstrates that the average efficiency in the rural areas is higher than in urban areas among most provinces in Iran. As can be seen in Figure 4, the greatest gap in nutrient efficiency between rural and urban areas is in Alborz province.
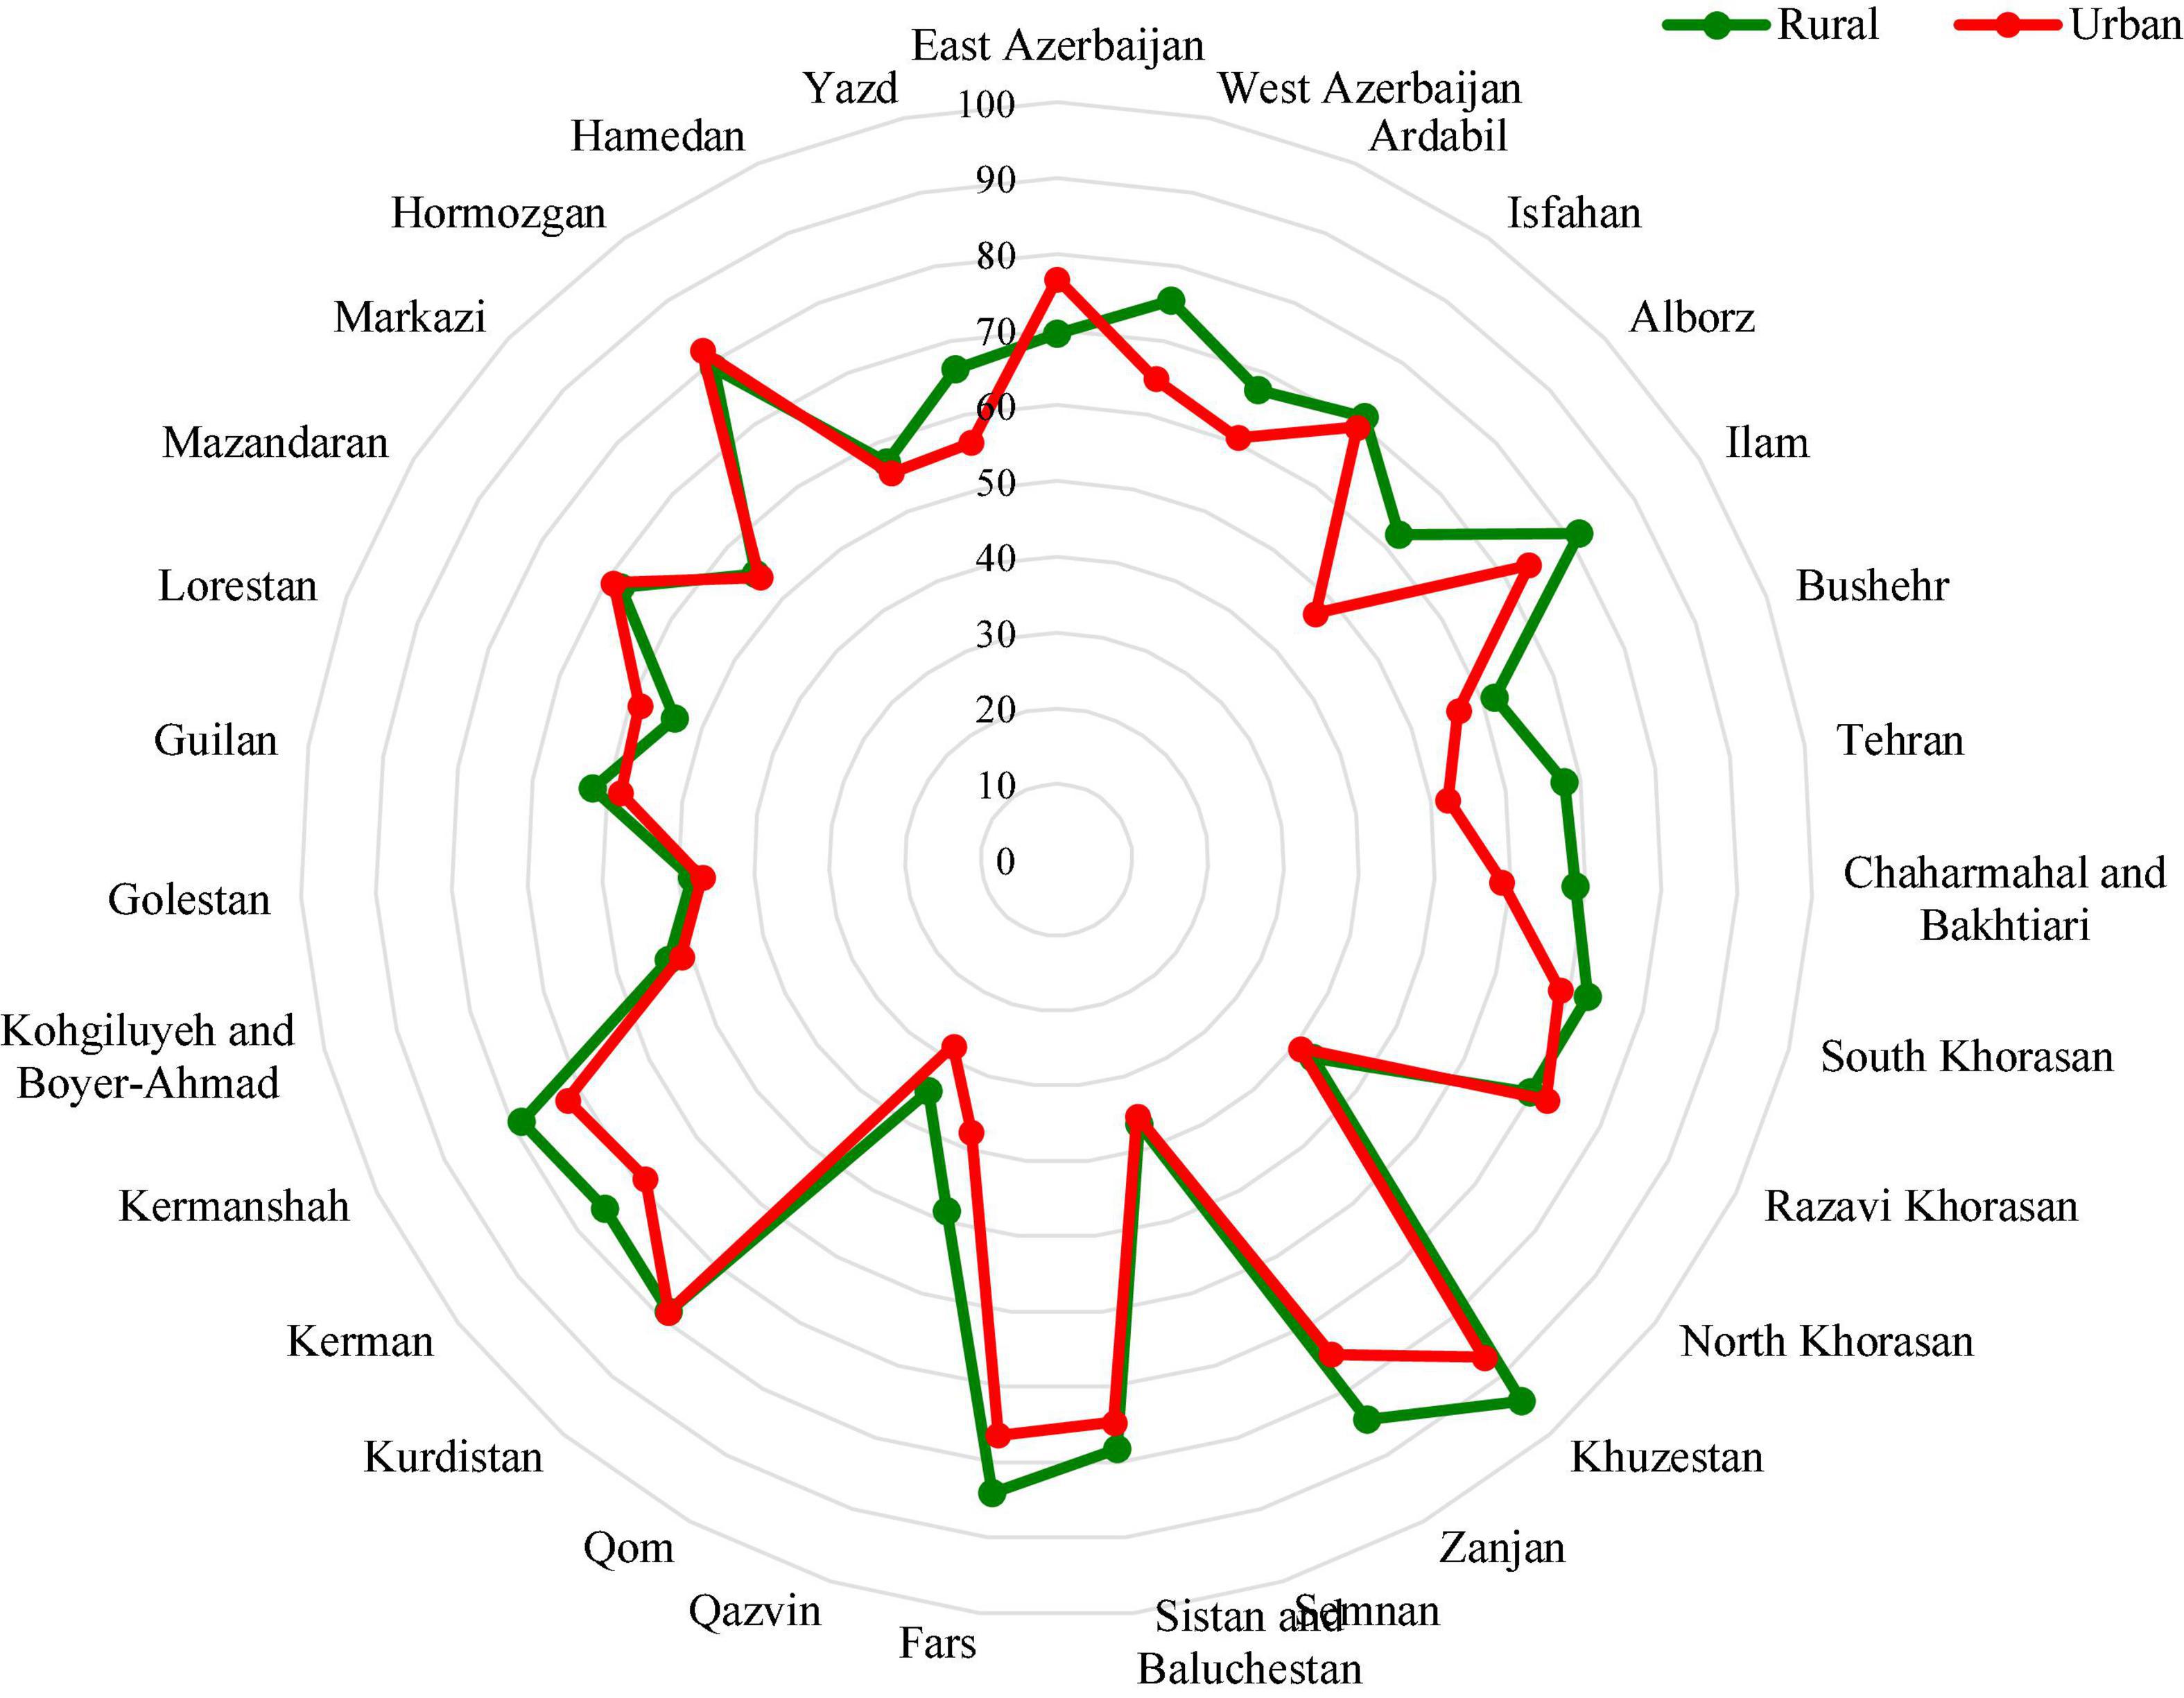
Figure 4. Comparison of the average nutrient efficiency in the provinces in both rural and urban areas.
The results indicated that a better-balanced food group’s consumption was found in rural as compared to urban areas.
Associated Factors With Nutrient Intake Efficiency
Factors associated with nutrient intake efficiency were determined in both rural and urban areas. Table 6 includes the estimated coefficients from the Tobit along with the z-statistics and shows differences between the two areas. Age of household head was positively and significantly associated with nutrient efficiency in both rural and urban areas. Households whose heads were educated had better nutrient efficiency than other households. Male-headed households had a lower nutrient efficiency than female-headed households in urban areas, while the gender of the household head had no impact on nutrient efficiency in rural areas. Household size was directly and positively associated with nutrient efficiency only in rural areas. Dietary diversity was positively and significantly associated with the nutrient efficiency in both rural and urban areas, with the association stronger in the rural areas than in urban areas. Ethnicity was significantly and directly associated with nutrient efficiency. Azeri areas, the densely ethnic population in the northwest of the country, had a higher nutrient efficiency as compared to other ethnicities. Tropical areas, such as Ilam, Khuzestan, Bushehr, and Sistan and Baluchistan, had higher nutrient efficiency than cold regions. Eventually, some factors that include capital cities, the share of agricultural income, and married head of household were inversely and significantly associated with nutrient efficiency in both rural and urban areas.

Table 6. Effective factors on nutrient inefficiency in the rural and urban areas.
Discussion
Our work established the value of FOC and Optimal Nutrient Intake Efficiency (ONIE) within optimizing frameworks for studying nutrient security. Empirically, the utility of using a combination of the DEA and Tobit model is vindicated. A large data set to derive policy-relevant results can be used within our models.
Nutritional education increases knowledge of food combinations (30, 31), and as a result, household nutrient efficiency increases. In this paper, an innovative approach was developed to identify the association between food combinations and nutrient efficiency in urban-rural areas in Iran using a two-stage approach. According to the descriptive results, the nutrient intake of Iranian households in rural areas was greater than in urban areas. This result may be associated with higher agricultural and animal production by rural households (32, 33). Rural households can easily access adequate food ingredients, especially raw ingredients, which help them to access needed nutrients without extra payment.
In the first phase, the nutrient efficiency of households was calculated using the DEA approaches. The results showed that the combination of food ingredients was not utterly optimal in all provinces in both rural and urban areas. Rural households had 30% nutrient inefficiency and urban households had 35% inefficiency in food group consumption. Nutrient efficiency was greater in rural areas than the urban areas, and generally, the availability of healthier foodstuff combinations in the rural areas is better than in urban areas. The provinces of Qom and Semnan had the lowest efficiency in both rural and urban areas. The highest rural and urban inefficiency scores were in the provinces of Fars, Khuzestan, and Hormozgan. These high scores may be associated with a high level of education in these provinces contributing to choosing the best combination of food ingredients.
Most of the cities face nutrient inefficiency, especially in the northeast of the country. Households could increase their nutrient intake by ameliorating food group combinations. Food combinations in high-efficiency areas could be used as a guideline to improve nutrient status in low-efficiency areas. For example, food ingredient combination in Khuzestan province, a better location in terms of nutrient efficiency, can be monitored and addressed by the adjacent provinces for improving households’ nutrient status.
Benchmarks for each province to reach ONIE provide the targets for Iranian households to balance expenditures and consumptions for health protection. For better nutrient efficiency in households in Tehran, a densely populated capital city, households should decrease cereal consumption by 30% per month. To optimize foodstuff consumption (receiving the current nutrient intake) and to reduce households’ expenditure in Tehran in comparison with other provinces where households have the better ONIE, households should decrease, per person, the consumption of all food groups. The dietary pattern in some provinces was sub-optimal.
The nutrient status of Iranian households can be improved by decreasing their food expenditure without changing their nutrient intake. As the results confirmed, most of the Iranian households were engaged in an overconsumption pattern in all provinces, low in some provinces and high in others. This status can be achievable by controlling the overconsumption pattern and allocating the extra expenditure to high-quality nutrients. That could allow the country to save strategic food ingredients, and, eventually, decrease the amount some households spend on food. This could be important for Iran, as one of the biggest importers of food ingredients worldwide.
The direct association between the age of the head of the household and nutrient efficiency suggests that older heads have more experience in combining food ingredients and also their knowledge and capability of food combinations lead to increasing nutrient efficiency (34, 35). Some studies contended that elder heads have an adequate ability to food money management along with experience better dietary quality (36).
Higher education of household heads is associated with increasing the nutrient efficiency of food consumption, and so food overconsumption is reduced. This result contradicts a study in Suriname which found that both adequate and excessive consumption were increased with the higher degree of urbanization, level of education, and income, with the exception of the highest categories of education and income (4), because the level of Suriname people’s income is generally low. Therefore, a slight increase in income level or education level will lead to extending the overconsumption pattern due to increasing the level of people’s expectations, especially in the low and middle-income groups.
Female-headed households had greater nutrient efficiency in urban areas. A female head may have more experiential knowledge of combining different foods, as they play an essential role in the nutrition of children and other members (37). Some studies found that male-headed households have higher nutrient security (38, 39). These results are attributable to the lower incomes and lower access to resources of female-headed households. Once the confounding causal influence of income and economic status is controlled, female-headed households have higher nutritional efficiency.
Household size had a direct and significant association with nutrient efficiency in rural areas. Due to the larger size of rural households, they endeavor to use their food ingredients appropriately and completely, and therefore, the amount of food overconsumption is lower than in smaller households. The association between household size and food consumption has been found to be positive in some studies (32, 34) or negative in others (33, 40).
The share of income from agriculture is inversely associated with nutrient efficiency. When rural households access easily adequate food ingredients through agricultural production, they overconsume their resources. In fact, rural dwellers are confident that they always access the needed raw ingredients (41) and do not intend to control their consumption.
An increase in the number of different food groups consumed provides a quantifiable measure of improved household food access and nutrient consumption. In general, any increase in household dietary diversity reflects an improvement of the household’s diet quality (25). An increase in the number of consumed food groups will lead to increased nutrient intake efficiency, eventually increasing nutrient security. In contrast with our findings, some studies contended that living in urban areas is associated with higher dietary diversity that includes higher fruit and vegetable intake, in low- and middle-income countries.
Azeri people had more nutrient efficiency than other ethnicities in Iran. This result suggested that this population has a high ability to combine food ingredients in an optimized level for achieving nutrient efficiency as compared to other ethnicities. As a geographical pattern of food consumption demonstrated, people of Azeri ethnicity, living in the northwest of Iran, can prepare different kinds of food through distinct food ingredients that lead to a decrease in food overconsumption.
The geographical location of a province was significantly associated with nutrient efficiency. Living in the capital province led to the decrease of the NIE in both rural and urban areas. Household income in Tehran is higher than other locations in Iran, so there is no felt need to optimize food ingredients. Marques et al. (42) found that geographical location is a key factor in controlling food overconsumption and recycling systems. On the other hand, a study contended that, due to the overconsumption pattern, the rate of overweight and obesity in Tehran province was more than the country rate. About 42.7% of all participants in that study had overweight and 45% had obesity.
Nutrient efficiency is directly associated with the type of knowledge of people in different locations. According to the food culture of people in seaside cities, the NIE of households who are living in these cities is lower than those who are living in other locations. The abundance of food, plentiful local and traditional foods, diet diversity, and access to adequate food ingredients may be the main reasons for this negative association in these seaside cities.
Ultimately, some countries, especially developing countries, face prevailing food insecurity due to the lack of accessibility to adequate resources and enough foods (43). The results of such studies can be used to determine the accurate consumption of food resources, prevent from the destruction of more resources for gaining more foods, and finally contribute to people saving their incomes and reducing their expenditure.
As some international reports showed, the best combination of food ingredients is really important in many African countries, because most of these countries face large numbers of hungry and food insecure population (44). Many poor African countries could better address the prevalence of undernourishment by using their available limited budgets optimally according to the methodology presented in our paper. Understanding socio-economic determinants of food efficiency is a key component of developing policies that will allow a country to maintain its resources. A comprehensive study of nutrient efficiency through sophisticated techniques will help policymakers to find the lowest cost approaches for determining the best food baskets. This study has implications for a policy most immediately within Iran. More broadly, the results could be generalizable for other MENA countries and be applicable with further country-specific empirical work to other economies in the developing world that have income levels and degree of urbanization and geographical distribution similar to those of Iran.
Although consumers in developed and high-income countries have been identified as the biggest single contributor to food overconsumption and waste (45–47), our study suggested that this claim is also the case in developing countries. Further studies are needed to investigate the NIE and calculate better ways to optimize food intake in different regions, cities, and countries. Future studies should examine how households in different provinces with a high nutrient efficiency allocate their food ingredients to food preparation. That information could aid the formulation of new policies to promote higher nutrient efficiency and control the consumption of strategic and staple food ingredients.
Conclusion
The food patterns in the provinces with a high score of nutrient efficiency could be used as a guideline for other parts of the country by the government. But households also need monetary resources to access healthy foods, which must be available at reasonable prices in local markets. According to the efficiency map drawn from our empirical analysis, policies should be directed to specific geographical area-based households, especially in the Northeast, where the households face the lowest level of nutrient efficiency due to inappropriate food patterns. Socio-economic and cultural factors are associated with nutrient intake efficiency. Educating households regarding the correct combination of food ingredients to increase nutrient knowledge is necessary. The diffusion of such education could be done by broadcasting TV commercials for health-promoting dietary patterns and optimal combinations of culturally appropriate foods. Investment in primary education that includes nutrition education may increase nutrient efficiency in the long term. Moreover, the association of geographical factors can be considered an important dimension in prescribing a health policy, because being in tropical cities is associated with greater nutrient efficiency. The story in the capital province and coastal cities is completely different. Designing different training packages of food combinations, focusing on the exact reasons for the low level of optimal nutrient intake efficiency in such areas, and constructing the specified number of urban zones based on the similar nutrient intake efficiency (or close efficiency) may help policy makers and planners to save national and urban resources without declining people’s nutrient level.
This study has several limitations as other studies confront. Verification of the results is directly associated with the accuracy of filling out the questionnaires. Another limitation of this study is the need to disaggregate the large data set that included all counties and provinces in Iran. The use of the food composition table suggested by the NNFTRI could be a limitation because some of the commodities used by Iranians are not included in the table, especially imported commodities because the nutrient contents of these commodities are different.
Data Availability Statement
The datasets presented in this study can be found in online repositories. The names of the repository/repositories and accession number(s) can be found below: https://www.amar. org.ir.
Author Contributions
MP-C: supervision, formal analysis, methodology, and writing–original draft preparation. CF: conceptualization, validation, and reviewing and editing. AE: writing methodological advise, interpretation, and reviewing and editing. All authors contributed to the article and approved the submitted version.
Conflict of Interest
The authors declare that the research was conducted in the absence of any commercial or financial relationships that could be construed as a potential conflict of interest.
Publisher’s Note
All claims expressed in this article are solely those of the authors and do not necessarily represent those of their affiliated organizations, or those of the publisher, the editors and the reviewers. Any product that may be evaluated in this article, or claim that may be made by its manufacturer, is not guaranteed or endorsed by the publisher.
References
1. Lee JM, Contento I, Gray HL. Change in food consumption and food choice determinants among East Asian international students in New York. J Hunger Environ Nutr. (2020) 15:418–41. doi: 10.1080/19320248.2018.1555071
2. Hosseini SS, Pakravan-Charvadeh MR, Salami H, Flora C. The impact of the targeted subsidies policy on household food security in urban areas in Iran. Cities. (2017) 63:110–7. doi: 10.1016/J.CITIES.2017.01.003
3. Tonini D, Albizzati PF, Astrup TF. Environmental impacts of food waste: learnings and challenges from a case study on UK. Waste Manag. (2018) 76:744–66. doi: 10.1016/J.WASMAN.2018.03.032
4. Nahar-van Venrooij LMW, Marhe E, Antonius-Smits C, Krishnadath IS. Adequate and excessive food consumption in suriname: a multiethnic middle-income country. Int J Public Health. (2018) 63:1059–69. doi: 10.1007/s00038-018-1148-9
5. Khan HA. On Mortality and Poverty: An Axiomatic Approach with a Modified Index. CIRJE F-Series. (2004). Available online at: https://ideas.repec.org/p/tky/fseres/2004cf281.html (accessed June 9, 2019).
6. Thomas LN, McIntosh WA. Local food consumption is associated with higher healthy eating index score. J Hunger Environ Nutr. (2015) 10:539–48. doi: 10.1080/19320248.2014.962781
7. Charnes A, Cooper WW, Rhodes E. (1978). Measuring the efficiency of decision making units. Eur. J. Oper. Res. 2, 429–44. doi: 10.1016/0377-2217(78)90138-8
8. Emrouznejad A, Banker R, Miranda Lopes AL. Rodrigues de Almeida m. data envelopment analysis in the public sector. Socioecon Plann Sci. (2014) 48:2–3. doi: 10.1016/j.seps.2013.12.005
9. Tobin J. Estimation of relationships for limited dependent variables. Econometrica (1958) 26:24–36. doi: 10.2307/1907382
10. Chen Z, Ivan Su SI. Social welfare maximization with the least subsidy: photovoltaic supply chain equilibrium and coordination with fairness concern. Renew Energy. (2019) 132:1332–47. doi: 10.1016/J.RENENE.2018.09.026
11. Wang J, Zhao T. Regional energy-environmental performance and investment strategy for China’s non-ferrous metals industry: a non-radial DEA based analysis. J Clean Prod. (2017) 163:187–201. doi: 10.1016/j.jclepro.2016.02.020
12. Jia T, Yuan H. The application of DEA (data envelopment analysis) window analysis in the assessment of influence on operational efficiencies after the establishment of branched hospitals. BMC Health Serv Res. (2017) 17:265. doi: 10.1186/s12913-017-2203-6
13. Rosić M, Pešić D, Kukić D, Antić B, Božović M. Method for selection of optimal road safety composite index with examples from DEA and TOPSIS method. Accid Anal Prev. (2017) 98:277–86. doi: 10.1016/j.aap.2016.10.007
14. Zhou L, Xu X, Antwi HA, Wang L. Towards an equitable healthcare in China: evaluating the productive efficiency of community health centers in Jiangsu Province. Int J Equity Health. (2017) 16:89. doi: 10.1186/s12939-017-0586-y
15. Sun J, Luo H. Evaluation on equality and efficiency of health resources allocation and health services utilization in China. Int J Equity Health. (2017) 16:127. doi: 10.1186/s12939-017-0614-y
16. Li Y, Wu N, Xu R, Li L, Zhou W, Zhou X. Empirical analysis of pig welfare levels and their impact on pig breeding efficiency—based on 773 pig farmers’ survey data. PLoS One. (2017) 12:e0190108. doi: 10.1371/journal.pone.0190108
17. Nabavi-Pelesaraei A, Rafiee S, Mohtasebi SS, Hosseinzadeh-Bandbafha H, Chau K. Energy consumption enhancement and environmental life cycle assessment in paddy production using optimization techniques. J Clean Prod. (2017) 162:571–86. doi: 10.1016/J.JCLEPRO.2017.06.071
18. Li N, Jiang Y, Yu Z, Shang L. Analysis of agriculture total-factor energy efficiency in China based on DEA and malmquist indices. Energy Procedia. (2017) 142:2397–402. doi: 10.1016/J.EGYPRO.2017.12.173
19. Li H, Zhang J, Wang C, Wang Y, Coffey V. An evaluation of the impact of environmental regulation on the efficiency of technology innovation using the combined DEA model: a case study of Xi’an, China. Sustain Cities Soc. (2018) 42:355–69. doi: 10.1016/J.SCS.2018.07.001
20. Li N, Jiang Y, Mu H, Yu Z. Efficiency evaluation and improvement potential for the Chinese agricultural sector at the provincial level based on data envelopment analysis (DEA). Energy. (2018) 164:1145–60. doi: 10.1016/J.ENERGY.2018.08.150
21. Rego MAS, Sabbag OJ, Soares RB, Peixoto S. Technical efficiency analysis of marine shrimp farming (Litopenaeus vannamei) in biofloc and conventional systems: a case study in Northeastern Brazil. An Acad Bras Cienc. (2018) 90:3705–16. doi: 10.1590/0001-3765201820170953
22. Grados D, Schrevens E. Multidimensional analysis of environmental impacts from potato agricultural production in the Peruvian Central Andes. Sci Total Environ. (2019) 663:927–34. doi: 10.1016/j.scitotenv.2019.01.414
23. Nabavi-Pelesaraei A, Rafiee S, Mohtasebi SS, Hosseinzadeh-Bandbafha H, Chau K. Assessment of optimized pattern in milling factories of rice production based on energy, environmental and economic objectives. Energy. (2019) 169:1259–73. doi: 10.1016/J.ENERGY.2018.12.106
24. Zhang J, Wu Q, Zhou Z. A two-stage DEA model for resource allocation in industrial pollution treatment and its application in China. J Clean Prod. (2019) 228:29–39. doi: 10.1016/J.JCLEPRO.2019.04.141
25. Kennedy G, Ballard T, MarieClaude D. Guidelines for Measuring Household and Individual Dietary Diversity. Food and Agriculture Organization (FAO). Food and Agriculture Organization of the United Nations (2011). Available online at: http://www.fao.org/publications/card/en/c/5aacbe39-068f-513b-b17d-1d92959654ea/ (accessed July 13, 2018).
26. Gezimu Gebre G. Determinants of food insecurity among households in Addis Ababa city, Ethiopia. Interdiscip Descr Complex Syst. (2012) 10:159–73. doi: 10.7906/indecs.10.2.9
27. Widiarto I, Emrouznejad A. Social and financial efficiency of Islamic microfinance institutions: a data envelopment analysis application. Socioecon Plann Sci. (2015) 50:1–17. doi: 10.1016/J.SEPS.2014.12.001
28. Iparraguirre JL, Ma R. Efficiency in the provision of social care for older people. A three-stage data envelopment analysis using self-reported quality of life. Socioecon Plann Sci. (2015) 49:33–46.
29. Swindale A, Bilinsky P. Household dietary diversity score (HDDS) for measurement of household food access: indicator guide. Food Nutr Tech Assist. (2006) 11:1–25. doi: 10.1017/CBO9781107415324.004
30. Peng C-J, Lee M-S, Wahlqvist ML, Pan W-H, Lee W-C, Lin C, et al. Needs-based food and nutrient security indices to monitor and modify the food supply and intakes: Taiwan, 1991–2010. Food Policy. (2015) 57:142–52. doi: 10.1016/J.FOODPOL.2015.10.006
31. Farrell JA, Cordeiro LS, Qian J, Sullivan-Werner L, Nelson-Peterman JL. Food affordability, food security, and the expanded food and nutrition education program. J Hunger Environ Nutr. (2018) 13:180–91. doi: 10.1080/19320248.2017.1315326
32. Babatunde RO, Qaim M. Impact of off-farm income on food security and nutrition in Nigeria. Food Policy. (2010) 35:303–11. doi: 10.1016/J.FOODPOL.2010.01.006
33. Owusu V, Abdulai A, Abdul-Rahman S. Non-farm work and food security among farm households in Northern Ghana. Food Policy. (2011) 36:108–18. doi: 10.1016/J.FOODPOL.2010.09.002
34. Akerele D. Intra-household food distribution patterns and calorie inadequacy in South-Western Nigeria. Int J Consum Stud. (2011) 35:545–51. doi: 10.1111/j.1470-6431.2010.00981.x
35. Anríquez G, Daidone S, Mane E. Rising food prices and undernourishment: a cross-country inquiry. Food Policy. (2013) 38:190–202. doi: 10.1016/J.FOODPOL.2012.02.010
36. Bhalla G, Handa S, Angeles G, Seidenfeld D. The effect of cash transfers and household vulnerability on food security in Zimbabwe. Food Policy. (2018) 74:82–99. doi: 10.1016/j.foodpol.2017.11.007
37. Heiman A, Lowengart O. Calorie information effects on consumers’ food choices: sources of observed gender heterogeneity. J Bus Res. (2014) 67:964–73. doi: 10.1016/J.JBUSRES.2013.08.002
38. De Cock N, D’Haese M, Vink N, van Rooyen CJ, Staelens L, Schönfeldt HC, et al. Food security in rural areas of Limpopo province, South Africa. Food Secur. (2013) 5:269–82. doi: 10.1007/s12571-013-0247-y
39. Lokosang LB, Ramroop S, Zewotir T. The effect of weakened resilience on food insecurity in protracted crisis: the case of South Sudan. Agric Food Secur. (2016) 5:2. doi: 10.1186/s40066-016-0051-y
40. Migotto M, Davis B, Carletto C, Beegle K. Measuring Food Security Using Respondents’ Perception of Food Consumption Adequacy. Oxford: Oxford University Press (2007). doi: 10.1093/acprof:oso/9780199236558.003.0002
41. Pakravan-Charvadeh MR, Vatanparast H, Frongillo EA, Khakpour M, Flora C. The short-term effects of COVID-19 outbreak on dietary diversity and food security status of Iranian households (a case study in Tehran province). J Clean Prod. (2021) 281:124537.
42. Marques RC, Da Cruz NF, Carvalho P. Assessing and exploring (in)efficiency in Portuguese recycling systems using non-parametric methods. Resour Conserv Recycl. (2012) 67:34–43.
43. Maitra C, Rao DSP. Poverty-food security nexus: evidence from a survey of Urban Slum Dwellers in Kolkata. World Dev. (2015) 72:308–25.
45. van Holsteijn F, Kemna R. Minimizing food waste by improving storage conditions in household refrigeration. Resour Conserv Recycl. (2018) 128:25–31. doi: 10.1016/j.resconrec.2017.09.012
46. Chegini KR, Pakravan-Charvadeh MR, Rahimian M, Gholamrezaie S. Is there a linkage between household welfare and income inequality, and food security to achieve sustainable development goals? J Clean Prod. (2021) 326:129390.
Keywords: data envelopment (DEA), efficiency, optimization, socio-economic disparity, nutrient intake, urban-rural areas
Citation: Pakravan-Charvadeh MR, Flora CB and Emrouznejad A (2022) Impact of Socio-Economic Factors on Nutrition Efficiency: An Application of Data Envelopment Analysis. Front. Nutr. 9:859789. doi: 10.3389/fnut.2022.859789
Received: 21 January 2022; Accepted: 03 March 2022;
Published: 25 April 2022.
Edited by:
Guansheng Ma, Peking University, ChinaReviewed by:
Laura Frank, La Salle University, United StatesJasenka Gajdoš Kljusurić, University of Zagreb, Croatia
Copyright © 2022 Pakravan-Charvadeh, Flora and Emrouznejad. This is an open-access article distributed under the terms of the Creative Commons Attribution License (CC BY). The use, distribution or reproduction in other forums is permitted, provided the original author(s) and the copyright owner(s) are credited and that the original publication in this journal is cited, in accordance with accepted academic practice. No use, distribution or reproduction is permitted which does not comply with these terms.
*Correspondence: Mohammad Reza Pakravan-Charvadeh, pakravan.m@lu.ac.ir