 Natasa P. Kalogiouri1,2
 Natalia Manousi1,2
 Adamantini Paraskevopoulou3
 Ioannis Mourtzinos4
 George A. Zachariadis1
 Erwin Rosenberg2*
- 1Laboratory of Analytical Chemistry, Department of Chemistry, School of Sciences, Aristotle University of Thessaloniki, Thessaloniki, Greece
- 2Institute of Chemical Technologies and Analytics, Vienna University of Technology, Vienna, Austria
- 3Laboratory of Food Chemistry and Technology, Department of Chemistry, Aristotle University of Thessaloniki, Thessaloniki, Greece
- 4Department of Food Science and Technology, School of Agriculture, Aristotle University of Thessaloniki, Thessaloniki, Greece
This study provides the first assessment of the volatile metabolome map of Tuber Aestivum and Tuber Borchii originating from Greece using headspace solid-phase micro-extraction (HS-SPME) coupled to gas chromatography-mass spectrometry (GC-MS). For the extraction of the volatile fraction, the SPME protocol was optimized after examining the effects of sample mass, extraction temperature, and extraction time using the one-variable at-a-time approach (OVAT). The optimum parameters involved the extraction of 100 mg of homogenized truffle for 45 min at 50°C. Overall, 19 truffle samples were analyzed, and the acquired data were normalized and further processed with chemometrics. Agglomerative hierarchical clustering (HCA) was used to identify the groups of the two species. Partial least squares–discriminant analysis (PLS-DA) was employed to develop a chemometric model that could discriminate the truffles according to the species and reveal characteristic volatile markers for Tuber Aestivum and Tuber Borchii grown in Greece.
Introduction
Truffles are below-ground-level growing fungi, and the species belonging to the genus Tuber are highly appreciated because of their nutritional value, health benefits, and unique organoleptic properties. Their rich content in minerals, fatty acids, proteins, amino acids etc., and their characteristic aroma and flavor are the key factors responsible for their appreciation as an exclusive food ingredient (1–3).
The quality of the truffles is related to the soil quality, vegetation characteristics and climate of each region. More than 200 species have been discovered in the Tuber genus (1). Truffles are mainly grown in Central and South European forests. The most common valuable and extensively appreciated truffle species are Tuber Melanosporum (precious black winter truffle), Tuber Aestivum (black summer truffle), Tuber Borchii (white spring truffle), and Tuber Magnatum (precious white autumn truffle). The geographical location where they are grown has significant impact on its volatile attributes (4). Even though they are a rare commodity they are found in relative abundance in Greece. Truffles grown in the Mediterranean region are considered of high quality as the soil and weather conditions, especially in the mountainous areas of north and northwestern Greece, are ideal for the growth of mushrooms of exceptional quality. Recently, particular attention has been given to the volatile analysis of several truffle species originating from France, Spain, Germany, Poland, United Kingdom, Italy, Croatia, Slovenia, Bosnia in Herzegovina, Romania, Bulgaria, Egypt and China (1, 2, 5–8). There is no documentation of truffles grown in Greece, however, despite their superior quality and high economic value. No studies on the volatile fingerprint of Tuber species originating from Greece are yet to be established.
The development of analytical methodologies that allow the exploration of the complex volatile composition of truffles is a challenging task. The volatile fingerprint of Tuber species has been the object of numerous studies which have employed a variety of techniques (9–14). Gas chromatography (GC) coupled to mass spectrometry (MS) enables the simultaneous identification of several classes of volatiles. Several studies have analyzed the volatile compounds of different truffle species using headspace chromatographic analysis (5, 9, 10), and purge and trap GC-MS (10). Solid-phase microextraction (SPME) is an effective, green, solvent-free, and non-invasive extraction technique used for the analysis of volatiles, integrating sample extraction and analyte enrichment, and can be used for the rapid and direct extraction of analytes from gaseous, liquid, and solid matrices (11–13). SPME is a non-exhaustive technique based on the partition equilibrium of analytes between the extraction phase and the sample matrix. Conventional SPME involves the use of fibers coated with an appropriate stationary phase. The main steps of this technique include: (a) partitioning of analytes between the matrix and the extraction phase, and (b) subsequent desorption of the concentrated analytes into the analytical instrument in a single step (14–16). Head-space solid phase microextraction combined to GC-MS has been used to assess the volatile fingerprint of several truffle species (2, 7, 13, 17, 18). The majority of the studies report the volatiles identified for different analyzed species, and the use of chemometric tools to enhance the conclusions derived from the experimental data and reveal characteristic markers is limited (2, 4). Notably, to the best of the authors' knowledge, there are no reports of the characteristic markers of the Tuber species originated from Greece.
Exploratory data analysis is used to improve the understanding and the interpretability of the results. Multivariate techniques are applied to use mathematical models that are able to evaluate all the variables and identify the membership of each sample to its proper class (19). Data exploration reveals hidden information in the chromatographic data in such a form that the analyst obtains a direct representation of it (20). Unsupervised chemometric tools are frequently used to visualize the clustering of the samples based on their similarity, and supervised chemometrics are used for predictive and descriptive modeling to derive patterns among the samples as well as for variable selection (21, 22).
Tuber Aestivum and Tuber Borchii are highly appreciated in the Mediterranean region. Considering that these species originating from Greece have not been yet analyzed, the objective of this work was to optimize a HS-SPME protocol and assess their volatile metabolome using GC-MS analysis, and further analyse their volatile fingerprint and determine metabolite heterogeneity among the two species using chemometric tools, and establish markers responsible for the discrimination of Tuber Aestivum and Tuber Borchii. The HS-SPME protocol was optimized, and the chromatographic data were further processed with chemometrics. A Partial Least-Squares Discriminant Analysis (PLS-DA) model was developed and validated to discriminate the samples and to identify characteristic markers for each species.
Materials and Methods
Samples
Fresh ascocarps of two truffle species Tuber Aestivum (eight samples) and Tuber Borchii (eleven samples) were harvested from natural truffle zones in Greece (Prefectures of Ioannina, Achaia, Evoia, and Chalkidiki) during April and July 2021, when truffles mature in this region, and were kindly provided by local suppliers between May and June 2021. As it is known that the expression of vioaltile species is also depending on the maturity of the truffles (23), they were investigated in comparable states of maturity. The truffles were rinsed with tap water and left to dry in an air hood according to Culleré et al. (6). They were stored at −20°C until analysis.
Instrumentation
The determination of the volatile compounds in truffle samples was conducted using an Agilent 6890 N Gas Chromatograph coupled to an Agilent 5973 K Quadrupole Mass Spectrometric Detector (Palo Alto, CA). The separation of the compounds was performed on a DB-WAX capillary column (60 m × 0.32 mm, 0.25 μm film thickness, Agilent Technologies, Santa Clara, CA) using helium (99.999%) as mobile phase delivered at a flow rate of 1.2 ml min−1. The initial oven temperature was 40°C and it was held constant for 5 min. Then the temperature was raised to 240°C (rate 5°C min−1) and it was held constant for 5 min. Using this oven program, the separation of the volatile compounds was completed within 50 min. Splitless injection was performed. The following temperatures were adopted: injector temperature; 270°C, MS source; 250°C and MS Quad; 130°C. The compounds were determined in scan mode recording ions with an m/z ratio of 35–350.
HS-SPME Analysis
An 85 μm Carboxen/Polydimethylsiloxane (CAR/PDMS) fiber attached to a manual SPME fiber holder (Supelco, Bellefonte, PA) was used for the HS-SPME procedure. Conditioning of the fiber was conducted prior to the analysis based on the instructions of the manufacturer. For the extraction of the volatile compounds, an aliquot of truffle (100 mg) was weighted into a 15 ml-glass vial. Extraction of the volatile compounds took place at 50°C within 45 min. After this time span, the fiber was removed from the vial containing the sample and the analytes were desorbed in the injector of the GC-MS instrument for 5 min which previously had been shown to be sufficient for complete desorption, and for the avoidance of sample carry-over. Each experiment was performed in triplicate.
Optimization of HS-SPME Parameters
Prior to the analysis of the truffle samples, optimization of different parameters that could potentially affect the performance of the HS-SPME method was undertaken. For this purpose, different sample masses (100–500 mg), extraction time spans (15–45 min) and extraction temperatures (30–50°C) were investigated using bulk samples. During optimization the signals of representative compounds belonging to different compound classes (i.e, 2-butanol, 2-butanone, 4-hydroxy-3-hexanone and 1-octen-3-ol) were monitored (1, 5, 7). The peak areas obtained under the individual conditions were normalized with regard to the peak area obtained for each compound under the optimum/selected conditions, and were expressed as percentage.
Chemometric Analysis
Clustering analysis was employed to divide the samples into clusters according to their similarity criteria. Agglomerative Hierarchical Clustering (HCA) was used to build a hierarchy of clusters, group the samples in different clusters, and visualize the clusters of the samples (24). Partial least squares discriminant analysis (PLS-DA) is a supervised pattern recognition technique used to find the appropriate class for each sample (20). In PLS-DA a mathematical model is built to establish a correlation and classify the samples, knowing the label of each class (25). A PLS-DA prediction model was developed using the MetaboAnalyst 5.0 platform (26) to discover patterns in the chromatographic data of the truffles species, establishing the most important volatile markers responsible for their discrimination. The data table was normalized by dividing the peak area of each individual peak with the sum of all the peak areas of each chromatogram before exporting to HCA and PLS-DA. Pareto scaling was used and the variables were mean-centered (21, 22).
Results and Discussion
Optimization Results
Evaluation of Sample Mass
The appropriate amount of truffle sample was initially examined. In principle, the amount of the adsorbed analytes increases by increasing the sample mass. However, unwanted phenomena of fiber overloading might also occur when increasing the amount of sample (27). Thus, the sample mass was investigated between 100 and 500 mg to ensure high method sensitivity in combination with reasonable sample consumption. As shown in Figure 1, an aliquot of 100 mg of truffle sample was sufficient and no increase in the sensitivity of the method was observed upon sample amount increase. Thus, further experiments were conducted with 100 mg of truffle samples.
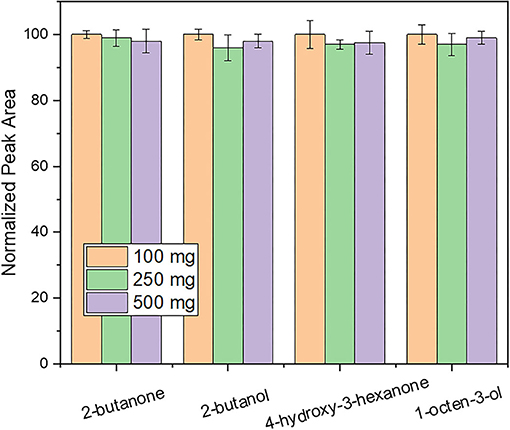
Figure 1. Evaluation of the influence of sample mass on response using an extraction time of 30 min and a desorption time of 5 min. Other parameters as described in the experimental section.
Evaluation of Extraction Temperature
Extraction temperature was studied over the range 30 to 50°C. As shown in Figure 2, the intensity of 4-hydroxy-butanone and 1-octen-3-ol was increased by increasing the extraction temperature up to 50°C. This can be attributed to the higher concentrations of analytes that are being released into the headspace by increasing the extraction temperature (30). Further increase of the extraction temperature was not investigated to avoid decomposition of natural products. Thus, an extraction temperature of 50°C was chosen for the HS-SPME procedure.
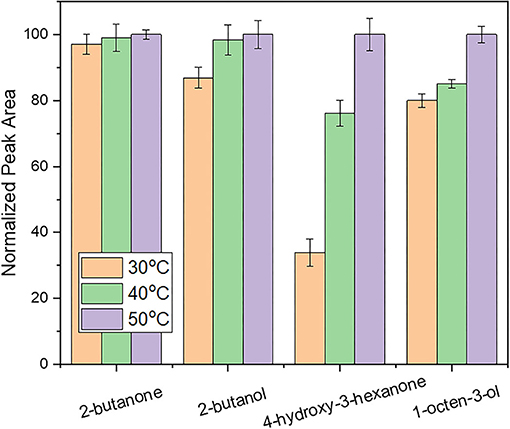
Figure 2. Evaluation of the influence of extraction temperature on response using an extraction time of 30 min and a desorption time of 5 min. Other parameters as described in the experimental section.
Evaluation of Extraction Time
After the selection of the optimum sample amount and extraction temperature, the extraction time of the HS-SPME procedure was investigated between 15 and 45 min. This parameter is important to establish the time that is needed for the analytes to reach an equilibrium to ensure the highest sensitivity of the technique (31). As shown in Figure 3, equilibrium was achieved for the less abundant compounds (i.e, 2-butanol, 2-butanone) within 45 min. On the other hand, for the more abundant compounds such as 4-hydroxy-3-hexanone and 1-octen-3-ol the increase of the extraction time resulted in the increase of their intensities even after this time. As is well known from the theory of SPME that equilibration between the fiber coating and the sample headspace is depending (among other factors) on both, sample volatility, partitioning coefficient and also concentration and that equilibration time increases with the latter two factors, the focus of the optimization of this parameter was on the less intense peaks, ensuring that these would be extracted to a high extent. Further increase of the extraction time was not investigated to ensure a rapid extraction process. Thus, 45 min were chosen as the extraction time for further experiments.
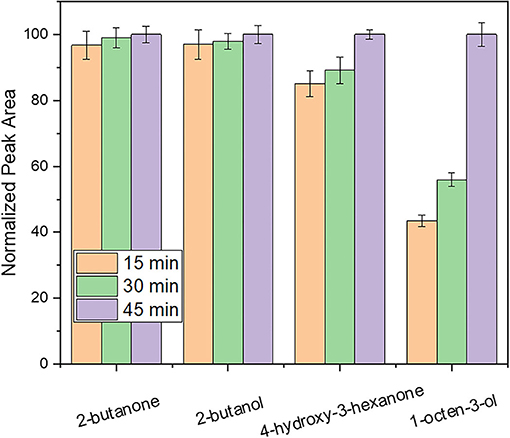
Figure 3. Evaluation of the influence of extraction time on response using a desorption time of 5 min.
GC-MS Analysis
The optimum extraction parameters were adopted in the subsequent analysis of Tuber Melanosporum and Tuber Aestivum samples. Overall, 45 compounds were identified using the NIST library (Version 2.0 g, 2011) on the basis of the agreement of the mass spectra as well as their respective retention indices (RI). The peak areas of the identified compounds were normalized after assuming that the sum of the peak areas of all the identified compounds in each sample is equal to 100%. Table 1 presents a list of the identified compounds, their corresponding retention times (RTs), retention index (RI) and their normalized peak areas presented as percentages.
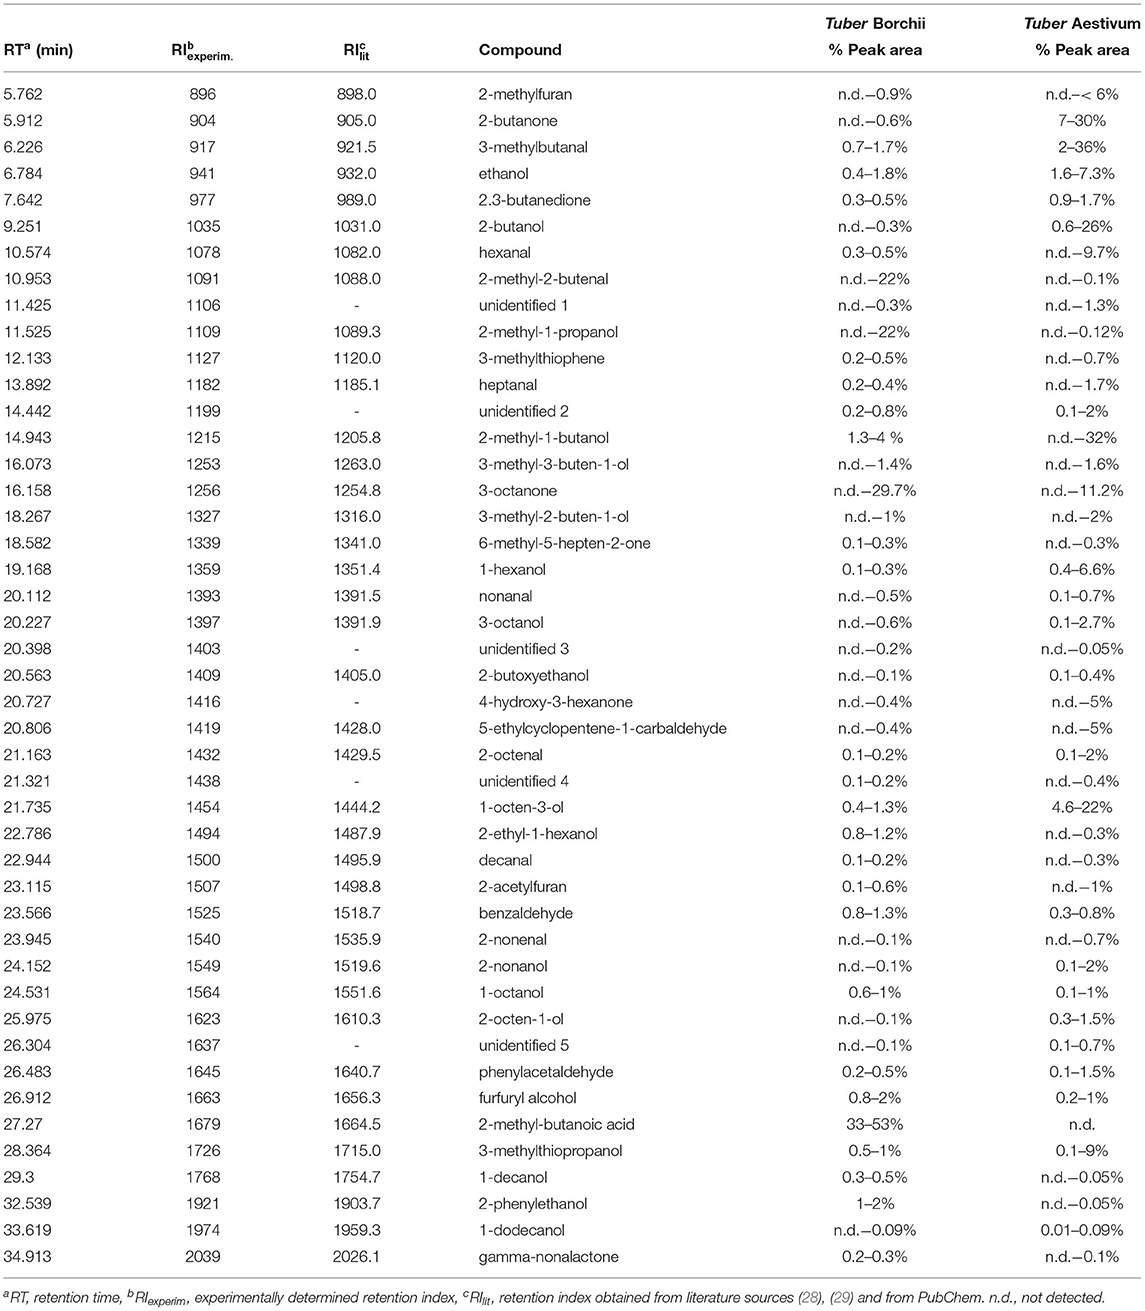
Table 1. Volatile compounds identified in Tuber Borchii and Tuber Aestivum.
The characteristic volatiles that are responsible for the unique aroma of the truffles belonged mainly to the classes of aldehydes, alcohols, and ketones (32). According to Table 1, 3-methyl-butanal (2–36%) was the most abundant compound and is responsible, according to the descriptions in the literature, for the “sulfurous” and “animal” odor, and has been reported as a characteristic volatile of black truffle species and characteristic marker of truffle degradation and product spoilage produced by axenic cultures of truffle mycelium, fungal and bacterial phyla (5, 8). The second most abundant compound to be identified in Tuber Aestivum was 2-methyl-1-butanol at a percentage of up to 32%. It is a naturally occurring alcohol responsible for the ethereal type odor that has already been determined in black truffles (5). Furthermore, 2-butanone was identified and determined within the range between 7 and 30% which has been previously reported to vary among Tuber Aestivum ascorcaps (8). Octen-3-ol, imparting “mushroom, earthy herbal, woody, green” odor notes (4, 33), was determined over the range 5–22%. Its presence in black truffle species has been associated with the earthy and dusty aroma of the product. In addition, 3-octanone (<11.2%) and ethanol (2–7%) that are responsible for “mushroom/herbal” and “alcoholic” notes (34), respectively, and their high abundance in black truffle species has already been reported (5, 8, 35) were also detected.
In Tuber Borchii, the most abundant compound identified was 2-methyl-butanoic acid within the range 33–53%, and this has already been reported to contribute to truffle aroma (18, 36). 2-methyl-butanoic acid is responsible for the pervasive, cheesy, sweaty odor. The percentages of 2-methyl-1-propanol and 2-methyl-2-butenal were also high up to 22%, for both compounds. 2-methyl-1-propanol is associated with descriptors like “sweet” and “musty”, and 2-methyl-butenal is responsible for the “green” and “fruity” odor. The presence of 2-methyl-1-propanol and 2-methyl-2-butenal in Tuber Borchii has been previously reported by D'Auria et al. (37), as well.
As regards the rest of the identified compounds, 2-methyl-1-butanol and 2-butanol, have been identified in black truffle species (5). The presence of dodecanol, phenylethanol, 2-methyl-butanoic acid, 2-octen-1-ol, 1-octanol, benzaldehyde, 1-hexanol, heptanal, hexanal, and 2,3-butanedione, in black truffles has been reported by Choo et al. (4). Nonanal, decanal, 2-nonenal, 2-methyl furan, 2-octenal, 2-ethyl-1-hexanol, 6-methyl-5-hepten-2-one, 3-octanone, and 3-octanol have been identified in the white truffle species Tuber Magnatum Pico originating from Italy, as well (18, 36).
Chemometrics
Cluster Analysis
HCA was used to develop a tree diagram and visualize the classes of the samples. The dendrogram in Figure 4 shows the clustering of the samples into two separate groups. The truffles were distributed forming two major clusters, one cluster for the samples belonging to the Tuber Aestivum species shown in red color, and one cluster for the samples belonging to Tuber Borchii species, shown in green color.
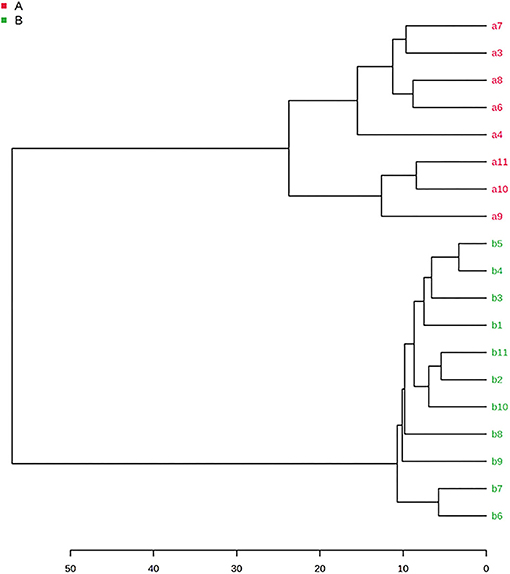
Figure 4. HCA dendrogram of Tuber Aestivum and Tuber Borchii (Samples belonging to the Tuber Aestivum species are shown in red color, and the samples belonging to Tuber Borchii species are shown in green color).
PLS-DA
To assess the volatile variations within Tuber Aestivum and Tuber Borchii and specify markers for each species a PLS-DA model was developed in the MetaboAnalyst platform. The PLS-DA model successively grouped the samples according to the species with an explained variance of 82% in the first two dimensions. The PLS-DA scores plot shows a clear discrimination between the two species, as it is shown in Figure 5. Specifically, Tuber Borchii specimens were positioned separately in the green ellipse, and Tuber Aestivum specimens were grouped in the red ellipse, and the colored areas around the samples represent the 95% confidence region of replicates. In an attempt to evaluate the significance of each variable in projection (VIP) was used to build the PLS-DA model, VIP scores were calculated to identify the most significant features responsible for the grouping of the truffle species. The VIP scores estimate the significance of each variable in projection, showing their contribution in the final model, using the cut-off value of above 0.83 according to Mehmood et al. (22). According to the VIP scores, 2-methyl-1-butanoic acid, 2-methyl-1-propanol, and 3-octanone cause greater variation in the Tuber Borchii species, while 1-octen-3-ol, 2-butanone, 3-methyl-butanal, 2-methyl-1-butanol, and ethanol are characteristic volatiles of the Tuber Aestivum species, as it is shown in Figure 6.
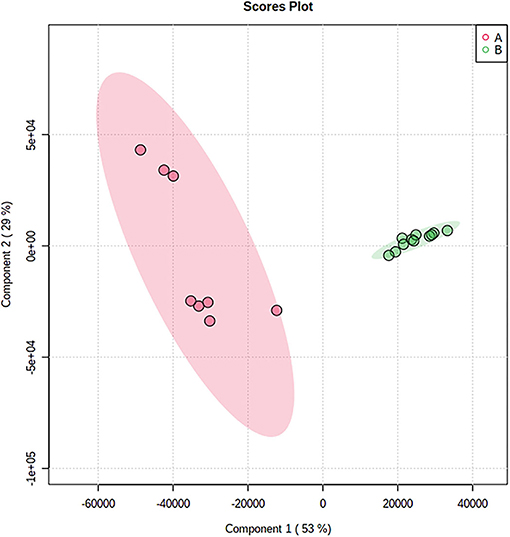
Figure 5. PLS-DA score plot showing the discrimination of the samples according to their species; Tuber Aestivum samples are grouped together in the red ellipse, and Tuber Borchii samples are grouped together in the green ellipse.
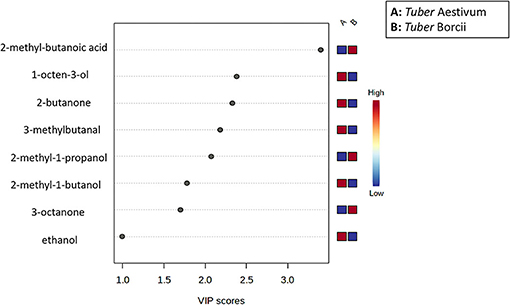
Figure 6. VIP score showing the most important features causing greater variation in the PLS-DA model; The features causing higher variation are shown in red color, and those showing the lowest variation are shown in blue for each group (A: Tuber Aestivun, B: Tuber Borchii).
The model was validated using the Leave-One-Out Cross-Validation method (LOOCV) using five components (Figure 7). According to the validation results, the goodness of fit (R2 = 0.96), and the predictability of the model (Q2 = 0.94) confirm the good performance of the prediction model. For the permutation test statistics, 100 random permutations were calculated and the results showed that the truffle samples differ statistically (with one sample t-test with p < 0.01) (38).
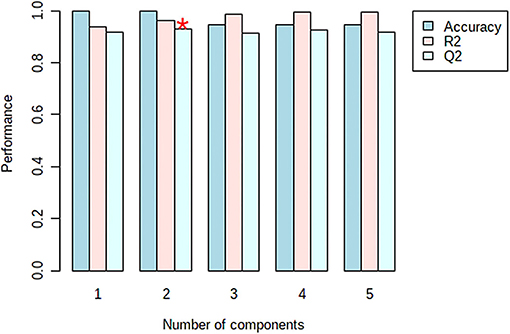
Figure 7. Cross validation parameters of the developed PLS-PDA model with the prediction error measure: accuracy, R2, Q2 (The accuracy = 1.0, was obtained from the second component shown with asterisk).
Conclusions
Nineteen samples of truffles belonging to the species Tuber Aestivum and Tuber Borchii grown in Greece were analyzed by HS-SPME coupled with GC-MS to assess their volatile fingerprint. The SPME protocol was optimized after evaluating the effects of sample mass, extraction temperature and extraction time with the OVAT approach. The optimum parameters involved the extraction of 100 mg of truffle, at 50°C for 45 min. In total, 45 volatile compounds were detected and further processed with chemometrics. 2-Methyl-butanoic acid, 2-methyl-1-propanol, and 2-methyl-2-butenal were identified as the most abundant volatiles in Tuber Borchii, while in Tuber Aestivum, the most abundant volatile compounds were 3-methyl-butanal, 2-methyl-1-butanol, 2-butanone, 1-octen-3-ol, and ethanol. An HCA dendrogram was developed showing the clustering of two major groups according to the Tuber species. A PLS-DA chemometric model was developed and was able to group the truffles according to their species with 82% of explained variance. The findings of this research clearly demonstrate that HS-SPME coupled to chemometrics can effectively be applied in the discrimination of different Tuber species.
Data Availability Statement
The original contributions presented in the study are included in the article/supplementary materials, further inquiries can be directed to the corresponding author.
Author Contributions
NK, NM, and IM designed the study. NK and NM conceived the experiment design, performed the experiments, and drafted the manuscript. NK, NM, and AP analyzed and interpreted the data. NK performed the chemometric and statistical analyses. GZ, AP, IM, and ER supervised the study. All authors provided critical revisions and approved the final version of the manuscript.
Conflict of Interest
The authors declare that the research was conducted in the absence of any commercial or financial relationships that could be construed as a potential conflict of interest.
Publisher's Note
All claims expressed in this article are solely those of the authors and do not necessarily represent those of their affiliated organizations, or those of the publisher, the editors and the reviewers. Any product that may be evaluated in this article, or claim that may be made by its manufacturer, is not guaranteed or endorsed by the publisher.
Acknowledgments
The authors would like to thank Mr. Ilias Efthimiou, certified mushroom collector, for supporting the sampling of the T. Aestivum truffles used in this study. The authors acknowledge TU Wien Bibliothek for financial support through its Open Access Funding Programme. NK also acknowledges a short-term research fellowship of TU Wien for the preparation of this manuscript.
References
1. Mustafa AM, Angeloni S, Nzekoue FK, Abouelenein D, Sagratini G, Caprioli G, et al. An overview on truffle aroma and main volatile compounds. Molecules. (2020) 25:1–27. doi: 10.3390/molecules25245948
2. Farag MA, Fathi D, Shamma S, Shawkat MSA, Shalabi SM, El Seedi HR, et al. Comparative metabolome classification of desert truffles Terfezia claveryi and Terfezia boudieri via its aroma and nutrients profile. LWT-Food Sci Technol. (2021) 142:111046. doi: 10.1016/j.lwt.2021.111046
3. Liu RS, Jin GH, Xiao DR Li HM, Bai FW, Tang YJ. Screening of the key volatile organic compounds of Tuber melanosporum fermentation by aroma sensory evaluation combination with principle component analysis. Sci Rep. (2015) 5:1–11. doi: 10.1038/srep17954
4. Choo KSO, Bollen M, Dykes GA, Coorey R. Aroma-volatile profile and its changes in Australian grown) black Périgord truffle (Tuber melanosporum) during storage. Int J of Food Sci Tech. (2021) 56:5762–76. doi: 10.1111/ijfs.15171
5. Talou T, Delmas M, Gaset A. Analysis of headspace volatiles from entire black truffle (Tuber melanosporum). J Sci Food Agric. (1989) 48:57–62. doi: 10.1002/jsfa.2740480108
6. Culleré L, Ferreira V, Venturini ME, Marco P, Blanco D. Potential aromatic compounds as markers to differentiate between Tuber melanosporum and Tuber indicum truffles. Food Chem. (2013) 141:105–10. doi: 10.1016/j.foodchem.2013.03.027
7. Segneanu AE, Cepan M, Bobica A, Stanusoiu I, Dragomir IC, Parau A, et al. Chemical screening of metabolites profile from romanian tuber spp. Plants. (2021) 10:1–17. doi: 10.3390/plants10030540
8. Strojnik L, Grebenc T, Ogrinc N. Species and geographic variability in truffle aromas. Food Chem Toxicol. (2020) 142:111434. doi: 10.1016/j.fct.2020.111434
9. March RE, Richards DS, Ryan RW. Volatile compounds from six species of truffle-Head-space analysis and vapor analysis at high mass resolution. Int J Mass Spectrom. (2006) 249–50:60–7. doi: 10.1016/j.ijms.2005.12.038
10. Bellesia F, Pinetti A, Bianchi A, Tirillini B. Volatile compounds of the white truffle (Tuber Magnatum Pico) from the Middle Italy. (1996) 11:239–43.
11. Lim DK, Mo C, Lee DK, Long NP, Lim J, Kwon SW. Non-destructive profiling of volatile organic compounds using HS-SPME/GC–MS and its application for the geographical discrimination of white rice. J Food Drug Anal. (2018) 26:260–7. doi: 10.1016/j.jfda.2017.04.005
12. Lytou AE, Panagou EZ, Nychas GJE. Volatilomics for food quality and authentication. Curr Opin Food Sci. (2019) 28:88–95. doi: 10.1016/j.cofs.2019.10.003
13. Díaz P, Ibáñez E, Señoráns FJ, Reglero G. Truffle aroma characterization by headspace solid-phase microextraction. J Chromatogr A. (2003) 1017:207–14. doi: 10.1016/j.chroma.2003.08.016
14. Locatelli M, Tartaglia A, Piccolantonio S, Di Iorio LA, Sperandio E, Ulusoy HI, et al. Innovative configurations of sample preparation techniques applied in bioanalytical chemistry: a review. Curr Anal Chem. (2019) 15:731–44. doi: 10.2174/1573411015666190301145042
15. Kabir A, Furton KG, Malik A. Innovations in sol-gel microextraction phases for solvent-free sample preparation in analytical chemistry. Trends Anal Chem. (2013) 45:197–218. doi: 10.1016/j.trac.2012.11.014
16. Kalogiouri NP, Manousi N, Rosenberg E, Zachariadis GA, Samanidou VF. Advances in the chromatographic separation and determination of bioactive compounds for assessing the nutrient profile of nuts. Curr Anal Chem. (2020) 16:1–17. doi: 10.2174/1573411016999200729111951
17. Šiškovič N, Strojnik L, Grebenc T, Vidrih R, Ogrinc N. Differentiation between species and regional origin of fresh and freeze-dried truffles according to their volatile profiles. Food Control. (2021) 123:107698. doi: 10.1016/j.foodcont.2020.107698
18. Pennazza G, Fanali C, Santonico M, Dugo L, Cucchiarini L, Dachà M, et al. Electronic nose and GC-MS analysis of volatile compounds in Tuber magnatum Pico: evaluation of different storage conditions. Food Chem. (2013) 136:668–74. doi: 10.1016/j.foodchem.2012.08.086
19. Li Vigni M, Durante C, Cocchi M. Exploratory Data Analysis. 1st ed. (2013). p. 55–126. doi: 10.1016/B978-0-444-59528-7.00003-X
20. Kalogiouri NP, Samanidou VF. Liquid chromatographic methods coupled to chemometrics: a short review to present the key workflow for the investigation of wine phenolic composition as it is affected by environmental factors. Environ Sci Pollut Res. (2020) 28:59150–64. doi: 10.1007/s11356-020-09681-5
21. Lee LC, Liong CY, Jemain AA. Partial least squares-discriminant analysis (PLS-DA) for classification of high-dimensional (HD) data: a review of contemporary practice strategies and knowledge gaps. Analyst. (2018) 143:3526–39. doi: 10.1039/C8AN00599K
22. Mehmood T, Liland KH, Snipen L, Sæbø S. A review of variable selection methods in Partial Least Squares Regression. Chemom Intell Lab Syst. (2012) 118:62–9. doi: 10.1016/j.chemolab.2012.07.010
23. Splivallo R, Valdez N, Kirchhoff N, Castiella Ona M, Schmidt JP, Feussner I, et al. Intraspecific genotypic variability determines concentrations of key truffle volatiles. New Phytol. (2012) 194:823–35. doi: 10.1111/j.1469-8137.2012.04077.x
24. Zhou S, Xu Z, Liu F. Method for determining the optimal number of clusters based on agglomerative hierarchical clustering. IEEE Trans Neural Networks Learn Syst. (2017) 28:3007–17. doi: 10.1109/TNNLS.2016.2608001
25. Kalogiouri NP, Manousi N, Rosenberg E, Zachariadis GA, Paraskevopoulou A, Samanidou V. Exploring the volatile metabolome of conventional and organic walnut oils by solid-phase microextraction and analysis by GC-MS combined with chemometrics. Food Chem. (2021) 363:130331. doi: 10.1016/j.foodchem.2021.130331
26. Pang Z, Chong J, Zhou G, De Lima Morais DA, Chang L, Barrette M, et al. MetaboAnalyst 50: Narrowing the gap between raw spectra and functional insights. Nucleic Acids Res. (2021) 49:W388–96. doi: 10.1093/nar/gkab382
27. Achouri A, Boye JI, Zamani Y. Identification of volatile compounds in soymilk using solid-phase microextraction-gas chromatography. Food Chem. (2006) 99:759–66. doi: 10.1016/j.foodchem.2005.09.001
28. Bianchi F, Careri M, Mangia A, Musci M. Retention indices in the analysis of food aroma volatile compounds in temperature-programmed gas chromatography: Database creation and evaluation of precision and robustness. J Sep Sci. (2007) 30:563–72. doi: 10.1002/jssc.200600393
29. Babushok VI, Linstrom PJ, Zenkevich IG. Retention indices for frequently reported compounds of plant essential oils. J Phys Chem Ref Data. (2011) 40:043101. doi: 10.1063/1.3653552
30. Demyttenaere JCR, Dagher C, Sandra P, Kallithraka S, Verhé R, De Kimpe N. Flavour analysis of Greek white wine by solid-phase microextraction-capillary gas chromatography-mass spectrometry. J Chromatogr A. (2003) 985:233–46. doi: 10.1016/S0021-9673(02)01467-X
31. Camarasu CC, Mezei-Szûts M, Varga GB. Residual solvents determination in pharmaceutical products by GC-HS and GC-MS-SPME. J Pharm Belg. (1998) 53:165. doi: 10.1016/S0731-7085(98)00276-3
32. Mauriello G, Marino R, D'Auria M, Cerone G, Rana GL. Determination of volatile organic compounds from truffles via SPME-GC-MS. J Chromatogr Sci. (2004) 42:299–305. doi: 10.1093/chromsci/42.6.299
33. Paraskevopoulou A, Chrysanthou A, Koutidou M. Characterisation of volatile compounds of lupin protein isolate-enriched wheat flour bread. Food Res Int. (2012) 48:568–77. doi: 10.1016/j.foodres.2012.05.028
34. Zakidou P, Paraskevopoulou A. Aqueous sesame seed extracts: study of their foaming potential for the preparation of cappuccino-type coffee beverages. LWT-Food Sci Technol. (2021) 135:110258. doi: 10.1016/j.lwt.2020.110258
35. Culleré L, Ferreira V, Venturini ME, Marco P, Blanco D. Evaluation of gamma and electron-beam irradiation on the aromatic profile of black truffle (Tuber melanosporum) and summer truffle (Tuber aestivum). Innov Food Sci Emerg Technol. (2012) 13:151–7. doi: 10.1016/j.ifset.2011.09.003
36. Vita F, Taiti C, Pompeiano A, Bazihizina N, Lucarotti V, Mancuso S, et al. Volatile organic compounds in truffle (Tuber magnatum Pico): comparison of samples from different regions of Italy and from different seasons. Sci Rep. (2015) 5:12629. doi: 10.1038/srep12629
37. D'Auria M, Racioppi R, Rana GL, Laurita A. Studies on volatile organic compounds of some truffles and false truffles. Nat Prod Res. (2014) 28:1709–17. doi: 10.1080/14786419.2014.940942
Keywords: truffles, SPME (solid-phase microextraction), GC-MS, Tuber Aestivum, Tuber Borchii, PLS-DA
Citation: Kalogiouri NP, Manousi N, Paraskevopoulou A, Mourtzinos I, Zachariadis GA and Rosenberg E (2022) Headspace Solid-Phase Microextraction Followed by Gas Chromatography-Mass Spectrometry as a Powerful Analytical Tool for the Discrimination of Truffle Species According to Their Volatiles. Front. Nutr. 9:856250. doi: 10.3389/fnut.2022.856250
Received: 17 January 2022; Accepted: 22 March 2022;
Published: 25 April 2022.
Edited by:
Jorge A. M. Pereira, Universidade da Madeira, PortugalReviewed by:
Eva Tejedor-Calvo, Aragon Agrifood Research and Technology Center (CITA), SpainMaurizio D'Auria, University of Basilicata, Italy
Copyright © 2022 Kalogiouri, Manousi, Paraskevopoulou, Mourtzinos, Zachariadis and Rosenberg. This is an open-access article distributed under the terms of the Creative Commons Attribution License (CC BY). The use, distribution or reproduction in other forums is permitted, provided the original author(s) and the copyright owner(s) are credited and that the original publication in this journal is cited, in accordance with accepted academic practice. No use, distribution or reproduction is permitted which does not comply with these terms.
*Correspondence: Erwin Rosenberg, ZWdvbi5yb3NlbmJlcmdAdHV3aWVuLmFjLmF0