 Mengyuan Gao1†
 Rui Shi
 Jun He
- 1State Key Laboratory of Component-Based Chinese Medicine, Tianjin University of Traditional Chinese Medicine, Tianjin, China
- 2Key Laboratory for Forest Resources Conservation and Utilization in the Southwest Mountains of China, Ministry of Education, Southwest Forestry University, Kunming, China
The root of Panax notoginseng, a highly valued medicine and functional food, is the main part used for medicinal purposes. However, the stems and leaves are also used in practice. To provide a chemical basis for various uses, a quantitative comparison of 18 saponins using a non-targeted metabolomics approach was established, so as to investigate the chemical profiles of the different parts of P. notoginseng. The established strategy revealed that roots and stems, with their similar chemical characteristics, consisted mainly of protopanaxatriol-type saponins, whereas protopanaxadiol-type saponins were principally present in the leaves. Multivariate analysis further suggested that the quality of the stems and leaves of P. notoginseng was significantly affected by its geographical origin. Furthermore, 52 constituents (26 non-volatile and 26 volatile) were identified as potential markers for discriminating between different parts of the plant. Taken together, the study provides comprehensive chemical evidence for the rational application and exploitation of different parts of P. notoginseng.
Introduction
The root of Panax notoginseng (Burk.) F.H. Chen, commonly known as Sanqi or Tianqi, is a highly valuable traditional Chinese medicine, which is cultivated mainly in Yunnan and Guangxi provinces (1). Pharmacological studies have demonstrated that P. notoginseng exerts protective effects on the cardiovascular and cerebrovascular systems and exhibits anticarcinogenic and hepatoprotective properties (2, 3). P. notoginseng is more widely used as a functional food, than in medicine, because of its capability to protect the liver, regulate blood lipids, fight fatigue, and reduce hypoxic conditions. It has been reported that 47 types of healthy food containing P. notoginseng as an essential ingredient were approved by the State Food and Drug Administration in China (4). Phytochemical investigations have reported that P. notoginseng contains various constituents including saponins, amino acids, flavonoids, and polysaccharides. Among them, saponins are considered the main active components (5, 6). Since the biological activities of saponins are related to their structures, the effect of ginsenoside Rg1 with a protopanaxatriol moiety is contrary to that of ginsenoside Rb1 with protopanaxadiol as an aglycon (7, 8). Indeed, the content and type of saponins investigated are distinctly diverse in different botanical parts of P. notoginseng (9).
Underground parts of P. notoginseng are mainly used (10), although previous studies have reported that protopanaxadiol-type saponins from the stem and leaf of P. notoginseng had been found to possess some beneficial pharmacological effects, including antioxidative, antihyperlipidemic, and hepatoprotective activities (11–14). P. notoginseng stems and leaves are commonly used to treat bone fractures, calm nerves, and increase appetite (15). Owing to the different utilization of individual parts of P. notoginseng, differences in chemical characteristics are of great significance for authentication and ensuring the efficacy of different parts of this herb. The saponins derived from underground parts have been investigated in majority of the previous studies, while reports on aerial parts are limited (16–19). The contents of eight saponins from roots, stems, and leaves were previously compared using high-performance liquid chromatography coupled with evaporative light scattering detection (HPLC-ELSD) (8). Indeed, multiple components of an herb indicate its comprehensive efficacy, and quality assessment based on a few markers has proven to be insufficient (20). Therefore, it is necessary to determine the multiple constituents of P. notoginseng to assess its quality systematically and comprehensively.
Intensive research has demonstrated that geographical origin can significantly affect the quality of these herbs, as climate and environment influence biosynthesis and the accumulation of secondary metabolites in organisms (21–23). P. notoginseng is primarily produced in the WenShan Autonomous Prefecture, Yunnan Province, China (24). With the increasing demand for P. notoginseng and the obstacles faced in its continuous cropping, the production of P. notoginseng in the WenShan Autonomous Prefecture is insufficient; thus, cropping areas are gradually extended. However, the correlation between the quality of P. notoginseng and its cropping origin is not clear; therefore, it is necessary to investigate the correlation for the reasonable harvesting of this herb.
In this study, an integrated method combining quantitative comparison and a non-targeted metabolomics approach was used to verify the chemical differences between samples from different botanical parts and geographical regions. Eighteen saponins were quantitatively compared using validated ultra-high-performance liquid chromatography coupled with triple quadrupole tandem mass spectrometry (UHPLC-MS/MS) method. Additionally, multiple pattern recognition models were used to evaluate the effect of botanical parts and geographical origin on saponin content. A non-targeted metabolomics approach was subsequently applied to discriminate between the different parts of the plant. Chemical markers, including both non-volatile and volatile constituents, were identified using ultra-high-performance liquid chromatography coupled with quadrupole tandem time-of-flight mass spectrometry (UHPLC-Q-TOF-MS/MS) and gas chromatography–mass spectrometry (GC-MS) assays. This study provides comprehensive chemical evidence for the rational use of different raw materials of P. notoginseng in practice, thereby facilitating an overall evaluation of the relevant products.
Materials and Methods
Sample Collection
Twenty-five batches of the whole plant of Panax notoginseng were harvested in person in Yunnan Province, China, rather than being purchased from the medicinal material market. Each batch of the whole plant was dried and divided into root, stem and leaf, separately. The voucher specimens were deposited in Tianjin University of Traditional Chinese Medicine, Tianjin, China. The sample information is showed in Supplementary Table S1.
Chemicals and Reagents
The standard compounds ginsenosides Rf, Rg1, Rg2, Re, Rd, Rb1, Rb2, Rb3, Rc, Fa, Rk1, Rg5, Rg3, and F2, as well as notoginsenoside Fe, Fd, R1, Fc (G-Rf, G-Rg1, G-Rg2, G-Re, G-Rd, G-Rb1, G-Rb2, G-Rb3, G-Rc, G-Fa, G-Rk1, G-Rg5, G-Rg3, G-F2, N-Fe, N-Fd, N-R1, and N-Fc), with purity > 98%, were purchased from Chengdu DeSiTe Biological Technology Co., Ltd (Chengdu, China). The structures of saponins are shown in Supplementary Figure S1. Methanol and acetonitrile of chromatographic grade were purchased from Fisher company (Thermo Fisher Scientific Co. Ltd. Shanghai, China). Formic acid was obtained from the ROE. The distilled water was purified using a Milli-Q system (Millipore, Bedford, MA, USA).
Preparation of Standard and Sample Solution
Stock solutions of G-Rf, G-Rg1, G-Rg2, G-Re, G-Rd, G-Rb1, G-Rb2, G-Rb3, G-Rc, G-Fa, G-Rk1, G-Rg5, G-Rg3, G-F2, N-Fe, N-Fd, N-R1, and N-Fc were dissolved in methanol and serially diluted to plot the standard curves.
All dried samples were grounded and the powder was passed through a sieve (hole diameter, 0.45 mm). Powdered samples (20 mg) were ultrasonically extracted in 20 mL of methanol for 40 min. After cooling, the resulting mixture was centrifuged, the supernatant was filtered through 0.22 μm nylon membranes, and the obtained solutions were stored at 4°C for LC-MS/MS analysis.
Powdered samples (1 g) were sonicated in 50 mL of N-hexane for 40 min and filtered through a 0.22 μm nylon membrane to obtain the sample solutions for GC-MS analysis. All the solutions were stored at 4°C prior to analysis.
UHPLC-MS/MS Analysis
An Agilent 1290 UHPLC system (Agilent Technologies Inc., Palo Alto, CA, USA) coupled to an Agilent 6470 triple quadrupole tandem mass spectrometer with electrospray ionization (ESI) source was used for the quantitative analysis. An ACQUITY UPLC BEH C18 column (2.1 ×100 mm, 1.7 μm; Waters, Milford, MA, USA) was used for chromatographic separation, and the column temperature was maintained at 25°C. The binary gradient elution system consisted of 0.1% formic acid (solvent A) and acetonitrile (solvent B). The solvent gradient was as follows: 0–1 min, 25–33% B; 1–5 min, 33–33% B; 5–7 min, 33–41% B; 7–9 min, 41–41% B; 9–10 min, 41–59% B; 10–15 min, 59–59% B. The flow rate was 0.3 mL/min and the injection volume was 5 μL.
The mass spectrometer was operated in negative mode. The optimized mass conditions were as follows: gas temperature, 300°C; gas flow rate, 7 L/min; nebulizer, 35 psi; sheath gas temperature, 250°C; sheath gas flow, 12 L/min; capillary voltage, 4,000 V. Multiple reaction monitoring (MRM) mode was applied for the quantitative analysis of different compounds. An MRM diagram is shown in Supplementary Figure S2. The optimal mass spectral parameters and ion patterns are presented in Supplementary Table S2.
UHPLC-Q-TOF-MS/MS Analysis
The non-targeted metabolomics study was performed using an Agilent 1290 Infinity UHPLC system equipped with an Agilent 6520 Q-TOF instrument. A Waters UPLC®BEH C18 column (2.1 ×100 mm, 1.7 μm, Waters, Milford, MA, USA) was used for chromatographic separation at a temperature of 40°C. The mobile phase consisted of 0.1% formic acid in water (A) and acetonitrile (B) at a flow rate of 0.3 mL/min. The solvent gradient was set as follows: 0–5 min, 5–15% B; 5–11 min, 15–30% B; 11–25 min, 30–38% B; 25–30 min, 38–90% B; 30–38 min, 90–90% B. The injection volume for each sample was 5 μL.
The mass spectrometer was operated in both positive and negative modes with a scanning range of m/z 50–1,500 and a scanning rate of 1 spectra/s. High resolution (4 GHz, High Res Mode) was used. The optimized instrumental parameters were as follows: capillary temperature, 350°C; drying gas (N2) flow rate, 11 L/min; nebulizer pressure, 40 psi; collision energy, 45 V; fragmentor voltage, 135 V.
GC-MS Analysis
The volatile components were analyzed using a Shimadzu QP 2010 GC-MS system equipped with an AOC-20i Autosampler. Chromatographic separation was performed on a DB-5 MS column (0.25 μm ×0.25 mm ×30 m). The temperature program was set as follows: 40°C for 0 min, 40–190°C in increments of 7°C/min, 190–230°C in increments of 2°C/min, and 230°C for 1 min.
Mass spectrometry was performed in electron impact (EI) mode and full scan mode at m/z 50–1,000. The temperatures of ion source and interface were 230 and 250°C, respectively. The detector voltage was 1.3 kV.
Method Validation
A calibration curve for each saponin was constructed using a linear regression model, and linearity was verified using correlation coefficients (r2). The lower limits of detection (LLODs) and lower limits of quantification (LLOQs) were estimated as the minimum concentration giving signal-to-noise ratios (S/N) of 3 and 10, respectively. Instrument precision was determined by intra- and interday variations. Relative standard deviation (RSD) was calculated as a measure of precision. Repeatability was evaluated by performing six replicate analyses on the same sample. In the stability test, the sample solutions were stored at room temperature and then analyzed by replicate injections at 0, 2, 4, 8, 12, and 24 h. Recovery was carried out by spiking a sample with the mixed standards, and the recovery rate was calculated using the following formula: recovery rate (%) = (observed amount – original amount)/spiked amount ×100%.
The UHPLC-Q-TOF-MS/MS and GC-MS method were validated in terms of precision, repeatability, and stability. Sample batch 10 from WenShan Autonomous Prefecture was randomly selected as quality control sample for the methodological investigation. The precision was evaluated by observing the intraday variations of sample for six consecutive times. The repeatability was accessed by preparing six replicate samples. The stability was obtained by detecting one sample at 0, 6, 12, 18, and 24 h. Fifteen chromatographic peaks were randomly selected to calculate the RSDs of peak area and retention time (RT) in order to investigate precision, repeatability, and stability.
Multivariate Analysis
The UHPLC-Q-TOF-MS/MS and GC-MS data of different botanical parts of P. notoginseng from different geographical regions were exported in MZ format using the Agilent Masshunter analysis software and GC-MS Postrun Analysis software, respectively. The peak finding, alignment, and filtering of the raw data were preprocessed using R software to obtain the retention time (Rt), mass-to-charge ratio (m/z), and peak strength of each compound. Finally, the obtained data was imported into Simca-P 14.1 (Umetrics, Umea, Sweden) for multivariate statistical analysis, including hierarchical cluster analysis (HCA), principal component analysis (PCA) and orthogonal partial least squares discriminant analysis (OPLS-DA). Potential chemical markers to differentiate the parts of P. notoginseng were screened according to the variable importance in the projection (VIP) value. R2 (cum) and Q2 (cum) values were used to validate the model. R2 implied the explanation capability toward original data and Q2 indicated the prediction ability of the model.
Results and Discussions
Method Validation
The correlation coefficient values (r2 > 0.9991) indicated good correlation between the concentrations of the investigated compounds and their peak areas within the respective test ranges. The calibration results are summarized in Supplementary Table S3. Precision was determined by the relative standard deviations (RSDs <3.1%) for the 18 investigated components, indicating the acceptable precision of the developed method. In repeatability testing, the RSDs were in the range of 0.8–4.7%, demonstrating that the developed method had satisfactory repeatability. As for stability, the RSDs of the peak areas of the 18 saponins were lower than 5.2%, indicating that it was feasible to analyze samples within 24 h. The accuracy was validated by the recovery rate, and the results showed that the mean recovery rates of the 18 saponins were in the range of 86.1–108.4%, with RSDs <5.9%.
The RSDs of retention time and peak area of precision, repeatability, and stability were <0.3% and 8.7% using UHPLC-Q-TOF-MS/MS and GC-MS analysis, which validated that the established method was precise for differential component analysis of different parts of P. notoginseng.
Comparative Analysis of P. notoginseng From Different Geographical Regions
Geographical regions are usually deemed to affect biosynthesis and accumulation of secondary metabolites in organisms, thereby contributing to various qualities of traditional Chinese medicine (25, 26). P. notoginseng is produced mainly in Yunnan Province, China, accounting for more than 90% of the worldwide production. In this study, roots, stems, and leaves of P. notoginseng were collected from PuEr city, WenShan Autonomous Prefecture, and KunMing city of Yunnan province to analyze the influence of geographical regions on the quality of P. notoginseng. The contents of the 18 saponins are presented in Supplementary Table S4, which varied greatly among different batches of samples. As shown in Figure 1, the higher content of G-Rg1 and G-Rb1 in the stems of batch 7 led to a significantly higher subtotal saponin content. Specifically, the contents of N-Fd, G-Rb3, and G-Rc in the leaves were significantly different among batches 1–9 (PuEr city) when compared to the others. Individually, with the exception of G-Fa, G-Rb1, G-Rb2, G-Rb3, and G-Rc, which are present in the stems from PuEr city, they were significantly higher than those from WenShan Autonomous Prefecture and KunMing city, whereas G-Rf, G-Rg2, G-F2, N-Fd, N-Fe, and G-Rg3 in leaves from WenShan Autonomous Prefecture and KunMing city were less abundant than those from PuEr city (Figures 2, 3).
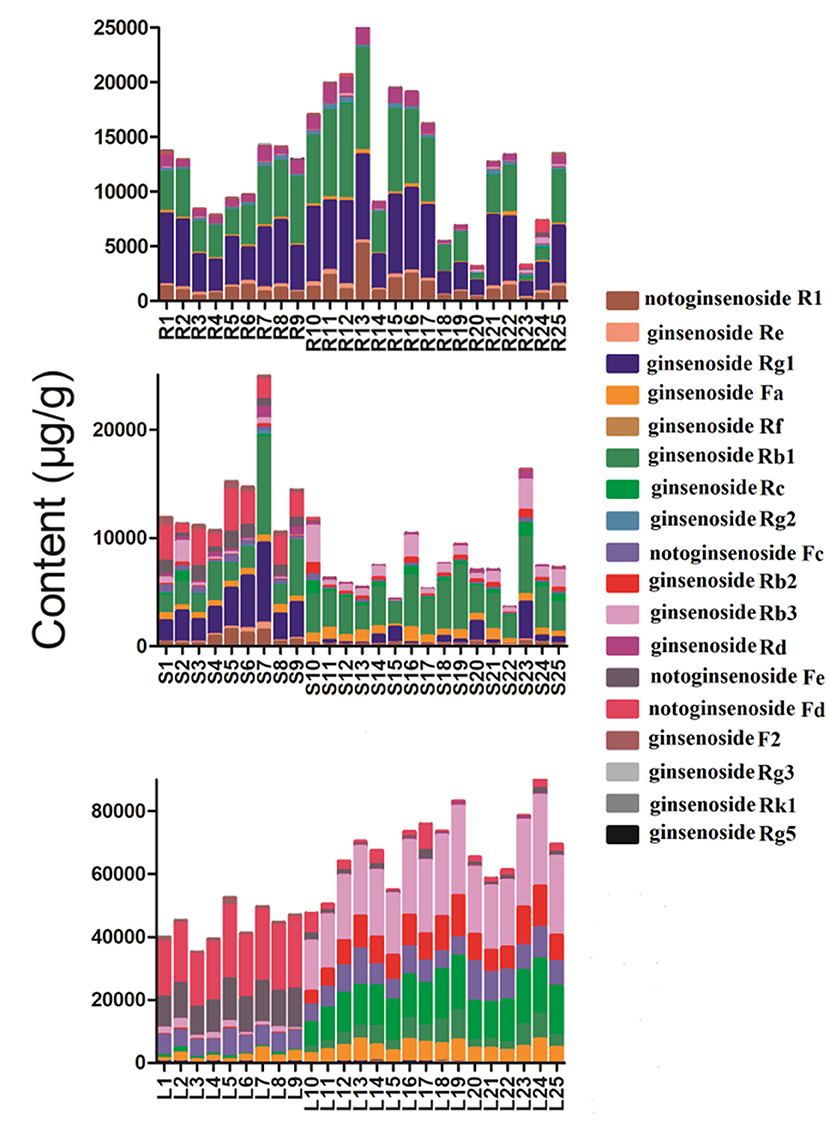
Figure 1. The total contents of 18 saponins in different parts of P. notoginseng from different batches (R, Root; S, Stem; L, Leaf).
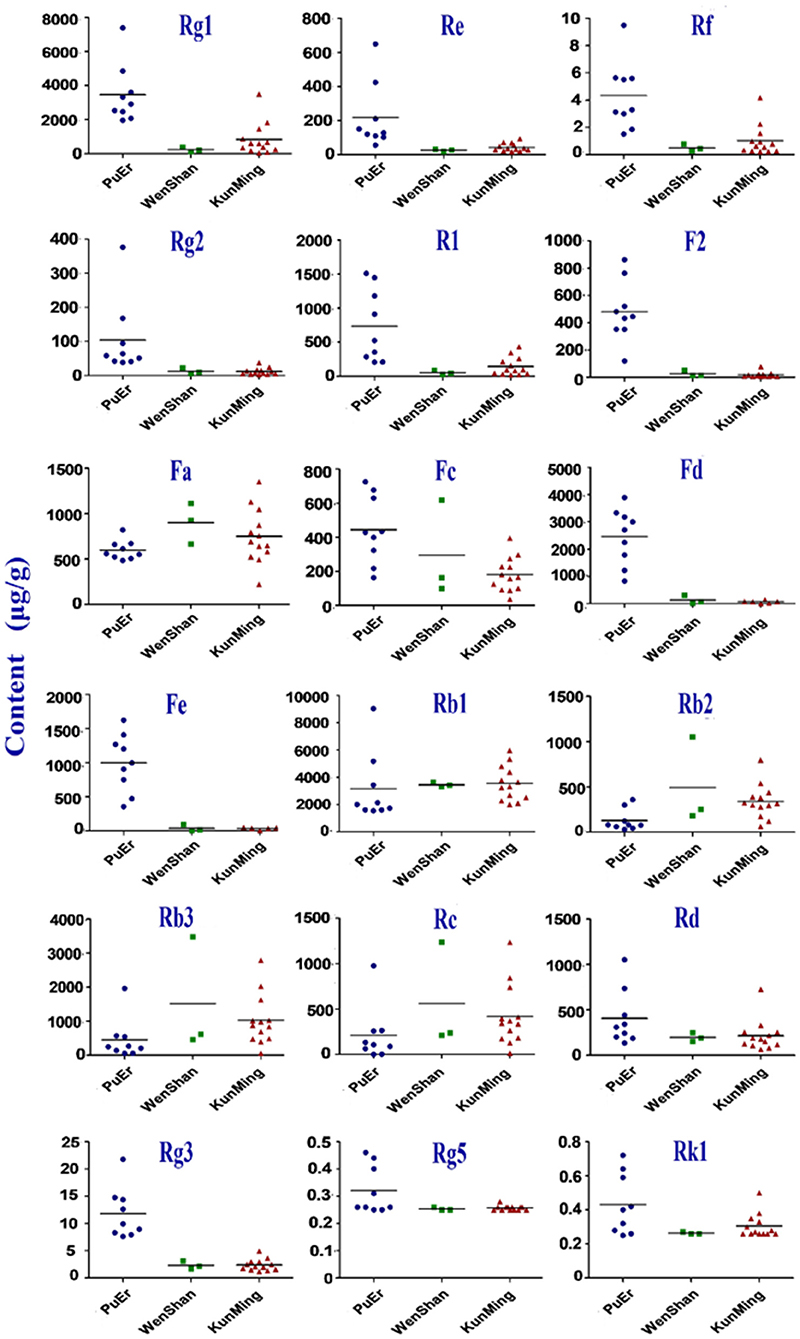
Figure 2. Contents of 18 saponins in stem of P. notoginseng from different origins.
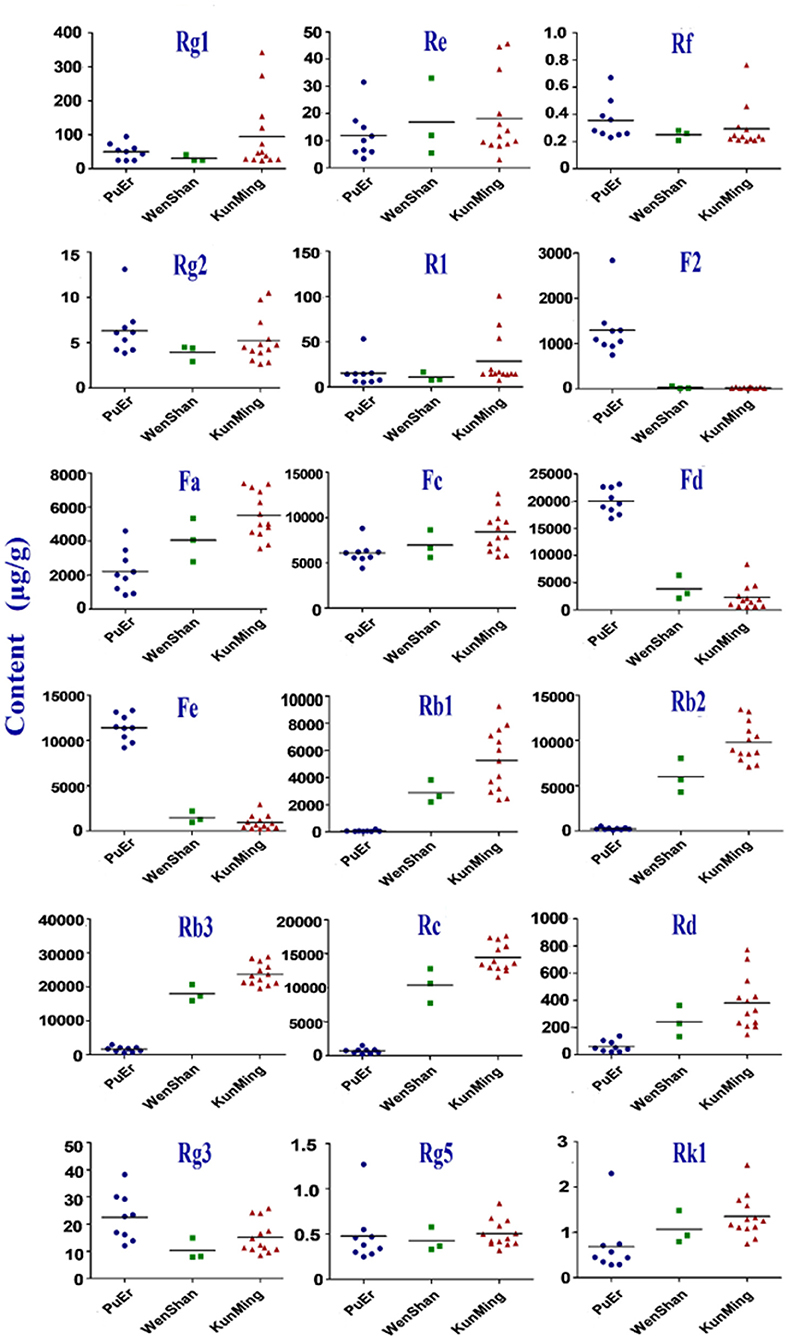
Figure 3. Contents of 18 saponins in leaf of P. notoginseng from different origins.
PCA is an unsupervised pattern recognition method that is often used to sort unclassified samples into groups, and it reduces the dimensionality of the original dataset by explaining the correlation among a large number of variables in terms of a smaller number of underlying factors without losing much information (27, 28). The OPLS-DA model can filter out random noise and eliminate the effects of irrelevant metabolite variability to improve the effectiveness and analytical capability of the model. PCA and OPLS-DA plots were generated to analyze the effect of geographical regions on the content of saponins from different parts of P. notoginseng (Supplementary Figure S3). The results based on the analyses from the roots showed that the data from these three cities superimposed on each other [Supplementary Figure S3 (1)], indicating that there were some differences in the chemical profiles of the roots derived from these three cities, but they were not completely differentiated according to their origin. In addition, the stem and leaf results presented the same classification pattern. Samples from PuEr city were in the first category, while other samples from WenShan Autonomous Prefecture and KunMing city belonged to the second category. The two categories shown in the PCA and OPLS-DA score plots were separated from each other. Geographically, WenShan Autonomous Prefecture and KunMing city are located in the middle eastern part of Yunnan Province, while PuEr city is located in the west, demonstrating that geographical location has a significant impact on the quality of the stems and leaves of P. notoginseng. Furthermore, consistent with the quantitative results shown in Figure 1, data from the analyses on stems from PuEr City were clustered in a relatively wider region [Supplementary Figure S3 (2)], indicating that the stem qualities were not stable. All results of the multivariate statistical analysis were consistent with those of the quantitative analysis.
Comparative Analysis of Different Parts of P. notoginseng
Previous studies had elucidated that the type and content of saponins varied extremely in different parts of P. notoginseng (29–31). To investigate the variation of the chemical profiles among different botanical parts of P. notoginseng, we collected the roots, stems and leaves for the comparative study.
The validated method was used to determine 18 saponins in the roots, stems, and leaves of P. notoginseng. The contents of 18 saponins are listed in Supplementary Table S4. The results revealed that there were significant variations among individual parts of P. notoginseng in terms of both the average content and relative composition of the total amount of saponins. The contents of N-Rg1 and N-Rb1 in the roots appeared to be higher than those in the stems and leaves. G-Rb1 was present in the highest quantity in the stem, while the content of G-Rg1 varied greatly among different batches. Additionally, the amount of G-Rb3, G-Rc, and N-Fd in the leaves were much higher than those in the roots and stems. As illustrated in Figure 1, the total content of the 18 saponins was significantly different in the different botanical parts of P. notoginseng. The total amount of saponins in the leaves was almost 4–8 fold higher than the roots and stems. Individually, the higher content of G-Rb3 and G-Rc in the leaves led to a significantly higher content of subtotal saponins. Moreover, the relative content of the investigated saponins was used to determine the type of saponins in the different parts of the plant. As shown in Figure 4, ginsenosides Rc and Rg2 were the most abundant ones in leaves and roots, respectively, with the greatest variation among individual parts in the relative composition of the total amount of saponins. The content of protopanaxadiol (PPD)-type saponins (G-Rb1, G-Rb2, G-Rb3, G-Rg3, G-Rc, G-Rd, G-F2, N-Fc, G-Fa, N-Fe, and N-Fd) in leaves was higher than the root and stem, whereas the protopanaxatriol (PPT)-type saponins (G-Rg1, G-Re, G-Rf, G-Rg2, and N-R1) showed the opposite trend.
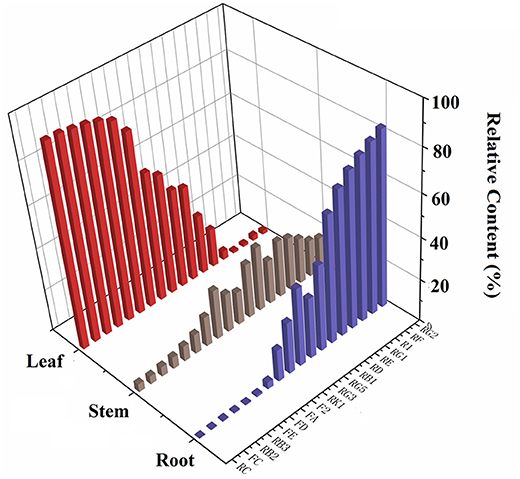
Figure 4. The relative content of 18 saponins in different parts of P. notoginseng (Relative content = individual part content/sum contents of all parts).
The PCA plot was first adopted for exploratory analysis of differences among the roots, stems, and leaves of P. notoginseng. The first component of the sample demonstrated 53.8% of the systematic variation. As displayed in Supplementary Figure S4A, the leaf samples tended to cluster to the left, whereas the roots and stems were scattered on the right. In OPLS-DA scores plot (Supplementary Figure S4B), the root was separated from the stem, but was still very close to it. The results indicated an overall similar chemical profile of roots and stems, although they were extremely different from the leaves, which was consistent with the results obtained from quantitative analysis.
Identification of Chemical Markers
Untargeted metabolomics has been widely used to compare the overall metabolic composition between samples, owing to its ability to profile diverse classes of metabolites (32). It's a systematic method that can process and evaluate varieties of metabolite data, and has great value in plant phenotyping analysis (33). Nowadays, it has been extended to various research fields, such as biomarkers discovery and the quality assessment of CHMs (34). Chromatography and spectrometry are the most commonly used metabolite analysis methods because of their high separation capacity and sensitivity (35). The UHPLC-Q-TOF-MS/MS method has been widely utilized for profiling metabolites because of its high-resolution mass, precision, and sensitivity. In the present study, based on the chemical analysis of the roots, stems, and leaves using the UHPLC-Q-TOF-MS/MS method (Tables 1, 2), indicated that the type of components varied in the different botanical parts, with some saponins present in specific parts. The collected data was further exported into Simca-P 14.1 for hierarchical cluster analysis (HCA), the results showed that the roots, stems, and leaves of P. notoginseng were divided into three clusters (Supplementary Figure S5). In order to further screen the chemical markers between roots, stems and leaves, OPLS-DA model was built using the data matrix of three medicinal parts of P. notoginseng. The R2Y (cum) = 0.984 and Q2 (cum) = 0.972 indicated a good explanation and prediction ability of this model. As shown in Supplementary Figure S6, it could lead to better grouping results for separation of the roots, stems, and leaves. The data showed that the roots and stems were very close in space, consistent with the results obtained from the multivariate analysis of quantification. Furthermore, the results verified the high similarity between the chemical characteristics of the roots and stems. To further investigate the importance of each variable in distinguishing different parts of P. notoginseng, compounds with VIP values >1 are summarized in Supplementary Table S5 (36). Twenty-six chemical markers, including amino acids and saponins, were identified to differentiate the roots, stems, and leaves of the plant based on the accurate mass, retention time, and targeted MS/MS data. Besides, the ROC curve was generated to summarize the classification ability of this model. As shown in Supplementary Figure S7, the ROC curve passed through the upper left corner and AUC (area under the ROC curve) was 1, indicating that the 26 markers had a perfect discrimination ability which is more helpful to determine the molecular weight and formula of compounds. An example of the potential markers identified using MS/MS data is shown in Supplementary Figure S8, which exhibits a fragmentation pattern corresponding to the loss of the glycosidic units.
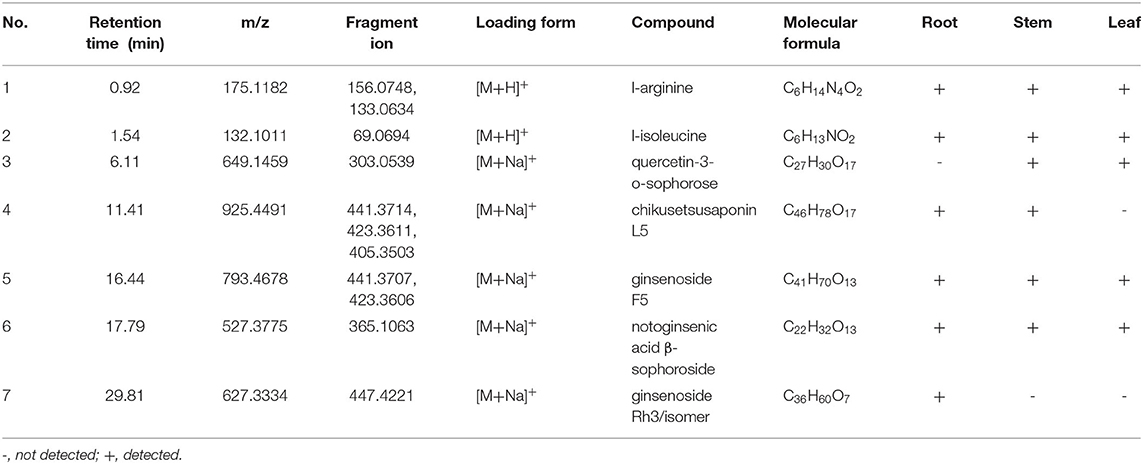
Table 1. Possible non-volatile chemicals in root, stem and leaf of P. notoginseng under the mode of positive ions.
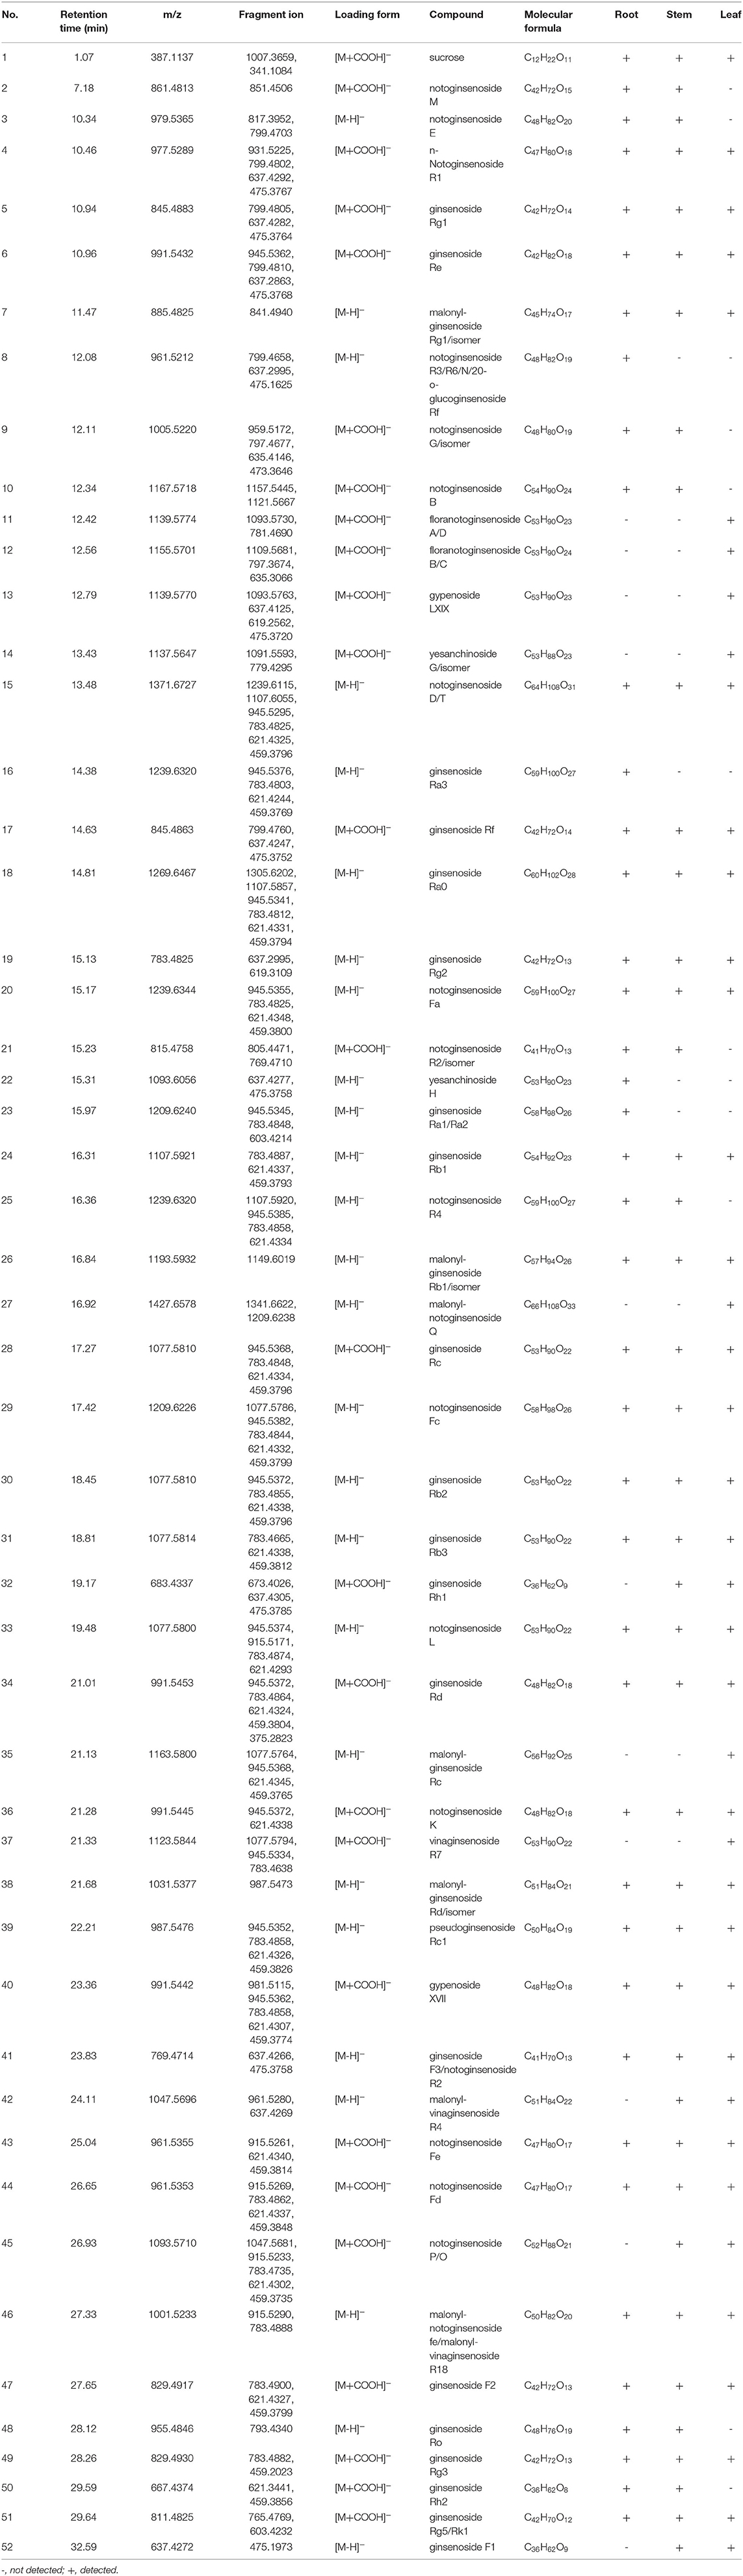
Table 2. Possible non-volatile chemicals in root, stem and leaf of P. notoginseng under the mode of negative ions.
Volatile constituents in plant materials are considered to possess insecticidal, biological signaling, and antifungal properties, which are of significant interest to the food and pharmaceutical industries (37). In the present study, GC-MS was performed to analyze the volatile constituents of different parts of P. notoginseng, and an untargeted metabolomics approach was subsequently applied to investigate the volatile markers responsible for the differentiation of roots, stems, and leaves of the plant. The possible volatile constituents were identified by comparing the mass spectral fragmentation patterns with those stored in the NIST 08 and NIST 08s spectral libraries, and the relative amounts of the identified compounds were obtained based on the percentage of the relative peak area. As summarized in Table 3, 57 volatile constituents were identified, and the compositions presented considerable chemical polymorphism among different parts of P. notoginseng. There were 15 compounds shared among the volatiles in the roots, stems, and leaves, including alkenes, alkanes, carboxylic acids, esters, and alcohols. Falcarinol, the dominant active compound among the identified constituents, has been reported to exhibit anticancer, sedative, and hypotensive effects (37). The falcarinol content was maximum in the stems of P. notoginseng, suggesting that this individual part can be utilized in a better way. The identified volatiles mainly consisted of hydrocarbons, phenolic alcohols, aldehyde ketones, carboxylic acids, and esters; their relative contents are shown in Figure 5. Phenolic alcohols were the most abundant volatile constituents in the three parts of P. notoginseng. The content of aldehyde ketones, hydrocarbons, and carboxylic acids varied greatly among the different botanical parts, while no significant difference was observed in the ester content. Multivariate statistical analysis was applied to further investigate the differences in the volatile constituents of the different parts of P. notoginseng. The profile of volatiles in the roots, stems, and leaves was visualized using an OPLS-DA model. Clear differentiation of roots, stems, and leaves is observed in Supplementary Figure S9, indicating that there were significant differences in the volatile constituents of the different parts of P. notoginseng. The importance of each variable for distinguishing different parts of the plant was subsequently inspected to screen out volatile chemical markers with VIP > 1 (Supplementary Table S6), all of which played a significant role in the differentiation of the roots, stems, and leaves of P. notoginseng.
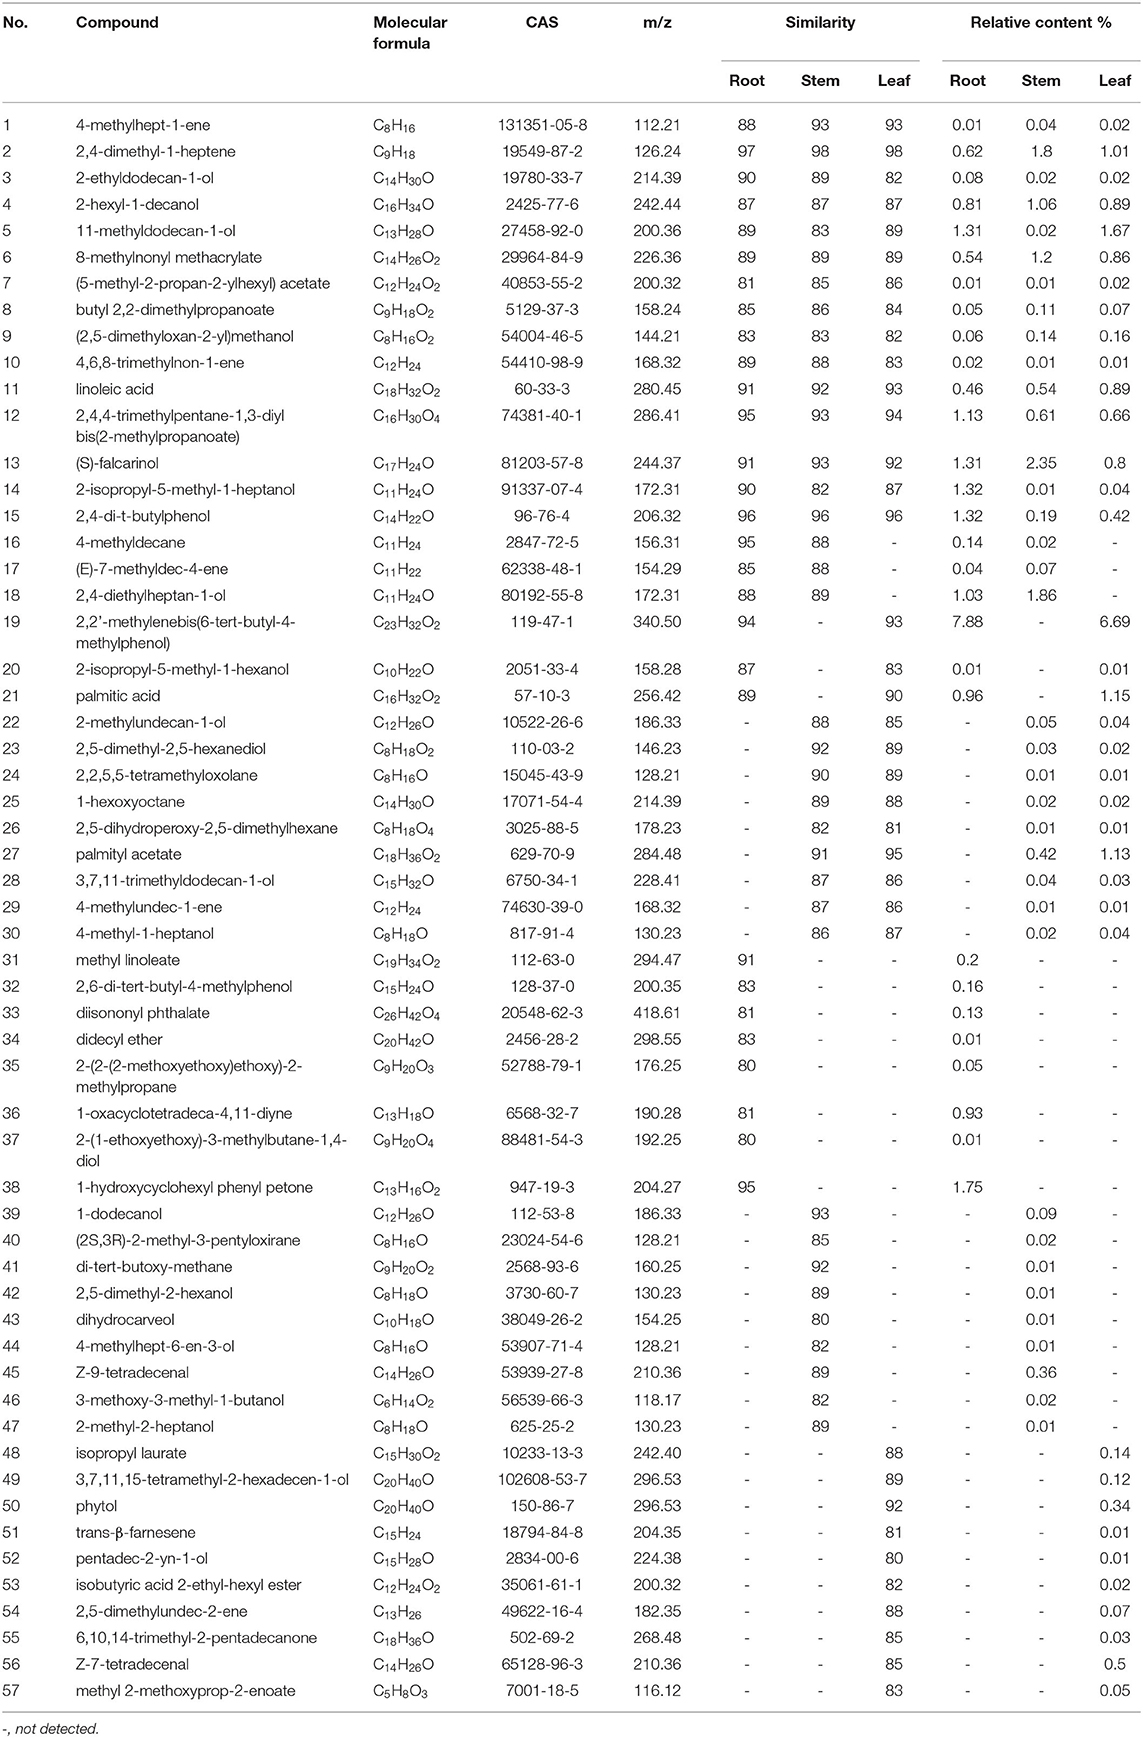
Table 3. Volatile constituents in root, stem and leaf of P. notoginseng.
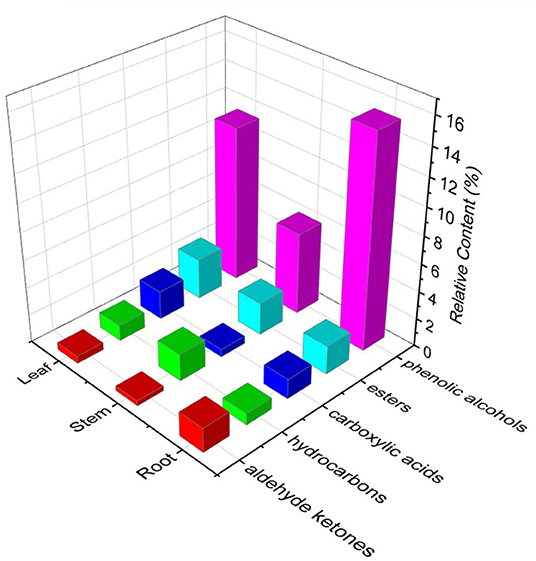
Figure 5. Relative content of the volatiles in root, stem and leaf of P. notoginseng.
Conclusion
Quantitative comparison combined with a non-targeted metabolomics approach was performed to evaluate the chemical differences and similarities between different botanical parts of P. notoginseng from different geographical regions. The results demonstrated high similarity in chemical characteristics of the roots and stems with higher content of PPT-type saponins, while they were significantly different from those of the leaves. Geographical location had little effect on the quality of roots but had significant effect on stems and leaves. Specifically, the quality of stems from PuEr City was unstable. In addition, based on a non-targeted metabolomics approach using UHPLC-Q-TOF-MS/MS and GC-MS methods, 52 compounds (including 26 non-volatile and 26 volatile constituents) with VIP > 1 were identified as potential chemical markers to differentiate the different botanical parts of the plant. Taken together, this study elucidates the metabolic analyses of the different botanical parts of P. notoginseng obtained from multiple geographical regions, thereby providing a chemical evidence for the rational application of individual parts of this plant.
Data Availability Statement
The original contributions presented in the study are included in the article/Supplementary Material, further inquiries can be directed to the corresponding author.
Author Contributions
RS and JH designed the experiment. YC and HO analyzed the experimental data. MG and XC performed the experiment. SW and XH wrote the manuscript. All authors contributed to the article and approved the submitted version.
Funding
This study was supported by National Natural Science Foundation of China (81673824); National Key R&D Program of China (2021YFD1000202); Yunnan provincial key programs (202102AE090042, 2019ZG00901, 202002AA10007).
Conflict of Interest
The authors declare that the research was conducted in the absence of any commercial or financial relationships that could be construed as a potential conflict of interest.
Publisher's Note
All claims expressed in this article are solely those of the authors and do not necessarily represent those of their affiliated organizations, or those of the publisher, the editors and the reviewers. Any product that may be evaluated in this article, or claim that may be made by its manufacturer, is not guaranteed or endorsed by the publisher.
Supplementary Material
The Supplementary Material for this article can be found online at: https://www.frontiersin.org/articles/10.3389/fnut.2022.841541/full#supplementary-material
References
1. Wang T, Guo RX, Zhou GH, Zhou XD, Kou ZZ, Sui F, et al. Traditional uses. botany, phytochemistry, pharmacology and toxicology of Panax notoginseng (Burk) FH Chen: a review. J Ethnopharmacol. (2016) 188:234–58. doi: 10.1016/j.jep.2016.05.005
2. Kim SK, Park JH. Trends in Ginseng research in 2010. J Ginseng Res. (2011) 35:389–98. doi: 10.5142/jgr.2011.35.4.389
3. Zhao HP, Han ZP, Li GW, Zhang SJ, Luo YM. Therapeutic potential and cellular mechanisms of Panax Notoginseng on prevention of aging and cell senescence-associated diseases. Aging Dis. (2017) 8:721–39. doi: 10.14336/AD.2017.0724
4. Wang JR, Yau LF, Gao WN, Liu Y, Yick PW, Liu L, et al. Quantitative comparison and metabolite profiling of saponins in different parts of the root of Panax notoginseng. J Agric Food Chem. (2014) 62:9024–34. doi: 10.1021/jf502214x
5. Du QZ, Jerz G, Waibel R, Winterhalter P. Isolation of dammarane saponins from Panax notoginseng by high-speed counter-current chromatography. J Chromatogr A. (2003) 1008:173–80. doi: 10.1016/S0021-9673(03)00988-9
6. Wang CZ, McEntee E, Wicks S, Wu JA, Yuan CS. Phytochemical and analytical studies of Panax notoginseng (Burk.) F.H. Chen. J Nat Med. (2006) 60:97–106. doi: 10.1007/s11418-005-0027-x
7. Sengupta S, Toh SA, Sellers LA, Skepper JN, Koolwijk P, Leung HW, et al. Modulating angiogenesis: the Yin and the Yang in Ginseng. Circulation. (2004) 110:1219–25. doi: 10.1161/01.CIR.0000140676.88412.CF
8. Sun HX, Yang ZG, Ye YP. Structure and biological activity of protopanaxatriol-type saponins from the roots of Panax notoginseng. Int Immunopharmacol. (2006) 6:14–25. doi: 10.1016/j.intimp.2005.07.003
9. Wan JB, Yang FQ, Li SP, Wang YT, Cui XM. Chemical characteristics for different parts of Panax notoginseng using pressurized liquid extraction and HPLC-ELSD. J Pharm Biomed Anal. (2006) 41:1596–601. doi: 10.1016/j.jpba.2006.01.058
10. State Pharmacopoeia Commission. (2020). Pharmacopoeia of People's Republic of China, Vol. I. Beijing: Chemical Medical Science Press. 12–13.
11. Liu C, Hu MY, Zhang MA, Li F, Li J, Zhang J, et al. Association of GLP-1 secretion with anti-hyperlipidemic effect of ginsenosides in high-fat diet fed rats. Metabolism. (2014) 63:1342–51. doi: 10.1016/j.metabol.2014.06.015
12. Liu F, Wang M, Wang Y, Cao YW, Sun ZL, Chen MC, et al. Metabonomics study on the hepatoprotective effect of Panax notoginseng leaf saponins using UPLC/Q-TOF-MS analysis. Am J Chin Med. (2019) 47:559–75. doi: 10.1142/S0192415X19500290
13. Qi B, Zhang L, Zhang ZQ, Ouyang JQ, Huang H. Effects of ginsenosides-Rb1 on exercise-induced oxidative stress in forced swimming mice. Pharmacogn Mag. (2014) 10:458–63. doi: 10.4103/0973-1296.141818
14. Wang M, Zhang XJ, Liu F, Hu YJ, He CW, Li P, et al. Saponins isolated from the leaves of Panax notoginseng protect against alcoholic liver injury via inhibiting ethanol-induced oxidative stress and gut-derived endotoxin-mediated inflammation. J Funct Foods. (2015) 19:214–24. doi: 10.1016/j.jff.2015.09.029
15. Yang CK, Xiong J, Shen Y. Two new dammarane-type triterpenoids from the stems and leaves of Panax notoginseng. J Asian Nat Prod Res. (2021) 23:341–7. doi: 10.1080/10286020.2020.1731801
16. Jia XH, Wang CQ, Liu JH, Li XW, Wang X, Shang MY, et al. Comparative studies of saponins in 1-3-year-old main roots, fibrous roots, and rhizomes of Panax notoginseng, and identification of different parts and growth-year samples. J Nat Med 67. (2013) 339–49. doi: 10.1007/s11418-012-0691-6
17. Liu HL, Xia L, Cao J, Li P, Qi LW. Simultaneous determination of twelve saponins in radix et rhizoma notoginseng by rapid resolution LC-ESI-TOF-MS. Chromatographia. (2008) 68:1033. doi: 10.1365/s10337-008-0796-y
18. Lai CJS, Tan T, Zeng SL, Dong X, Liu EH, Li P. Relative quantification of multi-components in Panax notoginseng (Sanqi) by high-performance liquid chromatography with mass spectrometry using mobile phase compensation. J Pharm Biomed Anal. (2015) 102:150–6. doi: 10.1016/j.jpba.2014.09.004
19. Yang ZZ, Zhu JQ, Zhang H, Fan XH. Investigating chemical features of Panax notoginseng based on integrating HPLC fingerprinting and determination of multiconstituents by single reference standard. J Ginseng Res. (2018) 42:334–42. doi: 10.1016/j.jgr.2017.04.005
20. Gao MY, Jia XH, Huang XH, Wang W, Yao GZ, Chang YX, et al. Correlation between quality and geographical origins of Cortex Periplocae, based on the qualitative and quantitative determination of chemical markers combined with chemical pattern recognition. Molecules. (2019) 24:3621. doi: 10.3390/molecules24193621
21. Ianni F, Lisanti A, Marinozzi M, Camaioni E, Pucciarini L, Massoli A, et al. Hydrophobic amino acid content in onions as potential fingerprints of geographical origin: the case of Rossa da Inverno sel. Rojo Duro. Molecules. (2018) 23:1259. doi: 10.3390/molecules23061259
22. Koch W, Kukula-Koch W, Komsta Ł. Black tea samples origin discrimination using analytical investigations of secondary metabolites, antiradical scavenging activity and chemometric approach. Molecules. (2018) 23:513. doi: 10.3390/molecules23030513
23. Zhu LX, Xu J, Wang RJ, Li HX, Tan YZ, Chen HB, et al. Correlation between quality and geographical origins of Poria cocos revealed by qualitative fingerprint profiling and quantitative determination of triterpenoid acids. Molecules. (2018) 23:2200. doi: 10.3390/molecules23092200
24. Wang QY, Dong X, Yang J, Hu YH, Peng LQ, Zheng H, et al. Vesicle based ultrasonic-assisted extraction of saponins in Panax notoginseng. Food Chem. (2020) 303:125394. doi: 10.1016/j.foodchem.2019.125394
25. Bondia-Pons I, Savolainen O, Törrönen R, Martinez JA, Poutanen K, Hanhineva K. Metabolic profiling of Goji berry extracts for discrimination of geographical origin by non-targeted liquid chromatography coupled to quadrupole time-of-flight mass spectrometry. Food Res Int. (2014) 63:132–8. doi: 10.1016/j.foodres.2014.01.067
26. Li H, He JX, Li FJ, Zhang ZJ, Li RR, Su JC, et al. Application of NIR and MIR spectroscopy for rapid determination of antioxidant activity of Radix Scutellariae from different geographical regions. Phytochem Anal. (2016) 27:73–80. doi: 10.1002/pca.2602
27. Edward JJA. User's Guide to Principal Components. New York, NY: John Wiley and Sons, Inc. (1991).
28. Kong WJ, Zhao YL, Xiao XH, Jin C, Li ZL. Quantitative and chemical fingerprint analysis for quality control of Rhizoma Coptidischinensis based on UPLC-PAD combined with chemometrics methods. Phytomedicine. (2009) 16:950–9. doi: 10.1016/j.phymed.2009.03.016
29. Cui HM, Zhang QY, Peng L, Lu WL, Wang J. HPLC fingerprint of different parts and extract of total saponins of Panax notoginseng. Zhong Yao Cai. (2011) 34:362–7.
30. Kim DH. Chemical diversity of Panax ginseng, Panax quinquifolium, and Panax notoginseng. J Ginseng Res. (2012) 36:1–15. doi: 10.5142/jgr.2012.36.1.1
31. Sha MC, Zhou YF, Zhang HZ, Li Y, Qin Q. Study on differences of chemical components in different parts of Panax notoginseng. Xian dai zhong yao. (2018) 20:832–6. doi: 10.13313/j.issn.1673-4890.20180421007
32. Clarke JD, Alexander DC, Ward DP, Ryals JA, Mitchell MW, Wulff JE, et al. Assessment of genetically modified soybean in relation to natural variation in the soybean seed metabolome. Sci Rep. (2013) 3:3082. doi: 10.1038/srep03082
33. Yang H, Shi H, Zhang Q, Liu Y, Wan C, Zhang L. Simultaneous determination of five components in Aster tataricus by ultra-performance liquid chromatography-tandem mass spectrometry. J Chromatogr Sci. (2016) 54:500–6. doi: 10.1093/chromsci/bmv171
34. Aszyk J, Bylinski H, Namiesnik J, Kot-Wasik A. Main strategies, analytical trends and challenges in LC-MS and ambient mass spectrometry based metabolomics. Trends Anal Chem. (2018) 108:278–95. doi: 10.1016/j.trac.2018.09.010
35. Zhou B, Xiao JF, Tuli L, Ressom HW. LC-MS based metabolomics. Mol Biosyst. (2012) 8:470–81. doi: 10.1039/C1MB05350G
36. Zhou XD, Tang LY, Wu HW, Zhou GH, Wang T, Kou ZZ, et al. Chemometric analyses for the characterization of raw and processed seeds of Descurainia sophia (L.) based on HPLC fingerprints. J Pharm Biomed Anal. (2015) 111:1–6. doi: 10.1016/j.jpba.2015.03.010
Keywords: Panax notoginseng, chemical profile, multivariate analysis, LC-MS/MS, GC-MS
Citation: Gao M, Cao X, Wei S, Huang X, Ouyang H, Chang Y, Shi R and He J (2022) Quantitative Comparison and Chemical Profile of Different Botanical Parts of Panax notoginseng From Different Regions. Front. Nutr. 9:841541. doi: 10.3389/fnut.2022.841541
Received: 22 December 2021; Accepted: 25 March 2022;
Published: 27 April 2022.
Edited by:
Luigi Lucini, Catholic University of the Sacred Heart, ItalyReviewed by:
Shujuan Zhao, Shanghai University of Traditional Chinese Medicine, ChinaGabriele Rocchetti, Catholic University of the Sacred Heart, Italy
Marcin Szymanski, Adam Mickiewicz University, Poland
Copyright © 2022 Gao, Cao, Wei, Huang, Ouyang, Chang, Shi and He. This is an open-access article distributed under the terms of the Creative Commons Attribution License (CC BY). The use, distribution or reproduction in other forums is permitted, provided the original author(s) and the copyright owner(s) are credited and that the original publication in this journal is cited, in accordance with accepted academic practice. No use, distribution or reproduction is permitted which does not comply with these terms.
*Correspondence: Rui Shi, c2hpcnVpJiN4MDAwNDA7c3dmdS5lZHUuY24=; Jun He, aGVqdW42NzMmI3gwMDA0MDt0anV0Y20uZWR1LmNvbQ==
†These authors have contributed equally to this work