- 1Experimental Anatomy Research Department, Vrije Universiteit Brussel, Brussels, Belgium
- 2Frailty in Aging Research Department, Vrije Universiteit Brussel, Brussels, Belgium
- 3Pennington Biomedical Research Center, Baton Rouge, LA, United States
Background: Recent evidence suggests that excess visceral adipose tissue (VAT) is associated with future loss of subcutaneous adipose tissue (SAT) and skeletal muscle (SM) with aging. In clinical settings (abdominal) circumferences are commonly used to estimate body composition (BC). We aimed to study the linearity of VAT distribution ratios (i.e., VAT/SAT ratio and VAT/SM ratio), waist-to-hip ratio (WHR) and waist circumference (WC) with age and the relationship of VAT distribution ratios with anthropometry (i.e., WHR and WC).
Materials and Methods: BC was determined using whole body magnetic resonance imaging in a large multi-ethnic group of 419 adults (42% white, 30% black, 15% Hispanic, 13% Asian, 1% other) with a BMI ranging from 15.9 to 40.8kg/m2. Linear and non-linear regression analysis was used to examine the linearity of VAT distribution ratios and anthropometry from 18 to 88 years. The relation between VAT distribution ratios and anthropometry was assessed separately.
Results: In both sexes non-linear relationships were found between BC estimates and age, and between BC measures mutually. The ratios of VAT/SAT and VAT/SM showed quadratic relationships with age. VAT distribution ratios showed exponential or quadratic relationships with anthropometry with coefficients of determination ranging between 18 and 55%.
Conclusion: In both sexes, VAT distribution ratios showed curvilinear relationships with age and with anthropometry. Given the sex differences in VAT distribution ratios, WHR and WC represent different BC proportions in men and women. These results emphasize the challenge when interpreting changes in BC based upon linear extrapolations in clinical practice.
Introduction
The redistribution of tissues with aging, including the accumulation of ectopic fat in and around organs, has been related to the development of a variety of clinical disorders (1, 2). Aging induces changes in body composition (BC), such as an increase in visceral adipose tissue (VAT) and reduced muscle mass (3). Recently, it has been suggested that the accumulation of VAT precedes future loss of subcutaneous adipose tissue (SAT) and skeletal muscle (SM) (4–8). Understanding the intricate cross-talk between VAT and other tissue compartments may help clinicians in the screening for morbidity (9–12). Although still under investigation, the role of inflammation with aging has been brought forward as an important underlying mechanism in the development of cardiovascular and muscular dysfunction (13, 14). As a result, visceral adiposity and sarcopenic visceral obesity have been linked to adverse health outcomes (15–18) and negative survival (19–22).
Despite the accessibility to gold standard BC techniques in the context of potential life threatening health conditions such as diabetes or cancer, the need for simple, clinically applicable tools that can monitor changes in visceral and muscle tissue distribution over time remains topical. In clinical settings, the use of anthropometry-based markers of central obesity are widely accepted (23), but are not routinely obtained to determine disease risk (24–26). Although their ability to discriminate changes in VAT has previously been questioned (27, 28), there is a renewed interest in the use of waist circumference (WC) in the context of sarcopenic obesity (29, 30). Visceral adiposity and muscle mass change in opposite ways with aging (31), whereas anthropometry-based markers of central obesity gradually increase during lifespan (32–35). In order to advance our understanding of BC changes with aging (e.g., in the context of the operative definition of sarcopenic obesity) in clinical practice, the relation between VAT distribution ratios (i.e., VAT/SAT ratio, VAT/SM ratio), and anthropometry may be further explored (10, 36).
Previous studies investigating the relationship between VAT distribution, waist-to-hip (WHR) or WC have primarily considered a linear analytic approach (34). Investigating whether non-linear relations exist between different levels of organization in BC might help the interpretation of clinical results during screening for disease risk. Therefore we aimed to assess the linearity of VAT distribution ratios, WHR and WC to age in a multi-ethnic sample of healthy adults. Further, we assessed the linearity of VAT distribution ratios with WHR and WC in both sexes.
Materials and Methods
Participants
Four hundred and nineteen healthy women (n = 224) and men (n = 195) varying in ethnicity and age were recruited amongst hospital employees of St. Luke’s/Roosevelt Hospital (NY), students from Queen’s University (ON) and the general public of Kingston and New York. The study was ethically approved by the respective institutional review boards. All participants signed a written informed consent form prior to enrollment. None of the participants reported medication intake known to affect body composition. The study procedures were in accordance with the World Medical Association’s Declaration of Helsinki.
Magnetic Resonance Imaging Segmentation
The participants lay in prone position with their arms placed straight overhead in a 1.5 Tesla scanner (GE, Milwaukee, WI). MRI images were obtained with a T1-weighted, spin-echo sequence with a 210-ms repetition time and a 17-ms echo time. The details of the MRI protocol are described elsewhere (37, 38). A total of approximately 40 images with a slice thickness of 1 cm were acquired from each participant. The MRI data were analyzed using a semi-automatic software program for segmentation (Tomovision, Montreal, PQ). This software program allowed for the discrimination between adipose and muscle tissues based on their gray-level histogram output and a watershed algorithm for the selection of VAT. After segmentation a highly trained analyst specialized in tissular anatomy visually inspected and edited all images.
Body Composition Calculations
The volume of adipose and muscle tissue was calculated by multiplying the area in each image by the slice thickness. The volume of adipose and muscle tissue for the space between two consecutive slices was calculated with the use of a mathematical algorithm given elsewhere (38). The volume of tissues was converted to mass by multiplying the former by its assumed density. Densities of 0.92 g/cm3 and 1.04 g/cm3 were assumed for adipose tissue and muscle, respectively (39).
Visceral Adipose Tissue Distribution Ratios
Visceral adipose tissue, total body SAT and total body SM were used to compute VAT distribution ratios. The ratio of VAT to SAT and the ratio of VAT to SM were used as metrics of VAT distribution.
Anthropometric Variables
Body mass was measured in minimal clothing on a digital scale to the closest 0.1 kg. Stature was recorded to the nearest 5 mm using a wall-mounted stadiometer according to standard procedures. Waist and hip circumference were taken to the nearest 1 mm with an anthropometric steel measuring tape. Waist circumference was measured midway between the iliac crest and lower rib border and hip circumference at the greatest protuberance of the gluteal muscles.
Statistical Analysis
Data were analyzed using MedCalc® Statistical Software version 20.015 (MedCalc Software Ltd, Ostend, Belgium1). Data are expressed as group median [interquartile range] or mean ± standard deviation. Differences between women and men were tested for significance by unpaired t-tests or Mann-Whitney U tests, and for BC parameters by way of analysis of covariance (ANCOVA). Within each sex the linearity of the relation between VAT ratios, anthropometric variables and age was evaluated using linear and non-linear regression modeling based on least squares. An automatic weighted regression procedure was selected to correct for heteroscedasticity. The 0.05 level of significance was used for all data analyses.
Results
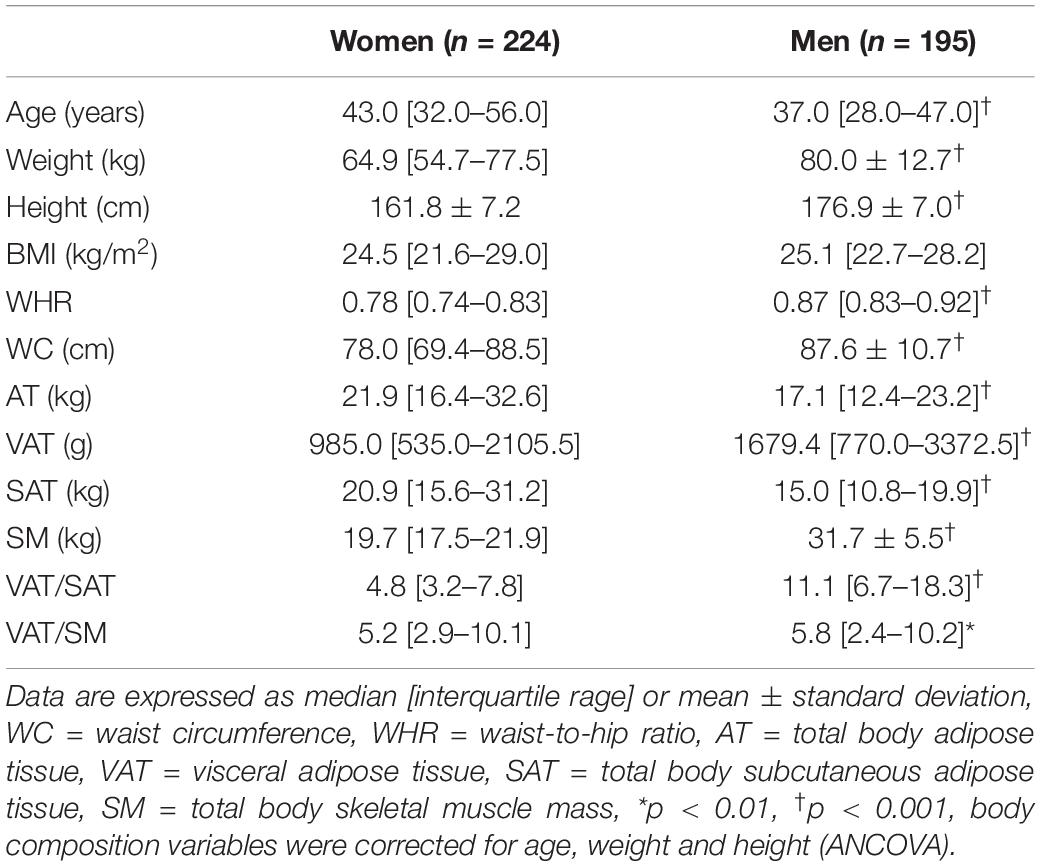
The characteristics of the participants can be found in Table 1. The ethnicity of the participants was equally divided between both sexes: Asian (13%), black (30%), Hispanic (15%), white (42%) and other (1%). Sixty-three percent of women were in the premenopausal period. After correction for age, height and weight, all BC variables were significantly different between sexes, except for BMI.
Relationships of Body Composition With Age
Visceral adipose tissue distribution ratios, WHR and WC were non-linearly related to age in both sexes. The models with the best fit showed that VAT distribution ratios were quadratically related to age in both sexes (Figure 1). Similarly WHR and WC showed quadratic relationships with age (Figure 2).
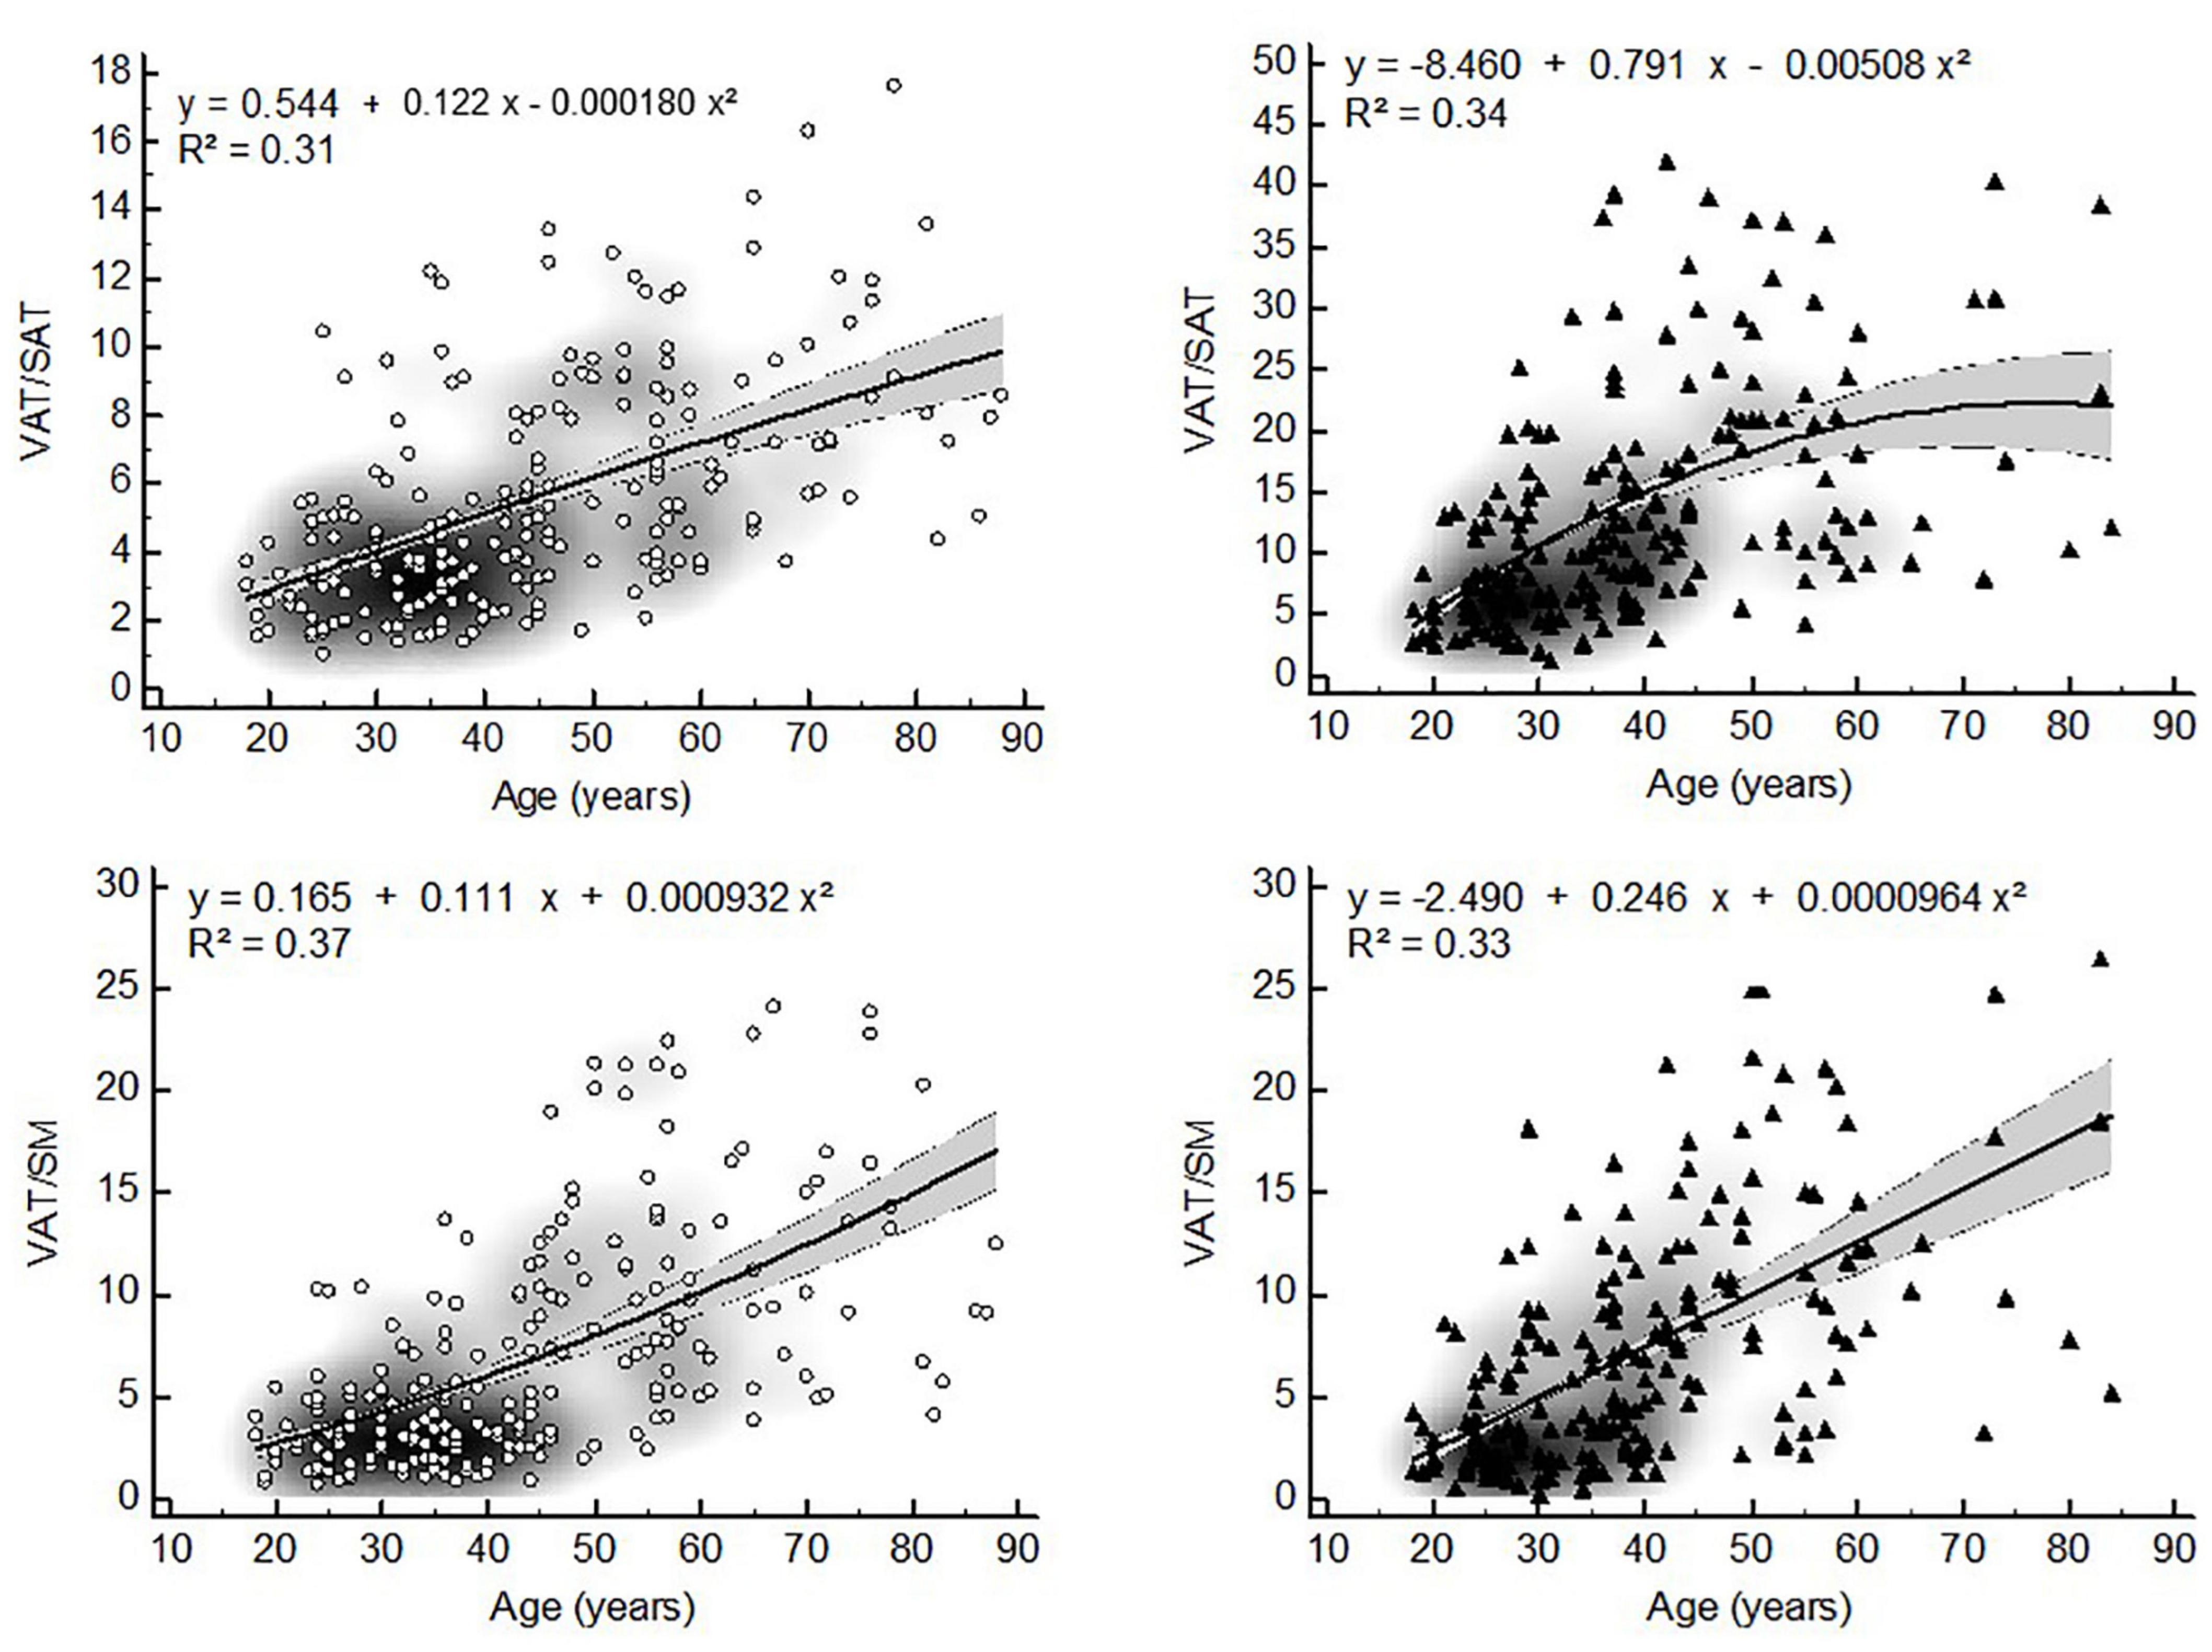
Figure 1. Non-linear relationships between VAT distribution ratios and age (▲ = women, ▲ = men, VAT = visceral adipose tissue, WHR = waist-to-hip ratio, WC = waist circumference, gray zone represents 95% confidence interval).
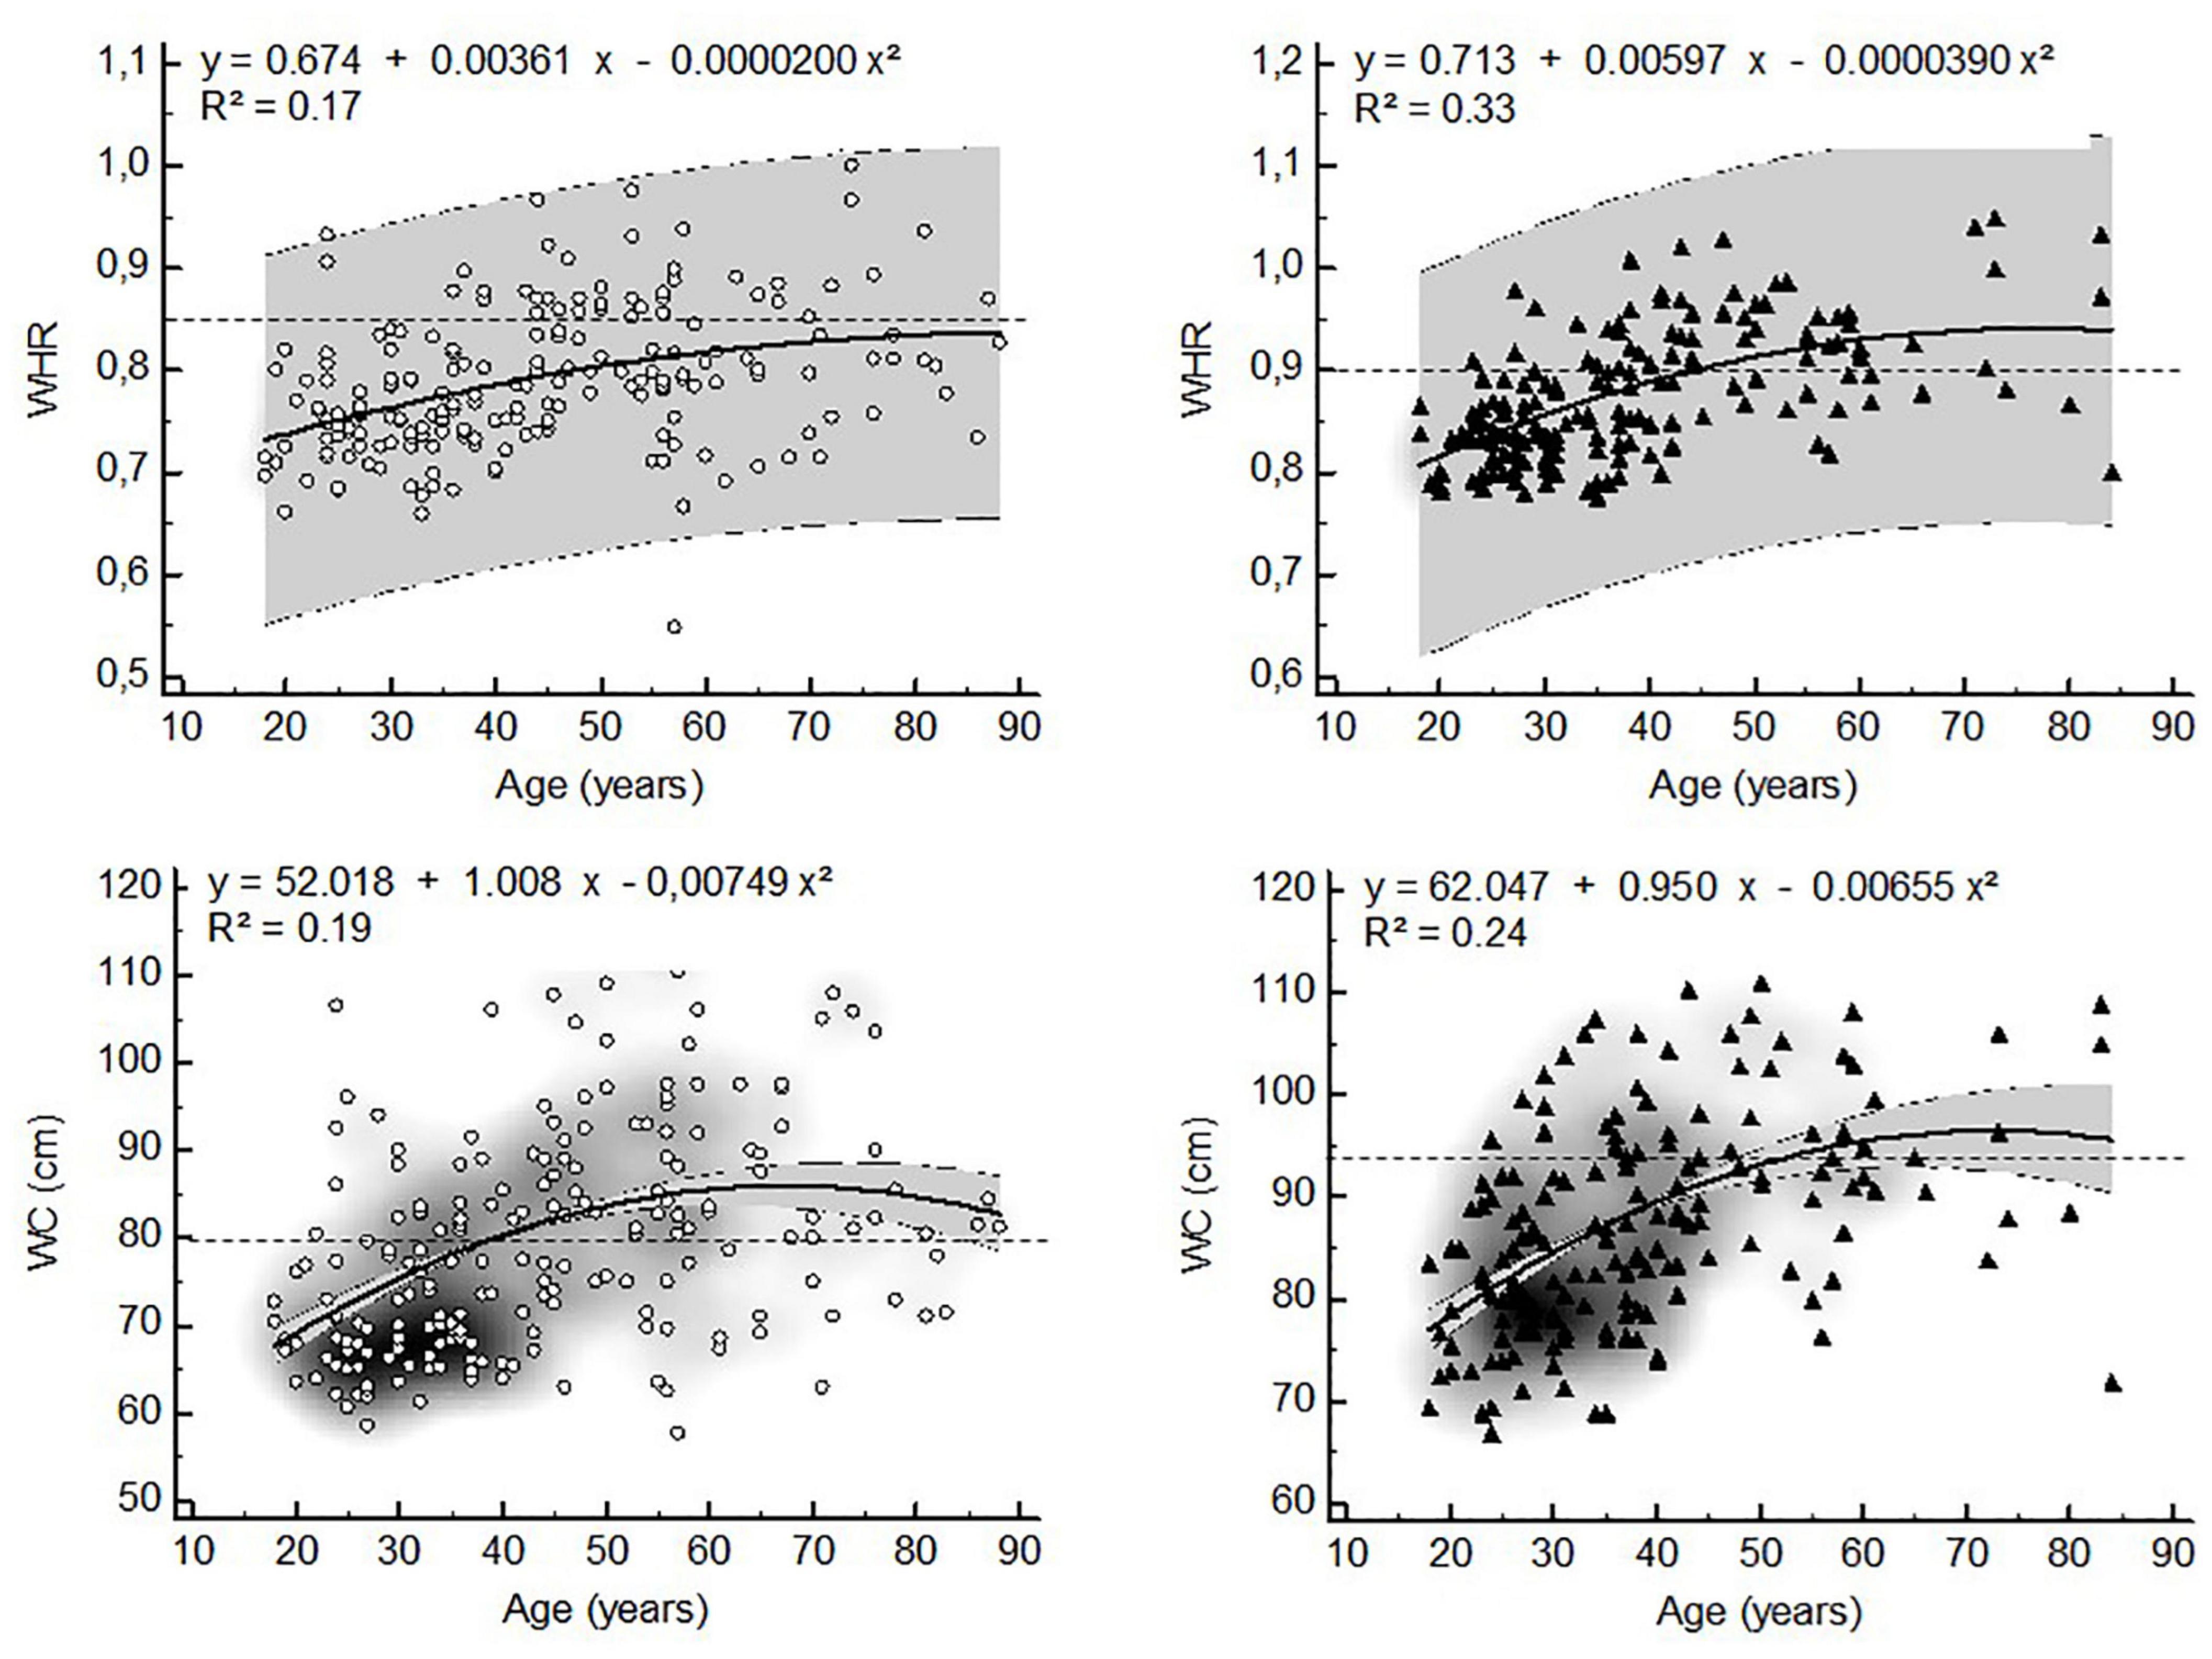
Figure 2. Non-linear relationships between anthropometric estimates of visceral adiposity and age (▲ = women, ▲ = men, WHR = waist-to-hip ratio, WC = waist circumference, dashed lines represent WHO (25) cut points for increased cardiometabolic risk in whites, gray zone represents 95% confidence interval).
Relationships of Visceral Adipose Tissue Distribution Ratios With Waist Circumference and Waist-to-Hip Ratio
The VAT distribution ratios were non-linearly related to anthropometry-based markers of central obesity in both sexes (Figures 3, 4). The ratio of VAT/SAT showed an exponential relationship with WHR (women: R2 = 0.25; men: R2 = 0.47) and a quadratic relationship with WC (women: R2 = 0.18; R2 = 0.39) (Figure 3). In both sexes, VAT/SM was exponentially related to WHR (women: R2 = 0.30; men: R2 = 0.55). The ratio of VAT/SM showed a quadratic relationship to WC (women: R2 = 0.44; men: R2 = 0.55) (Figure 4).
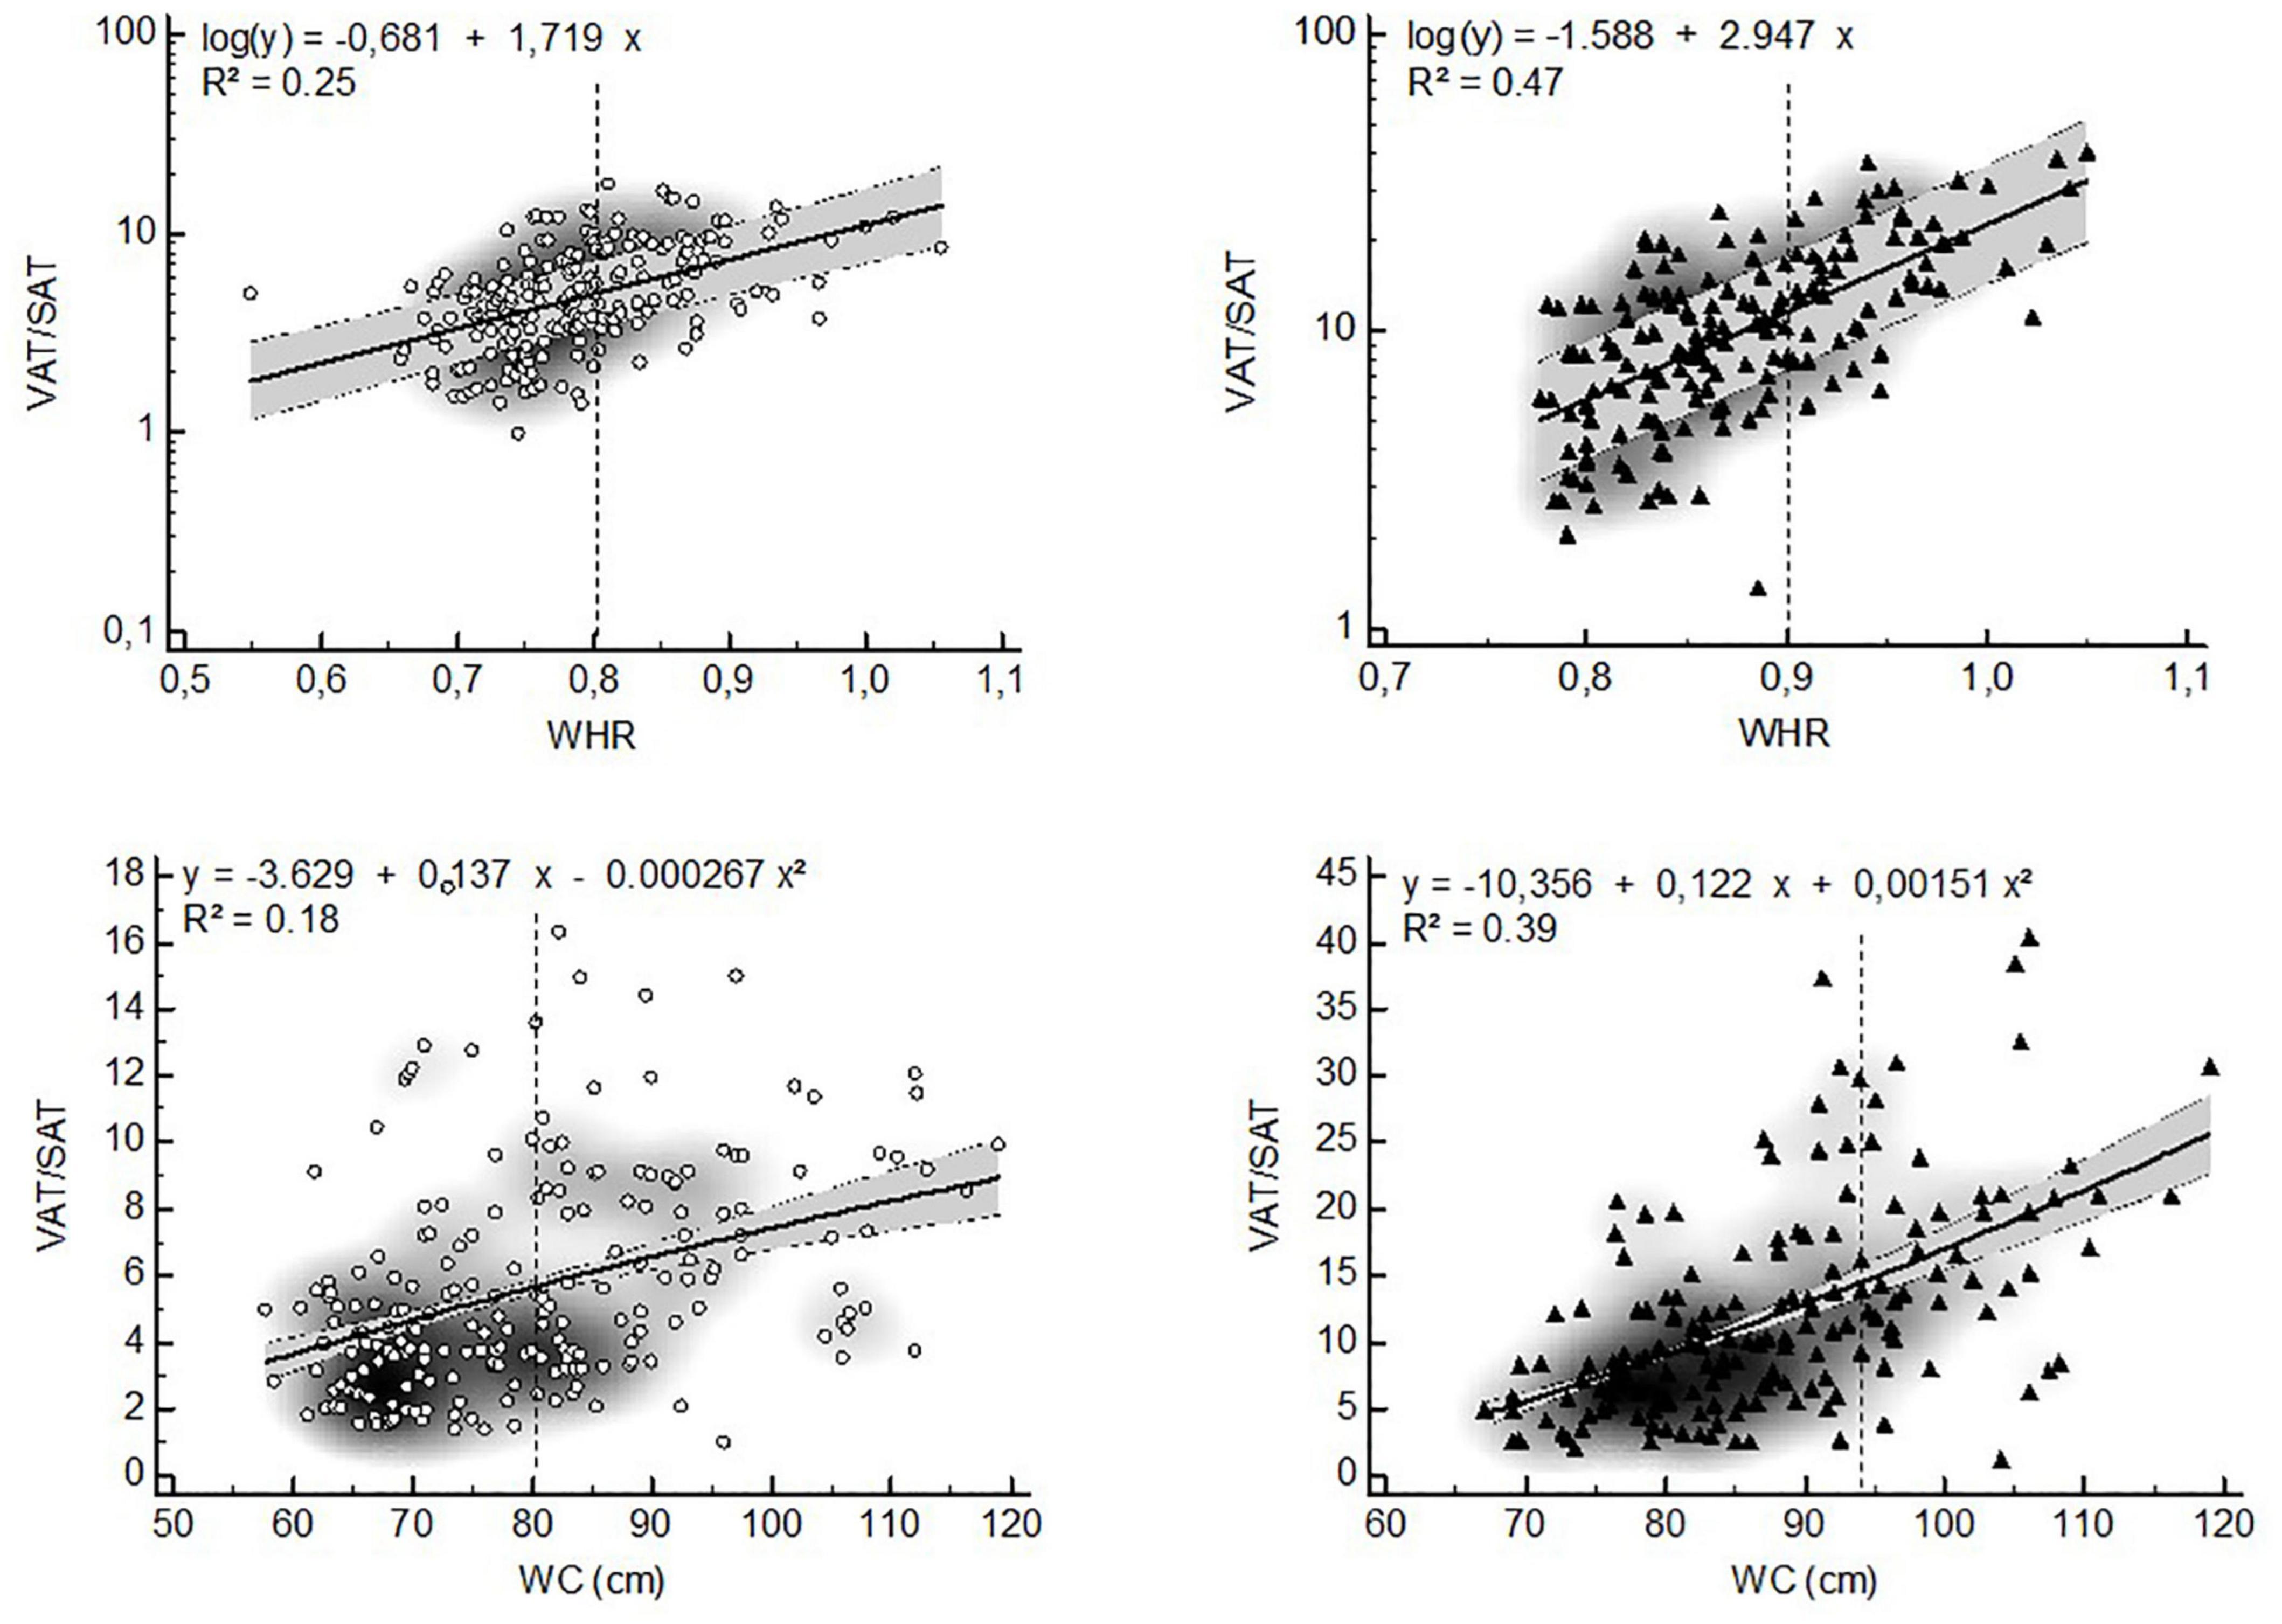
Figure 3. Non-linear relationships between the VAT/SAT ratio and anthropometric estimates of visceral adiposity (▲ = women, ▲ = men, VAT = visceral adipose tissue, SAT = subcutaneous adipose tissue, WHR = waist-to-hip ratio, WC = waist circumference, dashed lines represent WHO (25) cut points for increased cardiometabolic risk in whites, gray zone represents 95% confidence interval).
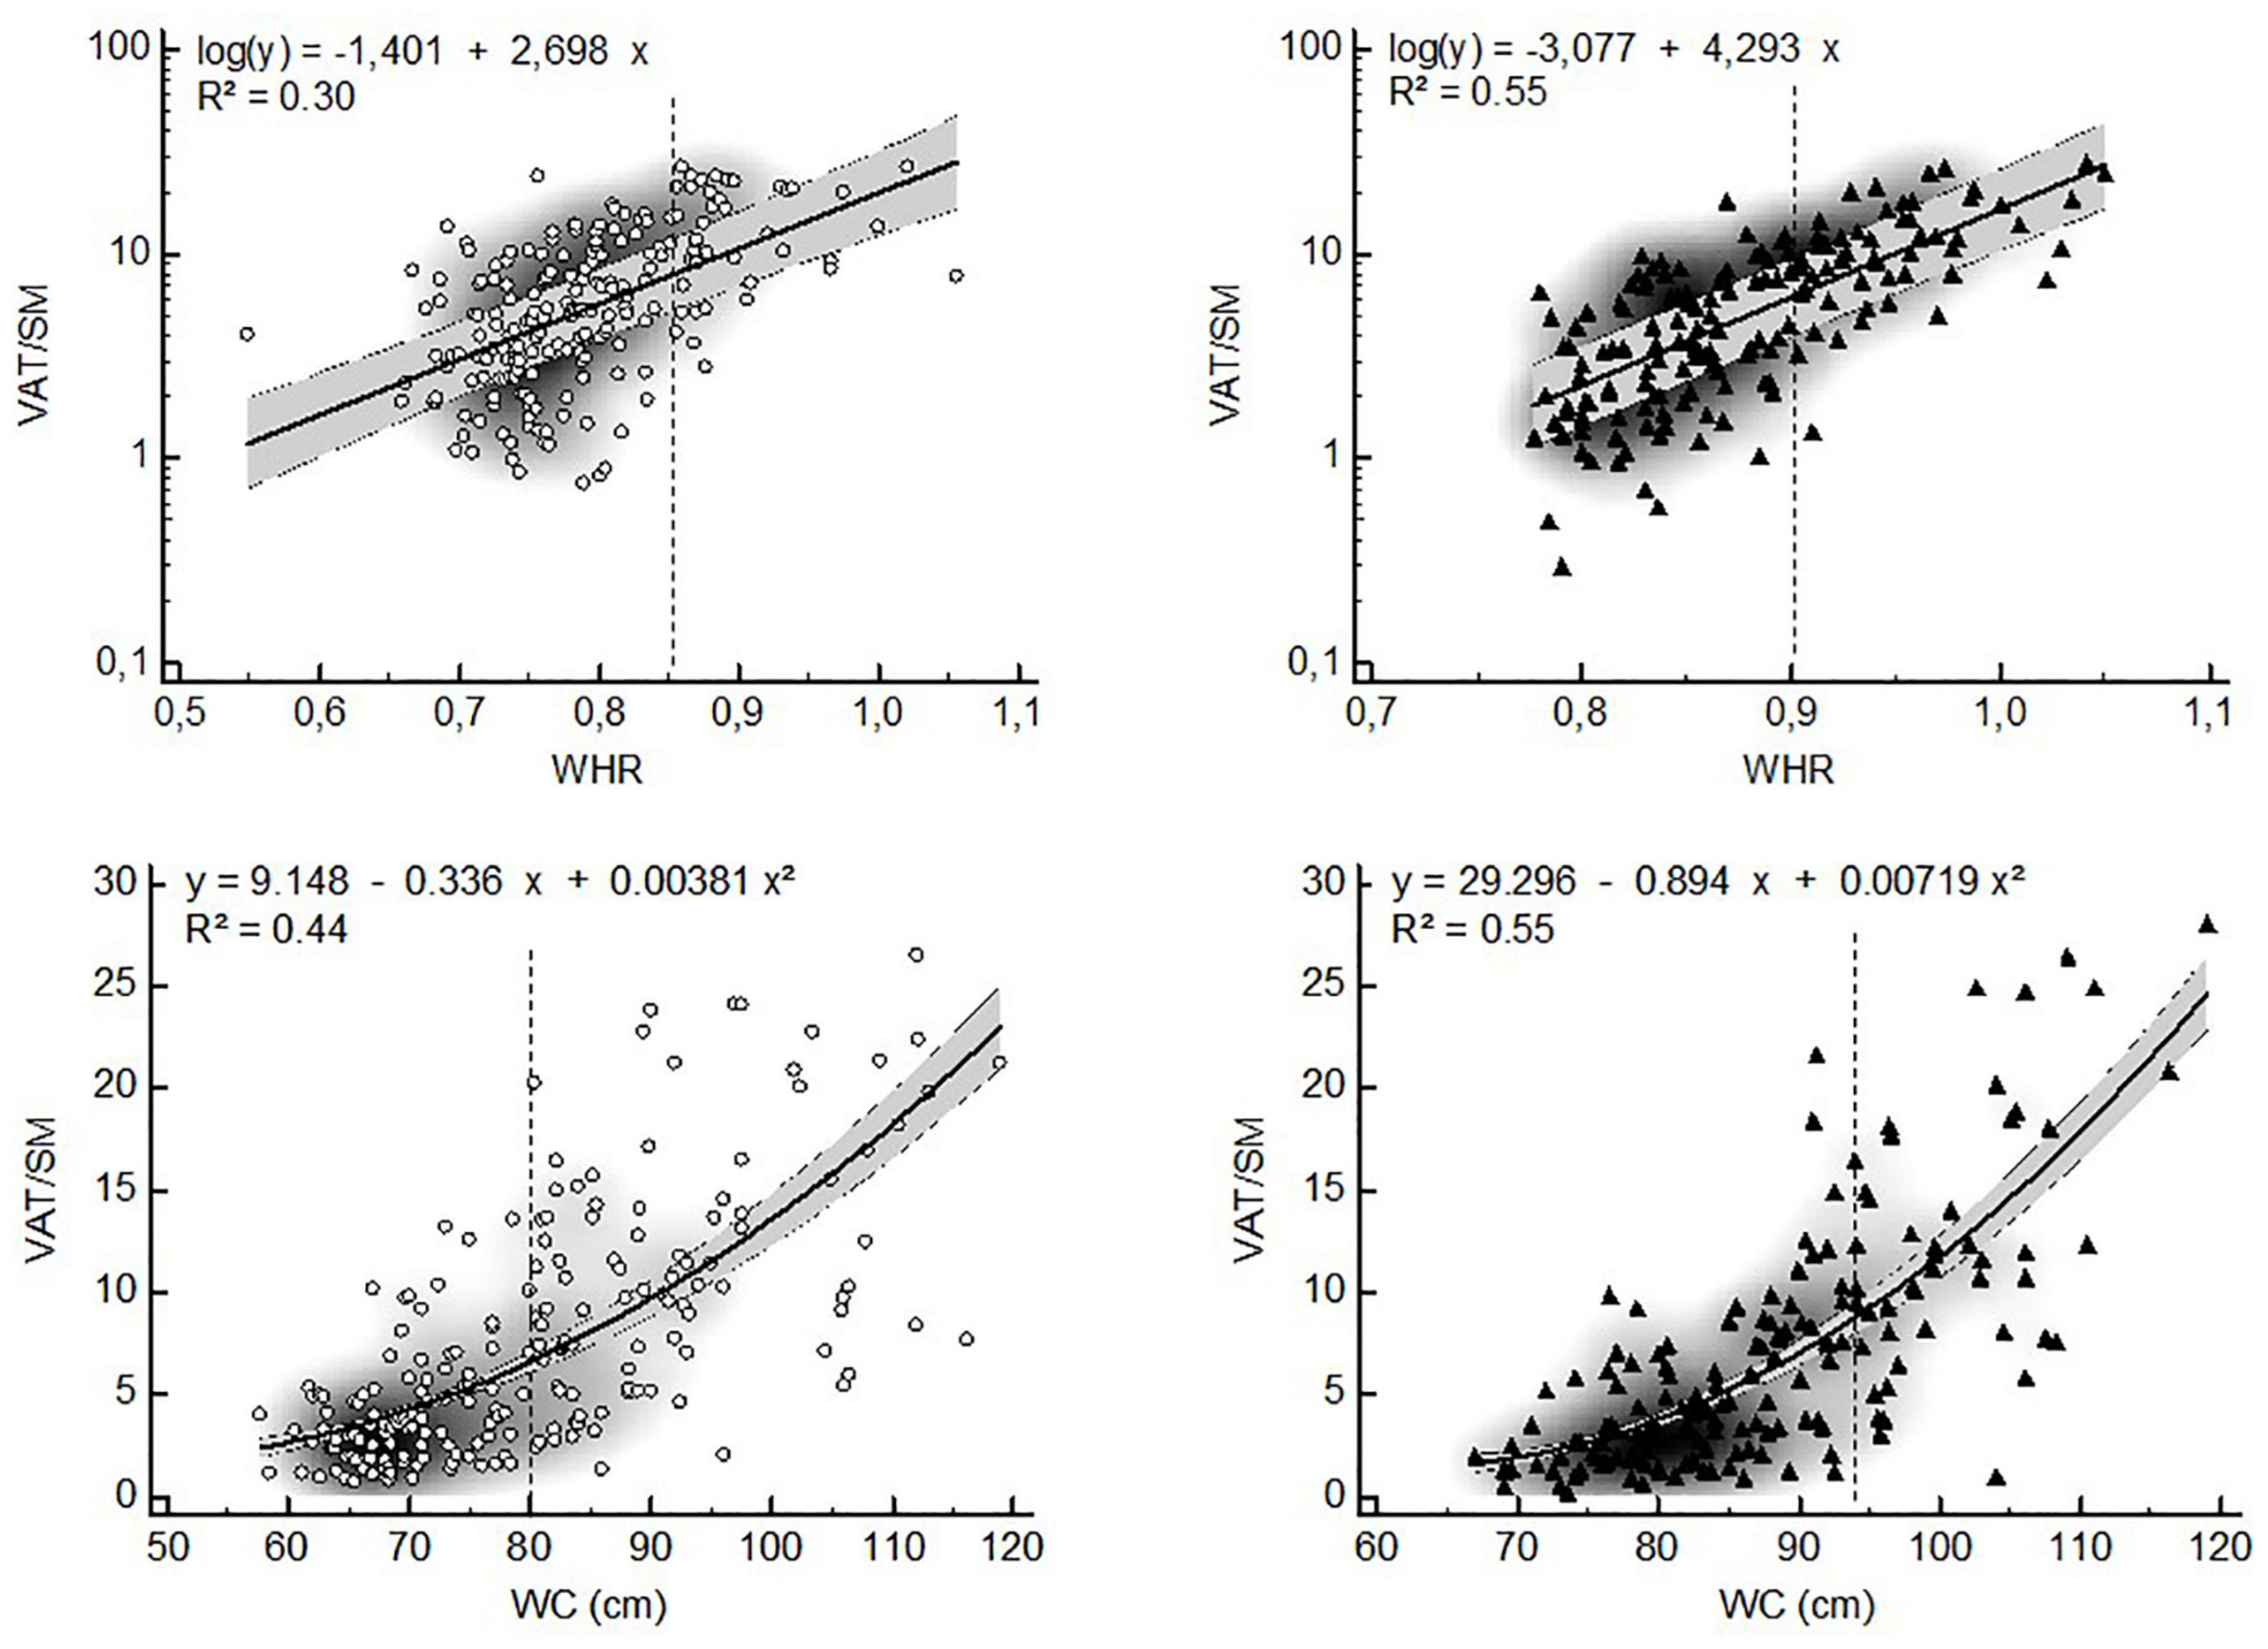
Figure 4. Non-linear relationships between the VAT/SM ratio and anthropometric estimates of visceral adiposity (▲ = women, ▲ = men, VAT = visceral adipose tissue, SM = skeletal muscle, WHR = waist-to-hip ratio, WC = waist circumference, dashed lines represent WHO (25) cut points for increased cardiometabolic risk in whites, gray zone represents 95% confidence interval).
Discussion
The main finding of this study is that visceral adipose tissue distribution is non-linearly related to age and to anthropometry-based estimates of visceral adiposity. Non-linear relationships between single BC compartments and age have been reported earlier and can be visualized by for example the Gaussian-like distribution for change in adiposity during life (32). Further, muscle and age show a curvilinear relationship due to the increasing rate in muscle loss with advanced aging (40). When used as indices, however, BC ratios (e.g., VAT/SAT) are often assumed to be linearly related to age or other BC components.
Although it has previously been reported that the ratio of VAT/SAT increases in a quasi-linear manner with age (34), we found quadratic relationships in both sexes. This can be explained by the fact that the slopes of the increase in VAT and SAT are significantly different between these compartments (Figure 5). Moreover, in old age the VAT compartment continues to increase slowly, while the SAT compartment starts to decrease slowly. Thus, the rate at which both BC compartments change differs considerably in time. As a result, the change in VAT/SAT distribution by age is more pronounced in middle adulthood than in old age.
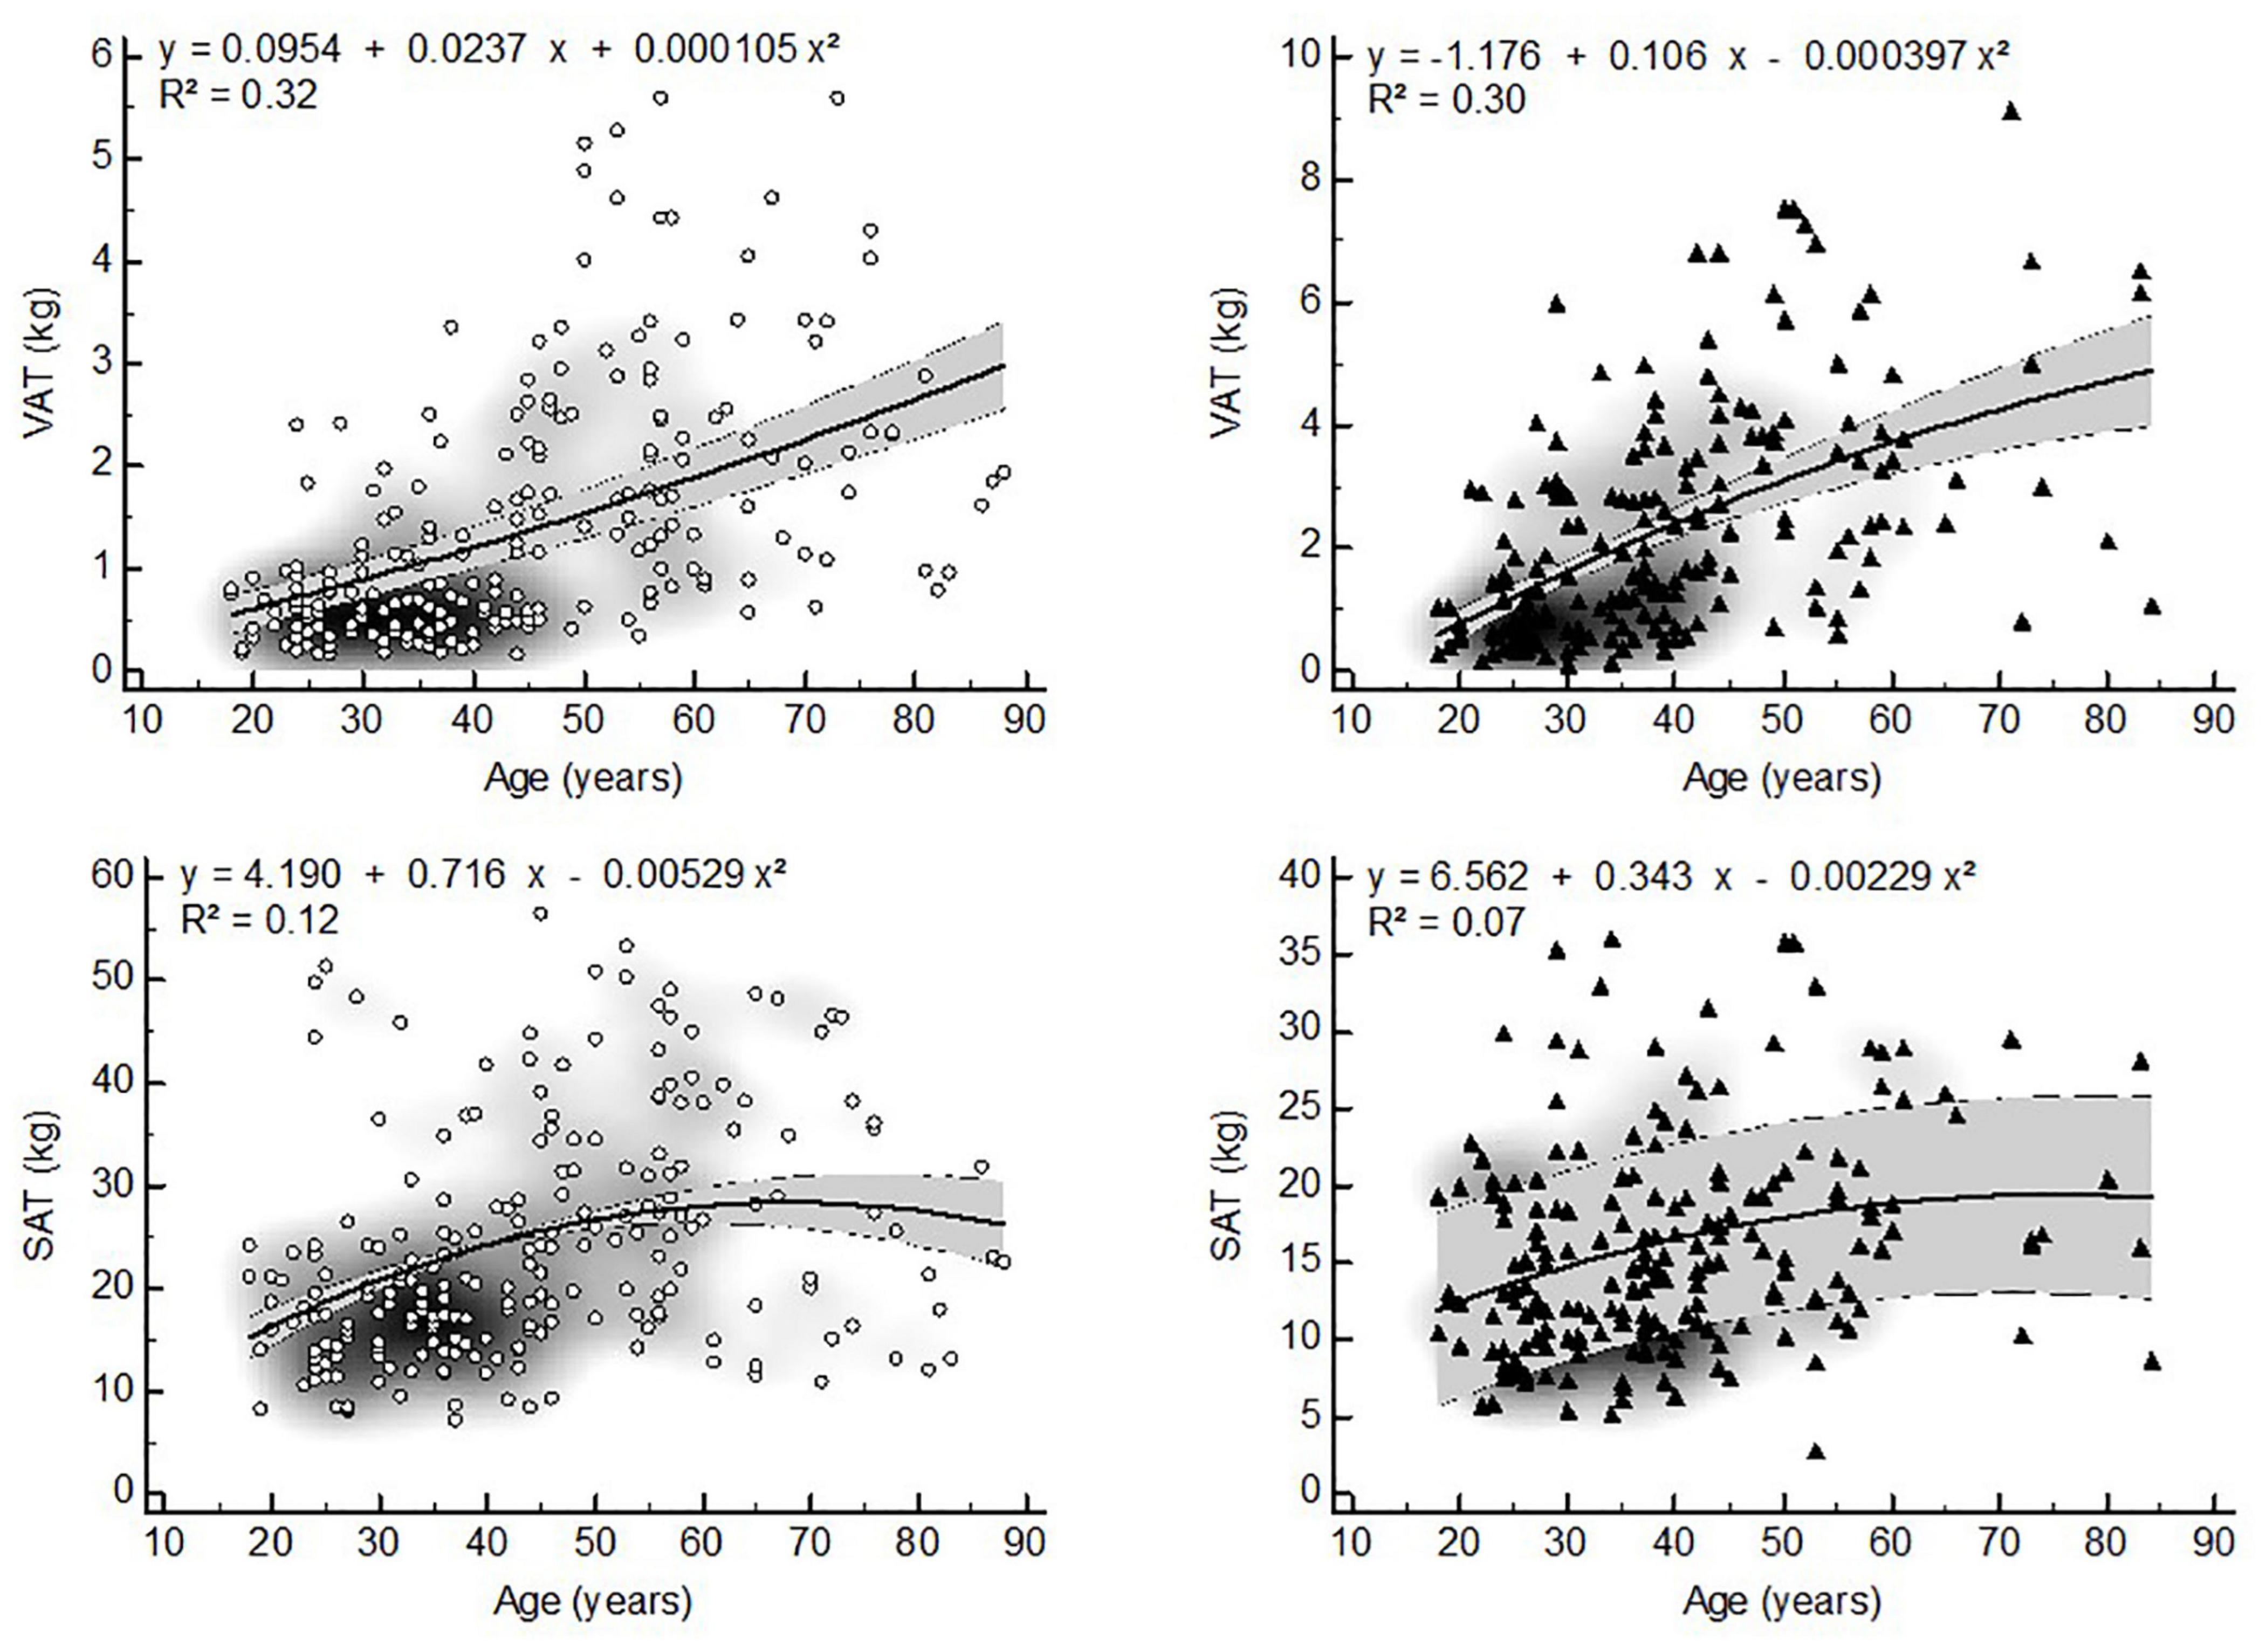
Figure 5. Non-linear relationships between VAT, SAT and age (▲ = women, ▲ = men, VAT = visceral adipose tissue, SAT = subcutaneous adipose tissue, gray zone represents 95% confidence interval).
To the knowledge of the authors, no studies were found describing the relation of the VAT/SM ratio to age. Similar to VAT/SAT a quadratic relationship between VAT/SM and age was found in both sexes. Muscle mass starts to decrease at an age of about 50 years old and accelerates to decrease with advancing age. As a result, the change in VAT/SM shows a similar pattern to the change in VAT/SAT during life, although the former seems to change in a more pronounced way in old age. These results may therefore support the pathophysiological model whereby visceral adiposity accumulation in middle adulthood induces skeletal muscle insufficiency in old age, which in turn may possibly lead to the development of metabolic syndrome or sarcopenic visceral obesity (6, 41).
The changes in WHR and WC over time in the present study are in agreement with previous findings (32, 25). Waist and hip circumferences gradually increase with age until about 70 years old in both sexes. In older age (> 70 years) WHR and WC may further increase at slow rates of about 1-2% per decade in stable-weight subjects or decrease slowly in subjects losing weight (42–44). Since the changes in visceral adipose tissue distribution are more accentuated than the changes in circumferences with age, our results suggest that the latter may underestimate changes in visceral adipose tissue distribution especially in older persons.
Our results show that VAT distribution ratios are exponentially related to WHR and WC. This implies that BC proportions may change more rapidly than proxies of visceral adiposity, especially above the WHO cut points for increased risk. As a result, when used as surrogates for BC, WHR and WC should be corrected according to the risk category. For example, in men a WC of 120 cm corresponds to a VAT/SM ratio that is four times higher than the one at a waist of 90 cm (Figure 3). Of note, the VAT/SM ratio is similar across sexes below the cut points for increased metabolic risk based on WC. However, above these cut points the same increase in WC corresponds to a larger increase in VAT distribution in men compared to women, also highlighting the sex-specific differences in BC.
A recent pilot study showed that both VAT/SAT ratio and WHR correlate with pro-inflammatory cytokines in obese women, suggesting their potential role in the development of cardiometabolic dysfunction (45). Our study showed that VAT/SAT correlated best with WHR in both sexes. This is in contradiction with the findings of Tresignie et al. (46) and Bazzocchi et al. (47) who found no association between VAT/SAT ratio and WHR. Although our results are partially in agreement with those of Seidell et al. (48) who found a positive relation between VAT/SAT and WHR in women, the differences with other studies may be explained by the differences in the assessment of SAT. While it is common to calculate SAT from a medical imaging scan slice using CT or MRI, whole body SAT was used in the present study. Nevertheless, our findings may suggest that hip circumference better reflects whole body adiposity rather than regional (trunk) adiposity in healthy adults.
The VAT/SM ratio correlated best with WC in both sexes. Although most studies agree that redistribution of visceral adiposity occurs after menopause due to the absence of estrogens (49), Franklin et al. (50) found that menopause did not affect the relative abdominal adipose tissue distribution (VAT vs. SAT and VAT vs. muscle) or WC in their longitudinal study. As such, it is possible that the changes in body composition occurring directly after menopause may be captured by WC.
As pointed out, non-linear relationships between BC components have been described previously (32). Despite their different development rates during life, cross-sectional and longitudinal research in adult BC often assumes linear relationships between different levels of organization in BC. Since the interrelationship between these levels of organization might be more complex than usually assumed due to biological variation, their translation toward clinical practice remains challenging. This may be highlighted by the fact that the same amount of change in WC, may represent a variable change in BC components depending on age, sex and absolute quantities. In the field of BC there is a need to establish minimally important clinical differences (MICD), as it is unknown by which amount body components/proportions should change in order to make a difference to the patient. This approach may also help in the operational definition of BC related pathologies, such as cardiometabolic risk or sarcopenic visceral obesity. Future BC research should therefore also focus on determining the smallest change (at different levels of organization) in the treatment of individual patients with similar pathologies as MICD is depending on the BC components that are measured and their respective quantities. By doing so the cross-talk between different BC components in metabolic syndrome and/or sarcopenic visceral obesity may be further elucidated.
Limitations
There are a number of limitations to consider when interpreting our study results. First, WC was taken midway between the iliac crest and lower rib border. Since the absolute value of WC may differ up to 20% according to its measurement site, our results may only be valid for identical measurement protocols (51).
Secondly, although we described the relation between BC and age, our data are cross-sectional. As longitudinal studies are more accurate in assessing age-related changes in BC than cross-sectional studies do, our results may underestimate the effects of aging on VAT distribution. Therefore longterm follow-up studies assessing VAT distribution changes over time are necessary to confirm our findings.
Finally, analysis of covariance (controlling for age, weight and height) showed that the VAT/SM ratio of Asian women is lower compared to that of white and black women. No other differences in body fat distribution or anthropometric estimates were apparent. Since the group of Asian women represents 13% of the total sample, we assumed that the impact of ethnic differences in body fat distribution may be rather small, albeit it cannot be excluded that the ethnic heterogeneity of our sample might have lowered the predictive accuracy of our regression models.
Conclusion
Visceral adipose tissue distribution is non-linearly related to age, WHR and WC. These relationships are curvilinear in nature and are influenced by age, sex and quantity. Since WHR and WC may represent different BC compartments, our results also emphasize the challenge when interpreting changes in BC based upon linear extrapolations.
Data Availability Statement
The raw data supporting the conclusions of this article will be made available by the authors, without undue reservation.
Ethics Statement
The studies involving human participants were reviewed and approved by institutional review boards of St. Luke’s/Roosevelt Hospital (NY) and Queen’s University (ON). The patients/participants provided their written informed consent to participate in this study.
Author Contributions
AS designed research (project conception, development of overall research plan, and study oversight), analyzed data or performed statistical analysis, wrote the manuscript (major contribution), and had primary responsibility for final content. JV, EC, and IB had primary responsibility for final content. SH designed research (project conception, development of overall research plan, and study oversight), conducted research (hands-on conduct of the experiments and data collection), provided essential reagents or provided essential materials (contributed by providing constructs, databases, etc., necessary for research), and had primary responsibility for final content. All authors contributed to the article and approved the submitted version.
Conflict of Interest
The authors declare that the research was conducted in the absence of any commercial or financial relationships that could be construed as a potential conflict of interest.
Publisher’s Note
All claims expressed in this article are solely those of the authors and do not necessarily represent those of their affiliated organizations, or those of the publisher, the editors and the reviewers. Any product that may be evaluated in this article, or claim that may be made by its manufacturer, is not guaranteed or endorsed by the publisher.
Acknowledgments
We wish to thank the hospital employees of St. Luke’s/Roosevelt Hospital (NY), students from Queen’s University (ON) and the general public of Kingston and New York.
Footnotes
- ^ https://www.medcalc.org; 2021.
References
1. Neeland IJ, Ross R, Després J-P, Matsuzawa Y, Yamashita S, Shai I, et al. International atherosclerosis society; international chair on cardiometabolic risk working group on visceral obesity. Visceral and ectopic fat, atherosclerosis, and cardiometabolic disease: a position statement. Rev Lancet Diab Endocrinol. (2019) 7:715–25.
2. Avgerinos KI, Spyrou N, Mantzoros CS, Dalamaga M. Obesity and cancer risk: emerging biological mechanisms and perspectives. Metabolism. (2019) 92:121–35. doi: 10.1016/j.metabol.2018.11.001
4. Ebadi M, Baracos VE, Bathe OF, Robinson LE, Mazurak VC. Loss of visceral adipose tissue precedes subcutaneous adipose tissue and associates with n-6 fatty acid content. Clin Nutr. (2016) 35:1347–53. doi: 10.1016/j.clnu.2016.02.014
5. Kim TN, Park MS, Ryu JY, Choi HY, Hong HC, Yoo HJ, et al. Impact of visceral fat on skeletal muscle mass and vice versa in a prospective cohort study: the Korean sarcopenic obesity study (KSOS). PLoS One. (2014) 9:e115407. doi: 10.1371/journal.pone.0115407
6. Kalinkovich A, Livshits G. Sarcopenic obesity or obese sarcopenia: a cross talk between age-associated adipose tissue and skeletal muscle inflammation as a main mechanism of the pathogenesis. Ageing Res Rev. (2017) 35:200–21. doi: 10.1016/j.arr.2016.09.008
7. Roh E, Choi KM. Health consequences of sarcopenic obesity: a narrative review. Front Endocrinol (Lausanne). (2020) 11:332. doi: 10.3389/fendo.2020.00332
8. Armandi A, Rosso C, Caviglia GP, Ribaldone DG, Bugianesi E. The impact of dysmetabolic sarcopenia among insulin sensitive tissues: a narrative review. Front Endocrinol (Lausanne). (2021) 12:716533. doi: 10.3389/fendo.2021.716533
9. Chung HS, Choi KM. Adipokines and myokines: a pivotal role in metabolic and cardiovascular disorders. Curr Med Chem. (2018) 25:2401–15. doi: 10.2174/0929867325666171205144627
10. Zamboni M, Rubele S, Rossi AP. Sarcopenia and obesity. Curr Opin Clin Nutr Metab Care. (2019) 22:13–9.
11. Paris MT, Bell KE, Mourtzakis M. Myokines and adipokines in sarcopenia: understanding cross-talk between skeletal muscle and adipose tissue and the role of exercise. Curr Opin Pharmacol. (2020) 52:61–6. doi: 10.1016/j.coph.2020.06.003
12. Wilhelmsen A, Tsintzas K, Jones SW. Recent advances and future avenues in understanding the role of adipose tissue cross talk in mediating skeletal muscle mass and function with ageing. Geroscience. (2021) 43:85–110. doi: 10.1007/s11357-021-00322-4
13. Biolo G, Cederholm T, Muscaritoli M. Muscle contractile and metabolic dysfunction is a common feature of sarcopenia of aging and chronic diseases: from sarcopenic obesity to cachexia. Clin Nutr. (2014) 33:737–48. doi: 10.1016/j.clnu.2014.03.007
14. Livshits G, Kalinkovich A. Inflammaging as a common ground for the development and maintenance of sarcopenia, obesity, cardiomyopathy and dysbiosis. Ageing Res Rev. (2019) 56:100980. doi: 10.1016/j.arr.2019.100980
15. Sandini M, Bernasconi DP, For D, Molinelli M, Ippolito D, Nespoli L, et al. A high visceral adipose tissue-to-skeletal muscle ratio as a determinant of major complications after pancreatoduodenectomy for cancer. Nutrition. (2016) 32:1231–7. doi: 10.1016/j.nut.2016.04.002
16. Okumura S, Kaido T, Hamaguchi Y, Kobayashi A, Shirai H, Yao S, et al. Visceral adiposity and sarcopenic visceral obesity are associated with poor prognosis after resection of pancreatic cancer. Ann Surg Oncol. (2017) 24:3732–40. doi: 10.1245/s10434-017-6077-y
17. Hwang YC, Jeon WS, Park CY, Youn BS. The ratio of skeletal muscle mass to visceral fat area is a main determinant linking circulating irisin to metabolic phenotype. Cardiovasc Diabetol. (2016) 15:9. doi: 10.1186/s12933-015-0319-8
18. Liu D, Zhong J, Wen W, Ruan Y, Zhang Z, Sun J, et al. Relationship between skeletal muscle mass to visceral fat area ratio and cardiovascular risk in type 2 diabetes. Diabetes Metab Syndr Obes. (2021) 14:3733–42. doi: 10.2147/DMSO.S326195
19. Ni Y-N, Yu H, Xu H, Li W-J, Liang B-M, Yang L, et al. High visceral adipose tissue to subcutaneous adipose tissue ratio as a predictor of mortality in acute respiratory distress syndrome. Am J Med Sci. (2019) 357:213–22. doi: 10.1016/j.amjms.2018.11.015
20. Lee JGH, Genga KR, Pisitsak C, Boyd JH, Leung AKK, Russell JA, et al. Survival benefit of a low ratio of visceral to subcutaneous adipose tissue depends on LDL clearance versus production in sepsis. Crit Care. (2018) 22:58. doi: 10.1186/s13054-018-1985-1
21. Xie J, Xu L, Pan Y, Li P, Liu Y, Pan Y, et al. Impact of visceral adiposity on severity of acute pancreatitis: a propensity score-matched analysis. BMC Gastroenterol. (2019) 19:87. doi: 10.1186/s12876-019-1015-z
22. Lopez P, Newton RU, Taaffe DR, Singh F, Buffart LM, Spry N, et al. Associations of fat and muscle mass with overall survival in men with prostate cancer: a systematic review with meta-analysis. Prostate Cancer Prostatic Dis. (2021). doi: 10.1038/s41391-021-00442-0
23. Scafoglieri A, Clarys JP, Cattrysse E, Bautmans I. Use of anthropometry for the prediction of regional body tissue distribution in adults: benefits and limitations in clinical practice. Aging Dis. (2014) 5:373–93. doi: 10.14366/AD.2014.0500373
24. National Institutes of Health. Clinical guidelines on the identification, evaluation, and treatment of overweight and obesity in adults–the evidence report. Obes Res. (1998) 6:51S–209S.
25. World Health Organisation. Waist Circumference and Waist-Hip Ratio: Report of a WHO Expert Consultation Geneva: WHO (2008).
26. Ross R, Neeland IJ, Yamashita S, Shai I, Seidell J, Magni P, et al. Waist circumference as a vital sign in clinical practice: a consensus statement from the IAS and ICCR working group on visceral obesity. Nat Rev Endocrinol. (2020) 16:177–89. doi: 10.1038/s41574-019-0310-7
27. van der Kooy K, Leenen R, Seidell JC, Deurenberg P, Droop A, Bakker CJ. Waist-hip ratio is a poor predictor of changes in visceral fat. Am J Clin Nutr. (1993) 57:327–33. doi: 10.1093/ajcn/57.3.327
28. Toth MJ, Tchernof A, Sites CK, Poehlman ET. Menopause-related changes in body fat distribution. Ann N Y Acad Sci. (2000) 904:502–6. doi: 10.1111/j.1749-6632.2000.tb06506.x
29. Liao Q, Xiu S, Chan P. Reply to the letter “Waist circumference or sarcopenic obesity; which is more predictive?” Aging Clin Exp Res. (2019) 31:1539–40. doi: 10.1007/s40520-019-01252-0
30. Lim JP, Chew J, Ismail NH, Lim WS. Letter to the editor: obesity definition for muscle outcomes in sarcopenic obesity: utility of waist circumference revisited. J Frailty Aging. (2021) 10:334–6. doi: 10.14283/jfa.2021.28
31. Ponti F, Santoro A, Mercatelli D, Gasperini C, Conte M, Martucci M, et al. Aging and imaging assessment of body composition: from fat to facts. Front Endocrinol (Lausanne). (2020) 10:861. doi: 10.3389/fendo.2019.00861
32. Wang J, Thornton JC, Kolesnik S, Pierson RN Jr. Anthropometry in body composition: an overview. Ann NY Acad Sci. (2000) 904:317–26. doi: 10.1111/j.1749-6632.2000.tb06474.x
33. Dobbelsteyn CJ, Joffres MR, MacLean DR, Flowerdew G. A comparative evaluation of waist circumference, waist-to-hip ratio and body mass index as indicators of cardiovascular risk factors. The Canadian heart health surveys. ZInt J Obes Relat Metab Disord. (2001) 25:652–61. doi: 10.1038/sj.ijo.0801582
34. Ferrannini E, Sironi AM, Iozzo P, Gastaldelli A. Intra-abdominal adiposity, abdominal obesity, and cardiometabolic risk. Eur Heart J Suppl. (2008) 10 (Supplement B):B4–10.
35. Kuk JL, Saunders TJ, Davidson LE, Ross R. Age-related changes in total and regional fat distribution. Ageing Res Rev. (2009) 8:339–48. doi: 10.1016/j.arr.2009.06.001
36. Prado CMM, Wells JCK, Smith SR, Stephan BCM, Siervo M. Sarcopenic obesity: A Critical appraisal of the current evidence. Clin Nutr. (2012) 31:583–601. doi: 10.1016/j.clnu.2012.06.010
37. Ross R, Rissanen J, Pedwell H, Clifford J, Shragge P. Influence of diet and exercise on skeletal muscle and visceral adipose tissue in men. J Appl Physiol (1985). (1996) 81:2445–55. doi: 10.1152/jappl.1996.81.6.2445
38. Mitsiopoulos N, Baumgartner RN, Heymsfield SB, Lyons W, Gallagher D, Ross R. Cadaver validation of skeletal muscle measurement by magnetic resonance imaging and computerized tomography. J Appl Physiol (1985). (1998) 85:115–22. doi: 10.1152/jappl.1998.85.1.115
39. Snyder WS, Cook MJ, Nasset ES, Karhausen LR, Howells GP, Tipton IH. Report of the Task Group on Reference Man (ICRP 23). Oxford: Pergamon Press (1975).
40. Janssen I, Heymsfield SB, Wang ZM, Ross R. Skeletal muscle mass and distribution in 468 men and women aged 18-88 yr. J Appl Physiol (1985). (2000) 89:81–8. doi: 10.1152/jappl.2000.89.1.81
41. Ramírez-Vélez R, Garcia-Hermoso A, Prieto-Benavides DH, Correa-Bautista JE, Quino-Ávila AC, Rubio-Barreto CM, et al. Muscle mass to visceral fat ratio is an important predictor of the metabolic syndrome in college students. Br J Nutr. (2019) 121:330–9. doi: 10.1017/S0007114518003392
42. Zamboni M, Zoico E, Scartezzini T, Mazzali G, Tosoni P, Zivelonghi A, et al. Body composition changes in stable-weight elderly subjects: the effect of sex. Aging Clin Exp Res. (2003) 15:321–7. doi: 10.1007/BF03324517
43. Fantin F, Di Francesco V, Fontana G, Zivelonghi A, Bissoli L, Zoico E, et al. Longitudinal body composition changes in old men and women: interrelationships with worsening disability. J Gerontol A Biol Sci Med Sci. (2007) 62:1375–81. doi: 10.1093/gerona/62.12.1375
44. de Hollander EL, Bemelmans WJE, de Groot LCPGM. Associations between changes in anthropometric measures and mortality in old age: a role for mid-upper arm circumference? J Am Med Dir Assoc. (2013) 14:187–93. doi: 10.1016/j.jamda.2012.09.023
45. Ostrowska L, Gornowicz A, Pietraszewska B, Bielawski K, Bielawska A. Which salivary components can differentiate metabolic obesity? PLoS One. (2020) 15:e0235358. doi: 10.1371/journal.pone.0235358
46. Tresignie J, Scafoglieri A, Provyn S, Clarys JP. Comparison of frequently used, unexplored and newly designed indices for the assessment of segmental and whole body constituents. Asia Pac J Clin Nutr. (2011) 20:418–25.
47. Bazzocchi A, Ponti DF, Salizzoni E, Albisinni U, Marchesini G, Battista G. A 360-degree overview of body composition in healthy people: relationships among anthropometry, ultrasonography, and dual-energy x-ray absorptiometry. Nutrition. (2014) 30:696–701. doi: 10.1016/j.nut.2013.11.013
48. Seidell JC, Oosterlee A, Thijssen MA, Burema J, Deurenberg P, Hautvast JG, et al. Assessment of intra-abdominal and subcutaneous abdominal fat: relation between anthropometry and computed tomography. Am J Clin Nutr. (1978) 45:7–13. doi: 10.1093/ajcn/45.1.7
49. Lizcano F, Guzmán G. Estrogen deficiency and the origin of obesity during menopause. Biomed Res Int. (2014) 2014:757461. doi: 10.1155/2014/757461
50. Franklin RM, Ploutz-Snyder L, Kanaley JA. Longitudinal changes in abdominal fat distribution with menopause. Metabolism. (2009) 58:311–5. doi: 10.1016/j.metabol.2008.09.030
Keywords: visceral adipose tissue, subcutaneous adipose tissue, skeletal muscle, waist-to-hip ratio, waist circumference, nonlinearity
Citation: Scafoglieri A, Van den Broeck J, Cattrysse E, Bautmans I and Heymsfield SB (2022) Non-linear Associations Between Visceral Adipose Tissue Distribution and Anthropometry-Based Estimates of Visceral Adiposity. Front. Nutr. 9:825630. doi: 10.3389/fnut.2022.825630
Received: 30 November 2021; Accepted: 28 February 2022;
Published: 24 March 2022.
Edited by:
Carlo Augusto Mallio, Campus Bio-Medico University, ItalyReviewed by:
Moushira Zaki, National Research Centre, EgyptLisa Micklesfield, University of the Witwatersrand, South Africa
Copyright © 2022 Scafoglieri, Van den Broeck, Cattrysse, Bautmans and Heymsfield. This is an open-access article distributed under the terms of the Creative Commons Attribution License (CC BY). The use, distribution or reproduction in other forums is permitted, provided the original author(s) and the copyright owner(s) are credited and that the original publication in this journal is cited, in accordance with accepted academic practice. No use, distribution or reproduction is permitted which does not comply with these terms.
*Correspondence: Aldo Scafoglieri, YWxkby5zY2Fmb2dsaWVyaUB2dWIuYmU=
 Aldo Scafoglieri
 Jona Van den Broeck
 Erik Cattrysse
 Ivan Bautmans
 Steven B. Heymsfield