
95% of researchers rate our articles as excellent or good
Learn more about the work of our research integrity team to safeguard the quality of each article we publish.
Find out more
ORIGINAL RESEARCH article
Front. Nutr. , 28 March 2022
Sec. Clinical Nutrition
Volume 9 - 2022 | https://doi.org/10.3389/fnut.2022.821544
 Azam Doustmohammadian1†
 Elham Pishgar1†
 Cain C. T. Clark2Elham Sobhrakhshankhah1Mehdi Nikkhah1Amir Hossein Faraji1Nima Motamed3Mohsen Reza Mansourian1Bahareh Amirkalali1Mansooreh Maadi1Maryam Sadat Kasaii4
 Hamidreza Ebrahimi1
 Farhad Zamani1*
Dietary modifications remain the mainstay in managing nonalcoholic fatty liver disease (NAFLD). Published data on the effect of overall dietary patterns on NAFLD is scarce. The present study aims to extract the dietary patterns and investigate their association to NAFLD by gender, using structural equation modeling, among adult participants in Amol, northern Iran. In this cross-sectional study, data from 3,149 participants in the Amol cohort study (55.3% men, n = 1,741) were analyzed. Usual dietary intake was assessed by a validated 168-items semiquantitative food frequency questionnaire. We classified major dietary patterns by explanatory factor analysis (EFA) and confirmatory factor analysis (CFA). NAFLD diagnosis was based on ultrasound scanning, including increased hepatic echogenicity, abnormal appearance of hepatic arteries, and diaphragm in the absence of excessive alcohol consumption. Multivariable logistic regression and structural equation modeling (SEM) were used to explore the relationship between dietary patterns and NAFLD. Three distinct dietary patterns, including western, healthy, and traditional/mixed dietary patterns, were identified. Adult male who adhere to the western dietary pattern were more affected with NAFLD risk [Q1, Q2, Q3, Q4, odds ratio (OR) = 1, 1.16, 1.34, 1.39; 95% confidence interval (CI) = 0.83–1.61, 0.96–1.85, 0.98–1.96, ptrend = 0.04, respectively]. A full mediating effect of healthy dietary pattern, western dietary pattern, and traditional dietary pattern via dietary acid load (DAL) proxy (of dietary patterns to DAL: βstd = −0.35, p < 0.006, βstd = 0.15, p = 0.009, and βstd = 0.08, p = 0.001, respectively), on NAFLD was found through mediation analysis using SEM. A western dietary pattern comprising frequent intake of salty and sweet snacks, soft drinks, refined grains, processed meats, cooked and fried potatoes, eggs, and coffee was associated with a higher odds of NAFLD in an Iranian male population. Additionally, our findings might provide a mechanistic explanation for the association between dietary patterns and NAFLD via DAL proxy. However, further prospective studies, including assessing acid-base biomarkers, are needed.
Non-alcoholic fatty liver disease (NAFLD) is the most common liver disorder globally and is projected to become the leading cause of cirrhosis, hepatocellular carcinoma, and liver transplant over the ensuing decades (1). The global prevalence of NAFLD is estimated at 25%, rising inexorably because of significant changes in lifestyle in recent decades (1). Indeed, a meta-analysis of 237 studies in Asia with a total sample size of 13 million adults found that the overall prevalence of NAFLD was around 29.62%, regardless of the diagnostic method (2). Moreover, contemporary evidence indicates a rapid increase in a load of this disease in Iran, where, according to a meta-analysis study, the prevalence of NAFLD was 33.9% (3).
Although NAFLD is a globally prevalent and rapidly growing epidemic, there is no universally approved pharmacological treatment (4). NAFLD is caused by the interaction between genetics, environment, and human behaviors (5); however, several studies have posited that diet as an important pathogenic factor of NAFLD (6, 7). Available evidence suggests that the only effective treatment is a change in lifestyle and dietary pattern (8). Compared to traditional dietary analysis, the analysis of dietary patterns has been considered as a comprehensive approach to better reflect the potential synergistic effects of foods and nutrients of complex diets rather than focused on individual nutrients or foods (6, 9). Additionally, dietary patterns are more consistent across time and significantly affect health outcomes to a greater extent than individual nutrients (10).
On the basis of extant literature, obesity, type 2 diabetes, and metabolic syndrome are significant risk factors for developing NAFLD (5), and unhealthy dietary patterns may be associated with NAFLD risk considering their relationship with obesity and other risk factors for degenerative disease (11).
Previous studies have revealed that adherence to a western dietary pattern may increase the risk of NAFLD, whereas prudent and Mediterranean dietary patterns are more likely to be associated with a reduced risk of this disease (7, 12–14). To our knowledge, no existing studies have explained the direct and indirect associations among different dietary patterns and NAFLD on a large scale. Structural equation modeling (SEM) is considered a suitable statistical method to test the validity of dietary patterns and identify the direct and indirect relationship between potential and observation variables through combining factor analysis and path analysis (15, 16). SEM incorporates simultaneous structural equations where variables may influence each other reciprocally, directly or indirectly, through other variables as mediators. This approach provides a more in-depth insight into the assessment of NAFLD and its determinants; individual differences and errors are also considered in SEM (17). Therefore, the aim of this study is to use SEM to extract the dietary patterns among Iranian adults in Amol, northern Iran, and investigate their association with NAFLD by gender.
In this cross-sectional study, data were derived from the Amol cohort study (second phase in 2016), consisting of 6140 individuals aged 10–90 years. The sampling frame was obtained from twenty-five rural and sixteen urban local health centers in Amol, northern Iran. The city population was then classified into 16 strata based on gender and age at 10-year intervals. The sampling strategy is described in detail elsewhere (18).
The study subjects were adults aged ≥18 years, of Iranian nationality, willing to participate in the study, and lifelong residents in Amol city. In collaboration with health care centers, demographic, biochemical, anthropometric, medical, dietary, and physical activity data (documented in 2016) were collected through a face-to-face interview conducted by an expert research team.
On the basis of the study design, 5,147 adults aged ≥18 years (18–90) were included. In the second phase of the cohort study, data on 459 individuals were unavailable due to death (n = 77), non-cooperation (n = 357), or migration (n = 25). Individuals following a specific dietary or physical activity regimen (due to a particular disease, losing weight, or professional exercise), history of hepatic diseases, such as Wilson's disease, autoimmune liver disease, hemochromatosis, virus infection, and alcoholic fatty liver, malignancy, thyroid disorder, and autoimmune diseases, as well as participants with significant alcohol consumption (>30 g/d for men and >20 g/d for women) (19, 20) (n = 486), and lactating/pregnant women (n = 153), were excluded from the study. Participants with missing data, such as abdominal ultrasonography (n = 166), covariates (n = 186), food frequency questionnaire (n = 249), and individuals with extreme energy intake values (according to the criteria of Willett (21) defined as <800 and >4,000 kcal/day for men and <600 and >3,500 kcal/day for women) (n = 299), were also excluded. Finally, 3,149 subjects, consisting of 1,408 women and 1,741 men, were eligible for analysis.
The sociodemographic profile of those who were excluded from the study didnot differ significantly from that of the remaining participants. The Iran University of Medical Science (IUMS) ethical committee (No. IR.IUMS.REC.1400.162) funded and approved the study protocol, and all participants signed an informed consent form prior to the study commencement.
Blood pressure (mmHg) was measured according to the standard recommendations (22) using a sphygmomanometer cuff (Riester GmbH, Jungingen, Germany), while the participants rested for 15 min in a comfortable, seated position. Measurements were performed twice at 1 min intervals, and the mean of the two measurements was recorded as systolic and diastolic blood pressure.
Non-alcoholic fatty liver disease diagnosis was based on ultrasound scanning such as increased hepatic echogenicity, abnormal appearance of hepatic arteries and diaphragm in the absence of excessive alcohol consumption, drug-related steatosis, and viral or hereditary hepatic liver conditions (19, 20). Sagittal, longitudinal, lateral, and intercostal views of the liver parenchyma were analyzed in radiology using a low-frequency convex transducer (2–5 MHz).
Ultrasound examinations were performed by a radiologist who was completely blind to the study protocol and while the subjects were fasting.
Following 12 h of fasting, a venous blood sample was drawn from each participant to determine the fasting blood sugar (FBS) and lipid profiles. According to the protocol using the BS200 Auto analyzer (Mindray, China), all tests such as FBS, triglyceride, high-density lipoprotein (HDL), and total cholesterol, were assessed enzymatically. Serum low-density lipoprotein (LDL) cholesterol was calculated using the Friedewald equation (23).
Acon kits (Acon Laboratory, San Diego, CA92121, USA) were used to evaluate hepatitis B virus (HBV) biomarkers such as HbsAg, HBsAb, and HBcAb using the third generation Enzyme-Linked Immuno-Sorbent Assay (ELISA) method.
The Iranian National Reference Laboratory re-evaluated 10% of the blood samples, and a variation coefficient of 1.7–3.8% was considered acceptable for all laboratory values.
Anthropometric measurements were performed with participants wearing light layer of clothing and no shoes. Weight (kg) and height (cm) was measured, and body mass index was calculated. Waist circumference was measured by a well-trained researcher using a non-stretch measuring tape to the nearest 1 mm. All measurements were carried out twice using standard protocols and techniques (24).
Nutritionists gathered all the information through face-to-face interviews. A validated Iranian questionnaire of 168 semiquantitative food frequency (FFQ) items was used to assess the usual diet (20, 23). Trained interviewers asked participants to report the frequency and amount of each food consumed during the past year on a daily, weekly, or monthly basis.
Food items included in the FFQ were grouped into 27 different categories according to similarities in nutrient contents and available data (19, 25–27) for factor analysis in our study. Some food items were considered separately because their nutrient content was unique (e.g., eggs, condiments, salt, tea, coffee). Table 1 indicates the components of food groups included in dietary patterns.
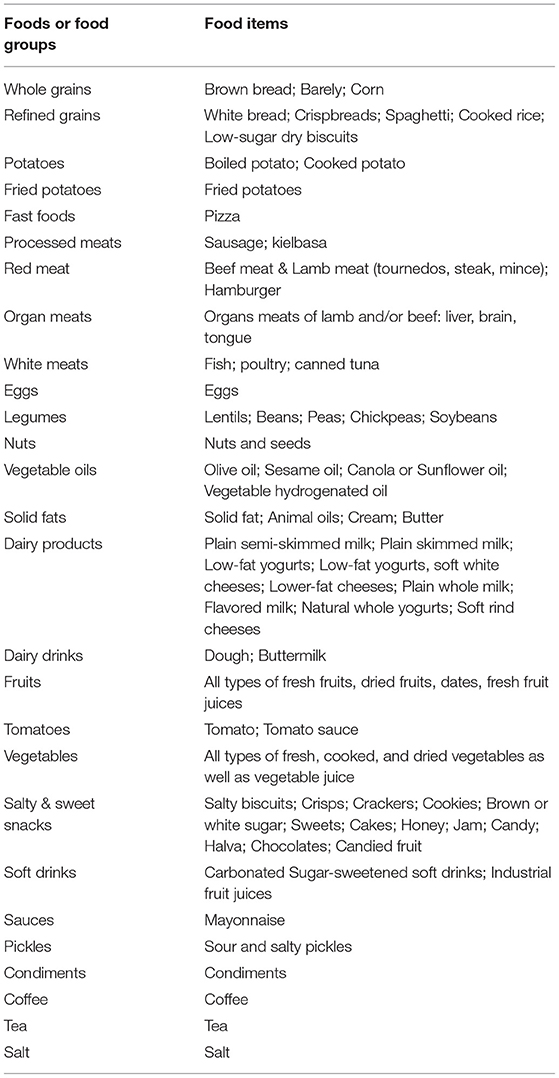
Table 1. Components of food groups included in dietary pattern.
In the present study, net acid excretion (NAE) was used to estimate dietary acid load (DAL). NAE was also estimated through the following formula:
NAE (mEq/day) = potential renal acid load (PRAL) + organic acids (OA) (28).
First, we calculated the PRAL using the suggested model by Remer as follows: PRAL (mEq/day) = [protein (g/d) × 0.49 + phosphorus (mg/d) × 0.037]–[potassium (mg/d) × 0.0211–magnesium (mg/d) × 0.0263–calcium (mg/d) × 0.013] (29). Then OA was estimated as OA (mEq/day) = [body surface area (m2) × 41 (mEq/day per 1.73 m2)/1.73 m2].
Body surface area was also calculated using the Du Bois formula (30, 31), as follows: Body Surface Area (m2) = 0.007184 × height (cm)0.725 × weight (kg)0.425.
In order to calculate dietary energy density (DED), total daily energy intake (kcal/d) was divided into total weight (g/d) of consumed food and caloric drinks (e.g., milk, dairy drinks, soft drinks, fruit juices). Non-caloric drinks, such as tea, coffee, and herbal drinks, were excluded from the DED calculation (32, 33).
Exploratory factor analysis (EFA) was applied to identify dietary patterns from 27 food groups. Sample adequacy by factor analysis was assessed using Kaiser-Meyer-Olkin (KMO) measure and Bartlett test of sphericity. Orthogonal varimax rotation was applied to decrease factor correlation and improve the interpretability of the factors. The values of KMO were 0.7 in men and 0.73 in women, respectively. Moreover, Bartlett's sphericity test was significant in both the genders (p < 0.001). The KMO and Bartlett test results showed that the diet data would be eligible for further analysis. The number of factors was determined using orthogonal rotation with the Kaiser criterion (eigenvalues >1.5) and scree plot. Scores for each extracted dietary pattern were calculated by aggregating the standardized intake of each food group associated with that pattern weighted by its respective factor loading. Food groups with factor loadings >0.20 (13, 34, 35) were included in the analysis, representing the foods that had the most robust relationship with the identified factor (see Table 2). Major dietary patterns were labeled according to the highest factor loading and interpretability. We also categorized the subjects into quartiles based on the distribution of factor scores in each stratum.
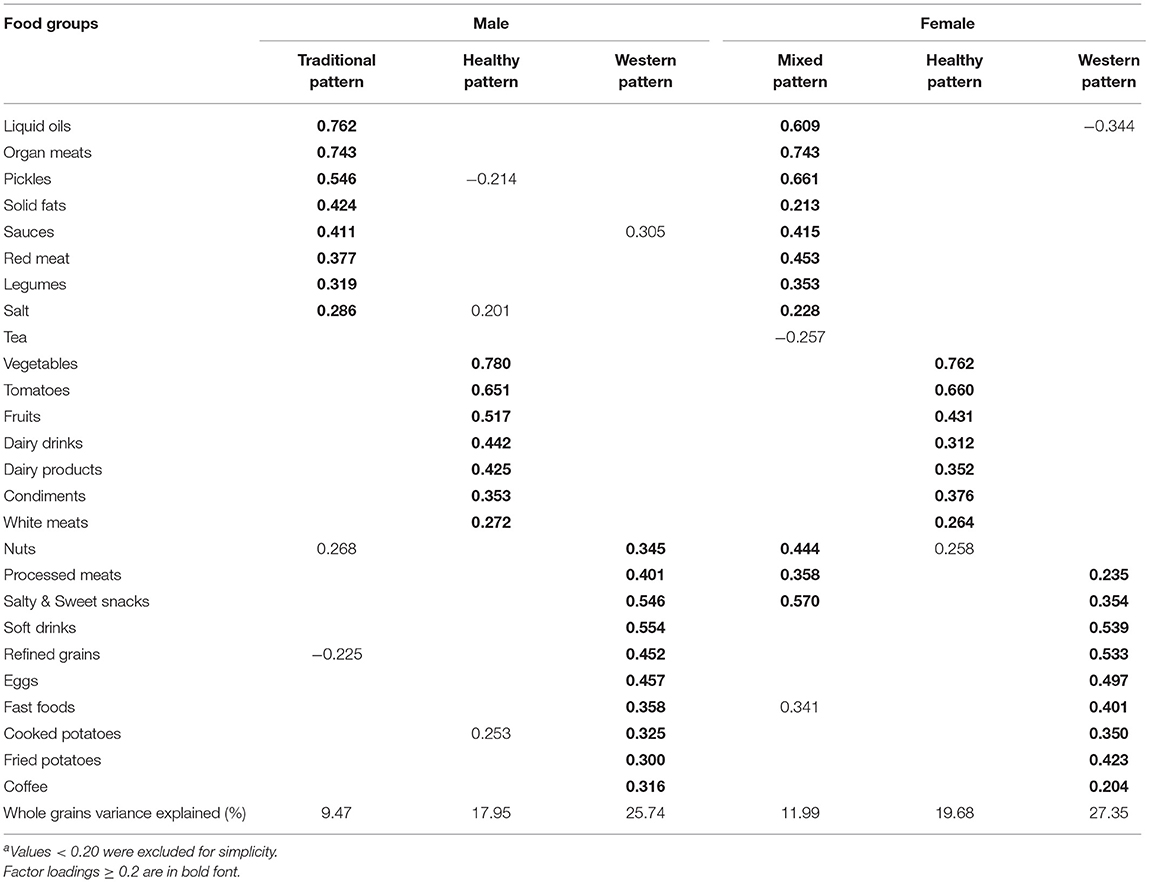
Table 2. Factor loadings for dietary patterns extracted from factor analysis by gendera.
Subjects were asked to complete a questionnaire containing information about age (number of years according to their identification documents), gender (male or female), residency area (rural or urban), viral hepatitis (hepatitis C or hepatitis B), drug use history (steatogenic or hepatotoxic), and smoking (no smoking or current/past smoking).
Data on physical activity were obtained through a validated international physical activity questionnaire (IPAQ), which was presented as metabolic equivalent minutes per minute per week (MET-min/week) (36). A trained dietitian completed all the questionnaires.
Categorical variables were presented as a number or percentage, while continuous variables were presented as mean ± standard deviation (SD). A chi-squared test was used to compare the differences in the characteristics of the participants of categorical data.The t-tests were used to compare continuous variables.
We performed a multivariable-adjusted OR and 95% CIs to find the association between dietary patterns and NAFLD. In this regard, three models of logistic regression were assessed; model 1 was adjusted for demographic factor (age), model 2 was adjusted for demographic and lifestyle factors (age, smoking, waist circumference, physical activity, energy intake, lowering serum lipid drugs, lowering serum glucose drugs, and anti-hypertensive drugs), and model 3 was further adjusted for residual areas, family history of hypertension, CVDs, and diabetes.
Major dietary patterns were extracted using Principal Component Analysis (PCA) and orthogonally underwent varimax rotation (9, 13). The number of the extracted factors was chosen based on the eigenvalue factor (>1.5), scree plot (Figure 1), and factor interpretability (37). Confirmatory factor analysis (CFA) was performed to assess the relationship between observed variables and their underlying latent factors (here, the constructs of dietary patterns). The hypothesis of direct and indirect relationships between latent and residual variables was verified by SEM.
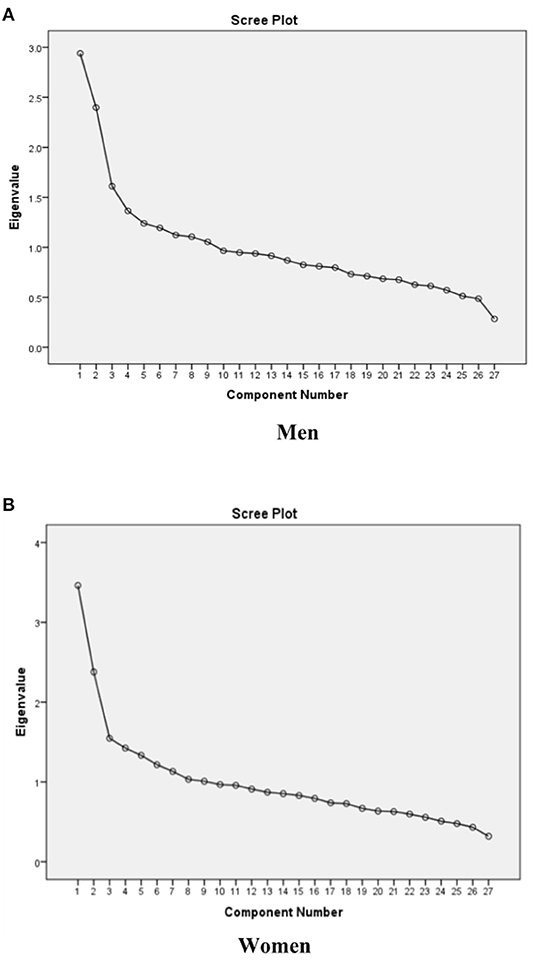
Figure 1. Scree plots of the eigenvalues to determine the appropriate number of dietary patterns among (A) men, (B) women.
Goodness-of-fit to ensure that the proposed model can adequately explain the data was assessed by several models fit indices, including; χ2, the ratio of the χ2 to degrees of freedom (CMIN/DF), goodness of fit index (GFI), Adjusted GFI (AGFI), SRMR, and the Root Mean Square Error of Approximation (RMSEA). RMSEA and SRMR ≤ 0.08, and CMIN/DF < 4.0, are considered to represent an appropriate model fit to the data. For GFI, and AGFI, which range from 0 to 1.0, values >0.90 suggest an appropriate model fit the data (38).
We used IBM SPSS (version 22.0) and Amos (version 22.0) (IBM Corp, Armonk, NY, USA) for the statistical analysis (39). All p-values were two-sided, and statistical significance was defined as a p < 0.05.
According to the gender and the presence of NAFLD, the characteristics of participants were described in Table 3. Overall, 3,149 participants (55.3% male, n = 1,782) with complete data were analyzed in the study, out of which 1,437 (44.6%) subjects were diagnosed with NAFLD. The average of all laboratory tests, anthropometric measures, energy intake, and DAL proxy (NAE), as well as the frequency of disease history, the use of lowering serum lipid and glucose agents, and family history of hypertension were significantly different in between men and women (all p < 0.001). Men, compared to women, had a higher level of triglyceride (p = 0.002), energy intake (p < 0.001), CVDs (p = 0.005), and family history of diabetes. Among all participants, 25.8% (n = 450) of men engaged in smoking behavior, which was significantly higher than women (0.6%) (p < 0.001).
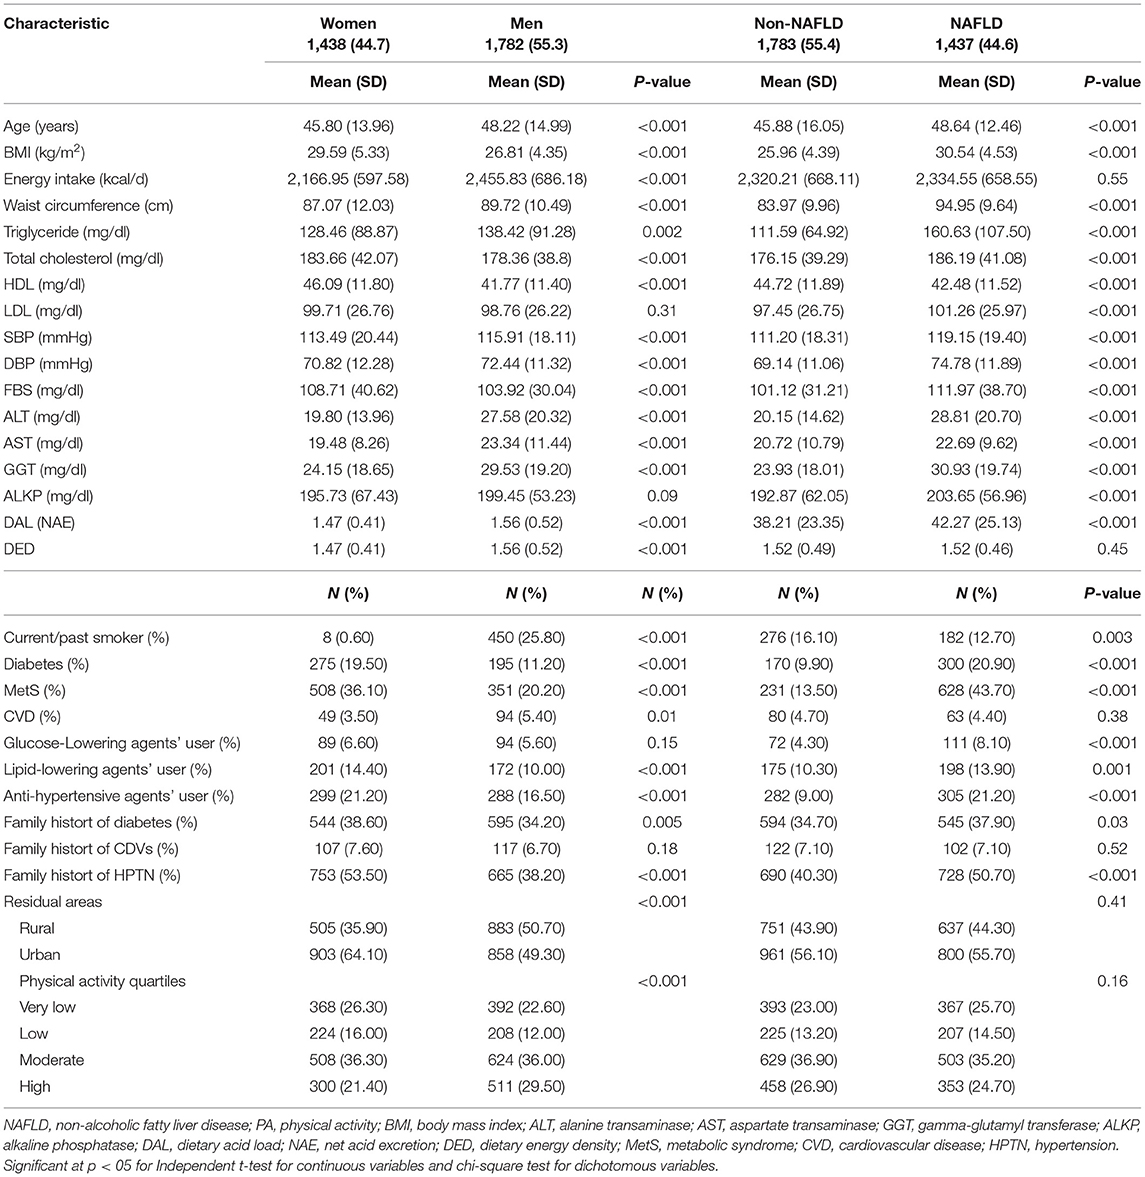
Table 3. Characteristics of the study participants: adults (n = 3,149, aged ≥18 years) at baseline, Amol Cohort Study, Iran, 2016–2017.
Non-alcoholic fatty liver disease subjects had a higher mean age, elevated liver enzymes (alanine transaminase, aspartate transaminase, gamma-glutamyl transferase, and alkaline phosphatase), lipid profiles (triglyceride, total cholesterol, HDL, and LDL), FBS, systolic and diastolic blood pressure, and DAL, as well as greater adiposity (body mass index and waist circumference), the prevalence of diabetes, hypertension, and family history of diabetes and hypertension (p < 0.001). In terms of other variables, there was no statistical difference between NAFLD and non-NAFLD subjects (p < 0.05).
Dietary energy and nutrient intakes of participants across different quartiles of major dietary patterns by gender are summarized in Supplementary Table 1. In all four quartiles of healthy dietary patterns, male participants had significantly different intakes of carbohydrate, protein, fat, cholesterol, polyunsaturated fatty acids, oleic acid, linoleic acid, eicosapentaenoic acid, docosahexaenoic acid, vitamin C, vitamin E, galactose, zinc, and Fe intake. Further, men in the different quartiles of the western pattern had significantly different intakes of carbohydrate, protein, cholesterol, monounsaturated fatty acids, linoleic acid, eicosapentaenoic acid, docosahexaenoic acid, total dietary fiber, vitamin A, glucose, fructose, sucrose, zinc, copper, and iron intake. Furthermore, a comparison of nutrient intakes in the traditional dietary pattern categories among men revealed a significant difference in terms of fat, cholesterol, saturated fatty acid, monounsaturated fatty acids, eicosapentaenoic acid, docosahexaenoic acid, vitamin A, vitamin C, vitamin E, galactose, and copper intake. An approximately similar pattern was also observed among women, which is presented in Supplementary Table 1.
The comparison of demographic, lifestyle factors, anthropometric, and biochemical assessments in the different categories of dietary patterns by sex are presented in Supplementary Table 2. The distribution of male participants in terms of DBP, FBS, and DAL was significantly different across healthy dietary pattern categories. In addition, there was a significant difference in triglyceride and DAL in the western dietary pattern categories. Further, there were significant differences in SBP, DBP, and gamma-glutamyl transferase across the traditional dietary pattern quartiles.
The female participants, on the other hand, had significantly different body mass index, waist circumference, triglyceride, HDL, SBP, and DAL distributions across the healthy dietary pattern categories. Moreover, there were no significant differences across different categories of the western dietary pattern according to participants' main characteristics. Furthermore, body mass index, waist circumference, SBP, FBS, and DAL significantly differed across the mixed dietary pattern.
Factor analysis identified three dietary patterns. Table 2 shows the factor loading matrix of dietary patterns extracted by factor analysis. Eigenvalues, the scree plot test (Figure 1), and interpretability were evaluated to explain the food items.
Among men, three dietary patterns, including “traditional dietary pattern,” “healthy dietary pattern,” and “western dietary pattern” were established. The explained variances with traditional pattern (eigenvalue = 2.94), healthy pattern (eigenvalue = 2.39), and western pattern (eigenvalue = 1.61) were 9.47, 17.95, and 25.74, respectively. Subsequently, we put food groupings in three dietary patterns with higher factor loading into the confirmatory factor analysis model (Figure 2A). Finally, the traditional dietary pattern was loaded heavily on liquid oils, organ meats, pickles, solid fats, sauces, red meats, legumes, and salt; the healthy dietary pattern was also loaded heavily on vegetables, tomatoes, fruits, dairy drinks, dairy products, condiments, and white meats, and the western dietary pattern was also loaded heavily on salty and sweet snacks, soft drinks, processed meats, refined grains, eggs, nuts, fast foods, cooked and fried potatoes, and coffee.
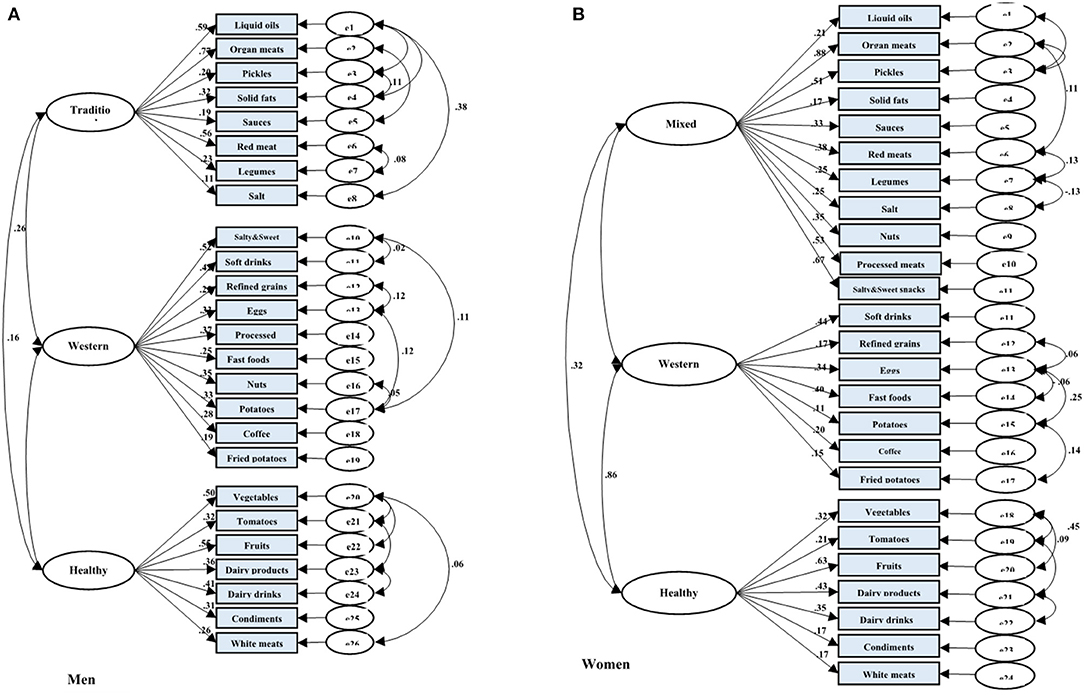
Figure 2. Results of the Confirmatory Factor Analysis (CFA) of the latent variables of dietary patterns and their indicator variables (food groups) among adults from AmolCS, Iran; (A) Men and (B) Women. Fit indices of measurement model of dietary patterns in (A) men: GFI = 0.94, AGFI = 0.92, SRMR = 0.05, RMSEA = 0.05, and in (B) women: GFI = 0.92, AGFI = 0.89, SRMR = 0.06, RMSEA = 0.05. Boxes indicate observed variables, and ellipses are latent variables in the model. All factor loadings and regression coefficients in the figure are standardized and have a p < 0.05.
Similarly, among women, three dietary patterns were detected by factor analysis. After considering the scree plot, factor loadings, and interpretability, the three dietary patterns, including “mixed dietary pattern,” “healthy dietary pattern,” and “unhealthy dietary pattern” were obtained by women. The explained variances with mixed pattern (eigenvalue = 3.46), healthy pattern (eigenvalue = 2.37), and unhealthy dietary pattern (eigenvalue = 1.54) were 11.99, 19.68, and 27.35, respectively. CFA was performed to confirm food grouping in dietary patterns (Figure 2B). Eventually, the mixed dietary pattern was loaded heavily in organ meats, pickles, nuts, processed meats, liquid oils, salty and sweet snacks, red meats, sauces, salt, legumes, and solid fats. The healthy dietary pattern was loaded heavily on vegetables, tomatoes, fruits, dairy products, dairy drinks, condiments, and white meats. Finally, the western dietary pattern was loaded heavily on soft drinks, fast foods, coffee, refined grains, fried potatoes, eggs, and cooked potatoes.
The result of CFA indicated acceptable variance explanation and good data fit of the dietary patterns (in men: GFI = 0.94, AGFI = 0.92, RMSEA = 0.05, SRMR = 0.05; in women: GFI = 0.92, AGFI = 0.89, RMSEA = 0.05, SRMR = 0.06). All components were significantly related to the constructs of dietary pattern (p < 0.001; Figures 2A,B).
Crude and multiple adjusted OR and 95% CIs from multivariable logistic regression models, were used to analyze the association between major dietary patterns and NAFLD (Table 4). The first quartile (the lowest category of adherence to dietary patterns) was used in all models as the reference category. Full adjustment for potential confounders (model 3), in men only, revealed a significant positive relationship between affected with NAFLD and adherence to the western dietary pattern (Q2, Q3, Q4, OR = 1.16, 1.34, 1.39; 95% CI = 0.83–1.61, 0.96–1.85, 0.98–1.96, ptrend = 0.04, respectively). Nonetheless, adherence to other dietary patterns was not associated with odds of NAFLD in both genders.

Table 4. Odds ratios (95% CI) for NAFLD across Quartiles (Q) of dietary pattern scores.
Figure 3 shows the primary hypothesis model of the relationship between demographic-behaviors factors, dietary patterns, and DAL with NAFLD. Standardized regression weights (β) from the SEM are shown in Figure 4 to evaluate the conceptually derived model.
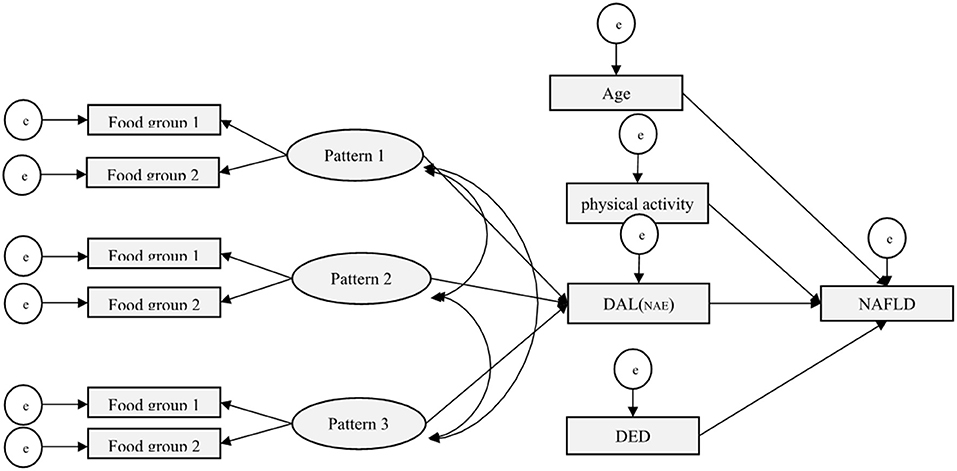
Figure 3. Conceptual SEM model for the association of demographic-behaviors factors, dietary patterns, and DAL with NAFLD.
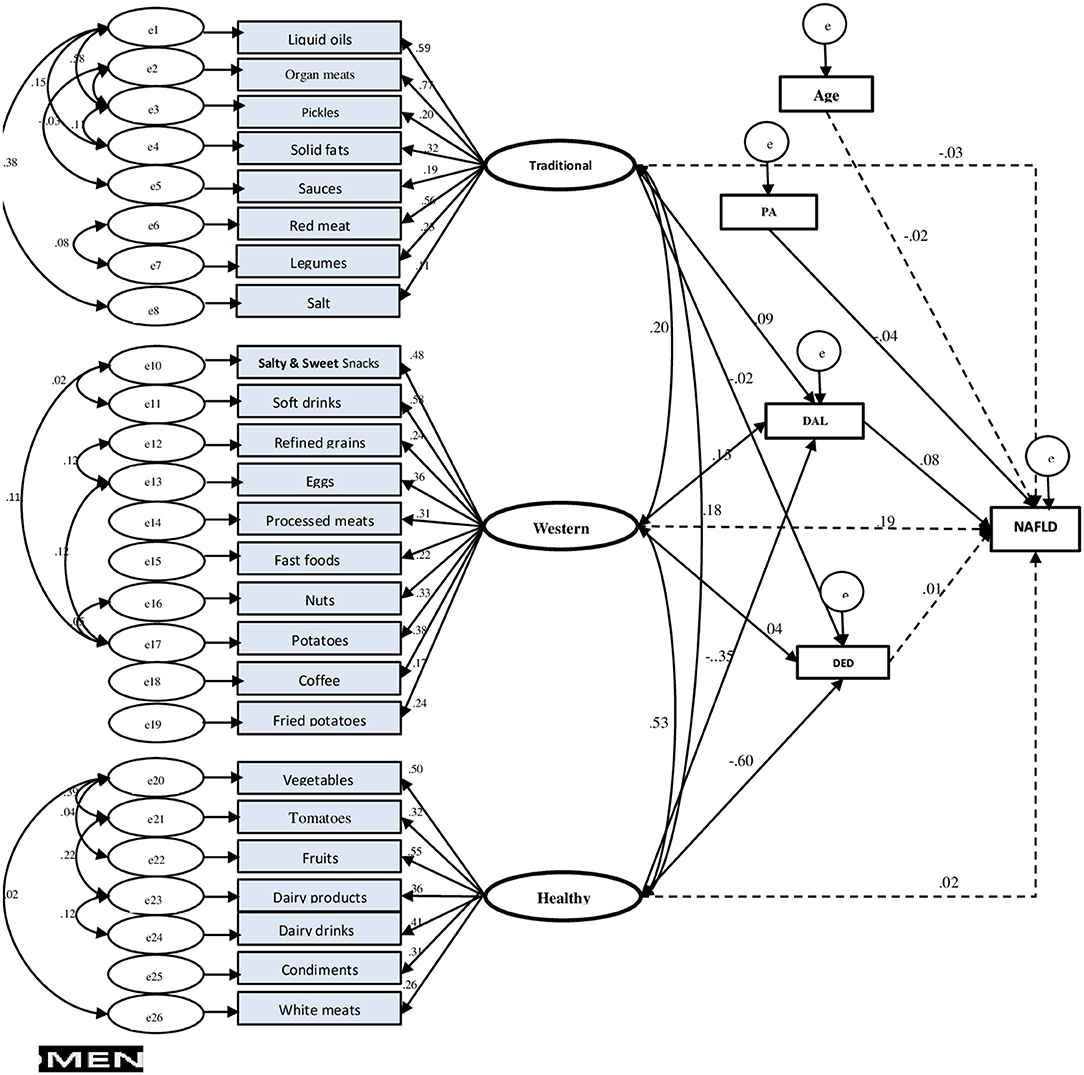
Figure 4. Final structural equation model (SEM) in men. Fit indices of SEM model: GFI = 0.94, AGFI = 0.93, SRMR = 0.04, RMSEA = 0.03. NAFLD, non-alcoholic fatty liver disease; PA, physical activity; DED, dietary energy density; DAL, dietary acid load.
Only in men, dietary patterns had an association with NAFLD, and the GFI of the final model indicated an acceptable fit (GFI = 0.94, AGFI = 0.93, SRMR = 0.04, RMSEA = 0.03). Among potential mediator variables, including general and abdominal obesity, only the final DAL model fitted the data best. Adherence to the healthy dietary pattern, indirectly through DAL (βstd = −0.35, p < 0.006), decreased the NAFLD risk, while, concurrently, it had a direct negative impact on dietary energy density (DED) (βstd = −0.60, p < 0.001). The western dietary pattern indirectly (mediated by DAL, βstd = 0.15, p = 0.009) affected NAFLD risk. Moreover, the association between the traditional dietary pattern and NAFLD was found partly mediated by DAL (of dietary pattern to DAL, βstd = 0.09, p = 0.001), thus confirming our initial hypothesis.
In the current study, three distinct dietary patterns, including western, healthy, and traditional/mixed dietary, were identified using EFA and CFA in Iranian adults.
The western dietary pattern featured male participants with soft drinks, salty and sweet snacks, processed meats, refined grains, fast foods, eggs, cooked and fried potatoes, nuts, and coffee. Although in women, the western diet consisted of fast foods, soft drinks, refined grains, cooked and fried potatoes, coffee, and eggs. The healthy dietary pattern was characterized by vegetables, tomatoes, fruits, dairy drinks, dairy products, condiments, and white meats in both the genders. Accordingly, the food components of the PCA-derived western and healthy dietary patterns loaded in the current study were consistent with those identified by previous studies across different Iranian populations (40–42).
Also, the traditional pattern was highlighted by organ meats, liquid oils, pickles, solid fats, sauces, red meats, legumes, and salt. Indeed, this dietary pattern among women additionally included unhealthy food items such as processed meats and salty and sweet snacks, which was labeled as the mixed pattern. This pattern was very similar to western dietary patterns introduced in previous studies in Iran (43–45) and other nations (16, 46). In a recent study investigating the secular trend of dietary patterns among the Iranian population, from 2006 to 2017, Aghayan et al. reported that many western-style foods had been shifted to the traditional dietary pattern (41).
Our findings demonstrated that men who adhere to the western dietary pattern were more affected with NAFLD risk. This finding was consistent with previous studies conducted by Salehi-sahlabadi et al. (13) and Zelber-Sagi et al. (47). They demonstrated that the participants in the highest level of the western dietary pattern had the highest risk of NAFLD compared to the lowest level of western dietary pattern in the adult population. In the present study, the western dietary pattern was characterized by high loading on salty-sweet snacks, soft drinks, and refined grains which provided greater amounts of carbohydrate, cholesterol, sucrose, and lower amounts of protein, monounsaturated fatty acids, eicosapentaenoic acid, docosahexaenoic acid, total dietary fiber, zinc, copper, and iron, as well as triglyceride and DAL across higher quartiles of dietary pattern. Empirical evidence has confirmed the adverse metabolic effects of western and unhealthy dietary patterns in national (48) and international (49) studies. Previous studies highlighted that the higher consumption of soft drinks (50) and refined grains (51, 52) were associated with a greater risk of NAFLD. The mechanism behind this may be related to the provision of excess calorie intake and a large amount of sugar, such as sucrose and fructose (53). An experimental study demonstrated that consumption of both sucrose and fructose increased detrimental changes in hepatic lipid content and insulin resistance (54). Furthermore, other studies have reported that adherence to the western dietary pattern may be associated with insulin resistance, post-meal fat metabolism, and progression of NAFLD (7, 55). On the other hand, van Trijp revealed that replacing whole grains with refined grains yielded favorable changes in fecal microbiota composition and functionality, as well as improved liver health parameters (52).
In our study, we did not observe an independent association of traditional/mixed and healthy dietary patterns to NAFLD both in men and women. The possible explanation for this discrepancy could be that dietary patterns vary between ethnicities, cultural groups, and gender, as well as dietary patterns, which may change over time due to personal preferences and availability of food (56).
Using SEM, we evaluated the full mediate effects via DAL proxy of three mentioned dietary patterns on NAFLD. Although an indirect pathway between dietary patterns and potential adverse health effects such as obesity has been mentioned in the literature (57), empirical studies are limited on this subject. Ghaemi et al. (58), in a cross-sectional study conducted among 1,500 individuals referred to a nutrition clinic, reported the putative role of waist circumference as a mediator in the relationship between unhealthy and healthy dietary patterns and NAFLD.
According to Baron and Kenny (59), a full mediating effect occurs when the inclusion of a mediator reduces the strength of the relationship between independent and outcome variables to zero (e.g., non-significant). In our study, adjustment for DAL proxy weakened the relationship between dietary patterns and NAFLD, confirming our hypothesis that the association between dietary patterns and NAFLD would be mediated via DAL proxy.
Compared with healthy/prudent dietary patterns, acidic diets like, Western dietary patterns commonly contain a high consumption of animal-based diet and sugar-containing beverages and a low intake of plant-based diet such as vegetable, fruit, and whole grains (7). Alferink et al. concluded that an animal-based diet was positively correlated with all DAL proxies (e.g., PRAL, NEAP, and NAE) (60). Several population-based cohort studies found that animal proteins were independently associated with a higher prevalence of NAFLD (60–62).
Possible mechanisms to interpret these results included that acidogenic diets were related to increasing magnesium excretion and may have contributed to decreased insulin sensitivity (63). On the other hand, sulfur-containing amino acids (e.g., methionine and cysteine) found in animal-based proteins can be metabolized to sulfate after oxidation. This metabolic acidosis has been associated with various metabolic disorders (64). Moreover, long-term metabolic acidosis may increase adrenal cortisol production and subsequently lead to abdominal obesity and insulin resistance (65, 66).
Although previous epidemiologic studies have reported the association between NAFLD and dietary patterns in adults (11, 13, 14, 67–70), their simultaneous effects as a model were not discussed. The current study is the first study that provides greater understanding of how this association is mediated within an integrative model, and investigates the indirect effects of dietary patterns (through DAL proxy) on NAFLD.
The other strength of the present study is using a validated semi-quantitative FFQ developed for the Iranian population, which results in a better representation of the participants' dietary habits. In addition, this study includes a large number of participants, which makes the data and results robust. However, despite the novelty, this study does have some limitations. The cross-sectional design, in fact, precludes any causal inferences from being drawn. In the current study, we investigated dietary patterns using food intake data only, while other eating behaviors such as meal and snack patterns and cooking methods in the dietary pattern analysis are also suggested.
Further, the data of dietary, physical activity, and smoking habits were collected using self-reported questionnaires, where subjects' bias could have influenced the findings. Furthermore, the effect of unmeasured confounding factors cannot be excluded entirely. Nevertheless, to the best of our knowledge, our study is the first to investigate the indirect effects (through DAL proxy) of dietary patterns on NAFLD.
A western dietary pattern comprising frequent intake of salty and sweet snacks, soft drinks, refined grains, processed meats, cooked and fried potatoes, eggs, and coffee was associated with a higher odds of NAFLD in an Iranian male population. Additionally, our findings might contribute to a mechanistic explanation for the association between dietary patterns and NAFLD via DAL proxy. However, further prospective studies with adequate consideration for acid-base biomarkers are needed.
The raw data supporting the conclusions of this article will be made available by the authors, without undue reservation.
The studies involving human participants were reviewed and approved by Iran University of Medical Sciences (IUMS) Ethical Committee (No. IR.IUMS.REC.1399.1393). The patients/participants provided their written informed consent to participate in this study.
FZ, EP, ES, MN, AF, MRM, and AD were responsible for the study concept and design. AD and NM had full access to all data and took responsibility for the integrity of the data and the accuracy of the data analysis. MM, BA, HE, and MK were involved in data collection. AD, NM, CC, and EP analyzed and interpreted the data. MK and HE wrote the initial draft of the manuscript. FZ is the guarantor and takes responsibility for the article as a whole. All authors revised the manuscript critically for important intellectual content and approved the final manuscript.
This research was conducted by a grant from the Gastrointestinal and Liver Diseases Research Center (GILDRC) and Iran University of Medical Sciences (IUMS) (Grant No. 99-2-30-19054).
The authors declare that the research was conducted in the absence of any commercial or financial relationships that could be construed as a potential conflict of interest.
All claims expressed in this article are solely those of the authors and do not necessarily represent those of their affiliated organizations, or those of the publisher, the editors and the reviewers. Any product that may be evaluated in this article, or claim that may be made by its manufacturer, is not guaranteed or endorsed by the publisher.
The Supplementary Material for this article can be found online at: https://www.frontiersin.org/articles/10.3389/fnut.2022.821544/full#supplementary-material
1. Younossi ZM, Koenig AB, Abdelatif D, Fazel Y, Henry L, Wymer M. Global epidemiology of nonalcoholic fatty liver disease—meta-analytic assessment of prevalence, incidence, and outcomes. Hepatology. (2016) 64:73–84. doi: 10.1002/hep.28431
2. Li J, Zou B, Yeo YH, Feng Y, Xie X, Lee DH, et al. Prevalence, incidence, and outcome of non-alcoholic fatty liver disease in Asia, 1999–2019: a systematic review and meta-analysis. Lancet Gastroenterol Hepatol. (2019) 4:389–98. doi: 10.1016/S2468-1253(19)30039-1
3. Moghaddasifar I, Lankarani K, Moosazadeh M, Afshari M, Ghaemi A, Aliramezany M, et al. Prevalence of non-alcoholic fatty liver disease and its related factors in Iran. Int J Organ Transplant Med. (2016) 7:149–60.
4. Zhang XJ, She ZG, Li H. Time to step-up the fight against Nafld. Hepatology. (2018) 67:2068–71. doi: 10.1002/hep.29845
5. Younossi Z, Anstee QM, Marietti M, Hardy T, Henry L, Eslam M, et al. Global burden of Nafld and nash: trends, predictions, risk factors and prevention. Nat Rev Hepatol. (2018) 15:11–20. doi: 10.1038/nrgastro.2017.109
6. Drake I, Sonestedt E, Ericson U, Wallström P, Orho-Melander M. A western dietary pattern is prospectively associated with cardio-metabolic traits and incidence of the metabolic syndrome. Br J Nutr. (2018) 119:1168–76. doi: 10.1017/S000711451800079X
7. Oddy WH, Herbison CE, Jacoby P, Ambrosini GL, O'sullivan TA, Ayonrinde OT, et al. The western dietary pattern is prospectively associated with nonalcoholic fatty liver disease in adolescence. Off J Am Coll Gastroenterol. (2013) 108:778–85. doi: 10.1038/ajg.2013.95
8. Parry SA, Hodson L. Managing Nafld in type 2 diabetes: the effect of lifestyle interventions, a narrative review. Adv Ther. (2020) 37:1381–406. doi: 10.1007/s12325-020-01281-6
9. Esmaillzadeh A, Azadbakht L, Kimiagar M. Dietary pattern analysis: a new approach to identify diet-disease relations. Iran J Nutr Sci Food Technol. (2007) 2:71–80.
10. Schulze MB, Martínez-González MA, Fung TT, Lichtenstein AH, Forouhi NG. Food based dietary patterns and chronic disease prevention. BMJ. (2018) 361:k2396. doi: 10.1136/bmj.k2396
11. Trovato FM, Martines GF, Catalano D. Addressing western dietary pattern in obesity and Nafld. Nutrire. (2018) 43:1–6. doi: 10.1186/s41110-018-0067-0
12. Hassani Zadeh S, Mansoori A, Hosseinzadeh M. Relationship between dietary patterns and non-alcoholic fatty liver disease: a systematic review and meta-analysis. J Gastroenterol Hepatol. (2021) 36:1470–8. doi: 10.1111/jgh.15363
13. Salehi-Sahlabadi A, Sadat S, Beigrezaei S, Pourmasomi M, Feizi A, Ghiasvand R, et al. Dietary patterns and risk of non-alcoholic fatty liver disease. BMC Gastroenterol. (2021) 21:41. doi: 10.1186/s12876-021-01612-z
14. Chung GE, Youn J, Kim YS, Lee JE, Yang SY, Lim JH, et al. Dietary patterns are associated with the prevalence of nonalcoholic fatty liver disease in korean adults. Nutrition. (2019) 62:32–8. doi: 10.1016/j.nut.2018.11.021
15. Marsh HW, Morin AJ, Parker PD, Kaur G. Exploratory structural equation modeling: an integration of the best features of exploratory and confirmatory factor analysis. Ann Rev Clin Psychol. (2014) 10:85–110. doi: 10.1146/annurev-clinpsy-032813-153700
16. Castro MA, Baltar VT, Marchioni DM, Fisberg RM. Examining associations between dietary patterns and metabolic Cvd risk factors: a novel use of structural equation modelling. Br J Nutr. (2016) 115:1586–97. doi: 10.1017/S0007114516000556
17. Mueller RO, Hancock GR. Structural Equation Modeling. Charlotte, NC: Routledge/Taylor & Francis Group (2019). doi: 10.4324/9781315755649-33
18. Zamani F, Sohrabi M, Alipour A, Motamed N, Saeedian FS, Pirzad R, et al. Prevalence and risk factors of cholelithiasis in Amol City, Northern Iran: a population based study. Arch Iran Med. (2014) 17:750–4.
19. Chalasani N, Younossi Z, Lavine JE, Charlton M, Cusi K, Rinella M, et al. The diagnosis and management of nonalcoholic fatty liver disease: practice guidance from the American association for the study of liver diseases. Hepatology. (2018) 67:328–57. doi: 10.1002/hep.29367
20. Sberna A, Bouillet B, Rouland A, Brindisi M, Nguyen A, Mouillot T, et al. European association for the study of the liver (Easl), European association for the study of diabetes (Easd) and European Association for the study of obesity (Easo) clinical practice recommendations for the management of non-alcoholic fatty liver disease: evaluation of their application in people with type 2 diabetes. Diabet Med. (2018) 35:368–75. doi: 10.1111/dme.13565
21. Motamed N, Faraji AH, Khonsari MR, Maadi M, Tameshkel FS, Keyvani H, et al. Fatty liver index (Fli) and prediction of new cases of non-alcoholic fatty liver disease: a population-based study of Northern Iran. Clin Nutr. (2020) 39:468–74. doi: 10.1016/j.clnu.2019.02.024
22. O'Brien E, Asmar R, Beilin L, Imai Y, Mancia G, Mengden T, et al. Practice guidelines of the European society of hypertension for clinic, ambulatory and self blood pressure measurement. J Hypertens. (2005) 23:697–701. doi: 10.1097/01.hjh.0000163132.84890.c4
23. Friedewald WT, Levy RI, Fredrickson DS. Estimation of the concentration of low-density lipoprotein cholesterol in plasma, without use of the preparative ultracentrifuge. Clin Chem. (1972) 18:499–502. doi: 10.1093/clinchem/18.6.499
24. WHO. Waist Circumference and Waist-Hip Ratio: Report of a Who Expert Consultation, Geneva, 8–11 December 2008. Geneva: World Health Organization (2018).
25. Dehghanseresht N, Jafarirad S, Alavinejad SP, Mansoori A. Association of the dietary patterns with the risk of non-alcoholic fatty liver disease among iranian population: a case-control study. Nutr J. (2020) 19:63. doi: 10.1186/s12937-020-00580-6
26. Kang SH, Cho Y, Jeong SW, Kim SU, Lee J-W, Group KNS. From nonalcoholic fatty liver disease to metabolic-associated fatty liver disease: big wave or ripple? Clin Mol Hepatol. (2021) 27:257. doi: 10.3350/cmh.2021.0067
27. Tutunchi H, Saghafi-Asl M, Asghari-Jafarabadi M, Ostadrahimi A. Association between dietary patterns and non-alcoholic fatty liver disease: results from a case-control study. Arch Iran Med. (2021) 24:35–42. doi: 10.34172/aim.2021.06
28. Remer T, Manz F. Potential renal acid load of foods and its influence on urine Ph. J Am Dietet Assoc. (1995) 95:791–7. doi: 10.1016/S0002-8223(95)00219-7
29. Remer T, Dimitriou T, Manz F. Dietary potential renal acid load and renal net acid excretion in healthy, free-living children and adolescents. Am J Clin Nutr. (2003) 77:1255–60. doi: 10.1093/ajcn/77.5.1255
30. Du Bois D. A formula to estimate the approximate surface area if height and weight be known. Nutrition. (1989) 5:303–13.
31. Verbraecken J, Van de Heyning P, De Backer W, Van Gaal L. Body surface area in normal-weight, overweight, and obese adults. A comparison study. Metabolism. (2006) 55:515–24. doi: 10.1016/j.metabol.2005.11.004
32. Kant AK, Graubard BI. energy density of diets reported by american adults: association with food group intake, nutrient intake, and body weight. Int J Obesity. (2005) 29:950–6. doi: 10.1038/sj.ijo.0802980
33. Ledikwe JH, Blanck HM, Khan LK, Serdula MK, Seymour JD, Tohill BC, et al. Dietary energy density determined by eight calculation methods in a nationally representative united states population. J Nutr. (2005) 135:273–8. doi: 10.1093/jn/135.2.273
34. Xu X, Byles JE, Shi Z, Hall JJ. Dietary patterns, dietary lead exposure and hypertension in the older Chinese population. Asia Pac J Clin Nutr. (2018) 27:451–9.
35. Agodi A, Maugeri A, Kunzova S, Sochor O, Bauerova H, Kiacova N, et al. Association of dietary patterns with metabolic syndrome: results from the kardiovize brno 2030 study. Nutrients. (2018) 10:898. doi: 10.3390/nu10070898
36. Hagströmer M, Oja P, Sjöström M. The international physical activity questionnaire (Ipaq): a study of concurrent and construct validity. Public Health Nutr. (2006) 9:755–62. doi: 10.1079/PHN2005898
37. Kim J-O, Mueller CW. Factor Analysis: Statistical Methods and Practical Issues. Beverly Hills, CA: Sage (1978). doi: 10.4135/9781412984256
38. Hooper D, Coughlan J, Mullen M. Structural equation modelling: guidelines for determining model fit. Electron J Bus Res Methods. (2008) 6: 53–60.
40. Ebrahimof S, Hosseini-Esfahani F, Mirmiran P, Fallah-Kezabi M, Azizi F. Food patterns and framingham risk score in iranian adults: tehran lipid and glucose study: 2005–2011. Metab Syndr Relat Disord. (2018) 16:64–71. doi: 10.1089/met.2017.0125
41. Aghayan M, Asghari G, Yuzbashian E, Mahdavi M, Mirmiran P, Azizi F. Secular trend in dietary patterns of iranian adults from 2006 to 2017: tehran lipid and glucose study. Nutr J. (2020) 19:110. doi: 10.1186/s12937-020-00624-x
42. Sarkhosh-Khorasani S, Mozaffari-Khosravi H, Mirzaei M, Nadjarzadeh A, Hosseinzadeh M. Empirically derived dietary patterns and obesity among iranian adults: yazd health study-tamyz and shahedieh cohort study. Food Sci Nutr. (2020) 8:2478–89. doi: 10.1002/fsn3.1538
43. Esmaillzadeh A, Azadbakht L. Major dietary patterns in relation to general obesity and central adiposity among Iranian women. J Nutr. (2008) 138:358–63. doi: 10.1093/jn/138.2.358
44. Jafarabadi M, Ghazizahedi S, Mohajeri S, Nouri M, Nematy M, Norouzy A. Comparison of dietary pattern in different provinces of Iran. Switzerl Res Park J. (2014) 102:118–28.
45. Rezazadeh A, Omidvar N, Eini-Zinab H, Ghazi-Tabatabaie M, Majdzadeh R, Ghavamzadeh S, et al. Major dietary patterns in relation to demographic and socio-economic status and food insecurity in two Iranian ethnic groups living in Urmia, Iran. Public Health Nutr. (2016) 19:3337–48. doi: 10.1017/S1368980016001634
46. Gimeno SGA, Andreoni S, Ferreira SRG, Franco LJ, Cardoso MA. Assessing food dietary intakes in Japanese-Brazilians using factor analysis. Cadernos Saude Publica. (2010) 26:2157–67. doi: 10.1590/S0102-311X2010001100017
47. Zelber-Sagi S, Nitzan-Kaluski D, Goldsmith R, Webb M, Blendis L, Halpern Z, et al. Long term nutritional intake and the risk for non-alcoholic fatty liver disease (Nafld): a population based study. J Hepatol. (2007) 47:711–7. doi: 10.1016/j.jhep.2007.06.020
48. Asadi Z, Shafiee M, Sadabadi F, Saberi-Karimian M, Darroudi S, Tayefi M, et al. Association between dietary patterns and the risk of metabolic syndrome among iranian population: a cross-sectional study. Diabet Metab Syndr Clin Res Rev. (2019) 13:858–65. doi: 10.1016/j.dsx.2018.11.059
49. Hou L, Li F, Wang Y, Ou Z, Xu D, Tan W, et al. Association between dietary patterns and coronary heart disease: a meta-analysis of prospective cohort studies. Int J Clin Exp Med. (2015) 8:781–90.
50. Vartanian LR, Schwartz MB, Brownell KD. Effects of soft drink consumption on nutrition and health: a systematic review and meta-analysis. Am J Public Health. (2007) 97:667–75. doi: 10.2105/AJPH.2005.083782
51. Georgoulis M, Kontogianni MD, Tileli N, Margariti A, Fragopoulou E, Tiniakos D, et al. The impact of cereal grain consumption on the development and severity of non-alcoholic fatty liver disease. Euro J Nutr. (2014) 53:1727–35. doi: 10.1007/s00394-014-0679-y
52. van Trijp MP, Schutte S, Esser D, Wopereis S, Hoevenaars FP, Hooiveld GJ, et al. Minor changes in the composition and function of the gut microbiota during a 12-week whole grain wheat or refined wheat intervention correlate with liver fat in overweight and obese adults. J Nutr. (2021) 151:491–502. doi: 10.1093/jn/nxaa312
53. Dekker MJ, Su Q, Baker C, Rutledge AC, Adeli K. Fructose: a highly lipogenic nutrient implicated in insulin resistance, hepatic steatosis, and the metabolic syndrome. Am J Physiol Endocrinol Metab. (2010) 299:E685–94. doi: 10.1152/ajpendo.00283.2010
54. Sigala DM, Hieronimus B, Medici V, Lee V, Nunez MV, Bremer AA, et al. Consuming sucrose-or Hfcs-sweetened beverages increases hepatic lipid and decreases insulin sensitivity in adults. J Clin Endocrinol Metab. (2021) 106:3248–64. doi: 10.1210/clinem/dgab508
55. McCarthy EM, Rinella ME. The role of diet and nutrient composition in nonalcoholic fatty liver disease. J Acad Nutr Diet. (2012) 112:401–9. doi: 10.1016/j.jada.2011.10.007
56. Dekker LH, Nicolaou M, van Dam RM, de Vries JH, de Boer EJ, Brants HA, et al. Socio-Economic status and ethnicity are independently associated with dietary patterns: the helius-dietary patterns study. Food Nutr Res. (2015) 59:26317. doi: 10.3402/fnr.v59.26317
57. Wang Y-y, Tian T, Pan D, Zhang J-X, Xie W, Wang S-k, et al. The relationship between dietary patterns and overweight and obesity among adult in jiangsu province of china: a structural equation model. BMC Public Health. (2021) 21:1225. doi: 10.1186/s12889-021-11341-3
58. Ghaemi A, Hosseini N, Osati S, Mehdi Naghizadeh M, Ehrampoush E, Honarvar B, et al. Waist circumference is a mediator of dietary pattern in non-alcoholic fatty liver disease. Sci Rep. (2018) 8:4788. doi: 10.1038/s41598-018-23192-x
59. Baron RM, Kenny DA. The moderator-mediator variable distinction in social psychological research: conceptual, strategic, and statistical considerations. J Pers Soc Psychol. (1986) 51:1173–82.
60. Alferink LJ, Kiefte-de Jong JC, Erler NS, de Knegt RJ, Hoorn EJ, Ikram MA, et al. Diet-Dependent acid load—the missing link between an animal protein–rich diet and nonalcoholic fatty liver disease? J Clin Endocrinol Metab. (2019) 104:6325–37. doi: 10.1210/jc.2018-02792
61. Noureddin M, Zelber-Sagi S, Wilkens LR, Porcel J, Boushey CJ, Le Marchand L, et al. Diet associations with nonalcoholic fatty liver disease in an ethnically diverse population: the multiethnic cohort. Hepatology. (2020) 71:1940–52. doi: 10.1002/hep.30967
62. Alferink LJ, Kiefte-de Jong JC, Erler NS, Veldt BJ, Schoufour JD, De Knegt RJ, et al. Association of dietary macronutrient composition and non-alcoholic fatty liver disease in an ageing population: the rotterdam study. Gut. (2019) 68:1088–98. doi: 10.1136/gutjnl-2017-315940
63. Rylander R, Remer T, Berkemeyer S, Vormann Jr. Acid-Base status affects renal magnesium losses in healthy, elderly persons. J Nutr. (2006) 136:23747. doi: 10.1093/jn/136.9.2374
64. Ostrowska J, Janiszewska J, Szostak-Wegierek D. Dietary acid load and cardiometabolic risk factors—a narrative review. Nutrients. (2020) 12:3419. doi: 10.3390/nu12113419
65. McCarty MF. Acid–Base balance may influence risk for insulin resistance syndrome by modulating cortisol output. Med hypoth. (2005) 64:380–4. doi: 10.1016/j.mehy.2004.01.045
66. Esche J, Shi L, Sánchez-Guijo A, Hartmann MF, Wudy SA, Remer T. Higher diet-dependent renal acid load associates with higher glucocorticoid secretion and potentially bioactive free glucocorticoids in healthy children. Kidney Int. (2016) 90:325–33. doi: 10.1016/j.kint.2016.02.033
67. Jia Q, Xia Y, Zhang Q, Wu H, Du H, Liu L, et al. Dietary patterns are associated with prevalence of fatty liver disease in adults. Eur J Clin Nutr. (2015) 69:914–21. doi: 10.1038/ejcn.2014.297
68. Kalafati I-P, Borsa D, Dimitriou M, Revenas K, Kokkinos A, Dedoussis GV. Dietary patterns and non-alcoholic fatty liver disease in a greek case–control study. Nutrition. (2019) 61:105–10. doi: 10.1016/j.nut.2018.10.032
69. Yang C-Q, Shu L, Wang S, Wang J-J, Zhou Y, Xuan Y-J, et al. Dietary patterns modulate the risk of non-alcoholic fatty liver disease in chinese adults. Nutrients. (2015) 7:4778–91. doi: 10.3390/nu7064778
Keywords: dietary pattern, non-alcoholic fatty liver disease, NAFLD, structural equation modeling, adult
Citation: Doustmohammadian A, Pishgar E, Clark CCT, Sobhrakhshankhah E, Nikkhah M, Faraji AH, Motamed N, Mansourian MR, Amirkalali B, Maadi M, Kasaii MS, Ebrahimi H and Zamani F (2022) Empirically-Derived Dietary Patterns in Relation to Non-Alcoholic Fatty Liver Diseases Among Adult Participants in Amol, Northern Iran: A Structural Equation Modeling Approach. Front. Nutr. 9:821544. doi: 10.3389/fnut.2022.821544
Received: 24 November 2021; Accepted: 23 February 2022;
Published: 28 March 2022.
Edited by:
Esmeralda Capristo, Agostino Gemelli University Polyclinic (IRCCS), ItalyReviewed by:
Fatemeh Mohammadi-Nasrabadi, National Nutrition and Food Technology Research Institute, IranCopyright © 2022 Doustmohammadian, Pishgar, Clark, Sobhrakhshankhah, Nikkhah, Faraji, Motamed, Mansourian, Amirkalali, Maadi, Kasaii, Ebrahimi and Zamani. This is an open-access article distributed under the terms of the Creative Commons Attribution License (CC BY). The use, distribution or reproduction in other forums is permitted, provided the original author(s) and the copyright owner(s) are credited and that the original publication in this journal is cited, in accordance with accepted academic practice. No use, distribution or reproduction is permitted which does not comply with these terms.
*Correspondence: Farhad Zamani, emFtYW5pLmZhcmhhZEBnbWFpbC5jb20=
†These authors have contributed equally to this work and share first authorship
Disclaimer: All claims expressed in this article are solely those of the authors and do not necessarily represent those of their affiliated organizations, or those of the publisher, the editors and the reviewers. Any product that may be evaluated in this article or claim that may be made by its manufacturer is not guaranteed or endorsed by the publisher.
Research integrity at Frontiers
Learn more about the work of our research integrity team to safeguard the quality of each article we publish.