- 1ZIEL-Institute for Food and Health, Technical University of Munich, Freising, Germany
- 2Chair of Nutritional Medicine, Else Kroener-Fresenius-Centre for Nutritional Medicine, TUM School of Life Sciences, Technical University of Munich, Freising, Germany
- 3Chair of Food Chemistry and Molecular Sensory Science, TUM School of Life Sciences, Technical University of Munich, Freising, Germany
- 4Chair of Nutrition and Immunology, Technical University of Munich, Freising, Germany
- 5Institute of Nutritional Medicine, School of Medicine, Technical University of Munich, Munich, Germany
Introduction: Previous efforts to increase fiber intake in the general population were disappointing despite growing awareness of the multiple benefits of a high fiber intake. Aim of the study was to investigate the acceptance and consumption of fiber-enriched foods.
Methods: One hundred and fifteen middle-aged healthy individuals with and without elevated waist circumference (> 102 cm in males and > 88 cm in females) were recruited and randomized to an intervention or an age- and sex-matched control group. Subjects assigned to the intervention group were invited to select fiber-enriched foods from a broad portfolio of products to increase fiber intake by 10 g/day. Control subjects could choose items from the same food basket without fiber enrichment. The primary outcome was the increase in dietary fiber intake, and secondary outcomes were changes in cardiometabolic risk factors, microbiota composition, food choices, and consumer acceptance of the fiber-enriched foods.
Results: Compared to baseline, daily fiber intake increased from 22.5 ± 8.0 to 34.0 ± 9.6 g/day after 4 weeks (p < 0.001) and to 36.0 ± 8.9 g/day after 12 weeks (p < 0.001) in the intervention group, whereas fiber intake remained unchanged in the control group. Participants rated the taste of the food products as pleasant without group differences. In both groups, the most liked foods included popular convenience foods such as pretzel breadstick, pizza salami, and pizza vegetarian. After 12 weeks of intervention, there were minor improvements in plasma lipids and parameters of glucose metabolism in both the intervention and control group compared to baseline, but no differences between the two groups. Increased fiber consumption resulted in an increased (p < 0.001) relative abundance of Tannerellaceae.
Conclusions: Fiber-enrichment of popular foods increases fiber intake in a middle-aged population with and without cardiometabolic risk and may provide a simple, novel strategy to increase fiber intake in the population.
Introduction
A high fiber and whole-grain intake is regularly recommended to the population to prevent or reduce cardiometabolic and other diet-related diseases (1–3). Especially, diets high in dietary fiber are known to have protective effects against obesity, type 2 diabetes, cardiovascular disease, and some types of cancer (4–8). These recommendations are mainly based on observational studies, but also supported by a growing number of usually small and short-term randomized controlled studies (RCTs) on the beneficial effects of fiber-rich/whole-grain foods on diet-related diseases (9, 10).
Although there is substantial heterogeneity across trials, including variability in study design, duration, types of fiber products, significant improvements of risk factors including fasting and postprandial plasma glucose and insulin, total and LDL-cholesterol were reported (11, 12). Furthermore, whole-grain/fiber-rich foods are a good source of vitamins, minerals, lignans, and other phytochemicals and, therefore, may provide additional health benefits (13). A comprehensive review of the literature recently demonstrated a 15–30% decrease in all-cause mortality and morbidity from cardiovascular disease, type 2 diabetes, and colorectal cancer when comparing a high with a low dietary fiber intake in adults (14).
Similar low dietary fiber intake has been reported from European countries and North America (15). Although the public is aware of the benefits of fiber, the majority of Americans and Europeans fall exceedingly short of meeting the recommendations from nutrition experts and societies. This gap in fiber intake was also observed in Germany. The second German National Nutrition surveys (NVS II) reported that the current median intake of dietary fiber in the adult German population is 23 g/d in females and 25 g/d in males, markedly below the recommended intake level of > 30 g/day of the German Nutrition Society (DGE) (16, 17). Therefore, an increase in fiber intake in the general population is strongly promoted by most authorities. Despite this clear message in public health activities, consumer's acceptance of fiber-rich foods is low, while the sensory perception of fiber-rich foods by consumers remains elusive. To date, there is little known about consumer preference and acceptance of fiber-enriched foods.
To address this topic, we were interested in studying if provision of popular fiber-enriched foods may increase dietary fiber intake and how consumers accept and rate various fiber-enriched food groups. We were also interested in seeing if a potentially higher fiber consumption via offering fiber-enriched foods may affect cardiometabolic health and gut microbiome composition.
Subject and Methods
Ethic Statement
The study protocol was approved by the Ethical Committee of the Faculty of Medicine of the Technical University of Munich (Approval no. 201/17S). All procedures were in agreement with the Declaration of Helsinki of 1975, as revised in 2013. Written informed consent was obtained from all participants before enrollment. The protocol was registered in the German Clinical Trials Register (DRKS00011528).
Study Participants
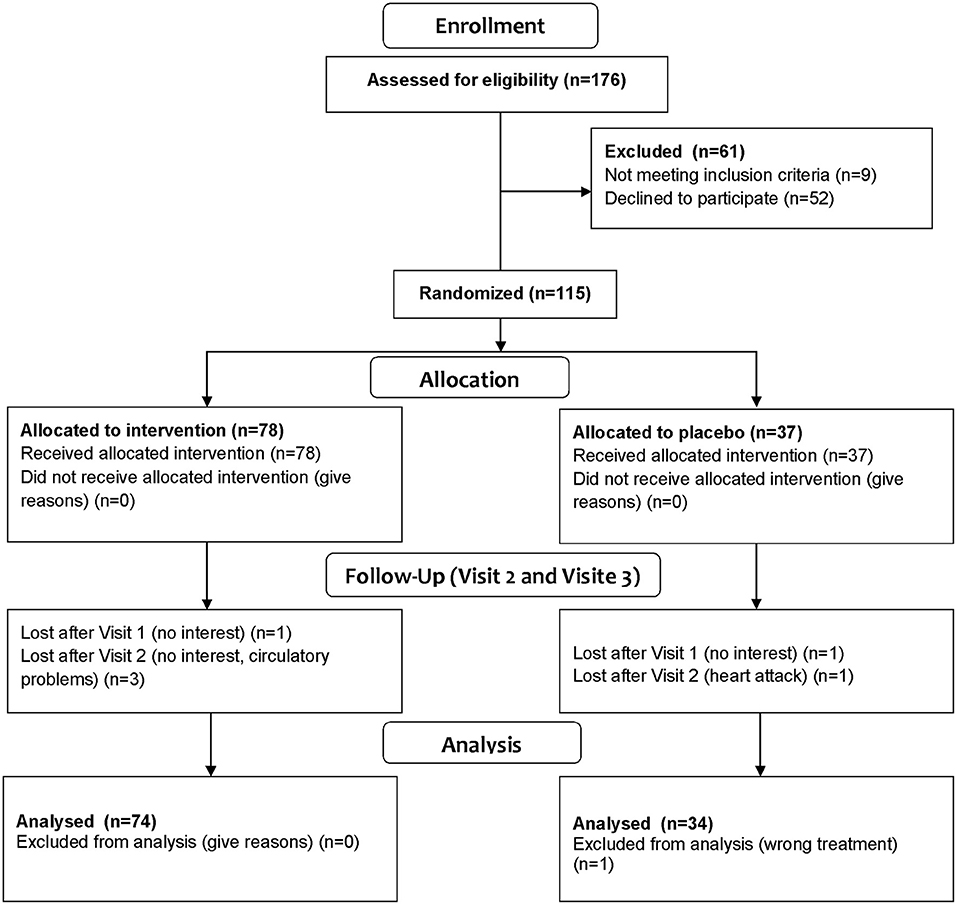
Individuals aged 40–65 years were initially recruited and phenotyped within the enable cluster of nutrition research (18), and were invited to participate in this so-called Freising Fiber Acceptance study (Figure 1) to increase fiber intake by offering fiber-enriched convenience food products from various food groups for a 12-week period under free-living conditions. The recruitment took place between August 2017 and May 2018 in Freising, Germany. The participants' eligibility was assessed with a detailed screening questionnaire. The detailed inclusion and exclusion criteria were described recently (18).
Study Design and Intervention
The study was designed as a single-blinded (participant-blinded), randomized, controlled two-arm comparison. In total, 115 eligible participants were randomly assigned to either the treatment or placebo group in a 2:1 ratio. The intervention and control group included equal proportions of normal-weight individuals and of subjects with an elevated waist circumference (>102 cm in males and >88 cm in females) indicating an elevated cardiometabolic risk. Therefore, this group was also referred to as people with elevated “cardiometabolic risk.”
The primary outcome was to assess if recommendation and free provision of fiber-enriched products can increase fiber intake. Secondary outcomes included the acceptance of fiber-enriched products and changes of cardiometabolic risk factors, such as parameters of lipid and glucose metabolism as well as of microbiome composition.
After recruitment, all participants were informed about the health value of fibers and encouraged to increase fiber intake. Participants allocated to the intervention group were invited to consume self-selected fiber-enriched foods for 12-weeks. The foods from the basket should provide 10 g of additional fiber per day. Participants allocated to the control group could select the identical food types without fiber enrichment from a portfolio of similar foods (Supplementary Table 1). Enrichment of food was mainly done with wheat fiber belonging to the insoluble dietary fiber and oat fiber which is a soluble fiber. The provided foods made up approximately one third of total caloric intake, and participants in both groups were instructed to stick to their usual diet. Participants were invited to come to the study center once a week to pick up the self-selected food items at defined amounts. All assessments and examinations during the three study visits (baseline, week 4, 12) are shown in Figure 2.
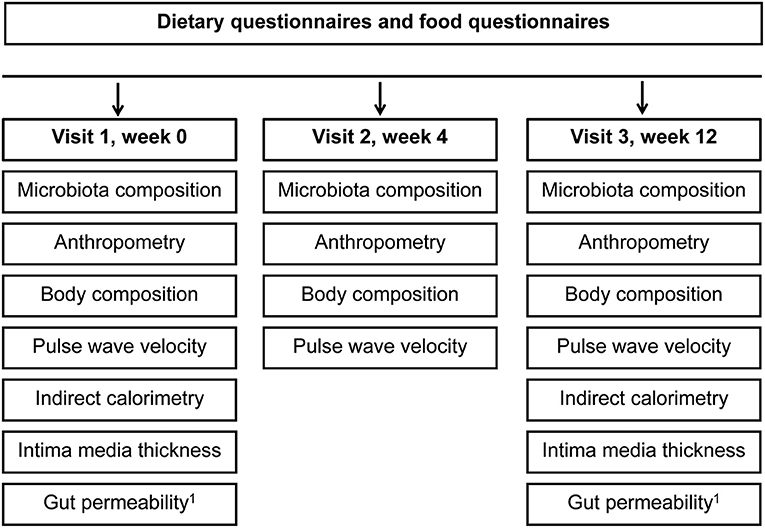
Figure 2. Timeline and examinations. 1Gut permeability was measured in a subgroup of participants (n = 35).
Dietary Protocols
The study participants were instructed to record their food consumption three times for 1 week each (before, after 3 weeks, after 11 weeks of intervention) using a specific diary. The energy content and macronutrient composition of the diets were calculated using the OptiDiet Plus software (Version 5.1.2.046, GOE mbH, Linden, Germany). In addition, participants were asked to document the intake of the provided complimentary foods (with or without fiber enrichment) daily for the whole study period.
Questionnaires
Participants received a questionnaire on the acceptance of the provided fiber-enriched and normal foods. The taste of the study products was rated with a 5-point numeric scale from 1 (“I don't like it at all”) to 5 (“I like it very much”). In addition, information on gastrointestinal symptoms was collected throughout the whole study. For this purpose, participants received a specific questionnaire at three time points: at baseline, after 4 weeks, and after 12 weeks. The questionnaire included six questions on GI symptoms: “Did you feel bloated during the past week?,” “Did you have flatulence problems during the past week?,” “Did you suffer from constipation during the past week?,” “Did you suffer from diarrhea during the past week?,” “Did you have a very loose stool during the past week?,” and “Did you have a very hard stool during the past week?” The rating was done using a 7-point numeric scale from 0 (not at all) to 6 (intense symptoms).
Anthropometry and Body Composition
All anthropometric (height, weight, waist circumference) and clinical parameters were measured in the morning following an overnight fast using established standard operation procedures (SOPs). Body composition was measured using the Seca mBCA 515 device (Seca GmbH & Co KG, Hamburg, Germany).
Cardiovascular Functions
Pulse wave analysis was performed using a specific analyzer (TensioMed, Budapest, Hungary). For quality assessment, measurements with a standard deviation ≥0.7 were repeated according to the instructions of the company. Moreover, intima-media thickness (IMT) was determined employing an ultrasound ACUSON X700 device (Siemens Healthcare GmbH, Erlangen, Germany) with a high-frequency VF16-5 probe. The measurement was performed with the subject in a supine position. IMT was determined during the peak-systole according to an ECG reading. Images were taken, centered about 10 mm below the carotid artery bulb.
Blood Sampling
Blood samples were collected in the fasting state. Lipid parameters (total cholesterol, LDL cholesterol, HDL cholesterol, triglycerides), hsCRP, and insulin were analyzed in plasma by SynLab (Munich, Germany). Blood glucose concentrations were determined using a HemoCue Glucose 201+ device (plasma-calibrated, HITADO GmbH, Möhnesee, Germany). Insulin sensitivity was estimated according to the Homeostatic Model Assessment-Insulin Resistance (HOMA-IR) formula (19). Lipopolysaccharide binding protein and zonulin were assayed in plasma using commercially available ELISAs (LBP, R&D, Wiesbaden, Germany and Immundiagnostik AG, Bensheim, Germany, respectively).
Gut Permeability
In addition to measurement of the gut permeability marker zonulin in plasma, gut barrier function was assessed in a subgroup of 35 participants from both groups by a sugar absorption test as described by Norman et al. (20). Participants received a sugar test solution following an overnight fast and after collecting a baseline urine sample. The 100 mL sugar test solution contained mannitol (5 g), lactulose (10 g), and sucrose (20 g), and 6 tablets of sucralose (333.3 mg/tablet). The subjects were instructed to collect their whole urine at time-defined intervals (0–5 h, 5–26 h). Urine was sampled in containers with sodium acid (0.002 g) as a preservative and stored at −20°C until analysis.
Quantitation of Carbohydrates and Sugar Alcohols
Mannitol, lactulose, sucrose, and sucralose in urine samples were quantified through high-performance ion chromatography (HPIC), as described earlier with slight modifications (20). The internal standard solution (50 μL), containing turanose (Sigma Aldrich, Steinheim, Germany) and meso-erythritol (VWR, Darmstadt, Germany), was added to an aliquot of the urine sample (500 μL). After adding a solution of 5-sulfosalicylic acid (20% in water, 50 μL, Sigma Aldrich, Steinheim, Germany) and the mixed bed ion-exchange resin to remove proteins and salts, respectively, the aliquots were incubated, centrifuged, and diluted for further analysis. Subsequently, 10 μL of the diluted urine samples were injected on a 4 × 250 mm CarboPac PA1 anion-exchange column with 4 × 50 mm guard column of the same type (Thermo Fisher Scientific, Schwerte, Germany) at an oven temperature of 30°C and eluted using the mobile phases A (water), B (150 mmol/L sodium hydroxide) and C (150 mmol/L sodium hydroxide, 500 mmol/L sodium acetate) by applying following gradient at a flow rate of 1 mL/min: 0 min 14% B and 1% C, 13 min 14% B and 1% C, 40 min 100% B, 42 min 100% B, 43 min 14% B and 1% C, 60 min 14% B and 1% C. The compounds were detected by means of pulsed amperometric detection (PAD) on a conventional gold working electrode using a quadruple waveform. Carbohydrates were quantified via internal standards. Data acquisition and data evaluation were carried out using the Chromeleon Software 7.2 (Thermo Fisher Scientific, Schwerte, Germany).
Microbiota Analysis
Three fecal samples were collected from each participant, at baseline and at the 4-week and 12-week visit. Samples were sequenced by targeting the V3V4 region of the 16S rRNA gene using the paired-end Illumina MiSeq sequencing technology. A detailed description of sample preparation and sequencing was published recently (21). Sequences with low read counts (<6,000 reads per sample) were resequenced. Demultiplexed FASTQ files were preprocessed using the IMNGS pipeline to generate operative taxonomic units (OTUs) with a 97% clustering using UPARSE v8.1.1861 (22) as well as with the DADA2 pipeline to generate ASVs with a 99% clustering (23). Taxonomic classification was performed by using the SILVA database (24). OTUs with a relative abundance <0.25% across all samples were removed to prevent the analysis of spurious OTUs (25). Amplicon sequence variants (ASVs) were considered for the final analysis of the 16S rRNA gene sequencing data.
Statistical Analysis
According to the initial power calculation and based on 80 participants in the intervention and 40 in the control group, the study had a 99.7% power to detect a 10 g difference in fiber intake using a significance level of 0.05 and assuming a within-group standard deviation of 10 g. The assumed standard deviation was based on data from the Nationale Verzehrsstudie II and follow-up surveys (17). Considering the healthy participants and those with elevated waist circumference separately, the study had a power of 86% to detect a 10 g difference in each subgroup, using a Bonferroni correction for multiple comparisons.
Data were analyzed in the R programming environment. Results were presented as mean ± SD, and p < 0.05 were regarded as statistically significant. In the first step, mean differences were assessed between visits separately in both groups (control group and intervention group) by using a linear mixed model with random intercept based on the varying influence of the different study participants. For this lmer function from the package lme4 was used. Tukey's Test was used as a post-hoc analysis to compare means of the different visits. Moreover, log-transformation were done to fit the assumption of normal distribution (triglycerideds, HDL-cholesterol, fasting insulin, fasting glucose, HOMA-IR, fiber). In the second step, control group and intervention group were compared at each time point (baseline, after 4 weeks, after 12 weeks of intervention) according to distribution by using t-test or Wilcoxon- signed ranked test. Finally, to assess the effect of time (different visits) and intervention (control group or intervention group) both factors were included in a linear mixed model with random intercept based on the varying influence of the different study participants. Regarding the analysis of microbiota composition, details were published recently (25).
Functional Analysis
The function prediction based on 16S rRNA gene sequencing was performed by using PICRUSt2 (26). To determine differences between the groups, the R package ALEDx2 was used. Predicted abundances were centered-log transformed and significance was analyzed by using a generalized linear regression. Pairwise significance between visits, within one intervention group (Intervention or placebo), was assigned if p < 0.05 and effect size >0.2. Centered-log transformed values of the selected pathways were correlated with ASVs with a relative abundance >0.1 and a prevalence >10%. ASVs with a negative or positive correlation in at least one pairwise comparison > 0.5 and a significance p < 0.05 were selected to generating the heatmap.
Results
Baseline Characteristics of the Participants
One hundred and eight healthy individuals between the age of 40 and 65 years completed the study (Figure 1). Forty eight were males, and 60 were females. Seventy four subjects were randomized to the intervention group, 34 to the control group.
Baseline characteristics did not differ significantly between the intervention and control group and when comparing control group and intervention group on each visit (Table 1). All anthropometric parameters did not change during the 12-week study period in the intervention group. Considering only participants with cardiometabolic risk in the intervention group (Supplementary Table 2), participants showed a decrease in waist circumference (p < 0.01) and fat mass (p = 0.03). In contrast, in the control group, waist circumference (p < 0.01) and BMI (p = 0.04) increased slightly during 12 weeks (Supplementary Table 5).
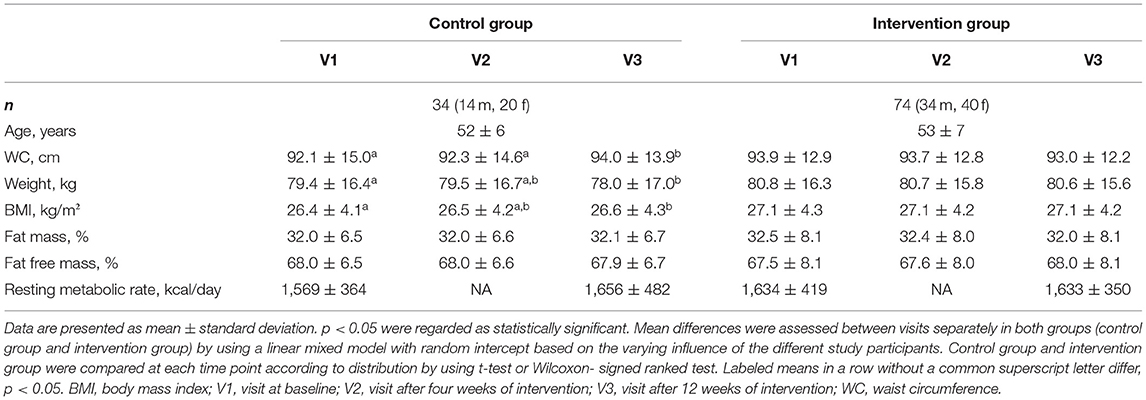
Table 1. Baseline and follow-up characteristics of the participants and changes of anthropometric parameters during the study.
Effect of the Intervention on Fiber Intake
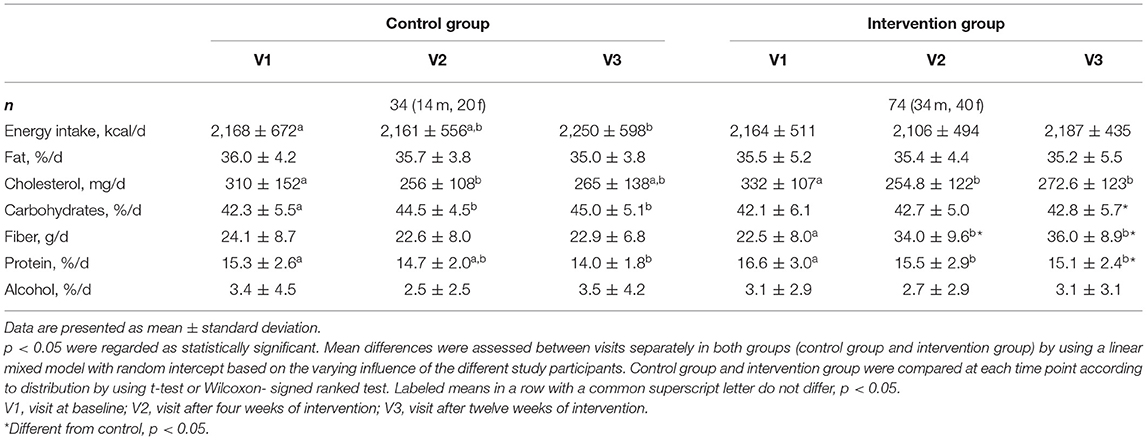
The intervention group was instructed to include fiber-enriched foods of their choice in their normal diet (two items or portions per day), while the control group received a similar free selection of foods, but without fiber enrichment. Table 2 shows that the intervention group increased fiber intake significantly from 22.5 ± 8.0 to 34.0 ± 9.6 g/day after 4 weeks (p < 0.001) and to 36.0 ± 8.9 g/day after 12 weeks (p < 0.001), representing a fiber increase by 11 and 13 g/day, respectively. Compared to the control group, the intervention group increased their fiber intake significantly (p < 0.001).
The relative contribution of the various fiber-enriched food groups by sex is shown in Figure 3. Women reported a higher intake of fiber-enriched drinks compared to men (p = 0.02). Interestingly, the other products (dessert, potato products, meat/meat substitutes, soup, pasta products, cereals, pizza, and bread and bakery products) were almost equally consumed. Comparing the intervention and control group, pasta products (p = 0.032) and fiber drinks (p = 0.04) were significantly more frequently chosen in the intervention group.
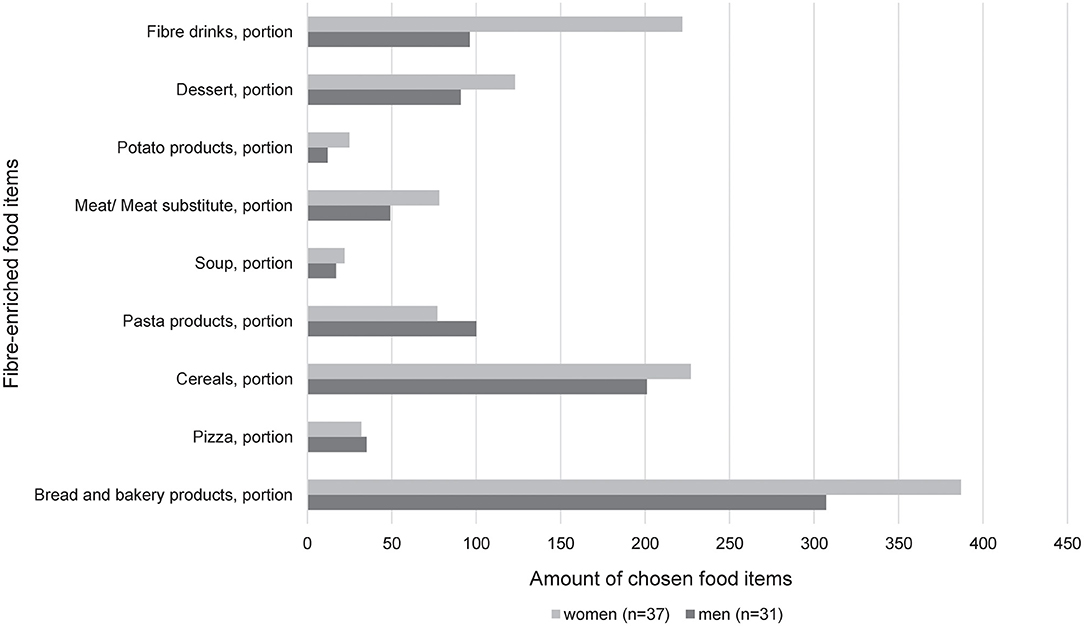
Figure 3. Relative contribution of the various fiber-enriched food groups by sex in the intervention group [women (n = 37); men (n = 31)]. The consumption of the different products was obtained 1 week before visit 2, respectively, visit 3. The portion size of each food item is listed in Supplementary Table 1.
Table 2 demonstrates the full dietary intake in both groups at baseline and after 4 and 12 weeks, respectively. Participants receiving fiber-enriched foods had no significant changes regarding total energy intake, fat, carbohydrate, and alcohol intake, whereas the intake of cholesterol (p < 0.001) and protein (p < 0.001) decreased within 12 weeks of intervention. As expected, the fiber intake of the participants in the control group remained unchanged during the 12 weeks; only the intake of energy (p = 0.04) and carbohydrates (p < 0.01) was modestly but significantly increased after the 12-week study period, whereas protein intake decreased (p < 0.01). Significant differences regarding the intake of carbohydrates (p = 0.01) and protein (p = 0.02) were found between the intervention and control group (Table 2). No distinction was made with regard to the physicochemical properties, since different fibers have overlapping properties.
Impact of the Intervention on Cardiometabolic Risk Factors
The course of metabolic parameters from baseline to week 12 in both groups is presented in Table 3. Comparison between the three-time points in the intervention group revealed significant decreases in total cholesterol (p < 0.001), triglycerides (p = 0.03), LDL-cholesterol (p < 0.01), and fasting plasma insulin (p = 0.04). Slightly more pronounced effects were observed in the subgroup of subjects with increased waist circumference risk (Supplementary Tables 3, 4). In contrast, in the subgroup without cardiometabolic risk, only minor changes were seen (Supplementary Tables 6, 7). Compared to the control group, only heart rate was significantly lower in participants with cardiometabolic risk undergoing the intervention (all p < 0.05) (Supplementary Table 4). Overall, rather modest changes were found within and between groups. Intention-to-treat-analysis did not change the results.
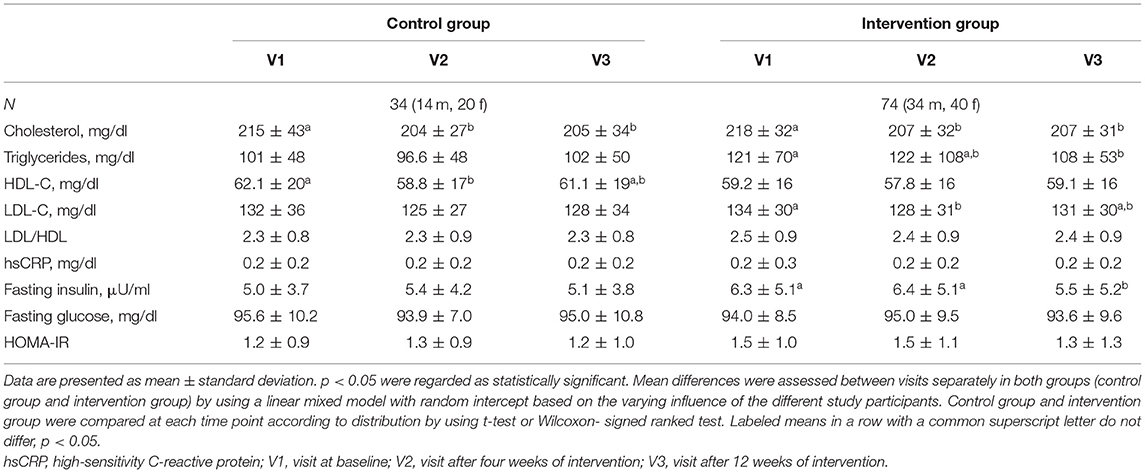
Table 3. Changes of selected metabolic parameters in the intervention and control group during the 12-week study period.
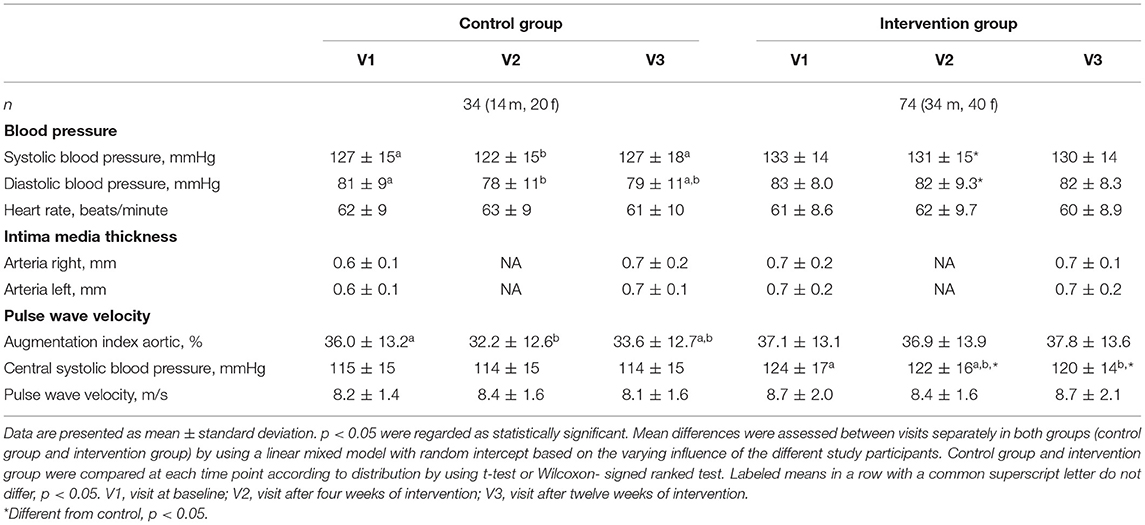
Table 4 shows the changes in cardiovascular functional parameter during the 12-week study period. There was a “borderline” significant difference at baseline between the two groups for systolic blood pressure and central systolic blood pressure. During the 12-week intervention period, there were no relevant changes in these parameters with the exception of central systolic blood pressure in the intervention group (from 124 ± 17 mmHg to 120 ± 14 mmHg, p = 0.02).
Effect of Increased Fiber Intake on the Microbiota
The microbial composition was dominated by the two main phyla Firmicutes and Bacteroidetes (Figure 4A). Unsupervised clustering resulted in three distinct groups, which showed a significant difference in the relative abundance of Bacteroides (C2), Prevotella and Ruminocccus (C1), which are known to be associated with diet (27). Individuals with the C2 cluster showed a reduced amount of fiber intake (mean 25.8 ± 8.79 g/day) compared to C1 (mean 28.7 ± 10.77 g/day) and C3 (mean 28.9 ± 9.82 g/day). The proportion of individuals at cardiometabolic risk was higher in C2, which resulted again in a reduced alpha-diversity. Overall differences in the bacterial composition of the gut can be explained by variables related to physiology (3.1%), disease risk (1.5%), and nutrition (1.4%) and resulted in an overall effect modifier of 8.8% (Figure 4D).
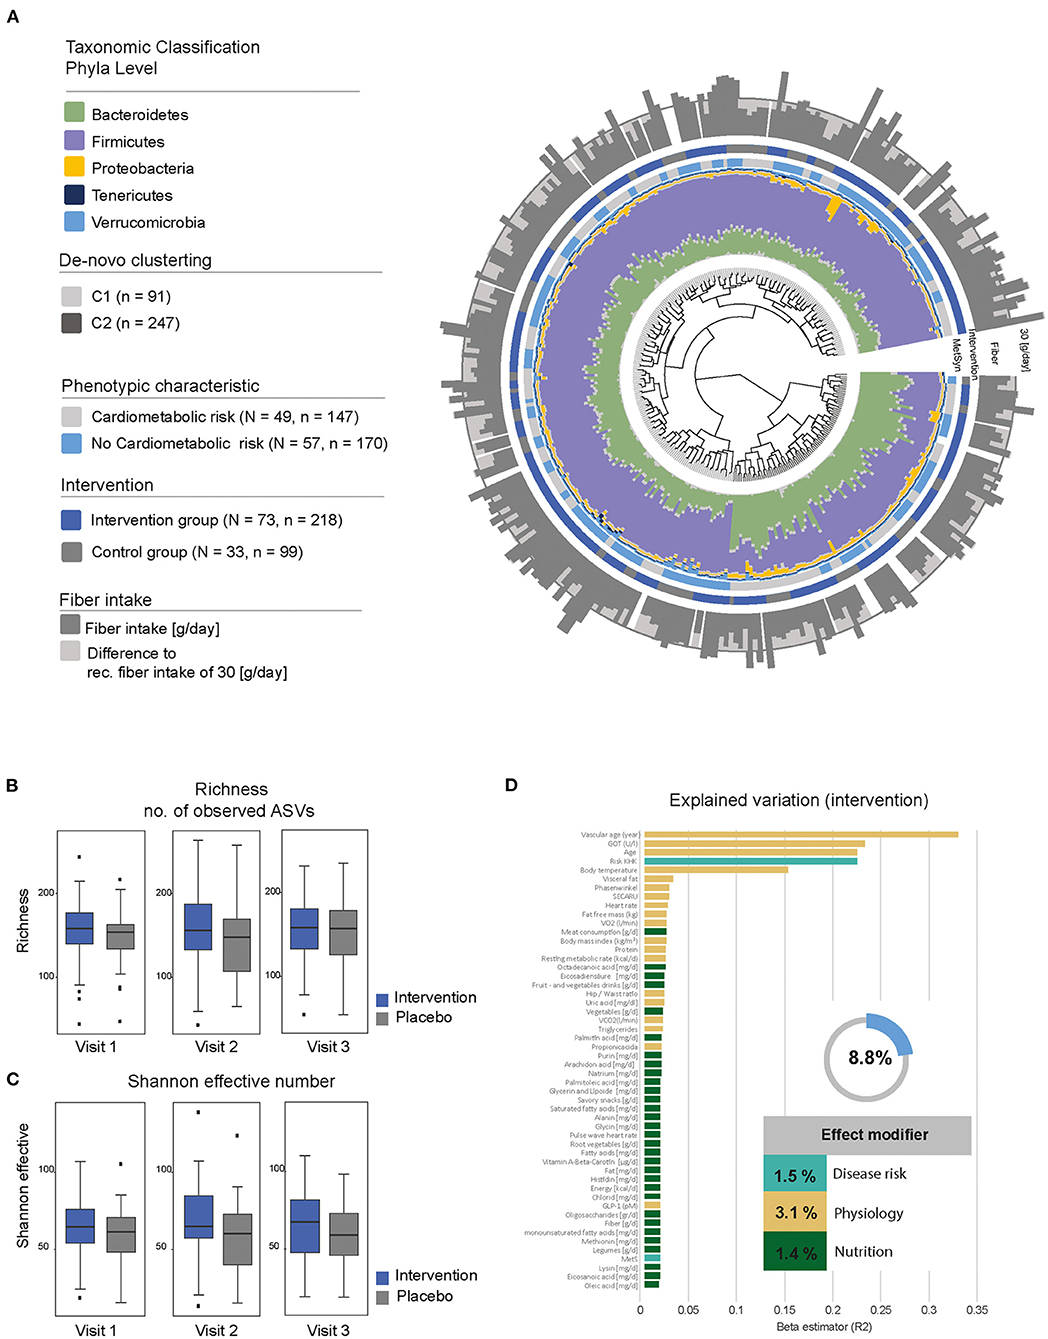
Figure 4. Description of the gut microbial composition. (A) Beta-diversity of the fecal microbiota in enable. The dendrogram shows similarities between microbiota profiles based on generalized UniFrac distances between subjects represented by individual branches. Unsupervised hierarchical clustering identified two main clusters of individuals (gray-scale next to branches). Individual taxonomic composition at the phylum level is shown as stacked bar plots around the dendrogram. The first ring indicates the presence of our criteria for “cardiometabolic risk” (gray, cardiometabolic risk; blue, no cardiometabolic risk); the second ring indicates the type of intervention (blue, fiber-enriched foods; gray, usual foods). Outer stacked barplot shows the fiber intake as well as the recommended threshold of 30 g/day (gray line). (B,C) Alpha-diversity stratified according to visit and intervention (blue, intervention; gray, control). Upper boxplots are showing richness; lower boxplots are showing bacterial diversity (Shannon effective number). (D) Explained variations in fecal microbiota composition by covariates. All variables shown had a significant influence (P ≤ 0.05) displayed as proportions of explained variations based on R2 calculated by multivariate analysis of Bray-Curtis dissimilarity. The top 52 variables are shown.
The taxonomic classification based on phyla level between individuals with and without fiber intervention showed a heterogeneous distribution with no significant differences. Nevertheless, there was an increased relative abundance in Bacteroidetes in individuals with elevated waist circumference (35.8 vs. 30.2%) and a decreased abundance in Firmicutes (58.4 vs. 63.0%). These differences were also seen in the number of observed amplicon sequence variants (ASVs) with a decreased richness (302 elevated waist vs. 331 normal; p = 0.0001) as well as Shannon effective counts (74 elevated waist vs. 88 normal; p = 8.022e-07) (Figures 4B,C). An increased fiber consumption resulted in an increased relative abundance of Tannerellaceae observed between visit 1 and visit 2 as well as between visit 1 and visit 3 (Figure 5). After the third visit, a reduced relative abundance in Alistipes was seen, whereas an increased abundance in Alistipes was associated with inflammatory diseases and non-alcoholic fatty liver disease (NAFLD) (28). Additionally, some taxa also showed differences between visits, when individuals who received fiber-enriched foods were compared with individuals who received usual foods (Supplementary Figure 1).
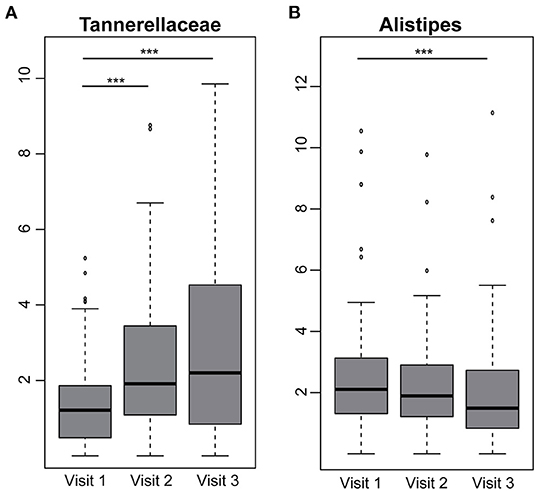
Figure 5. Differences between visits in individuals receiving fiber-enriched foods. Boxplots are showing the relative abundance values of the family (A) Tannerellaceae and the genus (B) Alistipes. Significance is shown between groups (Benjamin Hochberg adj. p < 0.05), ***p < 0.001.
Metabolic Pathways Associated Increased Fiber Intake
Predicted functional pathways derived by 16S rRNA gene sequences showed that different pathways seemed to vary between visits comparing participants who underwent the intervention and those who did not get a fiber enriched diet. Overall, 13 pathways were significantly different between visits in the intervention group. Out of these, 9 pathways were also found to be different in the placebo group. The remaining four pathways significantly correlated with 7 ASVs (Figure 6A). PWY7332—a biosynthesis pathway associated with N-acetylglucosamine—also showed a steady significant increase in abundance over time (Figure 6B). Its correlation with Blautia changed from a negative to a positive correlation. The increased abundance of Acetylglucosamine biosynthesis was accompanied by the appearance of a negative correlation with Agathobacter. Peptidoglycan biosynthesis (PWY.6470) correlated positively with the genera Agathobacter and Ruminococcus, but changed over time to a negative association (Figure 6C). Overall, the abundance of this pathway increased over time, starting at a very low baseline abundance but increased after the intervention had started. The two tetrapyrrole biosynthesis pathways (PWY-5188, PWY-5189) increased in their abundance between the first and second visit and correlated negatively with the two genera Bilophila and Bacteroides (Figures 6D,E). Additionally, predicted functional pathways which were significantly different between visits in the placebo group were depicted in Supplementary Figure 2.
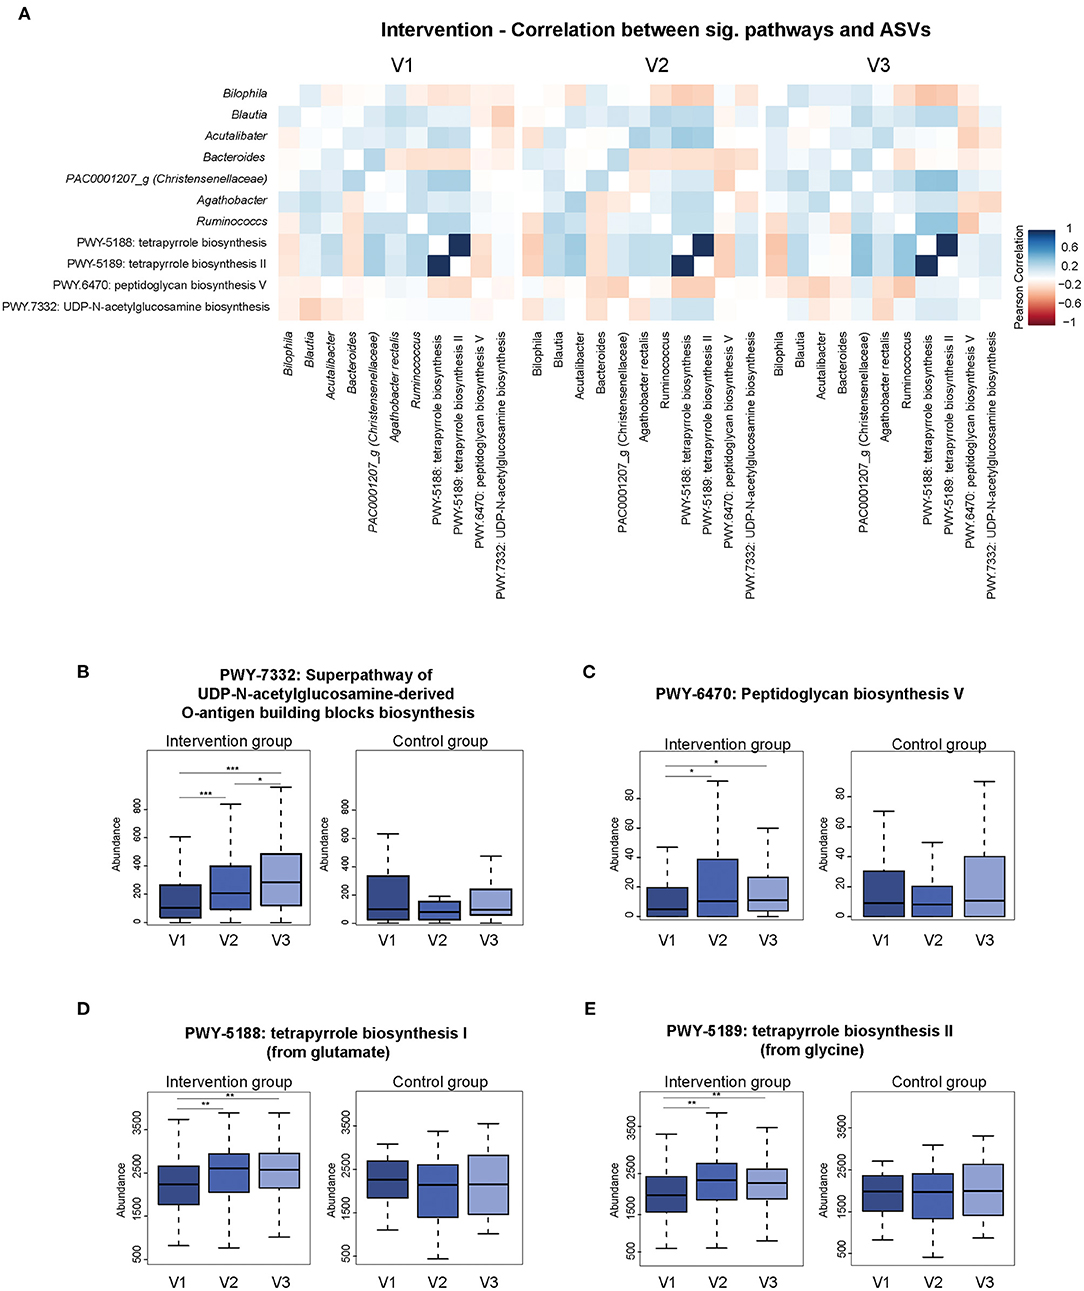
Figure 6. The Association of predicted functional pathways and ASVs. (A) Predicted functional pathways (PiCRUST2) which are significantly different between visits in the intervention group. Heatmaps show significant correlation between selected pathways (Pearson's R ≥ 0.3; Pearsons's R ≤ −0.3) and ASVs. Data was stratified according to visits. Strong negative correlations are shown in red and positive correlation are shown in blue. (B–E) Panels show significant differences in abundances of predicted pathways between visits within the intervention group compared to the placebo group. *p < 0.05, **p < 0.01, ***p < 0.001.
Fiber Intake and Gut Permeability
In a subgroup of 35 participants, gut permeability was measured before and after 12 weeks of intervention. Supplementary Table 8 summarizes the results obtained using different approaches for the measurement of gut permeability. The paracellular gut permeability markers, lipopolysaccharide-binding protein (LBP), zonulin and lactulose, was comparable at baseline and did not change after 12 weeks in both groups. Furthermore, the percentage urine recovery of sucrose, mannitol, and sucralose remained unchanged before and after treatment.
Rating of the Fiber-Enriched Products
Overall, most participants rated the taste of the study products as enjoyable. In both groups, the most liked foods included pretzel breadstick, pizza salami, and pizza vegetarian (Table 5). Participants in the control group rated bread and bread roll better than participants in the intervention group, and the fiber-enriched bread roll was the least favorite product in the portfolio for the intervention group. The least favorite food item in both groups was meatloaf, as nearly half of the participants either disliked it or answered to “neither like nor dislike it” (Table 5).
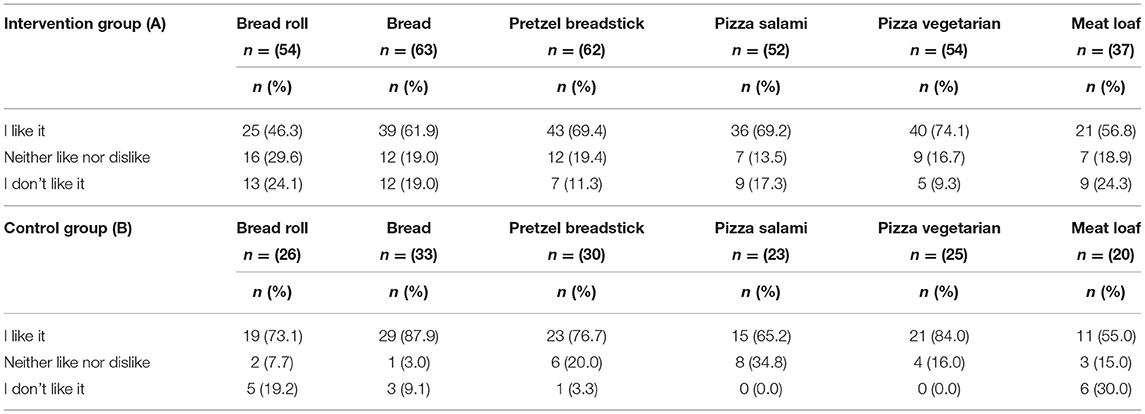
Table 5. Rating of selected study products by participants of the intervention group (A) and participants of the control group (B).
Gastrointestinal Tolerance of Fiber-Enriched Products
At baseline, the most frequently reported gastrointestinal symptoms were flatulence (intervention group 56.8 vs. 52.9% in the control group) and bloating (50.0 vs. 55.9%, respectively). Symptoms were mostly described as mild to moderate. At week 12, the overall percentage of participants reporting flatulence increased to 71.6% in the intervention group, including (n = 5) participants who reported strong symptoms. In the control group, the overall percentage of flatulence symptoms was 58.8% at 12 weeks, and no strong symptoms were reported. Regarding bloating, 55.4% of participants in the intervention group reported some symptoms at 12 weeks, including 4 participants, who reported intense symptoms. In the control group, the percentage of participants who suffered from bloating at week 12 decreased to 44.1%. Concerning other gastrointestinal complaints such as loose stool, diarrhea and constipation no differences and changes from baseline to week 12 in both groups were seen (data not shown).
Discussion
The results of this intervention study clearly indicate that offering fiber-enriched popular foods leads to an increase of fiber intake by more than 10 g/day compared to a control group receiving similar products without fiber enrichment. Participants were asked to stick to their usual dietary habits and no further recommendations for a healthy diet were given. It is necessary to mention that we did not separate between certain physico-chemical properties. Volunteers were free to choose their foods without paying attention whether the fiber type was more soluble/insoluble or viscous/non-viscous. Many fiber types have overlapping physicochemical properties. Therefore, it is not possible to assign observed effects to distinct fiber types.
A unique feature of this study was that fiber-enriched foods were offered that are already available in food markets or were specifically developed in a research project to increase the health value of popular convenience foods by adding fiber (18, 29). Thereby, a broad portfolio of fiber-enriched food items was composed that reflects common dietary habits of the German population and is not necessarily consistent with official dietary guidelines. Here, this alternative strategy was shown to improve an important component of diet quality, as previous efforts to increase fiber intake by promoting a higher intake of vegetables, fruits or whole-grain bread have turned out to be not very effective (30).
It is interesting to note that the majority of participants in the intervention group reported that they enjoyed the provided food items. It was a specific goal of this study to offer fiber-enriched foods with high sensory qualities and, at best, they should be undistinguishable from standard foods, as recently shown in a reformulation study from our group (29).
However, it is well-known that the palatability of food items may be influenced by the kind of food, the amount of added fiber and its physiochemical properties, the food texture and its organoleptic properties as demonstrated in previous studies (31–34). In our study, the participants could select from a variety of fiber-enriched products. The analysis of the product ratings revealed that the standard products were rated only slightly better than the fiber-enriched alternatives. This small difference may not be really relevant, as there was no difference in dropout rates in both groups during the 12-week study period suggesting a high acceptability of the fiber-enriched products. However, participants of the intervention group reported a moderate increase in gastrointestinal symptoms due to the higher fiber intake without affecting adherence.
Moreover, we assessed the impact of fiber-enriched foods on body weight, lipids, insulin sensitivity, and cardiovascular functions. In the current study, the increase of fiber intake did not promote a change in body weight. Previous studies established a weak inverse relationship between dietary fiber intake and changes in body weight (35, 36). For instance, in the prospective EPIC cohort study, an increase in dietary fiber intake by 10 g/day was associated with an annual weight change of −39 g/year (95% CI: −71, −7 g/year) (36). Therefore, it is obvious that the impact of a high fiber intake on body weight is generally rather modest. Another explanation could be that the intervention period was too short to produce effects on body weight.
Furthermore, the increased fiber intake did not confer short-term metabolic benefits, as there were no relevant changes in total cholesterol, LDL-cholesterol, and triglycerides as well as HOMA-IR as a marker of insulin sensitivity. These findings are in line with results from several previous studies (1, 37). In addition, the increase of fiber intake resulted in a significant decrease of fasting insulin, whereas HOMA-IR did not change significantly after 12 weeks of intervention. A previous study suggested that the effect of insoluble fiber on insulin resistance may depend on the ingested amount (38). In the latter study, 31.2 g/day of insoluble fiber was given to women with overweight or obesity and normal glucose tolerance which resulted in an improved insulin sensitivity compared to the additional 10–12 gram of fiber in the present study.
The measurement of cardiovascular functional parameters revealed a modest decrease in central systolic blood pressure. This was not unexpected, as a recent study reported that some fiber products may have a short-term antihypertensive effect on blood pressure (39). It is known that dietary fibers may interact with cells of the immune barrier in the small intestine (40), strengthen the mucus layer and enhance the barrier function of epithelial cells (41). In the current study, we were interested to investigate the impact of increased dietary fiber intake on gut permeability in a subgroup of participants. However, there was no measurable effect of the increased dietary fiber intake on gut permeability. There are only a few studies on this aspect with some positive effects of dietary fiber on gut permeability, however, mainly in non-healthy individuals (42, 43). More studies in this field are needed also considering the type and the amount of fiber intake.
In contrast, more data is available on the effects of dietary fibers on the growth and function of intestinal microbiota communities (44). Therefore, we were interested to investigate, if our approach to increase fiber intake has an effect on microbiota composition. The results of this analysis indicate that individuals with additional fiber intake showed an increase of members of the family Tannerellaceae. This result confirms the previously reported association of Tannerellaceae with obesity (45) and hypertension (46) and should be considered in the analysis of diet-related metabolic health. Members of the family Tannerellaceae are known to be involved in succinate production, which is associated with intestinal inflammation (47) and metabolic health (48, 49). However, it is important to be aware that only a minor proportion of the microbial diversity can be explained by environmental factors including diet (25, 50).
The prediction of functional pathways allowed us to analyse functional pathways derived by 16S rRNA gene sequences. The results of this showed that the increase of the two tetrapyrrole biosynthesis pathways (PWY-5188, PWY-5189) reduces the presence of Bilophila and Bacteroides. The two genera were associated with high fat diet and metabolic dysfunction and weight loss under lifestyle intervention (51, 52). Moreover, the Peptidoglycan biosynthesis (PWY.6470) were linked with the genera Agathobacter and Ruminococcus which increased after the intervention has started. Agathobacter include butyrate-producing species and Ruminococcus include degraders of complex dietary and host-derived polysaccharides (53). Overall, the association between functional pathways and 16S rRNA gene sequences reflected the reduction of high fat food and increase of fiber-enriched food.
The strength of our study is the pragmatic approach in a real world setting. It is obvious from our experience that fiber enrichment of popular convenience foods may be a simple way to increase fiber intake in the general population, provided a similar taste and appealing appearance. Another strength of this study may be that a variety of methods were applied to get a broad picture including the perspective of the consumers. Such human studies may also have limitations such as the assessment of dietary intake that was based on self-reporting of the participants. Although the provision of fiber-enriched and standard foods was documented, it cannot be excluded that the consumption of products was shared with family members. The rating of the fiber-enriched food products may have been influenced by the free provision to the participants, but the situation was the same in the control group. Although the recruitment used channels addressed to the general population, it is also possible that particularly health-conscious individuals participated. Therefore, the findings may not be generalizable.
In conclusion, the results of this study strongly suggest that fiber enrichment of popular foods including convenience foods may be a simple and effective method to increase fiber intake to the recommended level. Along this line, a modest improvement of some cardiometabolic risk factors can be expected in a rather healthy group of volunteers. Therefore, improving the health quality of popular convenience foods, could become a novel and effective strategy to improve the overall quality of the habitual diet in the population, especially in people with cardiometabolic diseases. Additional studies are needed to further explore this approach.
Data Availability Statement
The datasets generated for this study are available on request to the corresponding author. The accession number for the raw sequencing data in this paper are available via Sequence Read Archive (SRA: PRJNA701859). Software used to analyze the data are either freely or commercially available. Source code data are available from the corresponding author on request.
Ethics Statement
The studies involving human participants were reviewed and approved by Ethical Committee of the Faculty of Medicine of the Technical University of Munich. The patients/participants provided their written informed consent to participate in this study.
Author Contributions
HH and TS designed research. RR conducted research. TH provided essential reagents. SD and BB analyzed gut permeability marker. SR and DH analyzed microbiota data. BB performed statistical analysis. KP analyzed data from questionnaires. HH, TS, and BB had primary responsibility for final content. All authors read and approved the final version of the manuscript.
Funding
This work was funded by a grant from the German Ministry for Education and Research (BMBF, Grant No. 01EA1409A). There was no influence on the design, conduct, data analysis, and interpretation from the funding agency and the industrial partners. The preparation of this paper was supported by the enable Cluster and is cataloged by the enable Steering Committee as enable 89 (http://enable-cluster.de).
Conflict of Interest
The authors declare that the research was conducted in the absence of any commercial or financial relationships that could be construed as a potential conflict of interest.
Publisher's Note
All claims expressed in this article are solely those of the authors and do not necessarily represent those of their affiliated organizations, or those of the publisher, the editors and the reviewers. Any product that may be evaluated in this article, or claim that may be made by its manufacturer, is not guaranteed or endorsed by the publisher.
Acknowledgments
We thank Margot Maier for outstanding support. We also thank Karin Lietzau for performing IMT measurements and Manuela Hubersberger for excellent assistance with laboratory analysis. Finally, we thank our industry partners for providing standard or fiber-enriched foods: Jürgen Rettenmeier und Söhne, Nestlé, Wünsche, and Dr. Oetker.
Supplementary Material
The Supplementary Material for this article can be found online at: https://www.frontiersin.org/articles/10.3389/fnut.2022.816299/full#supplementary-material
Abbreviations
ASVs, Amplicon sequence variant; DGE, German Nutrition Society; HOMA-IR, homeostatic model assessment-Insulin Resistance; HPIC, high-performance ion chromatography; hsCRP, high-sensitivity C-reactive protein; IMT, intima-media thickness; LBP, lipopolysaccharide binding protein; LDL, low-density lipoprotein cholesterol; NAFDL, non-alcoholic fatty liver disease; OTU, operative taxonomic unit; PAD, Pulsed amperometric detection; RCTs, randomized controlled intervention studies; rRNA, ribosomal ribonucleic acid; SOP, standard operation procedure; WC, Waist circumference.
References
1. Anderson JW, Baird P, Davis RH, Ferreri S, Knudtson M, Koraym A, et al. Health benefits of dietary fiber. Nutr Rev. (2009) 67:188–205. doi: 10.1111/j.1753-4887.2009.00189.x
2. Hauner H, Bechthold A, Boeing H, Brönstrup A, Buyken A, Leschik-Bonnet E, et al. Evidence-based guideline of the German Nutrition Society: carbohydrate intake and prevention of nutrition-related diseases. Ann Nutr Metab. (2012) 60(Suppl 1):1–58. doi: 10.1159/000335326
3. Ye EQ, Chacko SA, Chou EL, Kugizaki M, Liu S. Greater whole-grain intake is associated with lower risk of type 2 diabetes, cardiovascular disease, and weight gain. J Nutr. (2012) 142:1304–13. doi: 10.3945/jn.111.155325
4. Ludwig DS, Pereira MA, Kroenke CH, Hilner JE, van Horn L, Slattery ML, et al. Dietary fiber, weight gain, and cardiovascular disease risk factors in young adults. JAMA. (1999) 282:1539–46. doi: 10.1001/jama.282.16.1539
5. Montonen J, Knekt P, Järvinen R, Aromaa A, Reunanen A. Whole-grain and fiber intake and the incidence of type 2 diabetes. Am J Clin Nutr. (2003) 77:622–9. doi: 10.1093/ajcn/77.3.622
6. King DE, Egan BM, Woolson RF, Mainous AG, Al-Solaiman Y, Jesri A. Effect of a high-fiber diet vs a fiber-supplemented diet on C-reactive protein level. Arch Intern Med. (2007) 167:502–6. doi: 10.1001/archinte.167.5.502
7. Tucker LA, Thomas KS. Increasing total fiber intake reduces risk of weight and fat gains in women. J Nutr. (2009) 139:576–81. doi: 10.3945/jn.108.096685
8. Päivärinta E, Itkonen ST, Pellinen T, Lehtovirta M, Erkkola M, Pajari A-M. Replacing animal-based proteins with plant-based proteins changes the composition of a whole Nordic diet-A Randomised clinical trial in healthy Finnish adults. Nutrients. (2020) 12:943. doi: 10.3390/nu12040943
9. Sandberg JC, Björck IME, Nilsson AC. Impact of rye-based evening meals on cognitive functions, mood and cardiometabolic risk factors: a randomized controlled study in healthy middle-aged subjects. Nutr J. (2018) 17:102. doi: 10.1186/s12937-018-0412-4
10. Fulgoni VL, Brauchla M, Fleige L, Chu Y. Association of whole-grain and dietary fiber intake with cardiometabolic risk in children and adolescents. Nutr Health. (2020) 26:243–51. doi: 10.1177/0260106020928664
11. Threapleton DE, Greenwood DC, Evans CEL, Cleghorn CL, Nykjaer C, Woodhead C, et al. Dietary fibre intake and risk of cardiovascular disease: systematic review and meta-analysis. BMJ. (2013) 347:f6879. doi: 10.1136/bmj.f6879
12. Yao B, Fang H, Xu W, Yan Y, Xu H, Liu Y, et al. Dietary fiber intake and risk of type 2 diabetes: a dose-response analysis of prospective studies. Eur J Epidemiol. (2014) 29:79–88. doi: 10.1007/s10654-013-9876-x
13. Slavin J. Why whole grains are protective: biological mechanisms. Proc Nutr Soc. (2003) 62:129–34. doi: 10.1079/PNS2002221
14. Reynolds A, Mann J, Cummings J, Winter N, Mete E, Te Morenga L. Carbohydrate quality and human health: a series of systematic reviews and meta-analyses. Lancet. (2019) 393:434–45. doi: 10.1016/S0140-6736(18)31809-9
15. Stephen AM, Champ MM-J, Cloran SJ, Fleith M, van Lieshout L, Mejborn H, et al. Dietary fibre in Europe: current state of knowledge on definitions, sources, recommendations, intakes and relationships to health. Nutr Res Rev. (2017) 30:149–90. doi: 10.1017/S095442241700004X
16. Heuer T, Krems C, Moon K, Brombach C, Hoffmann I. Food consumption of adults in Germany: results of the German National Nutrition Survey II based on diet history interviews. Br J Nutr. (2015) 113:1603–14. doi: 10.1017/S0007114515000744
17. Gose M, Krems C, Heuer T, Hoffmann I. Trends in food consumption and nutrient intake in Germany between 2006 and 2012: results of the German National Nutrition Monitoring (NEMONIT). Br J Nutr. (2016) 115:1498–507. doi: 10.1017/S0007114516000544
18. Brandl B, Skurk T, Rennekamp R, Hannink A, Kiesswetter E, Freiherr J, et al. A phenotyping platform to characterize healthy individuals across four stages of life - the enable study. Front Nutr. (2020) 7:582387. doi: 10.3389/fnut.2020.582387
19. Matthews DR, Hosker JP, Rudenski AS, Naylor BA, Treacher DF, Turner RC. Homeostasis model assessment: insulin resistance and beta-cell function from fasting plasma glucose and insulin concentrations in man. Diabetologia. (1985) 28:412–9. doi: 10.1007/BF00280883
20. Norman K, Pirlich M, Schulzke J-D, Smoliner C, Lochs H, Valentini L, et al. Increased intestinal permeability in malnourished patients with liver cirrhosis. Eur J Clin Nutr. (2012) 66:1116–9. doi: 10.1038/ejcn.2012.104
21. Reitmeier S, Kiessling S, Neuhaus K, Haller D. Comparing circadian rhythmicity in the human gut microbiome. STAR Protoc. (2020) 1:100148. doi: 10.1016/j.xpro.2020.100148
22. Edgar RC. UPARSE: highly accurate OTU sequences from microbial amplicon reads. Nat Methods. (2013) 10:996–8. doi: 10.1038/nmeth.2604
23. Callahan BJ, McMurdie PJ, Rosen MJ, Han AW, Johnson AJA, Holmes SP. DADA2: High-resolution sample inference from Illumina amplicon data. Nat Methods. (2016) 13:581–3. doi: 10.1038/nmeth.3869
24. Quast C, Pruesse E, Yilmaz P, Gerken J, Schweer T, Yarza P, et al. The SILVA ribosomal RNA gene database project: improved data processing and web-based tools. Nucleic Acids Res. (2013) 41:D590–6. doi: 10.1093/nar/gks1219
25. Reitmeier S, Kiessling S, Clavel T, List M, Almeida EL, Ghosh TS, et al. Arrhythmic gut microbiome signatures predict risk of type 2 diabetes. Cell Host Microbe. (2020) 28:258–72.e6. doi: 10.1016/j.chom.2020.06.004
26. Douglas GM, Maffei VJ, Zaneveld JR, Yurgel SN, Brown JR, Taylor CM, et al. PICRUSt2 for prediction of metagenome functions. Nat Biotechnol. (2020) 38:685–8. doi: 10.1038/s41587-020-0548-6
27. Arumugam M, Raes J, Pelletier E, Le Paslier D, Yamada T, Mende DR, et al. Enterotypes of the human gut microbiome. Nature. (2011) 473:174–80. doi: 10.1038/nature09944
28. Jiang W, Wu N, Wang X, Chi Y, Zhang Y, Qiu X, et al. Dysbiosis gut microbiota associated with inflammation and impaired mucosal immune function in intestine of humans with non-alcoholic fatty liver disease. Sci Rep. (2015) 5:8096. doi: 10.1038/srep08096
29. Rennekamp R, Brandl B, Giesbertz P, Skurk T, Hauner H. Metabolic and satiating effects and consumer acceptance of a fibre-enriched Leberkas meal: a randomized cross-over trial. Eur J Nutr. (2021) 60:3203–10. doi: 10.1007/s00394-020-02472-1
30. Howard BV, van Horn L, Hsia J, Manson JE, Stefanick ML, Wassertheil-Smoller S, et al. Low-fat dietary pattern and risk of cardiovascular disease: the Women's Health Initiative Randomized Controlled Dietary Modification Trial. JAMA. (2006) 295:655–66. doi: 10.1001/jama.295.6.655
31. Talukder S. Effect of dietary fiber on properties and acceptance of meat products: a review. Crit Rev Food Sci Nutr. (2015) 55:1005–11. doi: 10.1080/10408398.2012.682230
32. Glicerina V, Balestra F, Capozzi F, Dalla Rosa M, Romani S. Influence of the addition of soy product and wheat fiber on rheological, textural, and other quality characteristics of pizza. J Texture Stud. (2017) 49:415–23. doi: 10.1111/jtxs.12311
33. Jaworska D, Królak M, Przybylski W, Jezewska-Zychowicz M. Acceptance of fresh pasta with β-glucan addition: expected versus perceived liking. Foods. (2020) 9:869. doi: 10.3390/foods9070869
34. Sagar NA, Pareek S. Dough rheology, antioxidants, textural, physicochemical characteristics, and sensory quality of pizza base enriched with onion (Allium cepa L) skin powder. Sci Rep. (2020) 10:18669. doi: 10.1038/s41598-020-75793-0
35. Karnehed N, Tynelius P, Heitmann BL, Rasmussen F. Physical activity, diet and gene-environment interactions in relation to body mass index and waist circumference: the Swedish young male twins study. Public Health Nutr. (2006) 9:851–8. doi: 10.1017/PHN2005926
36. Du H, van der ADL, Boshuizen HC, Forouhi NG, Wareham NJ. Dietary fiber and subsequent changes in body weight and waist circumference in European men and women. Am J Clin Nutr. (2010) 91:329–36. doi: 10.3945/ajcn.2009.28191
37. Brown L, Rosner B, Willett WW, Sacks FM. Cholesterol-lowering effects of dietary fiber: a meta-analysis. Am J Clin Nutr. (1999) 69:30–42. doi: 10.1093/ajcn/69.1.30
38. Weickert MO, Möhlig M, Schöfl C, Arafat AM, Otto B, Viehoff H, et al. Cereal fiber improves whole-body insulin sensitivity in overweight and obese women. Diabetes Care. (2006) 29:775–80. doi: 10.2337/diacare.29.04.06.dc05-2374
39. Aleixandre A, Miguel M. Dietary fiber and blood pressure control. Food Funct. (2016) 7:1864–71. doi: 10.1039/C5FO00950B
40. Breton J, Plé C, Guerin-Deremaux L, Pot B, Lefranc-Millot C, Wils D, et al. Intrinsic immunomodulatory effects of low-digestible carbohydrates selectively extend their anti-inflammatory prebiotic potentials. Biomed Res Int. (2015) 2015:162398. doi: 10.1155/2015/162398
41. Vogt LM, Meyer D, Pullens G, Faas MM, Venema K, Ramasamy U, et al. Toll-like receptor 2 activation by effects of low-digestible carbohydrates selectively extend their anti-inflammatory prebiotic potentials dification. J Nutr. (2014) 144:1002–8. doi: 10.3945/jn.114.191643
42. Ganda Mall JP, Löfvendahl L, Lindqvist CM, Brummer RJ, Keita ÅV, Schoultz I. Differential effects of dietary fibres on colonic barrier function in elderly individuals with gastrointestinal symptoms. Sci Rep. (2018) 8:13404. doi: 10.1038/s41598-018-31492-5
43. Krawczyk M, Maciejewska D, Ryterska K, Czerwińka-Rogowska M, Jamioł-Milc D, Skonieczna-Zydecka K, et al. Gut permeability might be improved by dietary fiber in individuals with Nonalcoholic Fatty Liver Disease (NAFLD) undergoing weight reduction. Nutrients. (2018) 10:1793. doi: 10.3390/nu10111793
44. Holscher HD. Dietary fiber and prebiotics and the gastrointestinal microbiota. Gut Microbes. (2017) 8:172–84. doi: 10.1080/19490976.2017.1290756
45. Piening BD, Zhou W, Contrepois K, Röst H, Gu Urban GJ, Mishra T, et al. Integrative personal omics profiles during periods of weight gain and loss. Cell Syst. (2018) 6157–170.e8. doi: 10.1016/j.cels.2017.12.013
46. Yan Q, Gu Y, Li X, Yang W, Jia L, Chen C, et al. Alterations of the gut microbiome in hypertension. Front Cell Infect Microbiol. (2017) 7:381. doi: 10.3389/fcimb.2017.00381
47. Connors J, Dawe N, van Limbergen J. The role of succinate in the regulation of intestinal inflammation. Nutrients. (2018) 11:E25. doi: 10.3390/nu11010025
48. Vadder F, de Kovatcheva-Datchary P, Zitoun C, Duchampt A, Bäckhed F, Mithieux G. Microbiota-produced succinate improves glucose homeostasis via intestinal gluconeogenesis. Cell Metab. (2016) 24:151–7. doi: 10.1016/j.cmet.2016.06.013
49. Serena C, Ceperuelo-Mallafré V, Keiran N, Queipo-Ortuño MI, Bernal R, Gomez-Huelgas R, et al. Elevated circulating levels of succinate in human obesity are linked to specific gut microbiota. ISME J. (2018) 12:1642–57. doi: 10.1038/s41396-018-0068-2
50. He Y, Wu W, Zheng H-M, Li P, McDonald D, Sheng H-F, et al. Regional variation limits applications of healthy gut microbiome reference ranges and disease models. Nat Med. (2018) 24:1532–5. doi: 10.1038/s41591-018-0164-x
51. Nadal I, Santacruz A, Marcos A, Warnberg J, Garagorri JM, Garagorri M, et al. Shifts in clostridia, bacteroides and immunoglobulin-coating fecal bacteria associated with weight loss in obese adolescents. Int J Obes. (2009) 33:758–67. doi: 10.1038/ijo.2008.260
52. Natividad JM, Lamas B, Pham HP, Michel M-L, Rainteau D, Bridonneau C, et al. Bilophila wadsworthia aggravates high fat diet induced metabolic dysfunctions in mice. Nat Commun. (2018) 9:2802. doi: 10.1038/s41467-018-05249-7
Keywords: fiber-enriched foods, fiber, patient satisfaction, healthy diet, microbiome
Citation: Brandl B, Rennekamp R, Reitmeier S, Pietrynik K, Dirndorfer S, Haller D, Hofmann T, Skurk T and Hauner H (2022) Offering Fiber-Enriched Foods Increases Fiber Intake in Adults With or Without Cardiometabolic Risk: A Randomized Controlled Trial. Front. Nutr. 9:816299. doi: 10.3389/fnut.2022.816299
Received: 16 November 2021; Accepted: 17 January 2022;
Published: 16 February 2022.
Edited by:
Maurizio Marra, University of Naples Federico II, ItalyReviewed by:
Ana Maria Calderon De La Barca, Consejo Nacional de Ciencia y Tecnología (CONACYT), MexicoStefan Kabisch, Charité Universitätsmedizin Berlin, Germany
Copyright © 2022 Brandl, Rennekamp, Reitmeier, Pietrynik, Dirndorfer, Haller, Hofmann, Skurk and Hauner. This is an open-access article distributed under the terms of the Creative Commons Attribution License (CC BY). The use, distribution or reproduction in other forums is permitted, provided the original author(s) and the copyright owner(s) are credited and that the original publication in this journal is cited, in accordance with accepted academic practice. No use, distribution or reproduction is permitted which does not comply with these terms.
*Correspondence: Hans Hauner, aGFucy5oYXVuZXJAdHVtLmRl
 Beate Brandl
 Rachel Rennekamp2
 Katarzyna Pietrynik
 Sebastian Dirndorfer
 Thomas Hofmann
 Thomas Skurk