
95% of researchers rate our articles as excellent or good
Learn more about the work of our research integrity team to safeguard the quality of each article we publish.
Find out more
ORIGINAL RESEARCH article
Front. Nutr. , 10 March 2022
Sec. Nutritional Epidemiology
Volume 9 - 2022 | https://doi.org/10.3389/fnut.2022.799375
This article is part of the Research Topic Nutrition and Oral Health: Public Health Relevance View all 18 articles
 Muhammad Aslam*
 Ali Hussein AL-Marshadi
In this paper, a new trimmed regression model under the neutrosophic environment is introduced. The mathematical model of the new regression model along with its neutrosophic form is given. The methods to find the error sum of square and trended values are also given. The trimmed neutrosophic correlation is also introduced in the paper. The proposed trimmed regression is applied to prostate cancer. From the analysis, it is concluded that the proposed model provides the minimum error sum of square as compared to the existing regression model under neutrosophic statistics. It is found that the proposed model is quite effective to forecast prostate cancer patients under an indeterminacy setting.
The regression analysis has been applied to study the relationship between two variables that are correlated in a variety of fields such as business, medical science, and weather forecasting. One of the main objectives of the regression model is the forecasting of the response variable using the information of the independent variable. For example, the relationship between prostate cancer and dietary fat can be studied using the regression model. On the other hand, the correlation analysis is done to see the degree of relationship between two correlated variables. In the regression models, a mode is selected which has the minimum error sum of square. Abdul-Wahab et al. (1–4) discussed the applications of the regression models in various fields.
Prostate cancer kills around 34,130 people in the USA every year where more than 248,530 patients are coming every year (https://www.cancer.org/cancer/prostate-cancer/about/key-statistics.html). Smoking is one of the main reasons for this type of cancer and patient has to bear a costly treatment of this disease. Jemal et al. (5) studied the relationship between age and prostate cancer. Rahib et al. (6) expected an increase in deaths due to cancer. Arnold et al. (7) found a strong relationship between smoking and cancer. Torre et al. (8) studied prostate cancer patients in the UK. According to Lin et al. (9), cancer patients remain uncomfortable during the rest of life. Siegel et al. (10) reported the yearly deaths due to cancer in the USA. Prostate cancer is very common in men and can be controlled if it is diagnosed at an early stage. According to Cao et al. (11) “Prostate cancer is the third highest cause of male mortality in the developed world.” Lin et al. (9) pointed out the high death rate due to prostate cancer. Scarton et al. (11, 12) studied various factors that cause cancer. Applegate et al. (13) presented a study on the relationship between soy food and cancer. Aslam and Albassam (14) studied the relationship between prostate cancer and dietary fat. More information can be seen in (15).
As mentioned earlier, the regression models are applied for the purpose of the estimation and forecasting of different fields. The presences of the extreme values in the data affect the forecasting and estimation significantly. Several methods are applied to remove these extreme or outliers from the data for a better analysis of the data at hand. The idea of a trimmed average is applied to calculate the average of the observations after removing a specific percentage of the extreme values from the data. The use of the trimmed method is helpful in minimizing the variation in the data. Oten and de Figueiredo (16–22) presented various trimmed methods in various fields.
The regression models and trimmed mean are applied under the assumption that there is no uncertain observation in the data. In practice, as mentioned by (23), the observations can be uncertain, imprecise, and in the interval. For this kind of data, the existing regression model and trimmed mean cannot be applied. To deal with this type of data, statistical methods developed under fuzzy logic are applied. The fuzzy logic-based statistical methods provide the results in an uncertain environment. Saritas et al. (24–28) analyzed prostate cancer data using fuzzy logic. Vela-Rincón et al. (29) presented the idea of a trimmed average under the fuzzy logic.
Smarandache (30) gave the idea of neutrosophic statistics and declared it as the generalization of classical statistics. Neutrosophic statistics has advantages over classical statistics as it gives additional information about the measure of indeterminacy. The neutrosophic statistics is applied when the data is vogue, unclear, imprecise, and indeterminate, Chen et al. (31–35).
As mentioned before that the idea of a trimmed average is applied to remove the extreme values from the data. By exploring the literature and according to the best of our knowledge, there is no work on trimmed regression under neutrosophic statistics. In this article, we will present the trimmed neutrosophic regression originally. We will present the trimmed neutrosophic regression, trended values, and error sum of square in the indeterminate environment. The application of the proposed regression model is given in prostate cancer data. It is expected that the proposed regression will be efficient than the existing regression model. In addition, it is expected that the proposed model will be quite effective to be applied for forecasting and prediction of prostate cancer.
Suppose that we have nN ϵ [nL, nU] pairs of observations as (x1N, y1N), …, (xnN, ynN), where xnN is an independent variable and ynN be a dependent variable. It is assumed that both neutrosophic variables are correlated. For the implementation of the proposed trimmed regression model, the neutrosophic data is arranged in ascending order in variable xnN or ynN. Let ω be the percentage of the removed values from both variables. For example, if ω = 6 and we arranged the data in ascending according to the variable xnN, it means that three pairs of observations will be removed from the starting and three pairs of observations will be removed from the end of the data. Using this information, the trimmed regression model under neutrosophic statistics, say YNT ϵ [YLT, YUT] is given as
where aNT ϵ [aLT, aUT] and bNT ϵ [bLT, bUT] are slope and rate of change of the proposed trimmed regression model.
The proposed trimmed regression in neutrosophic form can be written as
where aLT, bLT, XLT be the lower values of indeterminate interval and known as determinate values under classical statistics. On the other hand,aUTINaT; INaT ϵ [ILaT, IUaT], bUTINbT; INbT ϵ [ILbT, IUbT], XUTINXT; INXT ϵ [ILXT, IUT] are indeterminate values of indeterminate interval. The proposed trimmed regression model is a generalization of the regression model proposed by Aslam and Albassam (14). The operations of neutrosophic numbers can be seen in Chen et al. (31, 32). The trimmed neutrosophic correlation, say rNT ϵ [rLT, rUT] is defined as
The neutrosophic form of rNT ϵ [rLT, rUT] is given by
where rLT is a determinate part and rUTINrT; INrT ϵ [ILrT, IUrT] is an indeterminate part. The proposed trimmed neutrosophic correlation reduces to (14) if no pair of observations is trimmed from the data. The following steps can be applied to run the proposed regression model on real data.
1. Arrange the data of XN or YN in ascending order.
2. Fix the trimmed value ω. Indicate ω extreme values in XN. Remove pair of (XN, YN) from the start and pair from the end.
3. Fit the proposed regression on trimmed data.
4. Determine the neutrosophic trended values and neutrosophic error sum of square.
In this section, the application of the proposed regression model is applied to the prostate cancer data of 30 countries. The present case study is based on two variables namely dietary fat and death rate. The decision-makers are interested to see the relationship between these two variables. For this study, dietary fat is considered as the independent variable, and the death rate is labeled as the dependent variable. Let XN denote the variable dietary fat and YN denotes the death rate. The purpose of this study is to determine the effect of dietary effects on the death rate. The neutrosophic data of variables XN and YN is selected from Aslam and Albassam (14) and shown in Table 1 for easy reference. From Table 1, it can be seen that the given data is given in indeterminate intervals; therefore, the classical regression model under classical statistics cannot be applied to study the relationship between death rate and dietary fat. Aslam and Albassam (14) presented the neutrosophic regression analysis for the same data. We now apply the idea of trimmed regression on the same data. The proposed regression analysis can be applied as follows
5. Arrange the data of XN and YN in ascending order.
6. Fix the trimmed value ω = 3%. Indicate the six extreme values in XN. Remove three pairs of (XN, YN) from the start and end three pairs of (XN, YN) from the end.
7. Fit the proposed regression on this trimmed data.
8. Determine the neutrosophic trended values and neutrosophic error sum of square
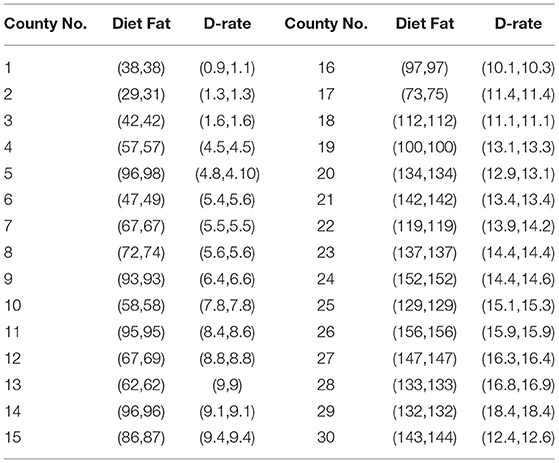
Table 1. Prostate cancer death rate of 30 countries.
The trimmed data of XNT and YNT is shown in Table 2. The neutrosophic trimmed regression model using the data given in Table 2 is given by
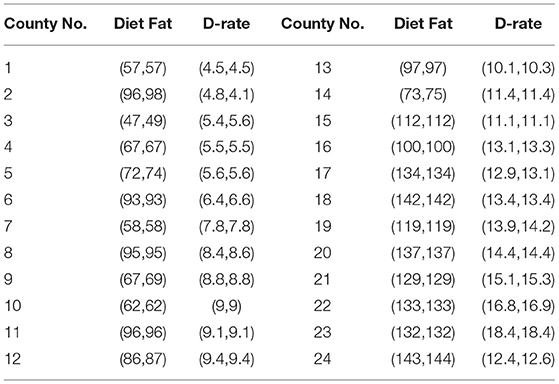
Table 2. Trimmed Prostate cancer death rate of 30 countries.
The neutrosophic form of ŶNT for the cancer data is given by
The proposed regression model can be interpreted as when XNT ϵ [0, 0], the death rate will be from 0.2306 and 0.0567. The rate of change in the death rate due to the dietary fat is from 0.1032 to 0.1049. The neutrosophic correlation between dietary fat and death rate is from 0.7996 and 0.7910. From this study, it can be noted that the proposed regression analysis provides the values of intercept and rate of change values in indeterminate intervals rather than the exact values as in regression under classical statistics. Therefore, the proposed regression analysis is quite effective to be applied to study the relationship between dietary fat and death rate under indeterminacy.
Aslam and Albassam (14) applied the neutrosophic regression model on the prostate cancer data. As mentioned earlier, in the regression theory, a regression model having the smaller values of the error sum of square is minimum is called an efficient regression model. We now compare the efficiency of the proposed regression model with Aslam and Albassam (14) regression model in terms of neutrosophic error sum of square , where YNT and ŶNT are original values and trend values, respectively. The values of ŶNT and for both regression models are shown in Table 3. From Table 3, it can be seen that the values of are smaller for the proposed regression model as compared to the existing values of . For example, the values of the error sum of square is from the existing regression proposed by (14). The values of the error sum of square are from the proposed regression model. By comparing the values of of both regressions, it is concluded that the proposed model is better than the existing model proposed by Aslam and Albassam (14). Therefore, the proposed model can be used for the forecasting of prostate cancer under the presence of uncertainty.
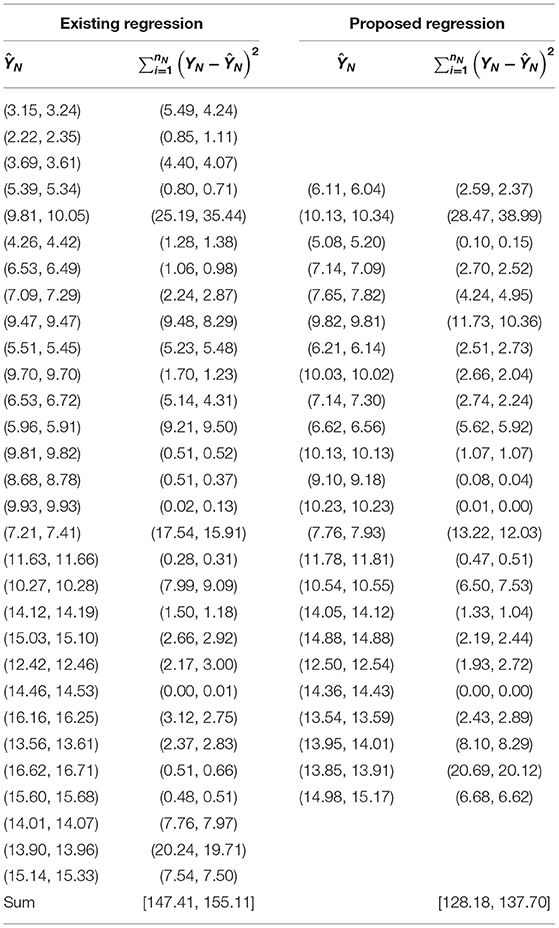
Table 3. The trended values and error sum of square for two regression models.
In this section, the comparison of the proposed regression model is given with the existing model proposed by Aslam and Albassam (14) in terms of trended values. The trended values of both models are presented in Table 3. The trended lines of both regression models are shown in Figure 1. From Figure 1, it can be noted that the trended values are close to actual values of prostate cancer for the proposed regression model. On the other hand, the trended values are away from the actual values of prostate cancer for the existing regression model proposed by Aslam and Albassam (14). From this comparative study, it can be concluded that the proposed model is quite suitable to apply for the forecasting of prostate cancer patients as compared to the existing regression model under the presence of uncertainty.
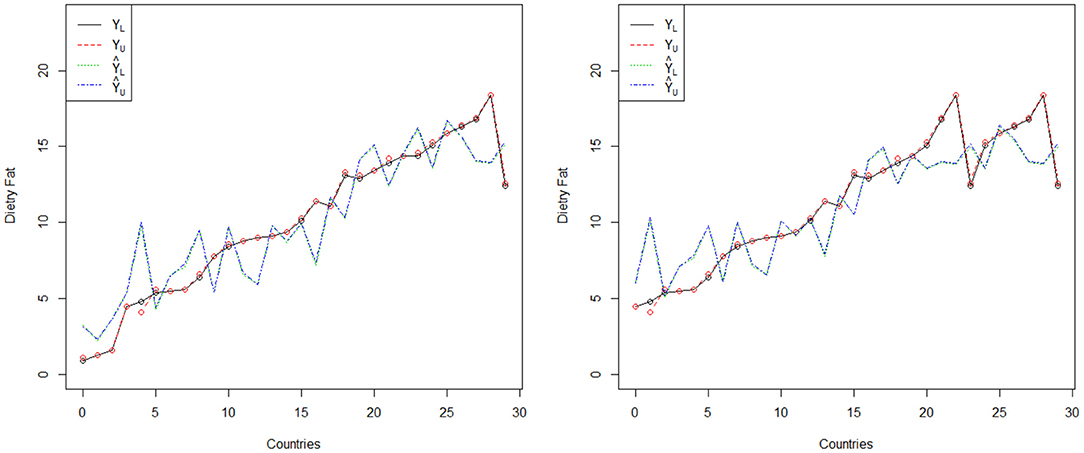
Figure 1. The trended lines of two regression models.
In this section, we will present the neutrosophic forms along with the measures of indeterminacy of the values of . The neutrosophic form of of the proposed model can be expressed as: . It means that the error sum of square under uncertainty can be from 128 to 137 with the measure of indeterminacy is being 0.07. The neutrosophic form ŶN for example for country#4 can be given as: ŶNT = 6.11−6.04IN ϵ [0, 0.01]. From this neutrosophic form, the first value 6.11 indicates the trend values for the regression model under classical statistics. The second value 6.04IN indicates the indeterminate part of the neutrosophic form. From this study, it can be noted that the death rate due to dietary fat will be from 6.04 to 6.11 per 100,000. The proposed regression model gives the trended values in intervals rather than the exact values. Therefore, the proposed model is reasonable to apply for the forecasting of the death rate due to dietary fat.
In this paper, a new trimmed regression model under the neutrosophic was introduced. The mathematical model of the new regression model along with its neutrosophic form was given. The trimmed neutrosophic correlation was also introduced in the paper. The proposed trimmed regression is applied to prostate cancer. The efficiency of the proposed model is discussed with the existing regression model under neutrosophic regression. From the comparisons, it is found that the proposed model provides the minimum error sum of square as compared to the existing model. It is also concluded that the proposed model can be effectively used in forecasting prostate cancer as compared to the existing model. The proposed method can be applied in different areas of applications such as decision-making and multi-level programming. The proposed regression model can be used in medical science, business, and social science as future research.
The original contributions presented in the study are included in the article/supplementary material, further inquiries can be directed to the corresponding author/s.
MA and AA-M wrote the paper. Both authors contributed to the article and approved the submitted version.
This work was supported by the Deanship of Scientific Research (DSR) at King Abdulaziz University, Jeddah. The authors, therefore, acknowledge with thanks DSR technical and support.
The authors declare that the research was conducted in the absence of any commercial or financial relationships that could be construed as a potential conflict of interest.
All claims expressed in this article are solely those of the authors and do not necessarily represent those of their affiliated organizations, or those of the publisher, the editors and the reviewers. Any product that may be evaluated in this article, or claim that may be made by its manufacturer, is not guaranteed or endorsed by the publisher.
The authors are deeply thankful to the editor and reviewers for their valuable suggestions to improve the quality of the paper.
1. Abdul-Wahab SA, Bakheit CS, Al-Alawi SM. Principal component and multiple regression analysis in modelling of ground-level ozone and factors affecting its concentrations. Environ Mod Software. (2005) 20:1263–71. doi: 10.1016/j.envsoft.2004.09.001
2. Cervigón R, Moreno J, Reilly R, Pérez-Villacastín J, Castells F. Quantification of anaesthetic effects on atrial fibrillation rate by partial least-squares. Physiol Meas. (2012) 33:1757. doi: 10.1088/0967-3334/33/10/1757
3. Kumar S, Chong I. Correlation analysis to identify the effective data in machine learning: prediction of depressive disorder and emotion states. Int J Environ Res Public Health. (2018) 15:2907. doi: 10.3390/ijerph15122907
4. Karamacoska D, Barry RJ, Steiner GZ. Using principal components analysis to examine resting state EEG in relation to task performance. Psychophysiology. (2019) 56:e13327. doi: 10.1111/psyp.13327
5. Jemal A, Siegel R, Ward E, Murray T, Xu J, Smigal C, et al. Cancer statistics, 2006. Can J Clin. (2006) 56:106–30. doi: 10.3322/canjclin.56.2.106
6. Rahib L, Smith BD, Aizenberg R, Rosenzweig AB, Fleshman JM, Matrisian LM. Projecting cancer incidence and deaths to 2030: the unexpected burden of thyroid, liver, and pancreas cancers in the United States. Can Res. (2014) 74:2913–21. doi: 10.1158/0008-5472.CAN-14-0155
7. Arnold LD, Patel AV, Yan Y, Jacobs EJ, Thun MJ, Calle EE, et al. Are racial disparities in pancreatic cancer explained by smoking and overweight/obesity? Can Epidemiol Prev Biomark. (2009) 18:2397–405. doi: 10.1158/1055-9965.EPI-09-0080
8. Torre LA, Bray F, Siegel RL, Ferlay J, Lortet-Tieulent J, Jemal A. Global cancer statistics, 2012. Can J Clin. (2015) 65:87–108. doi: 10.3322/caac.21262
9. Lin P-H, Liu J-M, Hsu R-J, Chuang H-C, Chang S-W, Pang S-T, et al. Depression negatively impacts survival of patients with metastatic prostate cancer. Int J Environ Res Public Health. (2018) 15:2148. doi: 10.3390/ijerph15102148
10. Siegel RL, Miller KD, Jemal A. Cancer statistics, 2017. Can J Clin. (2017) 67:7–30. doi: 10.3322/caac.21387
11. Cao K, Arthurs C, Atta-ul A, Millar M, Beltran M, Neuhaus J, et al. Quantitative analysis of seven new prostate cancer biomarkers and the potential future of the ‘Biomarker laboratory'. Diagnostics. (2018) 8:49. doi: 10.3390/diagnostics8030049
12. Scarton L, Yoon S, Oh S, Agyare E, Trevino J, Han B, et al. Pancreatic cancer related health disparities: a commentary. Cancers. (2018) 10:235. doi: 10.3390/cancers10070235
13. Applegate C, Rowles J, Ranard K, Jeon S, Erdman J. Soy consumption and the risk of prostate cancer: an updated systematic review and meta-analysis. Nutrients. (2018) 10:40. doi: 10.3390/nu10010040
14. Aslam M, Albassam M. Application of neutrosophic logic to evaluate correlation between prostate cancer mortality and dietary fat assumption. Symmetry. (2019) 11:330. doi: 10.3390/sym11030330
15. Habbema D. Statistical analysis and decision making in cancer screening. Eur J Epidemiol. (2018) 33:433–5. doi: 10.1007/s10654-018-0406-8
16. Oten R, de Figueiredo RJ. Adaptive alpha-trimmed mean filters under deviations from assumed noise model. IEEE Trans Image Proc. (2004) 13:627–39. doi: 10.1109/TIP.2003.821115
17. Wu M, Zuo Y. Trimmed and winsorized means based on a scaled deviation. J Stat Plan Inference. (2009) 139:350–65. doi: 10.1016/j.jspi.2008.03.039
18. Alkhazaleh A, Razali A. New technique to estimate the asymmetric trimming mean. J Prob Stat. (2010) 2010:9. doi: 10.1155/2010/739154
19. Yusof ZM, Abdullah S, Yahaya SSS, Othman AR. Testing the equality of central tendency measures using various trimming strategies. Afri J Mathem Comp Sci Res. (2011) 4:32–8. Available online at: http://citeseerx.ist.psu.edu/viewdoc/download?doi=10.1.1.401.8942&rep=rep1&type=pdf
20. Garcia-Perez A. An approximation to the small sample distribution of the trimmed mean for gaussian mixture models. In: Grzegorzewski P, Gagolewski M, Hryniewicz O, Gil MA, editors. Strengthening Links Between Data Analysis and Soft Computing. Cham: Springer International Publishing (2015). doi: 10.1007/978-3-319-10765-3_14
21. Wang MD, Liu J, Molenberghs G, Mallinckrodt C. An evaluation of the trimmed mean approach in clinical trials with dropout. Pharm Stat. (2018) 17:278–89. doi: 10.1002/pst.1858
22. Lugosi G, Mendelson S. Mean estimation and regression under heavy-tailed distributions: a survey. Found Comp Mathem. (2019) 19:1145–90. doi: 10.1007/s10208-019-09427-x
23. Beckert SF, Paim WS. Critical analysis of the acceptance criteria used in measurement systems evaluation. Int J Metrol Quality Eng. (2017) 8:23. doi: 10.1051/ijmqe/2017016
24. Saritas I, Allahverdi N, Sert IU. A fuzzy expert system design for diagnosis for cancer. In: Proceedings of the 4th International Conference Conference on Computer Systems and Technologies: e-Learning. New York, NY: Association for Computing Machinery (2003). p. 345–71. doi: 10.1145/973620.973677
25. Benecchi L. Neuro-fuzzy system for prostate cancer diagnosis. Urology. (2006) 68:357–61. doi: 10.1016/j.urology.2006.03.003
26. Saritas I, Allahverdi N, Sert IU. A fuzzy approach for determination of prostate cancer. Int J Intell Syst Appl Eng. (2013) 1:1–7. Available online at: https://ijisae.org/index.php/IJISAE/article/view/6
27. Fu J, Ye J, Cui W. An evaluation method of risk grades for prostate cancer using similarity measure of cubic hesitant fuzzy sets. J Biomed Inform. (2018) 87:131–7. doi: 10.1016/j.jbi.2018.10.003
28. Guariglia E. Harmonic sierpinski gasket and applications. Entropy. (2018) 20:714. doi: 10.3390/e20090714
29. Vela-Rincón VV, Mújica-Vargas D, Lavalle MM, Salazar AM. Spatial α-trimmed fuzzy c-means algorithm to image segmentation. In: Mexican Conference on Pattern Recognition. Cham (2020). p. 118–28.
30. Smarandache F. Introduction to Neutrosophic Statistics. Columbus, OH: Sitech and Education and Romania-Educational Publisher (2014).
31. Chen J, Ye J, Du S. Scale effect and anisotropy analyzed for neutrosophic numbers of rock joint roughness coefficient based on neutrosophic statistics. Symmetry. (2017) 9:208. doi: 10.3390/sym9100208
32. Chen J, Ye J, Du S, Yong R. Expressions of rock joint roughness coefficient using neutrosophic interval statistical numbers. Symmetry. (2017) 9:123. doi: 10.3390/sym9070123
33. Aslam M. A new method to analyze rock joint roughness coefficient based on neutrosophic statistics. Measurement. (2019) 146:65–71. doi: 10.1016/j.measurement.2019.06.024
34. Aslam M. Radar data analysis in the presence of uncertainty. Eur J Remote Sensing. (2021) 54:140–4. doi: 10.1080/22797254.2021.1886597
Keywords: regression, correlation, classical statistics, neutrosophic statistics, cancer data analysis
Citation: Aslam M and AL-Marshadi AH (2022) Dietary Fat and Prostate Cancer Relationship Using Trimmed Regression Under Uncertainty. Front. Nutr. 9:799375. doi: 10.3389/fnut.2022.799375
Received: 21 October 2021; Accepted: 14 February 2022;
Published: 10 March 2022.
Edited by:
Md Anwarul Azim Majumder, The University of the West Indies, Cave Hill, BarbadosReviewed by:
Surapati Pramanik, Nandalal Ghosh B.T. College, IndiaCopyright © 2022 Aslam and AL-Marshadi. This is an open-access article distributed under the terms of the Creative Commons Attribution License (CC BY). The use, distribution or reproduction in other forums is permitted, provided the original author(s) and the copyright owner(s) are credited and that the original publication in this journal is cited, in accordance with accepted academic practice. No use, distribution or reproduction is permitted which does not comply with these terms.
*Correspondence: Muhammad Aslam, YXNsYW1fcmF2aWFuQGhvdG1haWwuY29t; YWFsbWFyc2hhZGlAa2F1LmVkdS5zYQ==; orcid.org/0000-0003-0644-1950
Disclaimer: All claims expressed in this article are solely those of the authors and do not necessarily represent those of their affiliated organizations, or those of the publisher, the editors and the reviewers. Any product that may be evaluated in this article or claim that may be made by its manufacturer is not guaranteed or endorsed by the publisher.
Research integrity at Frontiers
Learn more about the work of our research integrity team to safeguard the quality of each article we publish.