 Jia Hu1,2,3†Yi Zhong4†WenXin Ge4Huiling Lv1Ziyao Ding3,5Di Han3Bo Hai3Hui Shen2,3Jieyun Yin4Aihua Gu1*Haibing Yang1,2,3*
- 1State Key Laboratory of Reproductive Medicine, School of Public Health, Nanjing Medical University, Nanjing, China
- 2Suzhou Institute of Advanced Study in Public Health, Gusu School, Nanjing Medical University, Suzhou, China
- 3Suzhou Center for Disease Prevention and Control, Suzhou, China
- 4Jiangsu Key Laboratory of Preventive and Translational Medicine for Geriatric Diseases, School of Public Health, Medical College of Soochow University, Suzhou, China
- 5Institute of Child and Adolescent Health, School of Public Health, Peking University, Beijing, China
Objective: To estimate whether the new obesity indicator tri-ponderal mass index (TMI) has a better capacity to predict adolescent hypertension (HTN) and HTN subtypes at three separate blood pressure (BP) visits than the conventionally used body mass index (BMI).
Methods: A total of 36,950 adolescents who had initial normal BP from 2012 to 2019 were included in Suzhou, China. HTN was defined as having three separate visits of elevated BP in 2020. The area under the receiver-operating characteristic curve (AUC), false-positive rate, false-negative rate, total misclassification rates, net reclassification improvement (NRI), and integrated discrimination improvement were calculated to compare the discriminative ability of HTN between BMI and TMI.
Results: TMI had better predictive abilities than BMI among all of the participants when predicting HTN (difference in AUC = 0.019, 95% CI = 0.007–0.031; NRI = 0.067, 95% CI = 0.008–0.127) and isolated systolic hypertension (difference in AUC = 0.021, 95% CI = 0.005–0.036; NRI = 0.106, 95% CI = 0.029–0.183). The difference in prediction abilities between BMI and TMI was more obvious in the subgroup of age ≥16. Also, TMI outperformed BMI in predicting adolescent HTN in girls but not in boys.
Conclusion: Compared with BMI, TMI may have a better predictive capacity for HTN, particularly in girls and older adolescents. TMI has the potential to be used as an effective predictor for HTN in clinic practice. Further studies are needed to verify the utility of TMI.
Introduction
Hypertension (HTN) is a widespread chronic disease that receives increased global health attention, especially in pediatric populations (1, 2). The prevalence of HTN among children aged 6–19 has increased by 75–79% in the past 15 years (2). Nevertheless, the diagnosis rate of adolescent HTN needs to be improved. In Europe and the US, only 13–26% of children with HTN were properly identified (3). Additionally, adolescent HTN has been identified as an established risk factor for cardiovascular disease (4–6), organ damage (7), and premature death (8), and may turn into adulthood HTN (9–11). Therefore, to reduce the potential burden of disability and premature death, early and precise detection of HTN in children and adolescents is in need.
The measurement of HTN in children and adolescents is more unstable and complicated than in adults (2) due to regression to the mean (12), the “white-coat” effect (13), and anxiety (14). However, numerous studies suggested that the prevalence of HTN validated by multiple BP measurements is considerably lower than that of elevated BP defined by a single visit in children and adolescents (15–17). A systematic review indicated that the overall prevalence of elevated BP in participants aged 3–20 decreased from 12.1% at the first visit to 5.6 and 2.7% at the second and third visits, respectively (18). Therefore, HTN assessment based on three separate BP visits is required for an accurate understanding of BP levels in children and adolescents, which have been recommended by the latest standards in many countries (19–21).
In general, adolescents with overweight and obesity were more susceptible to HTN than normal weight individuals, regardless of sex (22). It is well acknowledged that the increased prevalence of pediatric HTN couples with the obesity epidemic (23). Body mass index (BMI), a measurement based on a person’s height and weight, is the current screening standard for obesity. However, it has been revealed that BMI does not distinguish between fat mass and lean mass (24). Generally, weight is not proportional to height squared in children and adolescents, resulting in BMI instability (25, 26). To compensate for the significant changes in BMI during childhood, age-in-month cutoffs have been widely used (27). Nevertheless, the cutoffs are multiple and complex, with many age- and sex-specific thresholds.
Recently, Peterson et al. (28) found that tri-ponderal mass index (TMI, measured in kg/m3), an emerging indicator of obesity, may perform as a more valid obesity indicator to measure body fat in adolescents. Unlike BMI, TMI is relatively stable during adolescence, and its centile cutoffs fluctuate within a narrow range. Wang et al. have suggested a threshold with only four cutoffs to screen for overweight and obesity in children aged 7–18 years (29). Additionally, TMI has a lower overall misclassification rate than BMI in discriminating central obesity and HTN in overweight adolescents (30). Hence, TMI was considered a more reliable index for overweight and obesity (28–30). However, a systematic review (31) concluded that evidence of whether TMI outperforms BMI in identifying BP remains limited and inconsistent, while prospective reports are insufficient. In addition, whether TMI outperforms BMI in predicting HTN measured by three separate times is far from the conclusion.
Therefore, we used data through three separate BP visits from the Health Promotion Program for Children and Adolescents (HPPCA) in Suzhou of China to verify whether TMI has better accuracy than BMI in discriminating adolescent HTN and HTN subtypes.
Materials and methods
Study design and participants
This study was a retrospective cohort analysis based on HPPCA data for nine consecutive years (from 2012 to 2020). HPPCA is a large-scale ongoing school-based monitoring program conducted in Suzhou, China. Detailed information about HPPCA was published in the previous studies (32, 33). In brief, HPPCA provided free annual health check-ups for all school-based students aged 6–17 years in Suzhou to assess the growth and development of children and adolescents. Students are examined in general hospitals, centers for disease prevention and control, or community medical institutions. Students in the third year of junior high school or senior high school who would take other special physical examinations for school entrance were excluded from the study because their data are not currently accessible.
To figure out the epidemic status of HTN among adolescents in Suzhou, we selected 66 junior or senior high schools attending HPPCA to conduct specific BP surveillance in 2020. All participants who had elevated BP in the first BP measurement were included in the second visit at least 2 weeks later; only those with elevated BP at the second visit were included in the third visit. To eliminate the “white-coat” effect, the second and third BP measurements were conducted by a familiar school nurse of the particular student, following the same criteria as the HPPCA. Almost all students with elevated BP at their first (follow-up rate: 97.16%) or second (follow-up rate: 98.01%) visit participated in the follow-up BP measurement, except for children who transferred to another school or took extended sick leave. The initial sample consisted of 46,788 school-based adolescents aged 12–17 years. To accurately portray the morbidity of HTN in adolescents, we used the 2020 surveillance data as an endpoint and excluded 9,838 children with elevated BP at their initial HPPCA visit from 2012 to 2019. Figure 1 shows the flowchart of the detailed study design, which was coherent with other large-scale surveillance studies in China (17, 34).
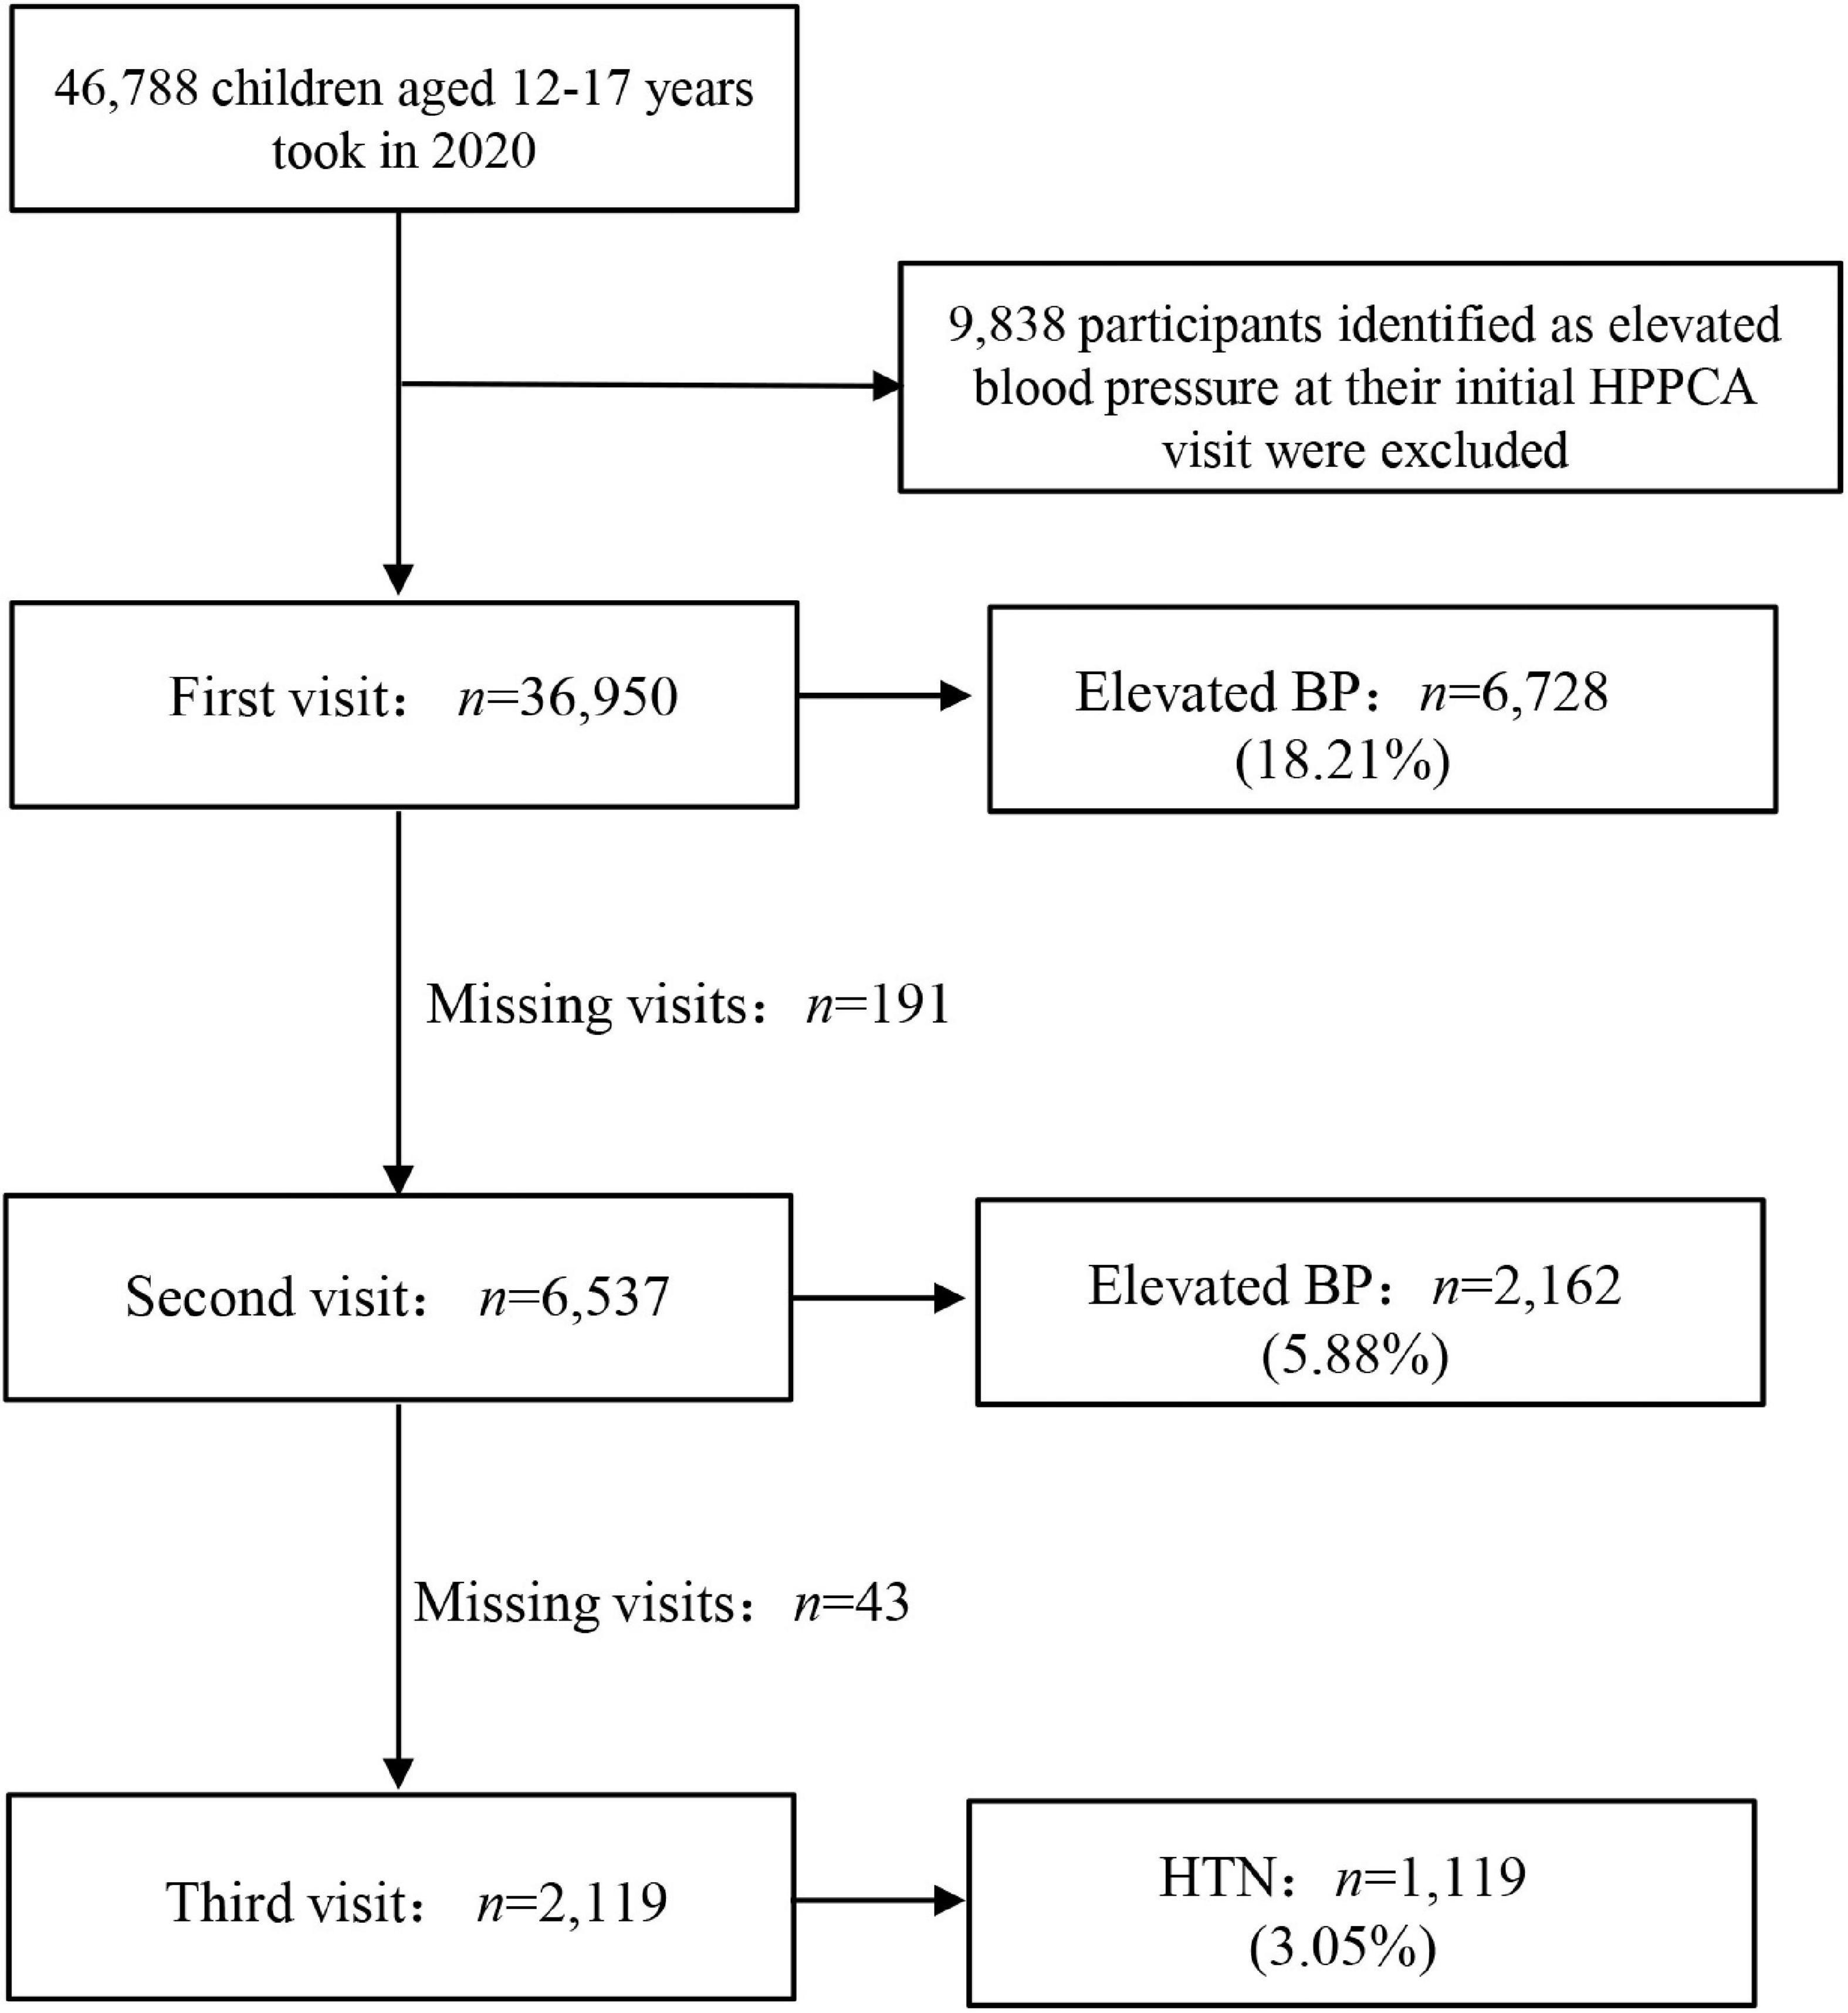
Figure 1. Details of the study population selection. HPPCA, health promotion program for children and adolescents; BP, blood pressure; HTN, hypertension.
This study was approved by the Ethics Committee of the Suzhou Center for Disease Prevention and Control (No. SZJK2020-XW001). Written informed consent was obtained from all the participants or their guardians.
Anthropometric measurements and weight status classification
All physical examinations were performed by well-trained health professionals using the same type of age-appropriate equipment and following the same procedures. Participants were requested to remove their shoes and wear light clothing before being measured to an accuracy of 0.1 cm (height) and 0.1 kg (weight). BMI is calculated as weight (kg) divided by the square of height (m), whereas TMI is calculated as weight (kg) divided by the cube of height (m).
Participants were classified as underweight, normal weight, overweight, and obesity according to the latest Chinese pediatric standards of age- and sex-specific BMI cutoffs (21) and the TMI criteria proposed by Wang et al. (29) on a Chinese population, respectively. Noteworthy, the TMI cutoffs to define adolescent overweight and obesity were 13.1 and 14.1 kg/m3 for participants under 16, respectively (29). The corresponding TMI cutoffs for those aged 16 or over were 14.0 and 15.8 kg/m3, respectively (29).
Blood pressure measurements and definitions
The BP of children and adolescents was measured each visit on the right arm using a clinically validated Electronic Blood Pressure Monitor (i.e., Omron HBP1300, HBP1320) of appropriate size after a 15 min sit-down rest period in a quiet environment. The BP device was placed at the same level as the participant’s heart and right arm cuff. Three consecutive BP values were measured at 2-min intervals for each visit, and the average of the two closest BP readings was recorded for diagnosis and statistical analysis.
BP status was also categorized according to the Chinese standard “Reference of screening for elevated BP among children and adolescents aged 7∼18 years” (WS/T 610-2018) (21). Elevated BP was defined as systolic blood pressure (SBP), diastolic blood pressure (DBP), or both equal to or above the age-, sex-, and height-specific 95th percentile. Notably, HTN is diagnosed only when elevated BP is present at all three separate visits (21). Based on 3 separate visits, isolated systolic hypertension (ISH), isolated diastolic hypertension (IDH), and systolic and diastolic hypertension (SDH) was defined as SBP ≥ P95 and DBP < P95, DBP ≥ P95 and SBP < P95, and SBP ≥ P95 and DBP ≥ P95, respectively.
Statistical analysis
The basic information about the participants was described in the total sample and by age and sex. Continuous variables were expressed as mean ± standard deviation (SD), and categorical variables were described as n (%). Student’s t-test and Chi-square test were used to compare differences between groups, respectively.
The AUC, the false-positive rate (FPR), the false-negative rate (FNR), and total misclassification rates were used to directly measure the discrimination ability between youth BMI and TMI. The net reclassification improvement (NRI) measures the correct movement in categories—upwards for events and downwards for non-events—using reclassification tables constructed separately for participants with and without events (35). We only obtained continuous NRI because no established NRI categories guide clinical decisions for HTN risk in Chinese children were found. The integrated discrimination improvement (IDI) essentially measures how the R2 (explained variance) improves when a new risk factor is introduced (36). Analyses were conducted using SAS statistical software (version 9.4, SAS Institute) and R (version 4.2.0, R Foundation for Statistical Computing). All reported P-values were two-tailed, and P < 0.05 was considered statistically significant.
Results
Baseline characteristics of the participants
The overall population consists of 36,950 adolescents aged 12–17 years from HPPCA in 2020. Table 1 demonstrates the primary characteristic of the overall participants. A total of 18,797 boys account for 50.87% of the overall population. The average age of the overall population was 14.39 (SD = 1.68) in 2020. Compared with girls, boys had higher BMI (21.42 vs. 20.45 kg/m2, P < 0.001). According to BMI cutoffs, the prevalence of overweight and obesity among adolescents in 2020 was 17.20 and 10.28%, respectively. According to TMI cutoffs, the corresponding prevalence was 13.27 and 18.97%. Comparisons between included and excluded populations from the first visit to the second visit (97.16% of cooperation rate) and the second visit to the third (98.01% of cooperation rate) are shown in Supplementary Tables 1, 2, respectively. The vast majority of the variable characteristics yielded no significant difference between included and excluded populations from the first visit to the second visit. A slight difference was found between included and excluded populations from the second visit to the third visit.
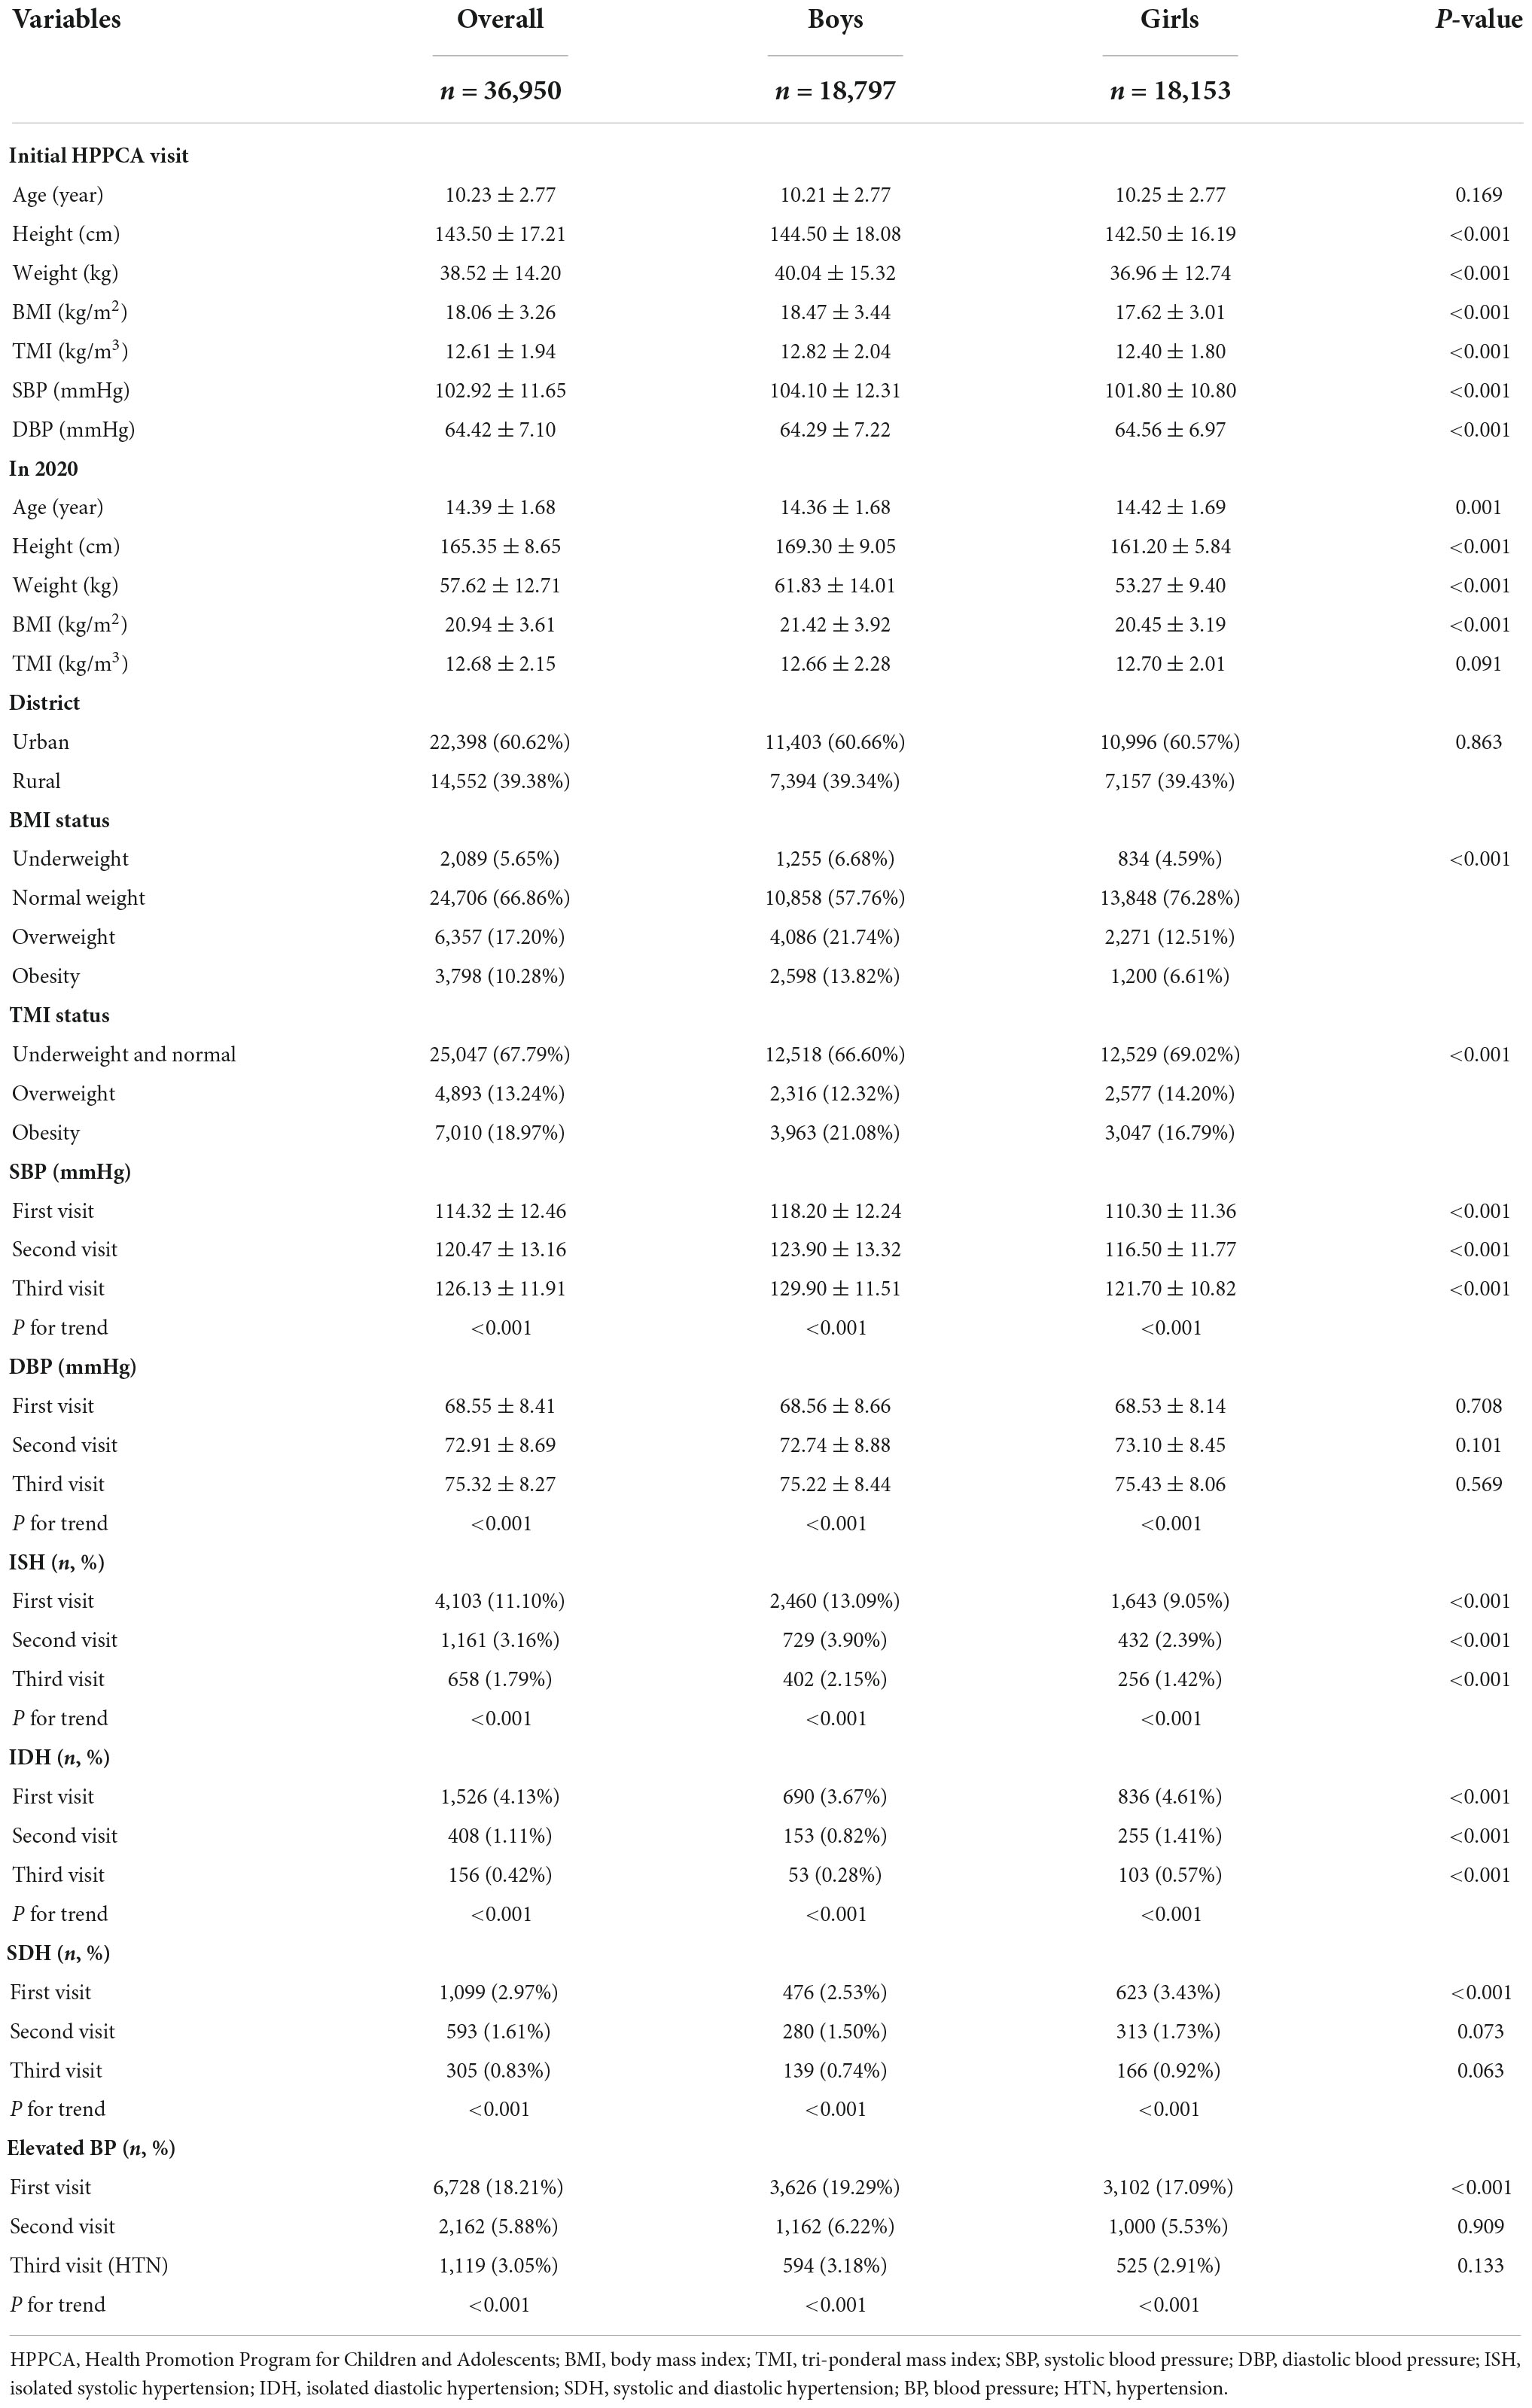
Table 1. Basic characteristics of Chinese adolescents.
After the three visits, the incidence of HTN, ISH, IDH, and SDH decreased to 3.05, 1.79, 0.42, and 0.83%, respectively. During the three visits, boys had higher SBP and prevalence of ISH than girls, while girls had a higher prevalence of IDH than boys (all P < 0.05).
Analysis of the anthropometric indicators for predicting hypertension and hypertension subtypes
The comparison predictors (95% CI) of the discriminative ability between TMI and BMI for HTN and HTN subtypes are shown in Tables 2–5. Supplementary Tables 3–6 show detailed results performed by gender. Generally speaking, TMI had higher AUCs than BMI, and its NRIs significantly increased both in HTN (difference in AUC = 0.019, 95% CI = 0.007-0.031; NRI = 0.067, 95% CI = 0.008-0.127) and in ISH (difference in AUC = 0.021, 95% CI = 0.005–0.036; NRI = 0.106, 95% CI = 0.029–0.183).
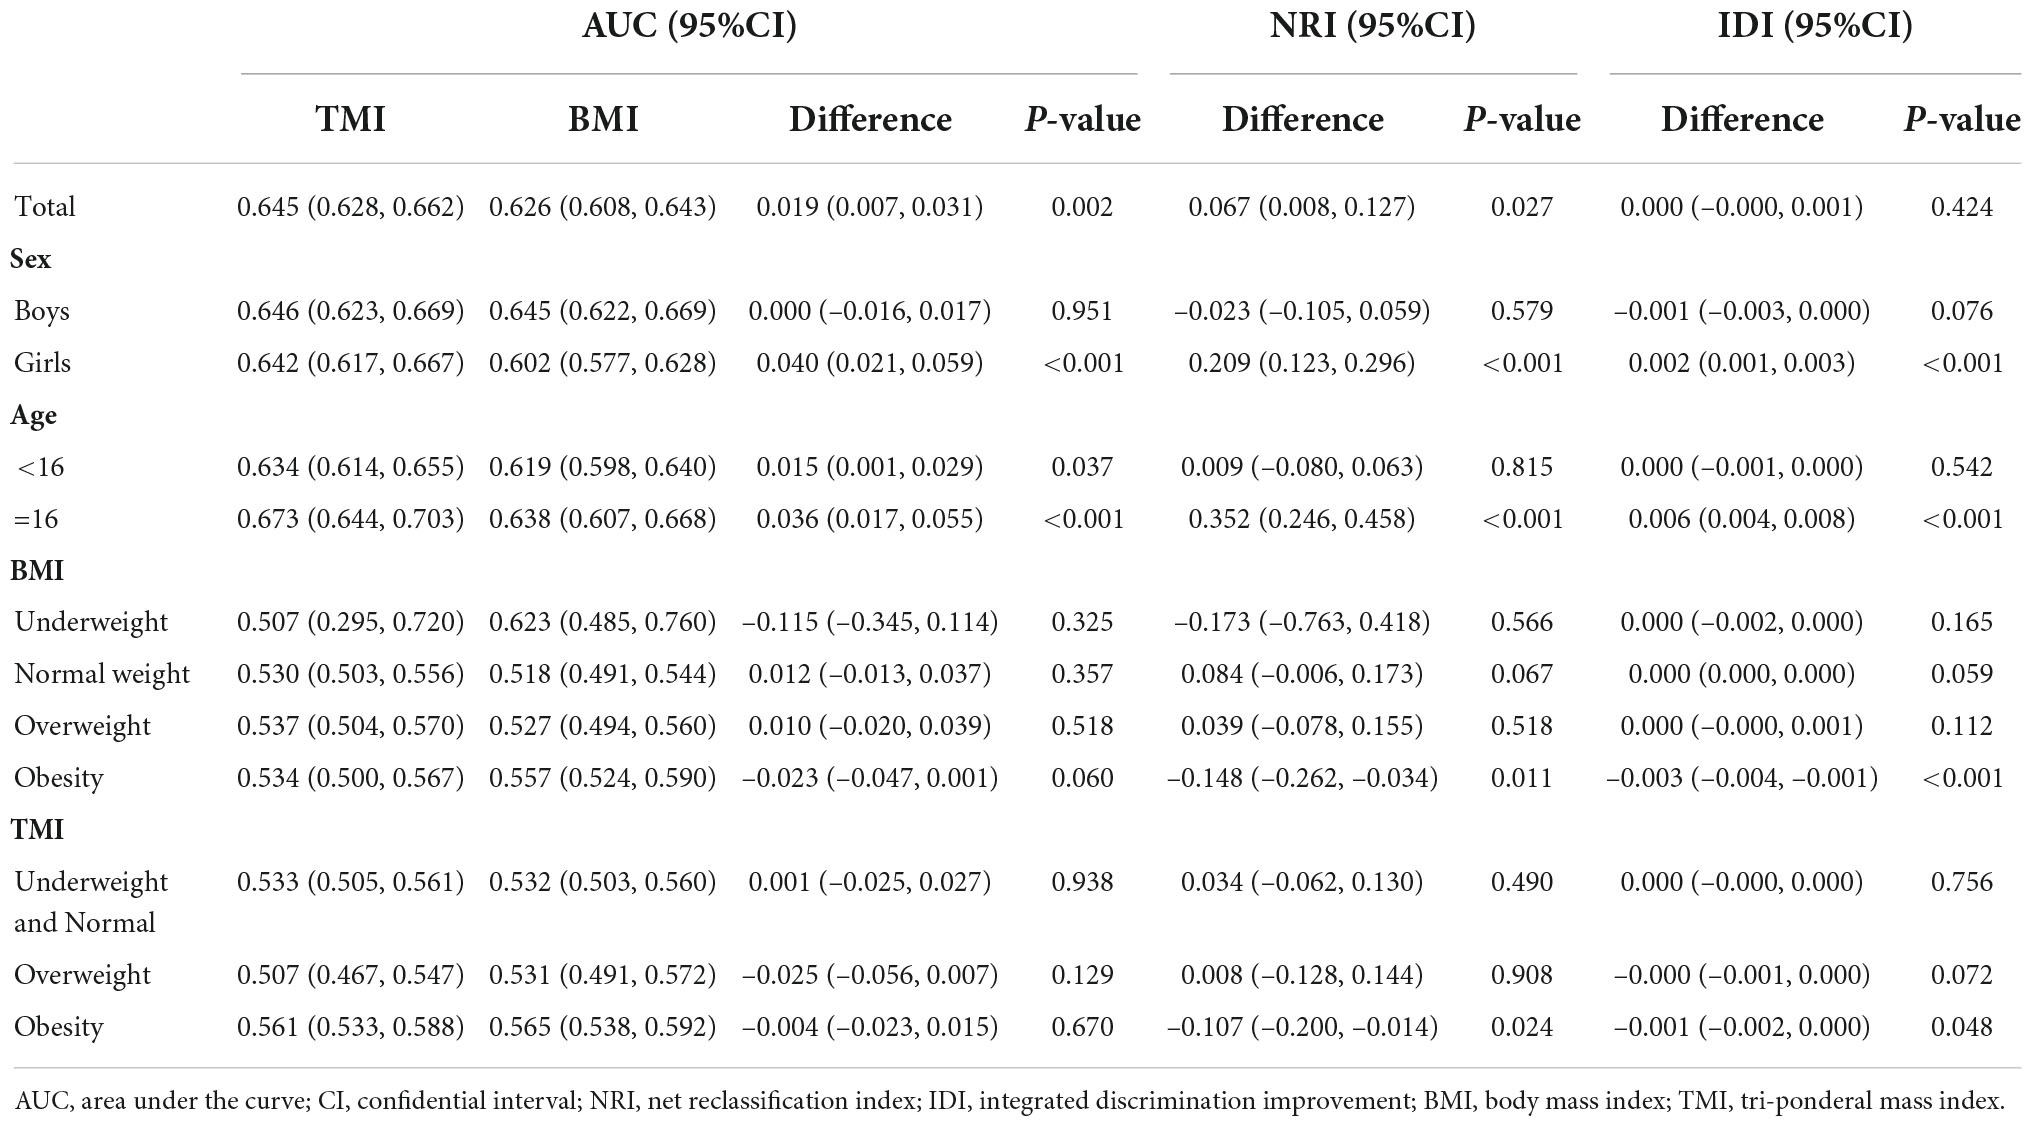
Table 2. Comparison of anthropometric indices in predicting hypertension in Chinese adolescents.
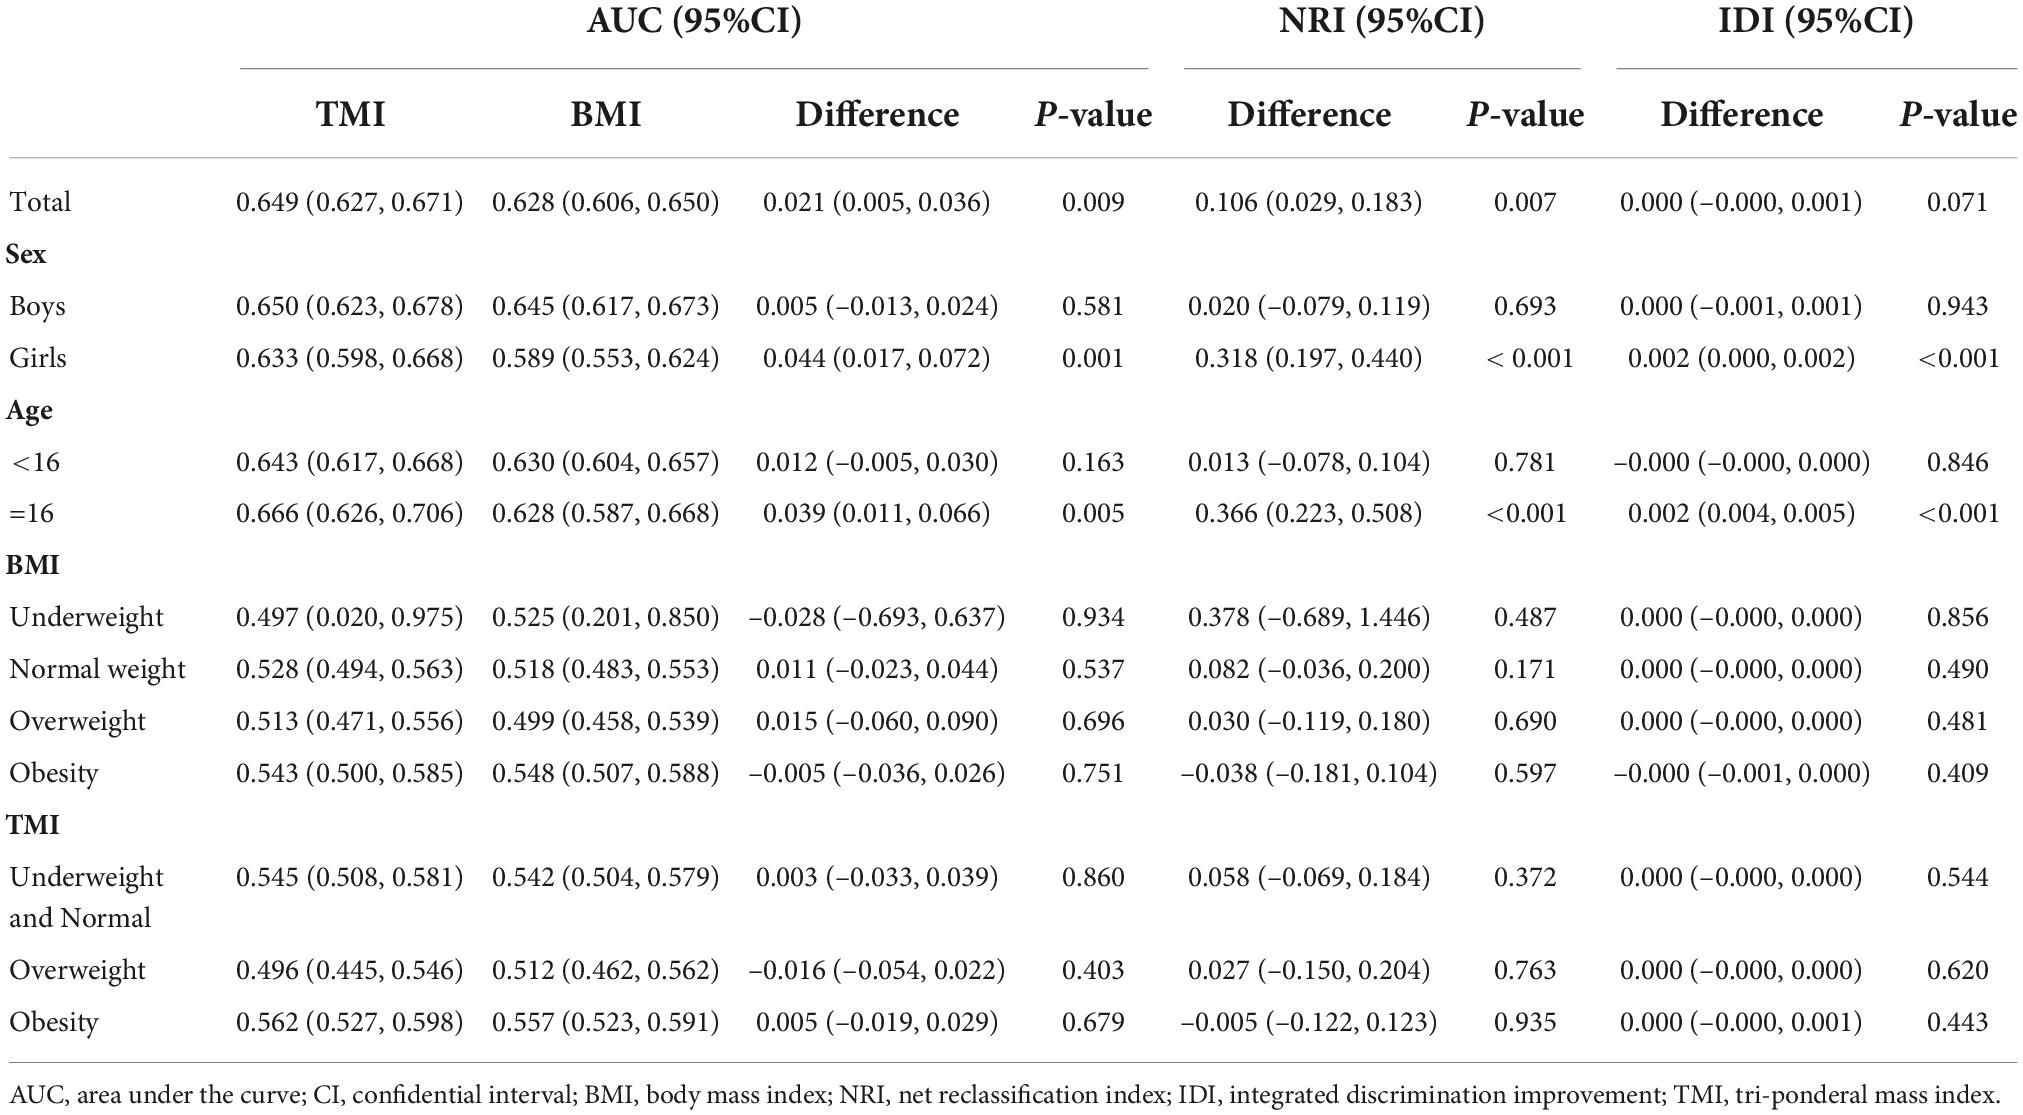
Table 3. Comparison of anthropometric indices in predicting isolated systolic hypertension in Chinese adolescents.
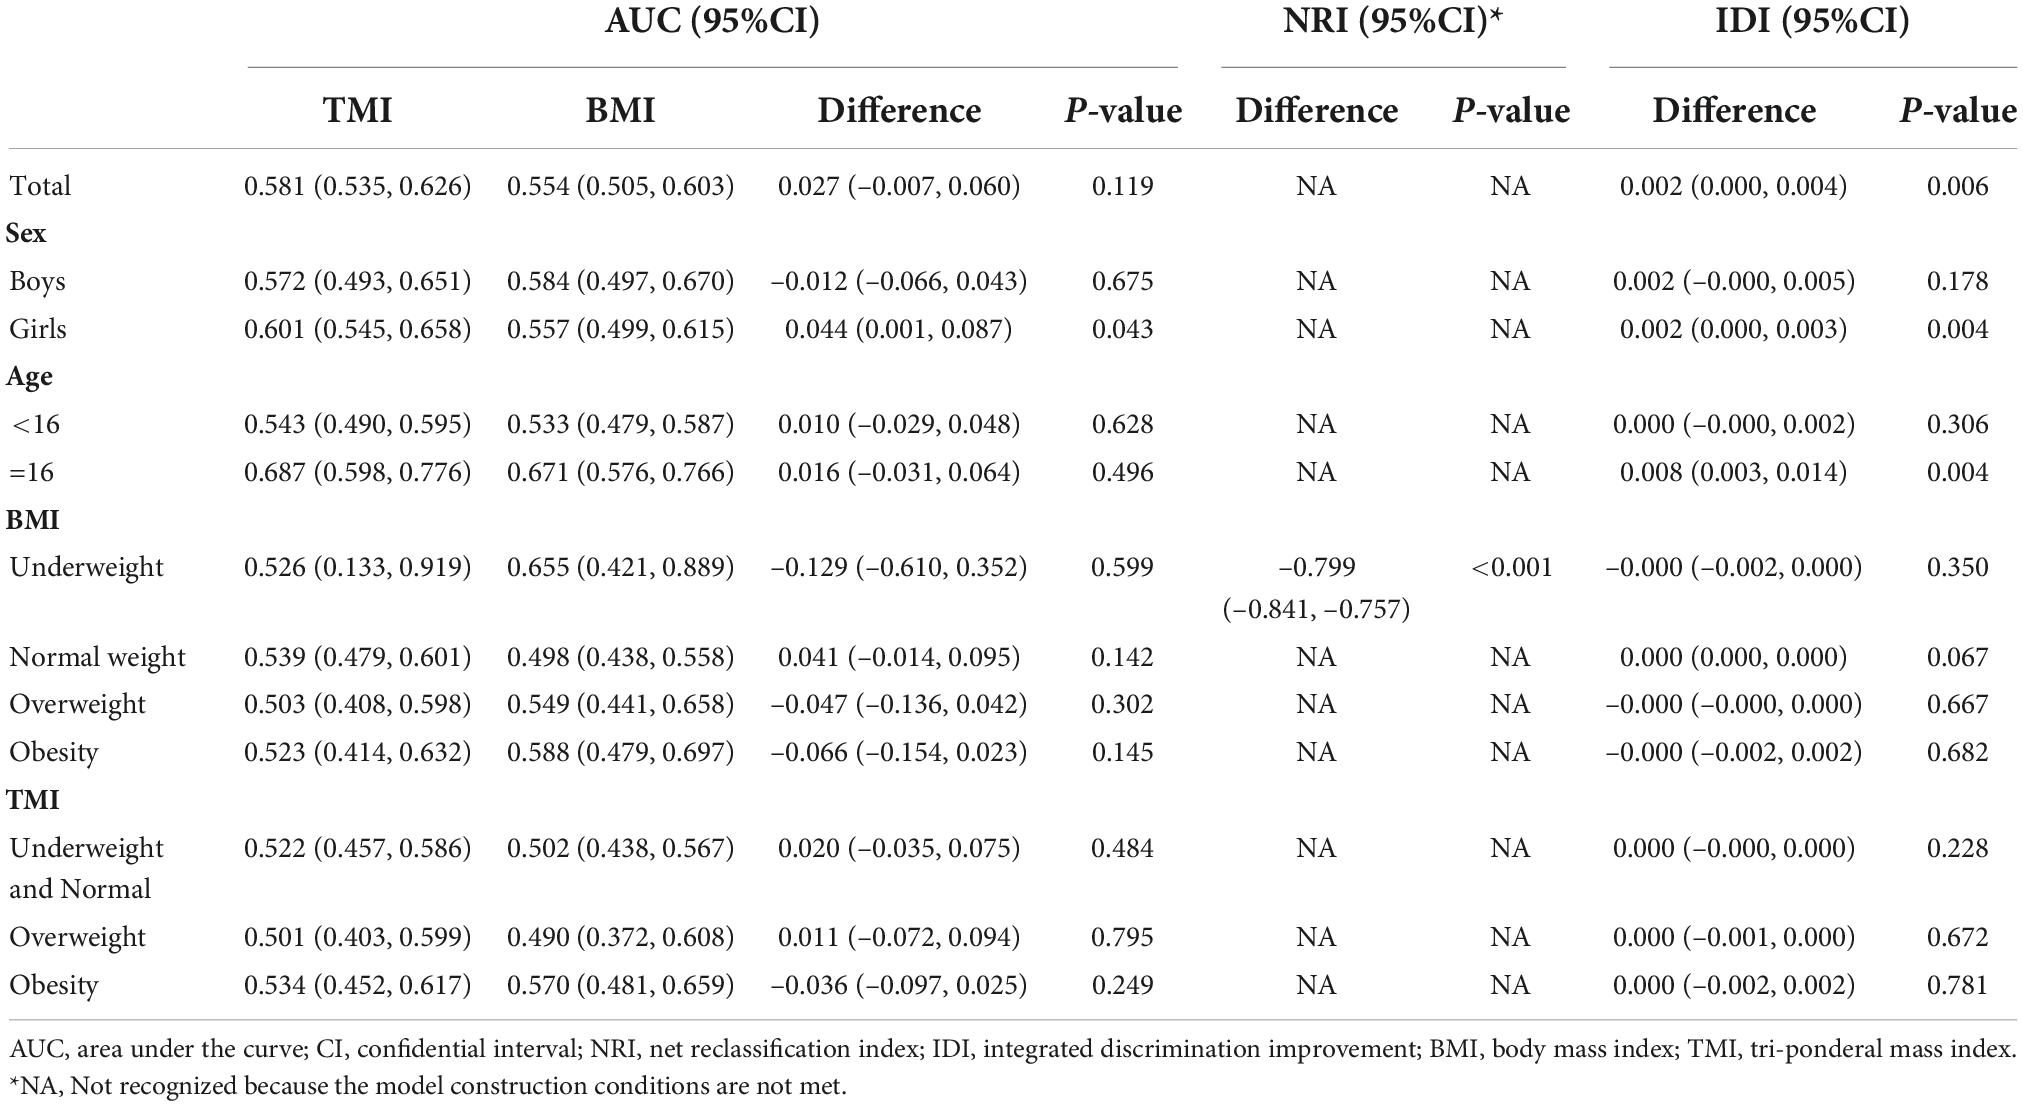
Table 4. Comparison of anthropometric indices in predicting isolated diastolic hypertension in Chinese adolescents.
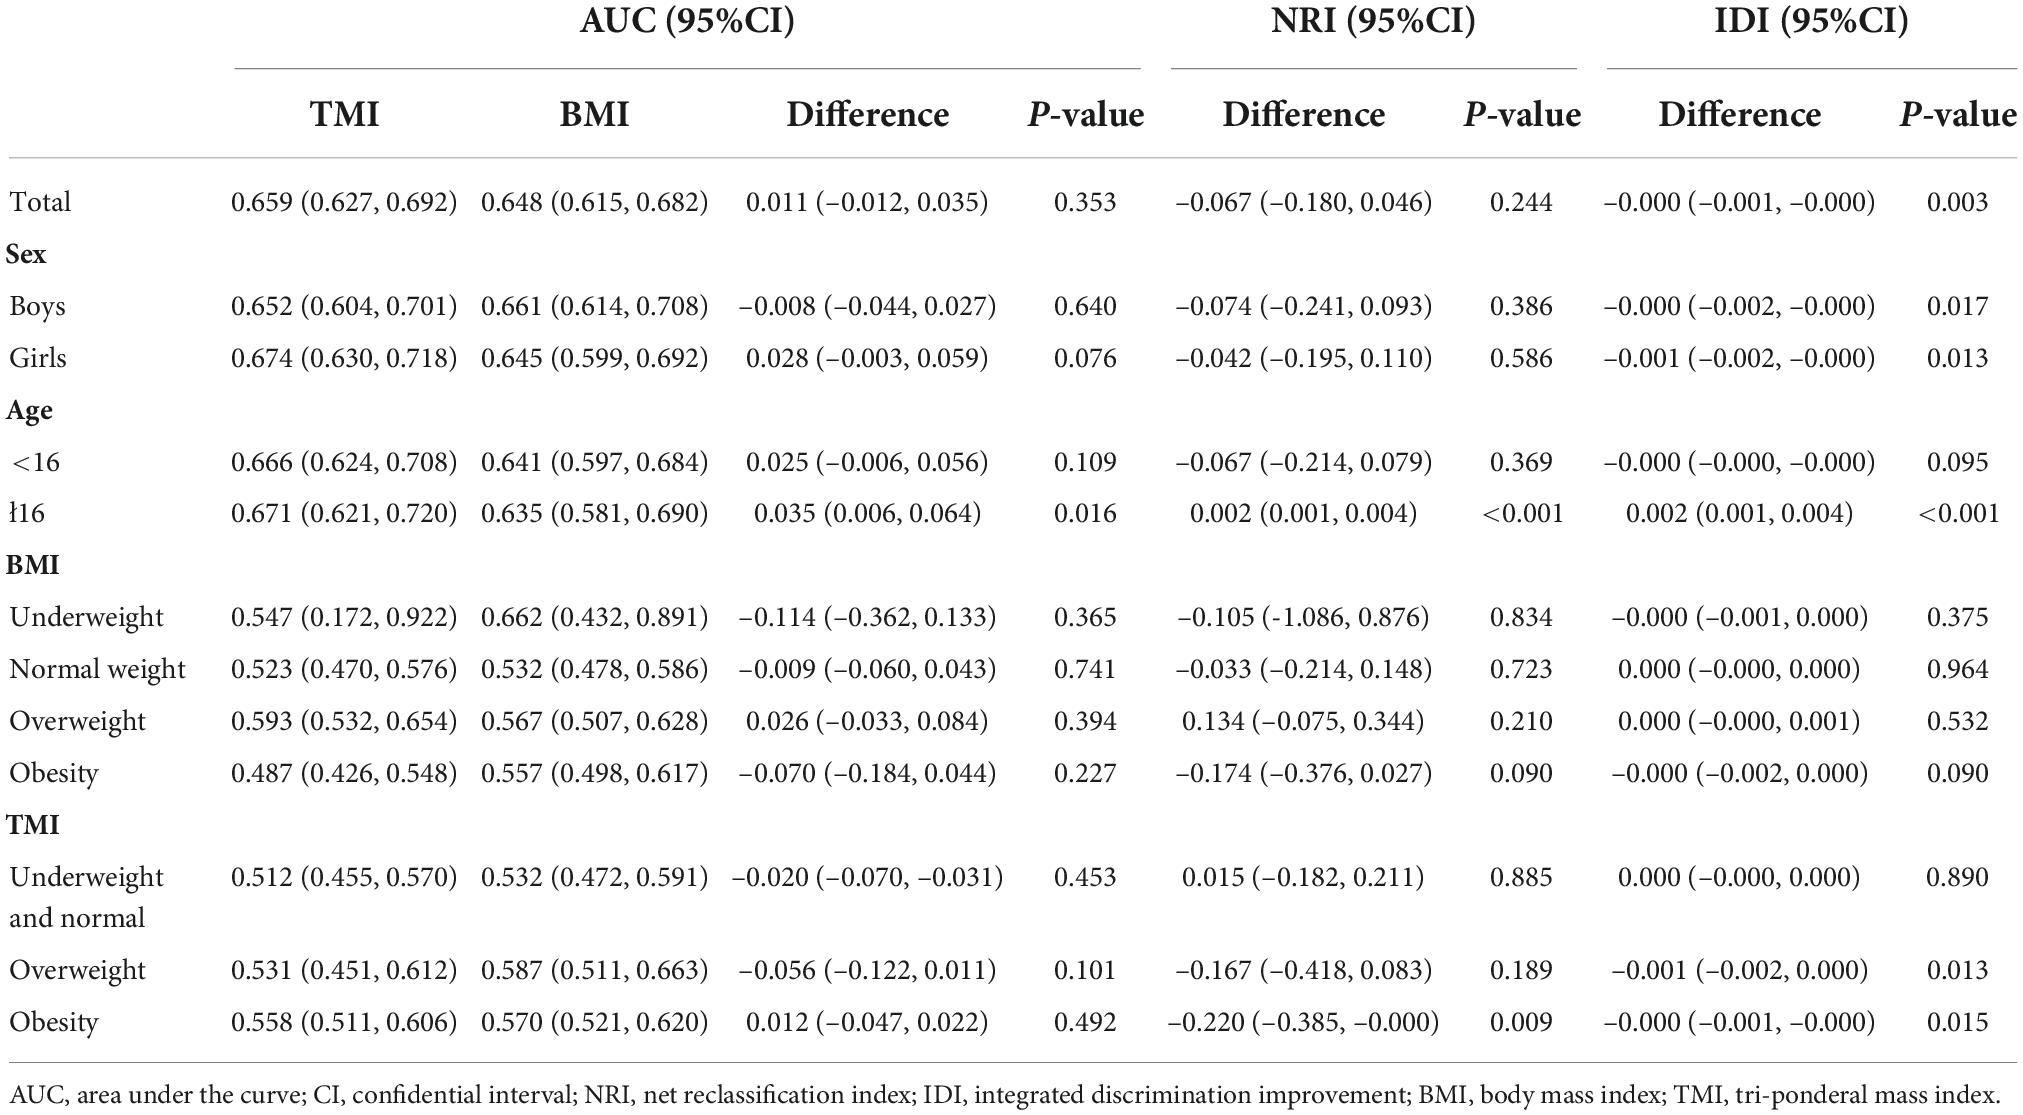
Table 5. Comparison of anthropometric indices in predicting systolic and diastolic hypertension in Chinese adolescents.
When predicting ISH (difference in AUC = 0.039, 95% CI = 0.011–0.066; NRI = 0.366, 95% CI = 0.223–0.508; IDI = 0.002, 95% CI = 0.004–0.005) and SDH (difference in AUC = 0.035, 95% CI = 0.006–0.064; NRI = 0.002, 95% CI = 0.001–0.004; IDI = 0.002, 95% CI = 0.001–0.004), the difference between TMI and BMI were more notable in those with age ≥ 16. For girls, there was a statistically significant difference in the AUCs of TMI vs. BMI for discriminating HTN (difference in AUC = 0.040; 95% CI = 0.021–0.059; NRI = 0.209, 95% CI = 0.123–0.296; IDI = 0.002, 95% CI = 0.001–0.003), ISH (difference in AUC = 0.044; 95% CI, 0.017–0.072; NRI = 0.318, 95% CI = 0.197–0.440; IDI = 0.002, 95% CI = 0.000–0.002), and IDH (difference in AUC = 0.044; 95% CI, 0.001–0.087; IDI = 0.002, 95% CI = 0.000–0.003). No difference was found in the AUCs of TMI vs. BMI for HTN and its subtypes in boys.
As shown in Figure 2, TMI had lower FNR (P < 0.05) but higher FPR (P < 0.001) and total misclassification rates (P < 0.001) in predicting HTN for children compared with BMI. TMI had significantly lower FPR (P < 0.001) and total misclassification rates (P < 0.001) in girls as well as significantly higher FPR (P < 0.05) and total misclassification rates (P < 0.001) in boys. For boys, the FPR, FNR, and total misclassification rates for TMI were 35.0% (95% CI = 34.3–35.7%), 41.4% (95% CI = 37.5–45.4%) and 35.2% (95% CI = 35.2–35.2%), respectively; the corresponding rates for BMI were 33.4% (95% CI = 32.7–34.1%), 43.1% (95% CI = 39.1–47.1%) and 33.7% (95% CI = 33.7–33.7%), respectively. For girls, the FPR, FNR, and total misclassification rates for TMI were 37.0% (95% CI = 36.3–37.7%), 40.0% (95% CI = 35.8–44.2%) and 37.1% (95% CI = 37.1–37.1%), respectively; the corresponding rates for BMI were 41.5% (95% CI = 40.8–42.5%), 42.5% (95% CI = 38.2–46.7%) and 41.6% (95% CI = 41.6–41.6%), respectively. In total, the FPR, FNR, and total misclassification rates for TMI were 31.0% (95% CI = 30.6–31.5%), 46.7% (95% CI = 43.8–49.7%) and 31.5% (95% CI = 31.5–31.5%), respectively; the corresponding rates for BMI were 29.7% (95% CI = 29.2–30.1%), 51.0% (95% CI = 48.1–54.0%) and 30.3% (95% CI = 30.3–30.3%), respectively.
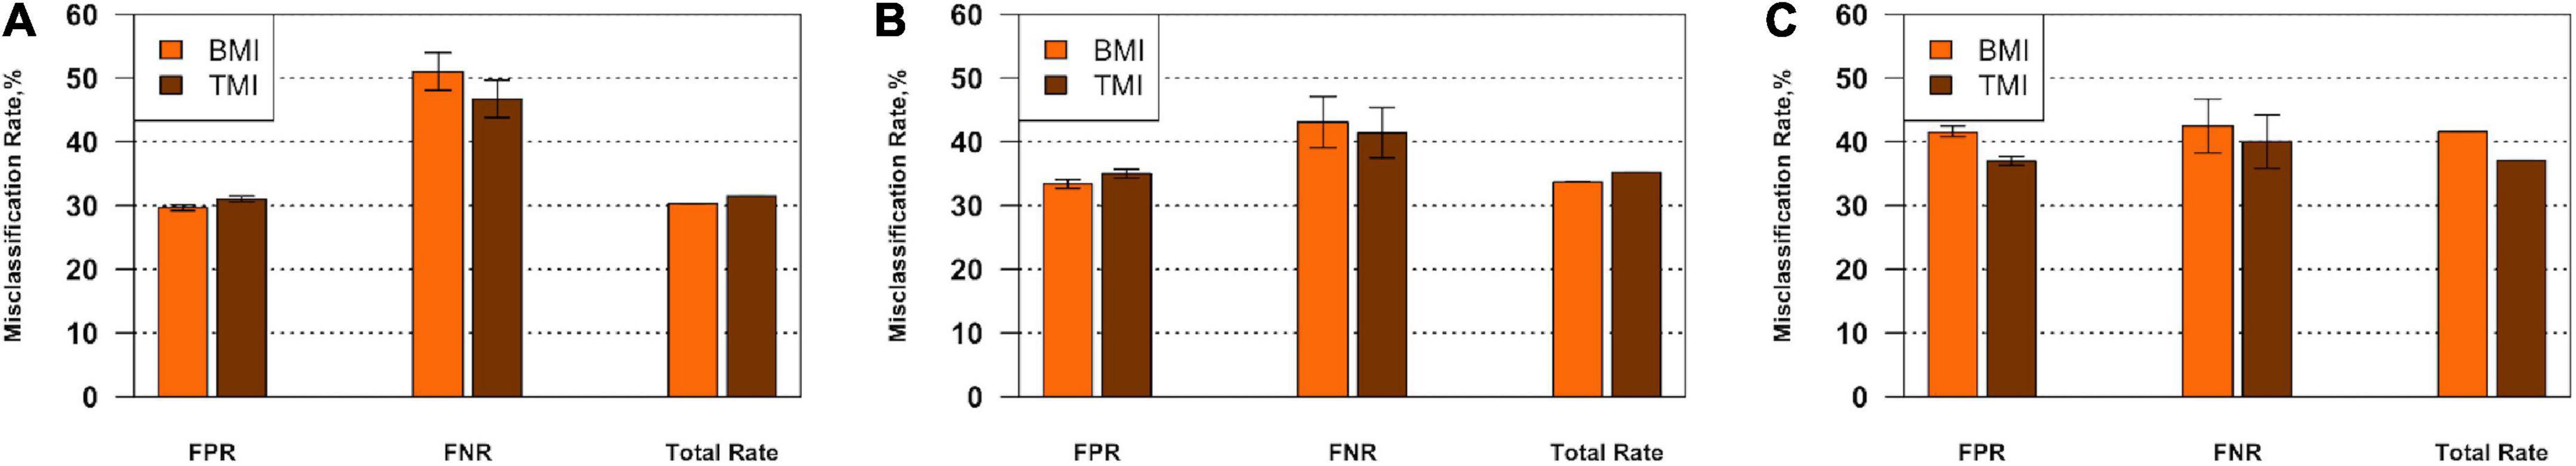
Figure 2. FPR, FNR, and total misclassification rates with 95% confidential intervals for TMI vs. BMI in predicting HTN in overall participants (A), boys (B), and girls (C) aged 12–17 years, respectively. BMI, body mass index; TMI, tri-ponderal mass index; FPR, false-positive rate; FNR, false-negative rate; HTN, hypertension.
Discussion
In this study, we assess the capacity of TMI and BMI to predict adolescent HTN and HTN subtypes. Our study found that TMI slightly outperformed BMI in predicting adolescent HTN and ISH. Additionally, TMI may have a stronger predictive power for HTN in girls, while no difference was observed in boys. Considering age, it showed higher discrimination power in predicting HTN for the subgroup of age ≥ 16 than its counterparts.
Several studies have reported a positive correlation between weight gain and BP levels in children and adolescents (17, 34, 37, 38). However, there were limited studies that compared the correlation of TMI and BMI with BP, as summarized in a systematic review (31). According to Wang et al. (39), TMI outperformed BMI in detecting children and adolescents with HTN in the Chinese population. A similar finding was obtained in Italian research (30), in which the total misclassification rate of TMI in predicting HTN in adolescents was around one-third of the BMI percentile. In a longitudinal analysis, the current study’s findings support that TMI had a better ability to predict teenage HTN than BMI. We hypothesized that this might be related to the fact that TMI in children and adolescents correlates with body fat percent equal to or better than BMI (28, 40, 41) and has a superior ability to predict central obesity (30).
When it comes to subtypes of adolescent HTN, we found that TMI outperformed BMI in predicting adolescent ISH. However, TMI and BMI did not differ in predicting IDH or SDH. This disparity can be explained because obesity primarily impacts central pulsatile hemodynamic alterations, which are directly related to increased SBP, but has little effect on DBP (42). Previous finding revealed that SBP increases more stable yearly from childhood to adulthood compared with DBP (43). Furthermore, adolescents with a higher BMI were reported to have higher left ventricular weight, aortic wave amplitude, and SBP than their normal-weight counterparts (44).
Interestingly, we discovered that TMI outperformed BMI when diagnosing adolescent HTN in girls but not in boys. In detail, TMI had lower rates of false positives and total misclassification than BMI in girls but had the opposite results in boys. The disparity could be attributed to hormonal and puberty differences between boys and girls (45, 46). A previous study found that TMI performed better in predicting obesity in girls (29). Therefore, TMI may also have better prediction performance on girls’ HTN. Additionally, we discovered that the difference between BMI and TMI for predicting ISH and SDH was more obvious in the subgroup of age ≥ 16, while such a difference was not found in the subgroup of age < 16. Wang et al. revealed that the accuracy of TMI classification of overweight and obesity increased along with age, especially after the age of 16 (29). As a result, this disparity could be that TMI’s predictive power increases with age and does not significantly outperform BMI until late adolescence.
According to a systematic review by Sun et al. (31), TMI can better discriminate central obesity and reflect body fat storage. Earlier studies (47) have also reported that an index based on cubic powers of height predicts obesity equal to or better than BMI. Thus, an increasing number of researchers (28–30) recommend the use of TMI to detect body fat in adolescents. Based on previous researches (30, 39), we assume that TMI has a better predictive power for adolescent BP than BMI. TMI cut-off values can be considered a satisfactory alternative indicator to screening for obesity risk in children and adolescents due to the low fluctuations in TMI with age. As proposed previously by Wang et al. (29), TMI cut-off values can significantly reduce the amount of computation and complexity required for overweight and obesity screening compared to previous BMI-based screening. These could assist more primary health care workers in effectively identifying and better preventing and controlling obesity.
The current study has many significant advantages. First, this study was a retrospective investigation employing a longitudinal methodology. Compared to previous cross-sectional studies (30, 39), the fluctuations in height, body fat percentage, and BP during adolescence were fully considered. To the best of our knowledge, among the studies comparing TMI with BMI on teenage HTN, the current study is the first to include all subtypes and employ BP effects at three visits, which significantly reduced the misdiagnosis rate of HTN. The second and third BP measures in this study were taken by known school nurses on the campus of the specific students, which could be advantageous in eliminating the “white-coat” effect. Moreover, the 2020 specific BP surveillance showed a good collaboration level, with 97.16% for the second and 98.01% for the third visit. Additionally, the large sample size and standard measurement data obtained from this study’s general population improve the conclusions’ robustness.
Study limitations
First, this study recruited adolescents from Suzhou, a developed location in eastern China that is geographically restricted and not representative of other regional or ethnic groups. Second, the second or third BP visit was only for children with elevated BP diagnosed at the previous visit, as recommended by other large-scale surveillance studies (21). Children with BP < P95 at the first or second visit were not followed at the subsequent visit, which may underestimate the prevalence of HTN. Besides, not every child with BP ≥ P95 at the first or second visit was enrolled at the subsequent visit. However, the cooperation rates were around 98%, and the included group was generally representative of the overall population. And the subtle difference in characteristics in population from the second visit to the third visit could be attributed to increased variability from a smaller sample size during the third visit. Additionally, we were unable to compare the validity of all obesity indicators for predicting HTN because information such as waist circumference and the waist-to-height ratio was not collected.
Conclusion
TMI was a more reliable index of adolescent HTN and ISH than BMI, although differences exist between age and sex stratums. However, there was a comparable performance in the prediction of IDH and SDH. In contrast to the complex BMI-for-age charts, the cutoffs for TMI are greatly simplified. Therefore, the application of TMI may promote the primary prevention of adolescent HTN and health management of children. In the future, results of our studies should be replicated in large cross-sectional and longitudinal studies in other racial and ethnic population. In addition, longer follow-up studies that continue into adulthood should be conducted to assess the relative merits of TMI and BMI in the prediction of HTN. Besides, future studies would verify TMI’s utility in clinical practice and eventually contribute to establishing an optimum standard of TMI.
Data availability statement
The raw data supporting the conclusions of this article will be made available by the authors, without undue reservation.
Ethics statement
The studies involving human participants were reviewed and approved by the Ethics Committee of Suzhou Center for Disease Prevention and Control. Written informed consent to participate in this study was provided by the participants’ legal guardian/next of kin.
Author contributions
HY and AG contributed to the design and concept of the manuscript. JH and YZ were responsible for the analysis, interpretation of data, and manuscript drafting. DH, ZD, and BH organized the database. WG and HL performed the statistical analysis. HS and JY were responsible for the critical revision of the manuscript for intellectual content. All authors wrote the manuscript and had final approval of the submitted and published versions.
Funding
This study was supported by the National Natural Science Foundation of China (81602911 and 82204070), Priority Academic Program Development of Jiangsu Higher Education Institutions (PAPD), and Gusu Health Talents Program Training Project in Suzhou, China (GSWS2020100).
Conflict of interest
The authors declare that the research was conducted in the absence of any commercial or financial relationships that could be construed as a potential conflict of interest.
Publisher’s note
All claims expressed in this article are solely those of the authors and do not necessarily represent those of their affiliated organizations, or those of the publisher, the editors and the reviewers. Any product that may be evaluated in this article, or claim that may be made by its manufacturer, is not guaranteed or endorsed by the publisher.
Supplementary material
The Supplementary Material for this article can be found online at: https://www.frontiersin.org/articles/10.3389/fnut.2022.1028861/full#supplementary-material
References
1. Mills KT, Stefanescu A, He J. The global epidemiology of hypertension. Nat Rev Nephrol. (2020) 16:223–37. doi: 10.1038/s41581-019-0244-2
2. Song P, Zhang Y, Yu J, Zha M, Zhu Y, Rahimi K, et al. Global prevalence of hypertension in children: A systematic review and meta-analysis. JAMA Pediatr. (2019) 173:1154–63. doi: 10.1001/jamapediatrics.2019.3310
3. Ewald DR, Haldeman Ph DL. Risk factors in adolescent hypertension. Glob Pediatr Health. (2016) 3:2333794x15625159. doi: 10.1177/2333794x15625159
4. Hanevold C, Waller J, Daniels S, Portman R, Sorof J, International Pediatric Hypertension Association. The effects of obesity, gender, and ethnic group on left ventricular hypertrophy and geometry in hypertensive children: A collaborative study of the international pediatric hypertension association. Pediatrics. (2004) 113:328–33. doi: 10.1542/peds.113.2.328
5. Yan Y, Hou D, Liu J, Zhao X, Cheng H, Xi B, et al. Childhood body mass index and blood pressure in prediction of subclinical vascular damage in adulthood: Beijing blood pressure cohort. J Hypertens. (2017) 35:47–54. doi: 10.1097/hjh.0000000000001118
6. Li Y, Haseler E, Chowienczyk P, Sinha MD. Haemodynamics of hypertension in children. Curr Hypertens Rep. (2020) 22:60. doi: 10.1007/s11906-020-01044-2
7. Meng L, Hou D, Zhao X, Hu Y, Liang Y, Liu J, et al. Cardiovascular target organ damage could have been detected in sustained pediatric hypertension. Blood Press. (2015) 24:284–92. doi: 10.3109/08037051.2015.1049424
8. Franks PW, Hanson RL, Knowler WC, Sievers ML, Bennett PH, Looker HC. Childhood obesity, other cardiovascular risk factors, and premature death. N Engl J Med. (2010) 362:485–93. doi: 10.1056/NEJMoa0904130
9. Bao W, Threefoot SA, Srinivasan SR, Berenson GS. Essential hypertension predicted by tracking of elevated blood pressure from childhood to adulthood: The bogalusa heart study. Am J Hypertens. (1995) 8:657–65. doi: 10.1016/0895-7061(95)00116-7
10. Dong Y, Song Y, Zou Z, Ma J, Dong B, Prochaska JJ. Updates to pediatric hypertension guidelines: Influence on classification of high blood pressure in children and adolescents. J Hypertens. (2019) 37:297–306. doi: 10.1097/hjh.0000000000001903
11. Chen X, Wang Y. Tracking of blood pressure from childhood to adulthood: A systematic review and meta-regression analysis. Circulation. (2008) 117:3171–80. doi: 10.1161/CIRCULATIONAHA.107.730366
12. Pocock SJ, Bakris G, Bhatt DL, Brar S, Fahy M, Gersh BJ. Regression to the mean in symplicity htn-3: Implications for design and reporting of future trials. J Am Coll Cardiol. (2016) 68:2016–25. doi: 10.1016/j.jacc.2016.07.775
13. Jurko A Jr., Minarik M, Jurko T, Tonhajzerova I. White coat hypertension in pediatrics. Ital J Pediatr. (2016) 42:4. doi: 10.1186/s13052-016-0213-3
14. Schulte W, Neus H, Thönes M, von Eiff AW. Basal blood pressure variability and reactivity of blood pressure to emotional stress in essential hypertension. Basic Res Cardiol. (1984) 79:9–16. doi: 10.1007/bf01935802
15. Cheung EL, Bell CS, Samuel JP, Poffenbarger T, Redwine KM, Samuels JA. Race and Obesity in Adolescent Hypertension. Pediatrics. (2017) 139:e20161433. doi: 10.1542/peds.2016-1433
16. Zhang Q, Yang L, Zhang Y, Zhao M, Liang Y, Xi B. Hypertension prevalence based on three separate visits and its association with obesity among chinese children and adolescents. Front Pediatr. (2019) 7:307. doi: 10.3389/fped.2019.00307
17. Dong J, Dong H, Yan Y, Cheng H, Zhao X, Mi J, et al. Prevalence of hypertension and hypertension phenotypes after three visits in chinese Urban children. J Hypertens. (2021) 40:1270–7. doi: 10.1097/HJH.0000000000002977
18. Sun J, Steffen LM, Ma C, Liang Y, Xi B. Definition of pediatric hypertension: Are blood pressure measurements on three separate occasions necessary? Hypertens Res. (2017) 40:496–503. doi: 10.1038/hr.2016.179
19. National High Blood Pressure Education Program Working Group on High Blood Pressure in Children and Adolescents. The fourth report on the diagnosis, evaluation, and treatment of high blood pressure in children and adolescents. Pediatrics. (2004) 114:555–76.
20. Flynn JT, Kaelber DC, Baker-Smith CM, Blowey D, Carroll AE, Daniels SR, et al. Clinical practice guideline for screening and management of high blood pressure in children and adolescents. Pediatrics. (2017) 140:e20171904. doi: 10.1542/peds.2017-1904
21. Dong Y, Ma J, Song Y, Dong B, Wang Z, Yang Z, et al. National blood pressure reference for chinese han children and adolescents aged 7 to 17 years. Hypertension. (2017) 70:897–906. doi: 10.1161/HYPERTENSIONAHA.117.09983
22. Zhao W, Mo L, Pang Y. Hypertension in adolescents: The role of obesity and family history. J Clin Hypertens. (2021) 23:2065–70. doi: 10.1111/jch.14381
23. Jiang SZ, Lu W, Zong XF, Ruan HY, Liu Y. Obesity and hypertension. Exp Ther Med. (2016) 12:2395–9. doi: 10.3892/etm.2016.3667
24. Rothman KJ. Bmi-related errors in the measurement of obesity. Int J Obes. (2008) 32(Suppl. 3):S56–9. doi: 10.1038/ijo.2008.87
25. Weber DR, Leonard MB, Zemel BS. Body composition analysis in the pediatric population. Pediatr Endocrinol Rev. (2012) 10:130–9.
26. Cole TJ. Weight/heightp compared to weight/height2 for assessing adiposity in childhood: Influence of age and bone age on P during puberty. Ann Hum Biol. (1986) 13:433–51. doi: 10.1080/03014468600008621
27. Cole TJ, Bellizzi MC, Flegal KM, Dietz WH. Establishing a standard definition for child overweight and obesity worldwide: International survey. BMJ. (2000) 320:1240. doi: 10.1136/bmj.320.7244.1240
28. Peterson CM, Su H, Thomas DM, Heo M, Golnabi AH, Pietrobelli A, et al. Tri-ponderal mass index Vs body mass index in estimating body fat during adolescence. JAMA Pediatr. (2017) 171:629–36. doi: 10.1001/jamapediatrics.2017.0460
29. Wang X, Ma J, Huang S, Dong B, Dong Y, Yang Z, et al. Use of tri-ponderal mass index in predicting late adolescent overweight and obesity in children aged 7-18. Front Nutr. (2022) 9:785863. doi: 10.3389/fnut.2022.785863
30. Malavazos AE, Capitanio G, Milani V, Ambrogi F, Matelloni IA, Basilico S, et al. Tri-ponderal mass index Vs body mass index in discriminating central obesity and hypertension in adolescents with overweight. Nutr Metab Cardiovasc Dis. (2021) 31:1613–21. doi: 10.1016/j.numecd.2021.02.013
31. Sun J, Yang R, Zhao M, Bovet P, Xi B. Tri-ponderal mass index as a screening tool for identifying body fat and cardiovascular risk factors in children and adolescents: A systematic review. Front Endocrinol. (2021) 12:694681. doi: 10.3389/fendo.2021.694681
32. Hu J, Liu J, Wang J, Shen M, Ge W, Shen H, et al. Unfavorable progression of obesity in children and adolescents due to Covid-19 pandemic: A school-based survey in China. Obesity. (2021) 29:1907–15. doi: 10.1002/oby.23276
33. Ge W, Hu J, Xiao Y, Liang F, Yi L, Zhu R, et al. Covid-19 related childhood bmi increases in China: A health surveillance-based ambispective cohort analysis. Am J Prev Med. (2022) S0749-3797:227–226. doi: 10.1016/j.amepre.2022.04.015
34. Liu K, Li C, Gong H, Guo Y, Hou B, Chen L, et al. Prevalence and risk factors for hypertension in adolescents aged 12 to 17 years: A school-based study in China. Hypertension. (2021) 78:1577–85. doi: 10.1161/HYPERTENSIONAHA.121.17300
35. Pencina MJ, D’Agostino RB Sr., D’Agostino RB Jr., Vasan RS Evaluating the added predictive ability of a new marker: From area under the roc curve to reclassification and beyond. Stat Med. (2008) 27:157–72. doi: 10.1002/sim.2929
36. Pencina MJ, D’Agostino RB Sr., Steyerberg EW. Extensions of net reclassification improvement calculations to measure usefulness of new biomarkers. Stat Med. (2011) 30:11–21. doi: 10.1002/sim.4085
37. Sánchez-Zamorano LM, Salazar-Martinez E, Anaya-Ocampo R, Lazcano-Ponce E. Body mass index associated with elevated blood pressure in mexican school-aged adolescents. Prev Med. (2009) 48:543–8. doi: 10.1016/j.ypmed.2009.03.009
38. Montazeri P, Fossati S, Clemente DBP, Cirugeda L, Elosua R, Fernández-Barrés S, et al. Early-childhood bmi trajectories in relation to preclinical cardiovascular measurements in adolescence. J Dev Orig Health Dis. (2022) 13:322–9. doi: 10.1017/s2040174421000441
39. Wang X, Dong B, Ma J, Song Y, Zou Z, Arnold L. Role of tri-ponderal mass index in cardio-metabolic risk assessment in children and adolescents: Compared with body mass index. Int J Obes. (2020) 44:886–94. doi: 10.1038/s41366-019-0416-y
40. De Lorenzo A, Romano L, Di Renzo L, Gualtieri P, Salimei C, Carrano E, et al. Triponderal mass index rather than body mass index: An indicator of high adiposity in italian children and adolescents. Nutrition. (2019) 60:41–7. doi: 10.1016/j.nut.2018.09.007
41. Woolcott OO, Bergman RN. Relative fat mass as an estimator of whole-body fat percentage among children and adolescents: A cross-sectional study using nhanes. Sci Rep. (2019) 9:15279. doi: 10.1038/s41598-019-51701-z
42. Wildman RP, Mackey RH, Bostom A, Thompson T, Sutton-Tyrrell K. Measures of obesity are associated with vascular stiffness in young and older adults. Hypertension. (2003) 42:468–73. doi: 10.1161/01.Hyp.0000090360.78539.Cd
43. Cui Y, Zhang F, Wang H, Zhao L, Song R, Han M, et al. Temporal associations between tri-ponderal mass index and blood pressure in Chinese children: A cross-lag analysis. Nutrients. (2022) 14:1783. doi: 10.3390/nu14091783
44. Pierce GL, Pajaniappan M, DiPietro A, Darracott-Woei ASK, Kapuku GK. Abnormal central pulsatile hemodynamics in adolescents with obesity: Higher aortic forward pressure wave amplitude is independently associated with greater left ventricular mass. Hypertension. (2016) 68:1200–7. doi: 10.1161/hypertensionaha.116.07918
45. Chung S. Growth and puberty in obese children and implications of body composition. J Obes Metab Syndr. (2017) 26:243–50. doi: 10.7570/jomes.2017.26.4.243
46. Xu T, Zhu G, Liu J, Han S. Gender-specific prevalence and associated risk factors of high normal blood pressure and hypertension among multi-ethnic Chinese adolescents aged 8-18 years old. Blood Press. (2015) 24:189–95. doi: 10.3109/08037051.2015.1025474
Keywords: adolescents, body mass index, hypertension, pediatric, tri-ponderal mass index
Citation: Hu J, Zhong Y, Ge W, Lv H, Ding Z, Han D, Hai B, Shen H, Yin J, Gu A and Yang H (2022) Comparisons of tri-ponderal mass index and body mass index in discriminating hypertension at three separate visits in adolescents: A retrospective cohort study. Front. Nutr. 9:1028861. doi: 10.3389/fnut.2022.1028861
Received: 26 August 2022; Accepted: 30 September 2022;
Published: 17 October 2022.
Edited by:
Mainul Haque, National Defence University of Malaysia, MalaysiaReviewed by:
Susmita Sinha, Khulna City Medical College and Hospital, BangladeshKona Chowdhury, Gonoshathaya Samaj Vittik Medical College, Bangladesh
Rahnuma Ahmad, Medical College for Women and Hospital, Bangladesh
Copyright © 2022 Hu, Zhong, Ge, Lv, Ding, Han, Hai, Shen, Yin, Gu and Yang. This is an open-access article distributed under the terms of the Creative Commons Attribution License (CC BY). The use, distribution or reproduction in other forums is permitted, provided the original author(s) and the copyright owner(s) are credited and that the original publication in this journal is cited, in accordance with accepted academic practice. No use, distribution or reproduction is permitted which does not comply with these terms.
*Correspondence: Aihua Gu, aihuagu@njmu.edu.cn; Haibing Yang, yhbing111@163.com
†These authors have contributed equally to this work and share first authorship