- 1Xuzhou Institute of Agricultural Sciences in Jiangsu Xuhuai District, Xuzhou, China
- 2Institute of Cereal and Oil Crops, Hebei Academy of Agricultural and Forestry Sciences, Shijiazhuang, China
- 3Hebei Zhongshu Agricultural Technology Group Co., Ltd., Qinhuangdao, China
Background: The quality of starch greatly affects the quality of processed products. There are many indexes for quality evaluation of starch. Currently, amylose content is considered the chief index in the quality evaluation of sweet potato starch, which is entirely based on tradition (experience) method. The existing evaluation standards lack quality evaluation standards for sweet potato starch.
Purpose: To screen reasonable evaluation indexes of sweet potato starch, and establish a scientific and systematic evaluation system of sweet potato starch.
Methods: Twenty-two components and quality indexes of sweet potato starch were measured. The evaluation indexes of sweet potato starch were screened based on a statistical description, correlation analysis, and principal component analysis (PCA), and a quality evaluation model of sweet potato starch for brewing was established based on analytic hierarchy process. The calculated values of the model were verified by linear fitting with standardized sensory evaluation values.
Results: The coefficient of variation of total starch content (%), amylose content (%), amylopectin content (%), L* value, ΔE, water absorption capacity (g/g), and pasting temperature was less than 6%, while the coefficient of variation of other indexes was larger. In addition, there were different degrees of correlation among the indexes. PCA was used to identify interrelated variables, and the first six principal components together account for 82.26% of the total variability. Then, seven core indexes — setback (cp), rate of regression (%), ratio of amylose to amylopectin (%), gel strength (kgf/cm2), a* value, ash content (%), and solubility (%) — were selected from the six principal components according to the load value of the rotation matrix. These seven core indexes replaced the original 22 indexes to simplify the evaluation of sweet potato starch. The quality evaluation model of sweet potato starch was Y = 0.034X2 + 0.321X6 + 0.141X8 + 0.08X17 + 0.023X19 + 0.08X21 + 0.321X22.
Conclusion: The comprehensive evaluation system of sweet potato starch can accurately predict the quality of sweet potato starch. The development of such a system is of great significance to the post-harvest processing of high-starch sweet potato and the breeding of high-quality and high-starch sweet potato varieties.
Introduction
Starch, as a storage nutrient for plants, is the main nutrient needed for human energy. It is found in cereals, roots, stems, and seeds, and it is widely used in foods, textiles, paper, materials, and pharmaceuticals (1, 2). Starch mainly exists in plants in the form of starch granules. Natural starch granules are composed of an inner amylose layer and an outer amylopectin layer. Both amylose and amylopectin are composed of D-glucose. Amylose is a linear polysaccharide linked by α(1–4)-glycosidic bonds, whereas amylopectin is a multi-branched polymer linked by α(1–4)-glycosidic bonds and α(1–6)-glycosidic bonds (3). The composition, structure, arrangement, and crystallization of starch from different sources results in different functional, processing, and quality characteristics. In recent years, researchers have focused on the relationship between starch fine structure and physicochemical properties. Tong et al. (4) found that the pasting and texture properties were affected by the fine structure of both amylose and amylopectin. The pasting and thermal properties were influenced by the debranched starch fine structure of amylose and amylopectin, while the texture properties were mainly influenced by amylopectin fine structure. However, the quality characteristics of starch and their effect on processing suitability and quality are not clear yet. Currently, only the relationship between the structure and physicochemical properties of starch and starch quality has been analyzed. Moreover, there is no systematic quantitative evaluation of starch quality. Han et al. (5) found that when the short-chain content of amylopectin in rice was high, the molecular chain was loose, resulting in unstable starch that readily expanded and was difficult to rearrange. In addition, the pasting time, pasting temperature, and setback values were small. As a result, the rice was susceptible to pasting and retrogradation (5).
Sweet potato, an annual or perennial root crop of the Convolvulaceae family, is the seventh most important food crop in the world (6, 7). Sweet potato has rich nutritional value, such as high levels of starch, carotene, dietary fiber, and more than 10 types of mineral elements (8, 9). Sweet potato starch is mainly composed of amylopectin, with a content of 68.8–86.79% (10, 11). There are negatively charged phosphate ester groups in the starch particles of sweet potato, which afford good swelling ability. It has been widely used in food production fields, such as in brewing starch paste, as well as in making starch noodles. In addition, it can be used as a thickener, stabilizer, and water retention agent to improve the viscosity, water retention capacity, and water holding capacity of certain food systems (12, 13). Different varieties of sweet potato starch have different components and fine structures, resulting in different functions and processing suitability of starch. Therefore, it is urgently needed to establish the quality evaluation standard for sweet potato starch in post-harvest processing of high-starch sweet potato. Currently, amylose content is considered the chief standard in the quality evaluation of sweet potato starch. As reported by Tan et al., Sun et al., and Xing et al., during gelatinization, starch with high amylose content had high viscosity and was easy aging, and quality of starch noodle was good, so the amylose content can be used as an index to evaluate the quality of starch (11, 14, 15). This evaluation method is entirely based on tradition (experience) method and neglects many influencing indexes. Thus, starch quality cannot be accurately predicted. At the same time, the existing evaluation standards lack quality evaluation standards for special sweet potato starch. Therefore, it is very important to select appropriate evaluation indexes and establish a simple, efficient, and accurate comprehensive evaluation system for sweet potato starch.
In particular, brewing sweet potato starch is a form of sweet potato starch that is popular in China, it can be cooked as sweet potato starch thick soup. Currently, there is no systematic quality evaluation system for brewing sweet potato starch. Therefore, using evaluation indexes to describe the composition, physicochemical properties, and processing parameters, a systematic and comprehensive quality evaluation system was constructed for sweet potato starch. Specifically, this study obtained the quality evaluation index data of starch from eighteen sweet potato varieties. Next, through statistical description, correlation analysis, principal component analysis (PCA), and analytic hierarchy process (AHP), the core evaluation indexes were selected, and the quality evaluation system of brewing sweet potato starch was established. Finally, the effectiveness of the comprehensive quality evaluation model was verified by sensory evaluation results.
Materials and methods
Materials
Eighteen varieties of sweet potato, namely Yanshu 29, Yushu 15, Wanshu 9, Luxuan 1, Jishu 25, Qinshu 9, Jishu 99, Xushu 18, Xushu 37, Sushu 18, Sushu 23, Sushu 28, Luoxushu 9, Luoshu 10, Luoshu 11, Luoshu 12, Luoshu 14, and Luoshu 15, were harvested in the experimental field of the Sweet Potato Research Institute of the Chinese Academy of Agricultural Sciences (34° 16′N, 117° 17′E) on October 21, 2020. After callus treatment at high temperature, sweet potato roots of uniform size with no insect infestation or scars were selected for further treatment.
Isolation of sweet potato starches
The starch was extracted using the method reported by Vithu et al., with slight modification (16). Clean sweet potato cubes (500 g) and water (1000 g) were mixed and homogenized thoroughly. The homogenate was filtered with four layers of gauze, passed through a 100-mesh sieve, and washed twice. The resultant slurry settled naturally over 12 h. The obtained precipitate was washed once more with water. Finally, the resultant starch was dried at 50°C for 24 h, ground into a powder, and passed through a 100-mesh sieve. Each variety was analyzed in triplicate.
Composition measurement
The moisture content and ash content were determined according to the AOAC method (17). The contents of total starch, and amylose were determined with respective kits. The ratio of amylose to amylopectin was denoted as AA (18).
Determination of color
The color of sweet potato starch was determined by a spectrophotometric colorimeter (CM-5, KONICA MINOLTA, Tokyo, Japan). The measurement indexes were L*, a*, b*, and ΔE, where L* represents the sample brightness; a* represents the red and green value; b* represents the yellow and blue value; and ΔE represents the total chroma.
Water absorption capacity and oil absorption capacity
For water absorption capacity (WAC), 0.6 g of starch was weighed in a 50 mL centrifuge tube, and 10 mL of distilled water was added. The sample mixture was placed in a water bath at 30°C for 30 min and was centrifuged (3000 g, 15 min). Then, the water was removed. The centrifuge tube was inverted for 2 min and weighed. WAC (g/g) was calculated using Eq. 1. For oil absorption capacity (OAC), 1 g of starch was weighed in a 10 mL centrifuge tube, and 6 mL of soybean oil was added. The sample mixture was placed in a water bath at 30°C for 30 min and was centrifuged (3000 g, 15 min). The oil was removed. The centrifuge tube was inverted for 15 min and weighed. OAC (g/g) was calculated using Eq. 2 (19):
Pasting properties
Pasting properties were measured using a rapid viscosity analyzer (RVA) (4500, Perten Instruments, Stockholm, Sweden), according to a method reported by Qian et al. (20). Three grams of starch and 25 mL of distilled water were transferred to an RVA pot, stirred well, and heated using a temperature gradient. The sample mixture was equilibrated at 50°C for 1 min and heated to 95°C at a rate of 11.25°C/min. The mixture was kept at 95°C for 4.5 min, cooled to 50°C at 11.25°C/min, and held at 50°C for 3.5 min. The speed of the paddle was 160 r/min. In addition to the peak viscosity (PV), trough viscosity (TV), and final viscosity (FV), RVA characteristic parameters were also described by breakdown (BD = PV-TV), setback (SB = FV-TV), and pasting temperature (PT).
Swelling power and solubility
In a 50 mL centrifuge tube, 0.4 g of starch was weighed, and 20 mL of distilled water was added. After shaking, the sample was placed in a water bath at 85°C for 30 min and centrifuged (6000 g, 15 min). The supernatant was collected, and the weight of the precipitate after starch expansion was measured. The supernatant was dried to a constant weight in a 105°C oven and weighed (21). The swelling power (SP) and solubility were calculated as shown in Eq. 3 and 4:
Rate of retrogradation
In a 50 mL centrifuge tube, 1.5 g of starch was weighed, and 25 mL of distilled water was added. After shaking, the sample was placed in a water bath at 95°C for 20 min, cooled at 25°C for 30 min, frozen at 4°C for 24 h, and thawed at 30°C for 2 h. Then, the sample was centrifuged at 3000 r/min for 20 min. Finally, the supernatant weight was weighed, and the rate of retrogradation (RR) was calculated (Eq. 5) (22):
Gel strength
In a 100 mL beaker, 3 g of starch was weighed, and 50 mL of distilled water was added. The beaker containing the sample was placed in a water bath at 95°C for 30 min with constant agitation. Subsequently, it was cooled to room temperature, wrapped with plastic wrap, and placed in a refrigerator at 4°C for 24 h. After 24 h, the sample was taken out and balanced for 2 h at room temperature to form a stable starch gel. The gel strength (GS) of the starch was measured using a texture analyzer (TMS-PRO, FTC, Sterling, VA, United States). A cylinder probe with a diameter of 6 mm was selected. The pre-test speed was 2 mm/s, the test speed was 1 mm/s, and the post-test speed was 5 mm/s. The compression ratio was 50%. The triggering force was determined according to the instrument situation. During puncture, the GS was determined as the maximum stress per unit area of the probe (23).
Standardization of evaluation indexes
There were different dimensions and orders of magnitude for the quality comprehensive evaluation indexes of sweet potato starch. Therefore, the normalization method was adopted to eliminate the influence of each index dimension on the results (24). The original data were initialized first, and the initialized value was the absolute value of the distance between each quality index value and the ideal value. Subsequently, the data were normalized using the normalized value Xi = , where x′i is the initialization value, and x′imax is the maximum initialization value.
Determination of weight of evaluation index
To show the importance of different indexes in the comprehensive evaluation, a 1–9 scale method was used to determine the weight coefficients of each core index. Each index variable was set as Fi, and the corresponding normalized value was Xi. A judgment matrix A = (aij) was established using the 1–9 scale method, and each element in the matrix was assigned using the following rules (25):
1) When Fi and Fj were equally important, aij = 1;
2) When Fi was slightly more important than Fj, aij = 3;
3) When Fi was more important than Fj, aij = 5;
4) When Fi was much more important than Fj, aij = 7;
5) When Fi was extremely more important than Fj, aij = 9; and
6) When between the above judgments, aij = 2, 4, 6, 8.
The weight Wi of each quality evaluation index was calculated according to the judgment matrix A (26).
1) Calculate the product of each row of the judgment matrix A: Mi = , i = 1, 2, …, n;
2) Calculate the n-root of Mi: ;
3) Calculate the Wi: Wi = ;
4) Calculate the maximum eigenvalue of the judgment matrix A: , where W = (W1, W2, …, Wn)T is the eigenvector, and (AW)i is the ith element of AW;
5) Calculate the consistency index CI: CI = . If the consistency ratio CR = < 0.1 (where RI is the mean random consistency index), the judgment matrix meets the consistency requirements; and
6) The synthetic value is obtained by the AHP: Y = .
Sensory evaluation and normalization of sweet potato starch
Ten trained sensory evaluators were organized to perform a sensory evaluation on sweet potato starch, and sensory data were normalized. The normalized value of sensory evaluation was Zi = , where zi, zmax, and zmin are the comprehensive score, highest score, and lowest score of sensory evaluation, respectively.
Statistical analysis
SPSS 18.0 software was used for Variance analysis, and PCA. Duncan multiple comparison method was used to test the significance of Variance analysis (P < 0.05). Origin 2021 software was used for correlation analysis. Each experiment was analyzed in triplicate, and the experimental data were expressed as mean ± standard deviation (Mean ± SD).
Results
Composition of sweet potato starch
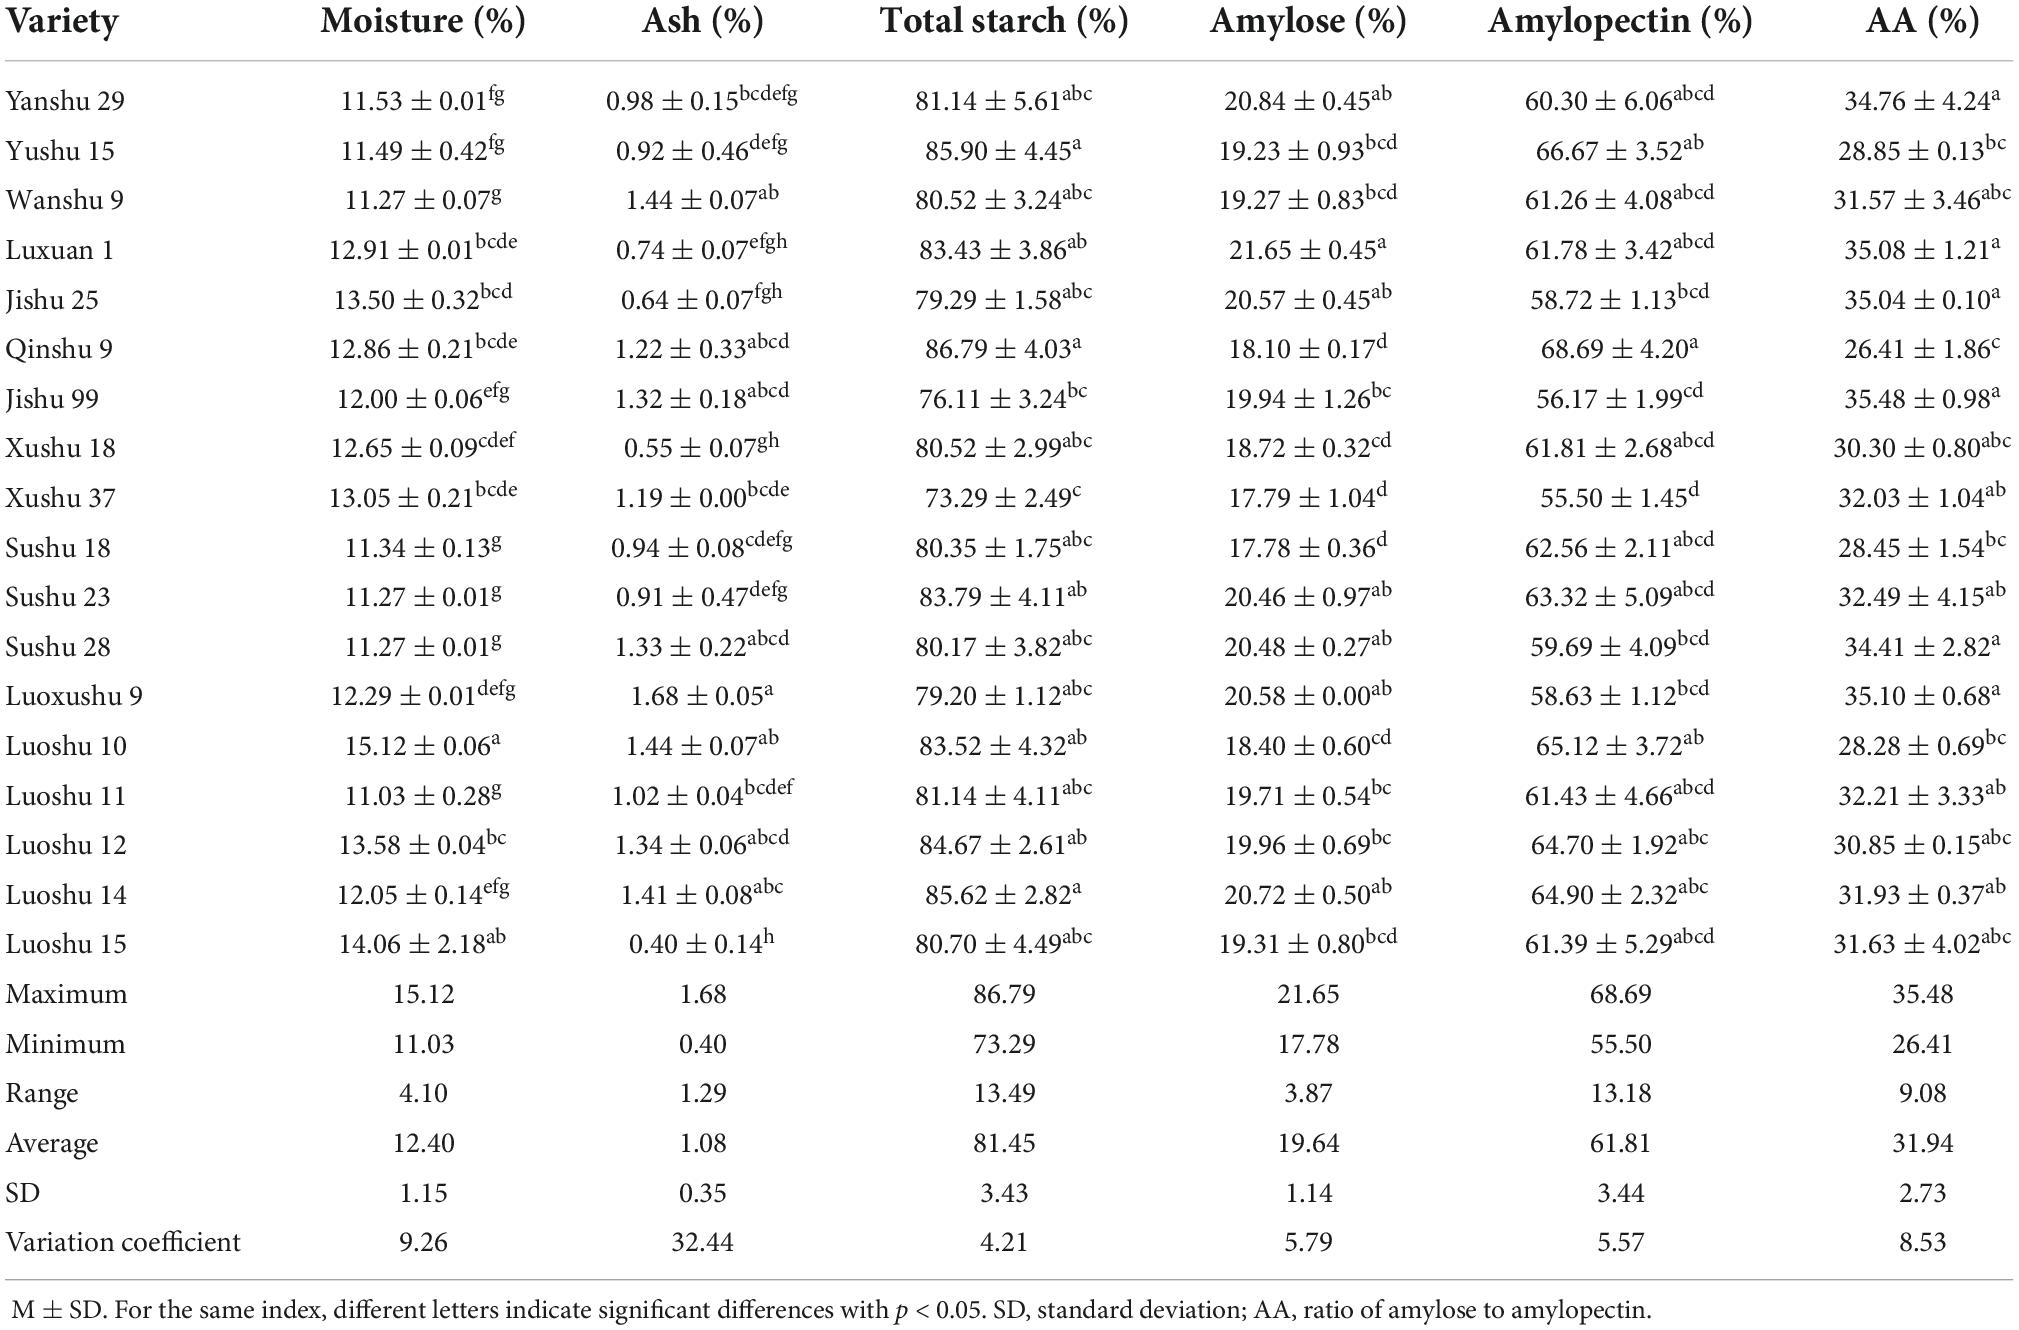
As shown in Table 1, the compositions of 18 kinds of sweet potato starch varied. The moisture content of different sweet potato starch was similar, with a range of 11.03–15.12% and a coefficient of variation of 9.26%. Ash content was significantly different, ranging from 0.40 to 1.68%, and the coefficient of variation was 32.44%. The result was consistent with the study of Rocha et al. (27).
The purity (total starch) of 18 kinds of sweet potato starch was similar and high, ranging from 73.29 to 86.79%, and the coefficient of variation was 4.21%. The amylose content and amylopectin content were significantly different, ranging from 17.78 to 21.65% and 55.50 to 68.69% respectively, and the coefficient of variation was 5.79 and 5.57%, respectively. The results showed that amylopectin was the main component of sweet potato starch, which was consistent with the study of Aina et al. (10). The amylose content of Luxuan 1 was the highest.
The larger the AA is, the higher the ratio of amylose to total starch is. The AA of 18 kinds of sweet potato starch was significantly different, ranging from 26.41 to 35.48% with a variation coefficient of 8.53%. AA of Jishu 99 was the highest, and amylose accounted for a large proportion of total starch.
Color of sweet potato starch
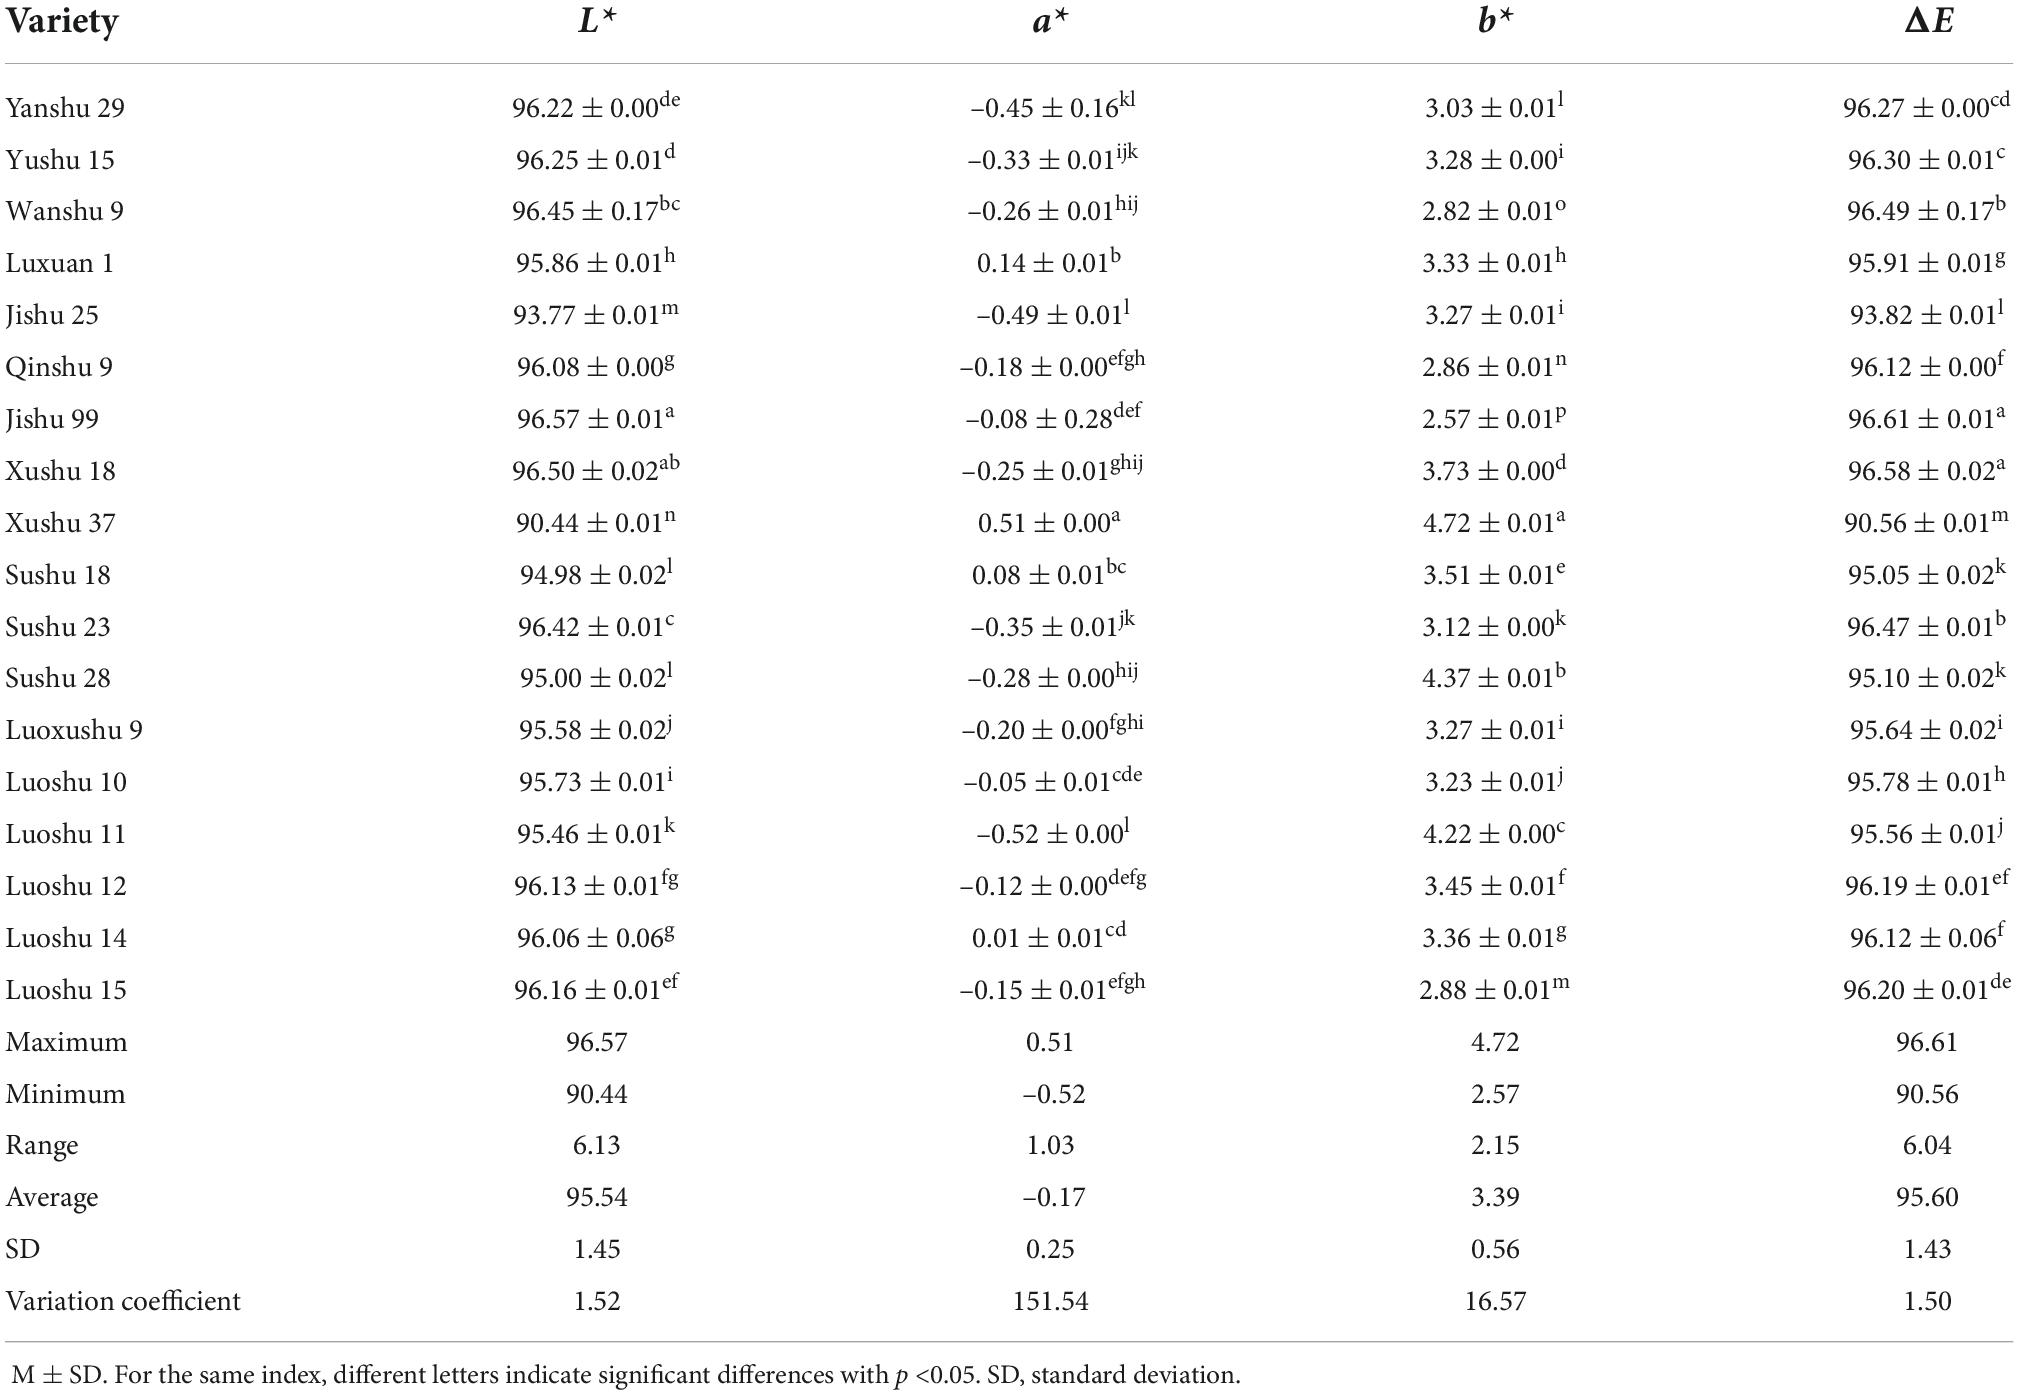
Color is an intuitive index to evaluate the quality of starch, and it affects the quality of starch products, such as starch noodles (11, 28). The L* value and ΔE are two main indexes to evaluate starch color. As shown in Table 2, L* value and ΔE of Jishu 99 were the highest among the sweet potato varieties, and a* and b* values were small, indicating that the starch of Jishu 99 had the brightest and highest color quality. In contrast, L* value and ΔE of Xushu 37 were the lowest, and the absolute a* and b* values were the largest, indicating that the hue of the starch was reddish yellow and that its color was dull.
Pasting properties of sweet potato starch
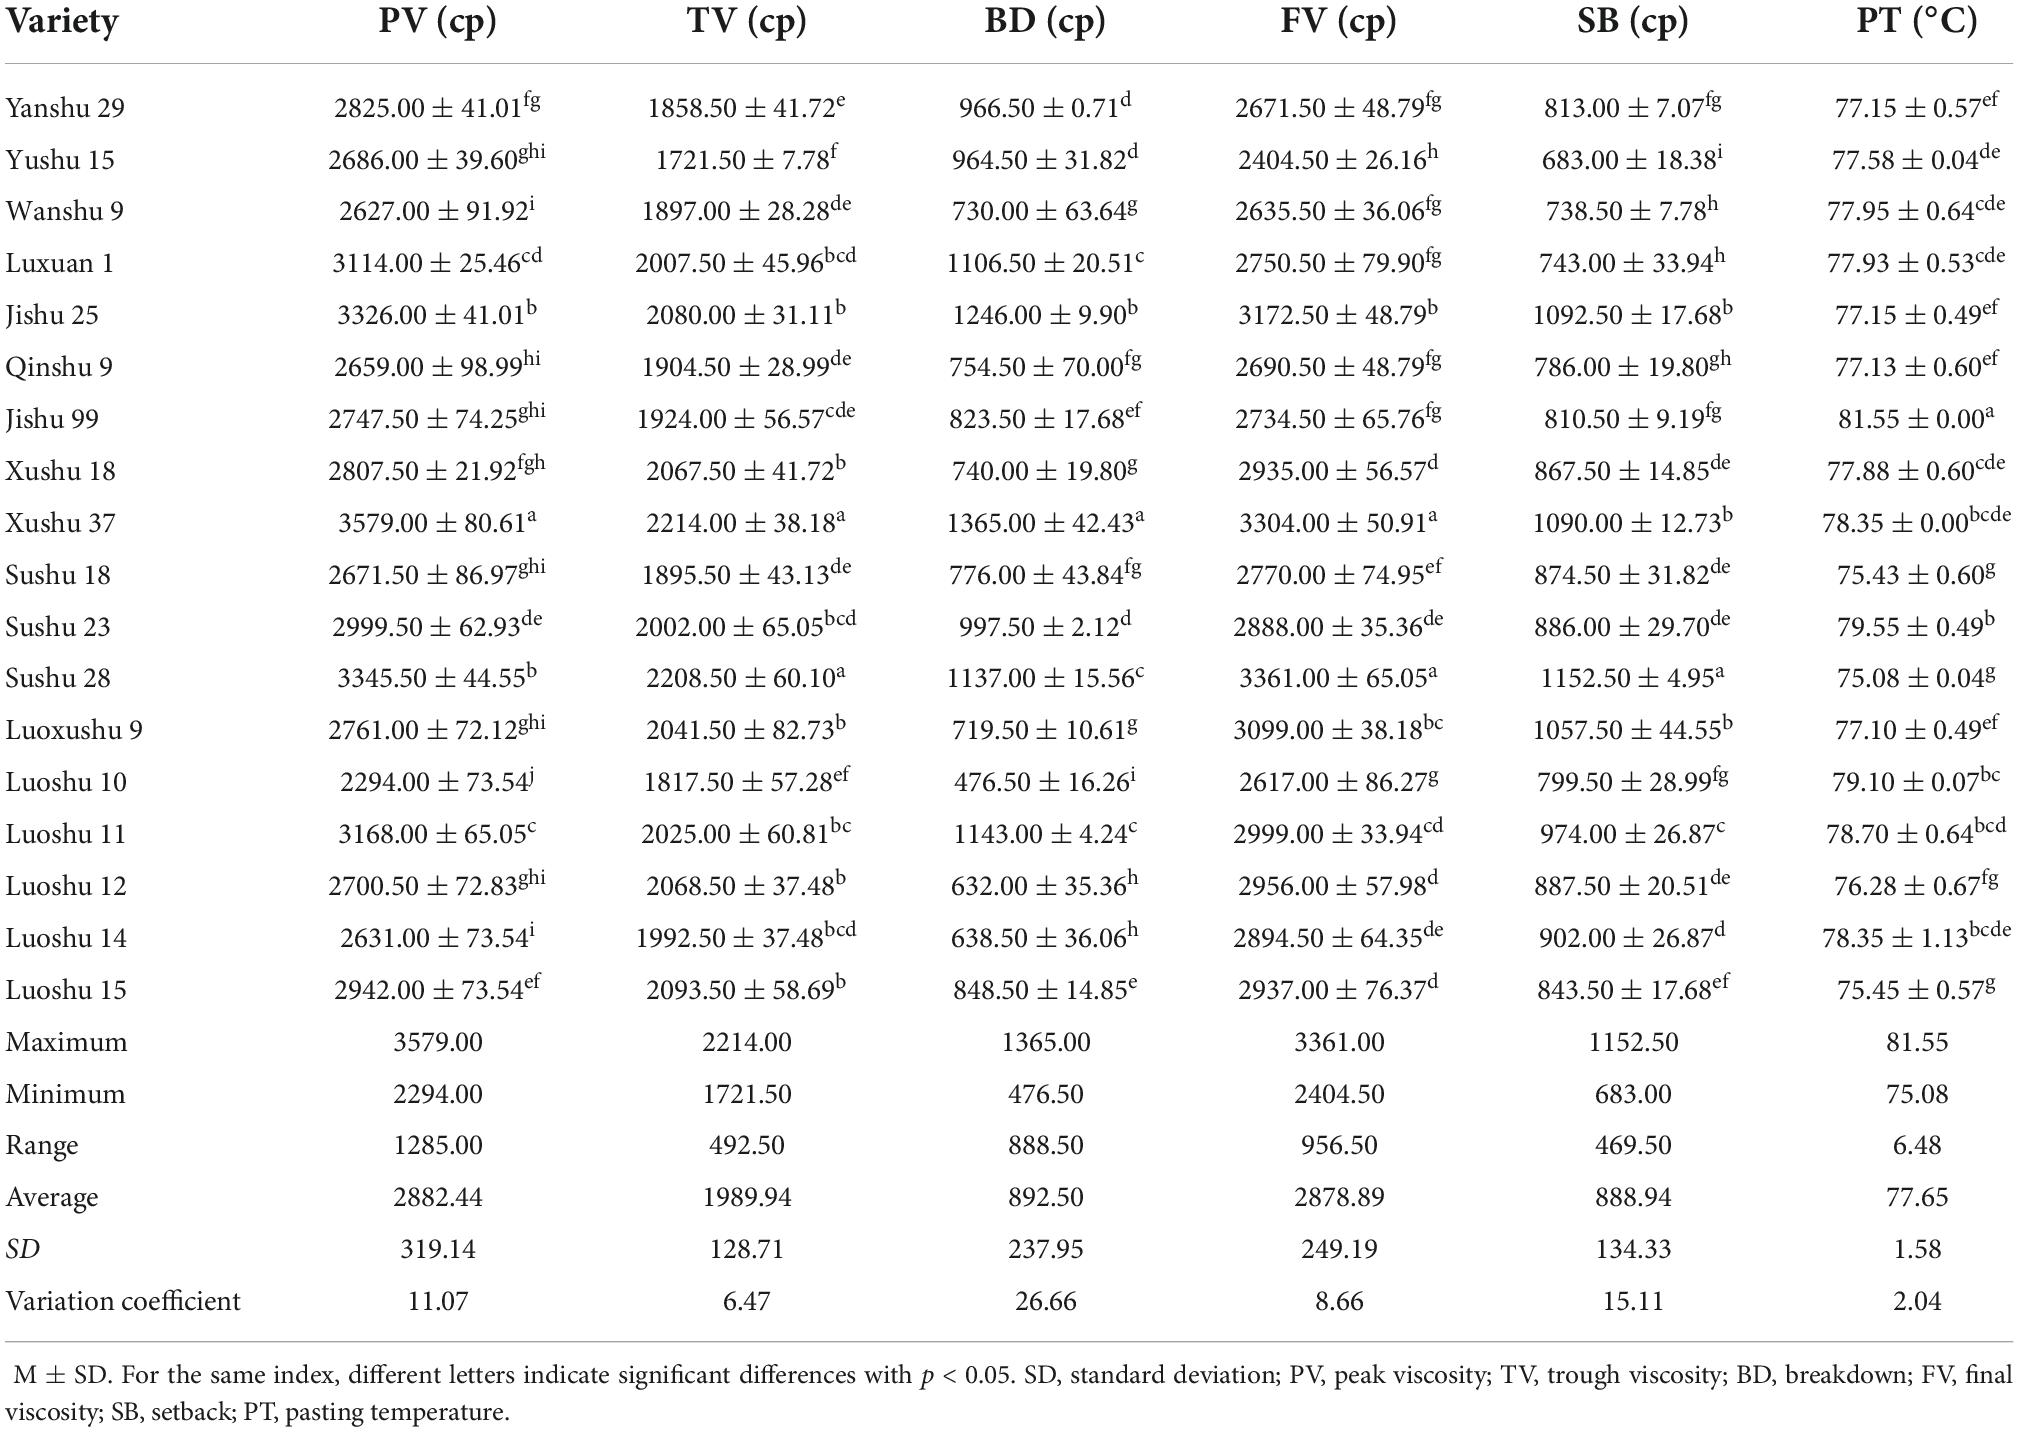
Pasting temperature is the lowest temperature of gelatinized starch and reflected energy consumption. PV is the maximum viscosity after the suspension gelatinized with rising temperature, and it reflects the swelling power of starch particles. TV refers to the lowest viscosity value of starch from gel to collosol due to increased spacing between starch molecules. FV is the stable viscosity value after the solution changed from collosol to gel with decreasing temperature. BD reflects the shear resistance of starch, and SB reflects the short-term rearrangement capacity of starch (29). The pasting properties of all samples are presented in Table 3. The PV, TV, BD, FV, SB, and PT of 18 sweet potato starches were significantly different and ranged from 2294–3579 cp, 1721.5–2214 cp, 476.5–1365 cp, 2404.5–3361 cp, 683–1252.5 cp, and 75.08–81.55°C, respectively. This result is consistent with that of other researchers (20, 30). The PT of Sushu 28 was the lowest (75.08 ± 0.04°C), while that of Jishu 99 was the highest (81.55 ± 0.00°C) (Table 3). In the gelatinization process, different varieties of sweet potato starch had different energy consumption, which depended on the interaction between starch molecules. The BD of Luoshu 10 was the lowest, indicating that Luoshu 10 was more stable among the sweet potato varieties. The SB of Yushu 15 was the lowest, indicating that Yushu 15was not easy to retrogradation in the measured range.
Physicochemical properties of sweet potato starch
The physicochemical properties of all samples are presented in Table 4. The WAC and OAC of 18 kinds of sweet potato starch were significantly different. Among them, the sweet potato starch of Luoshu 11, Luoshu 14, Xushu 18, and Sushu 18 had higher WAC, ranging from 0.84 g/g to 0.87 g/g and indicating that these starches had a high concentration of hydrophilic groups. In contrast, Luxuan 1, Jishu 99, and Luoshu 14 had higher OAC, ranging from 0.70 g/g to 0.85 g/g. The results are consistent with those reported by Singh et al. (31).
The solubility and SP are basic properties of starch and important properties in food processing, reflecting the interaction between starch and water. As shown in Table 4, the solubility and SP of 18 kinds of sweet potato starch were significantly different, ranging from 2.48 to 7.46% and 10.23 to 15.00%, respectively. This result is consistent with that reported by Trung et al. (32). The rate of retrogradation (RR) was related to the dehydration of starch gel. The RR of 18 kinds of sweet potato starch was significantly different, with a range of 15.58–56.23% and a coefficient of variation of 35.16%. Among them, the dewatering amount of starch gel in Luxuan 1 was significantly higher than that in other varieties, indicating that Luxuan 1 had the highest rate of regeneration. The GS of different kinds of sweet potato starch was significantly different, ranging from 0.01 to 0.07, and the coefficient of variation was 31.12%. The results are consistent with those reported by Xing et al. (15).
Correlation analysis of quality indexes
Among the 22 components and processing quality indexes, WAC and OAC, pasting properties, S, SP, RR, and GS reflect the processing quality characteristics of sweet potato starch. As expected, there was collinearity in the measurement indexes; therefore, correlation analysis was used to determine the relationship between the indexes and provide a theoretical basis for the classification and screening of quality indexes in the next step. The heatmap of the correlation coefficient is shown in Figure 1. The circle in the upper triangular reflects correlation coefficient. The red circles represent positive correlations, and blue circles represent negative correlations. The darker (larger) the circle is, the higher the correlation coefficient is. And the specific correlation coefficients are shown in the lower triangular. Among the 231 correlations, 29 were significantly correlated at the α = 0.05 level; 25 were significantly correlated at the α = 0.01 level; and there was no significant correlation among the other 177 quality indexes. The FV was positively correlated with TV and SB, and the correlation coefficients were both 0.95. There was a significant positive correlation between total starch content and amylopectin content, and the correlation coefficient was 0.95. The PV was positively correlated with BD, and the correlation coefficient was 0.93. The results show a certain degree of independent correlation among some quality indexes, that is, information overlap existed in some indexes. Therefore, 22 indexes were needed to classify and simplify the data set to enhance the efficiency and accuracy of the quality evaluation of sweet potato starch.
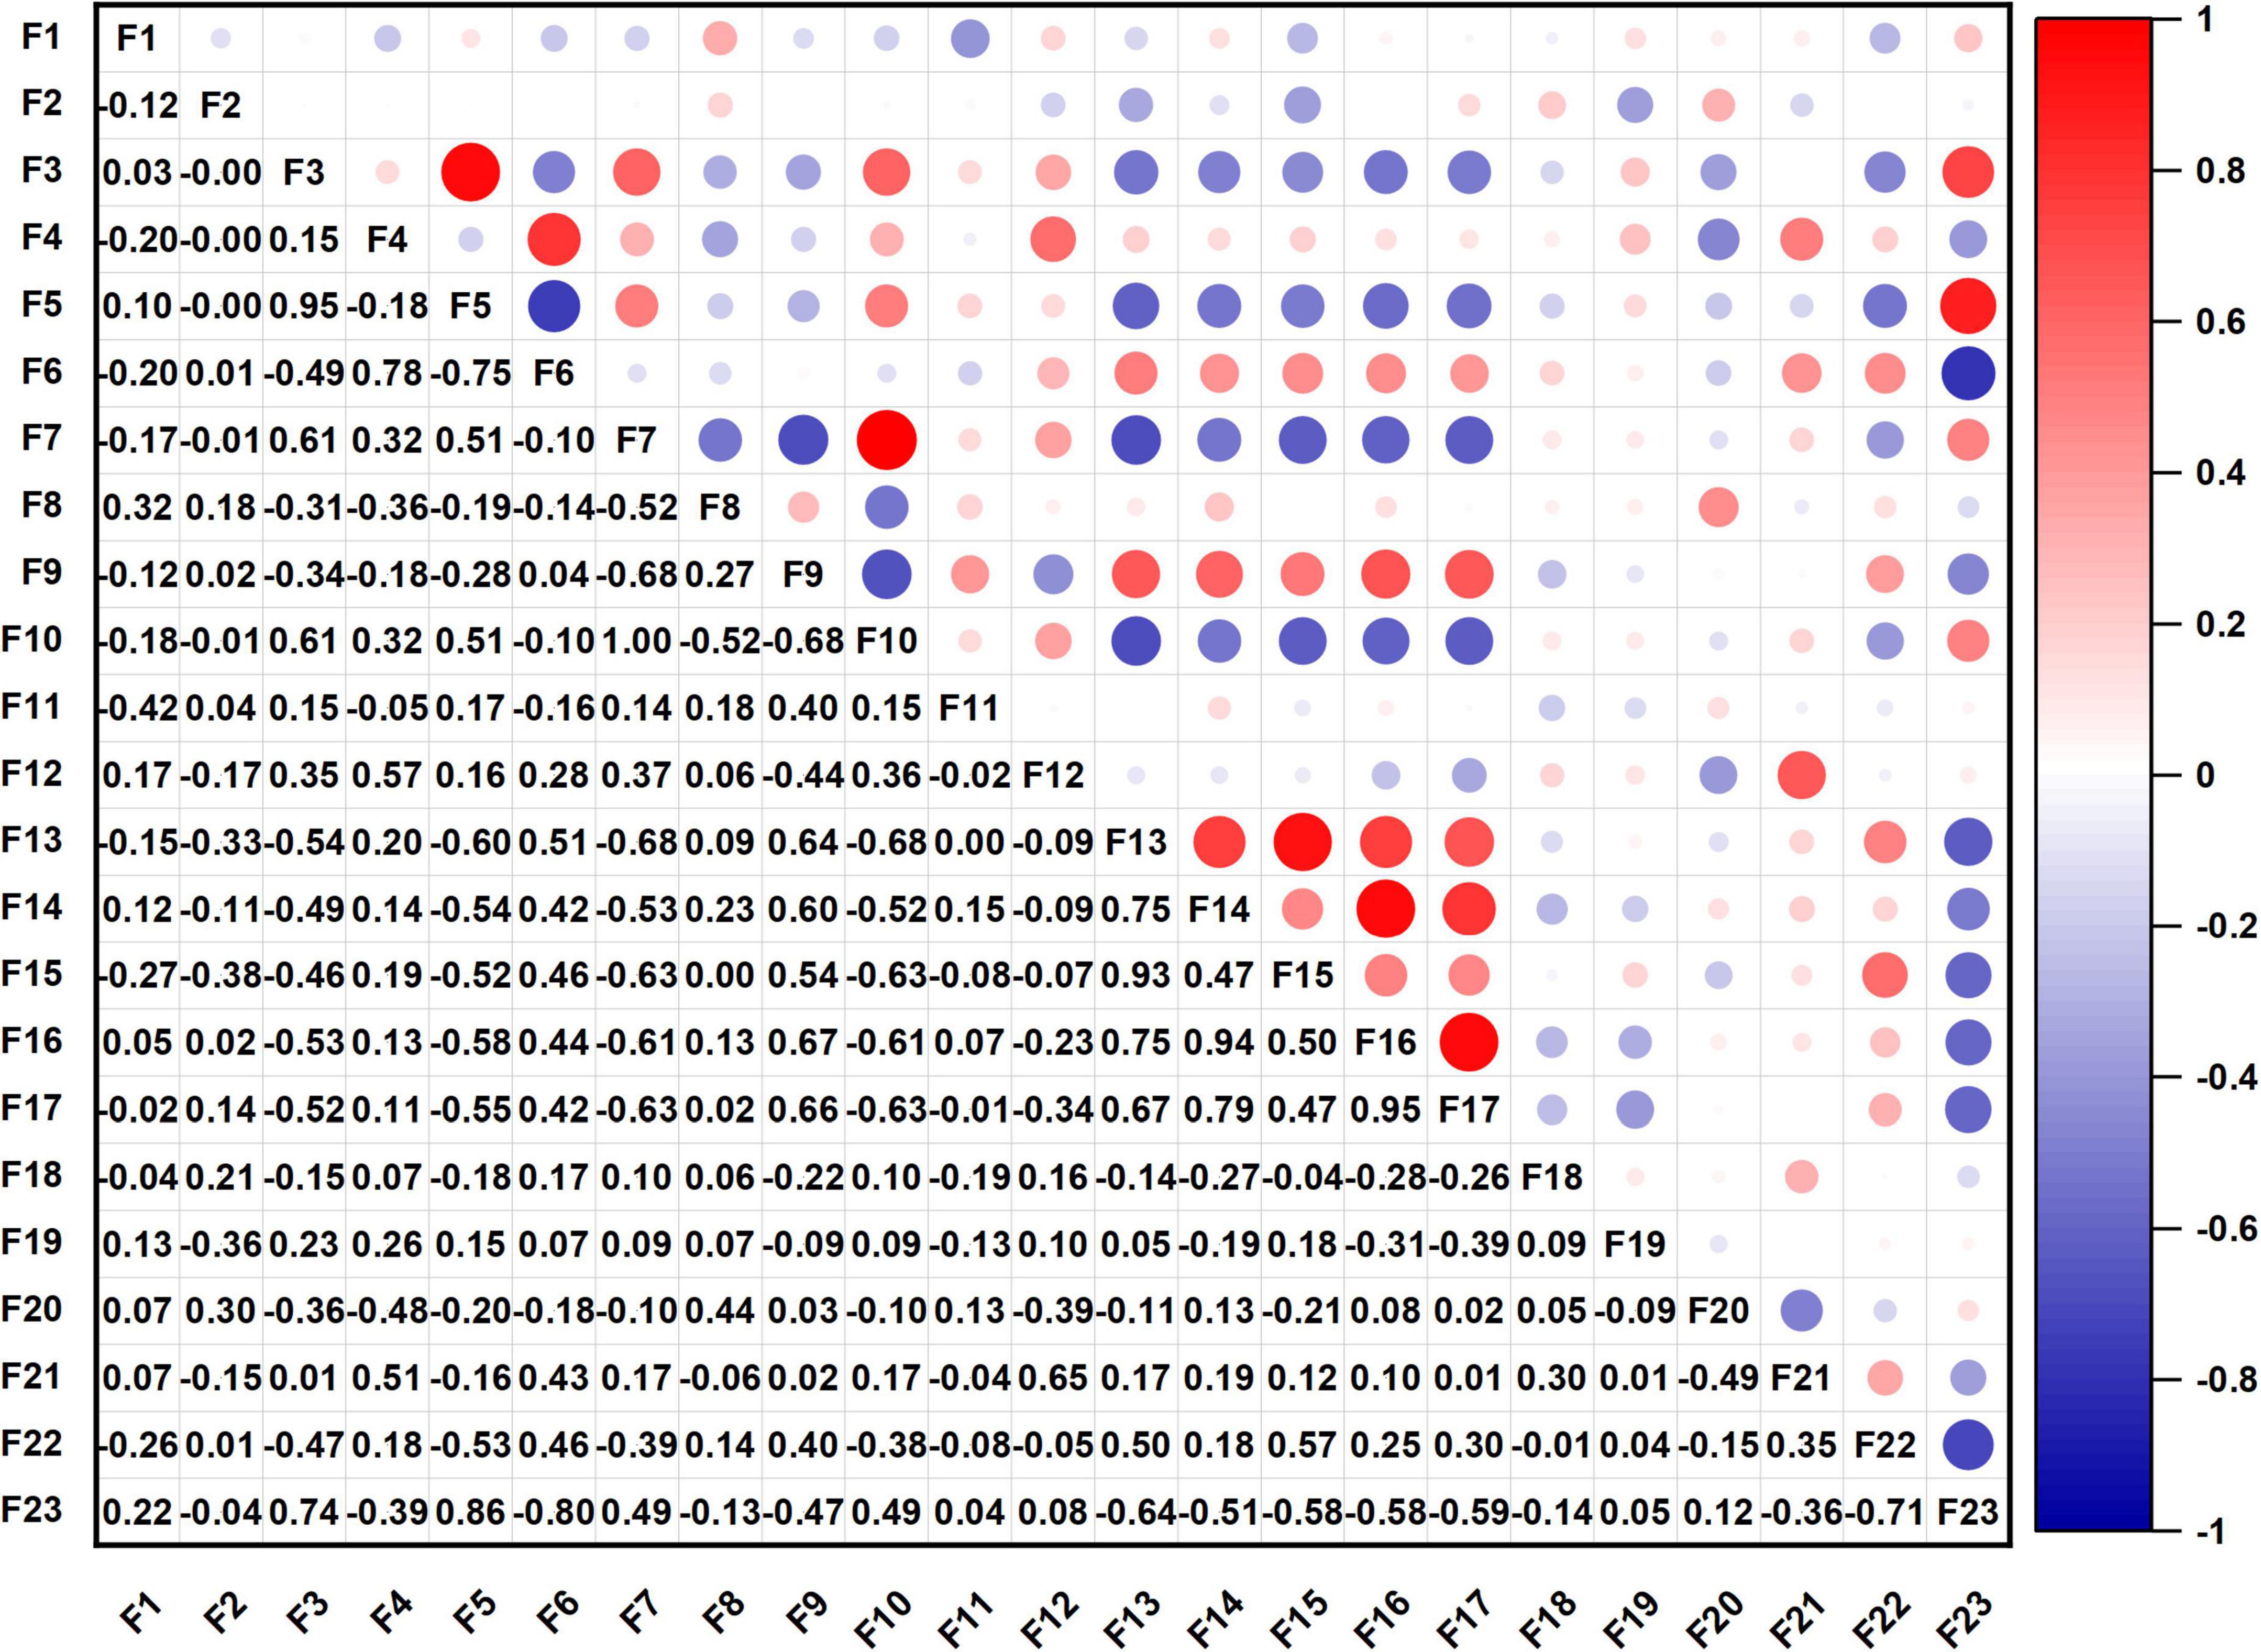
Figure 1. Correlation coefficient heatmap of quality indexes (F1, moisture; F2, ash; F3, total starch; F4, amylose; F5, amylopectin; F6, ratio of amylose to amylopectin; F7, L; F8, a*; F9, b*; F10, ΔE; F11, water absorption capacity; F12, oil absorption capacity; F13, peak viscosity; F14, trough viscosity; F15, breakdown; F16, final viscosity; F17, setback; F18, pasting temperature; F19, solubility; F20, swelling power; F21, rate of retrogradation; F22, gel strength; F23, sensory evaluation value).
Principal component analysis of quality indexes
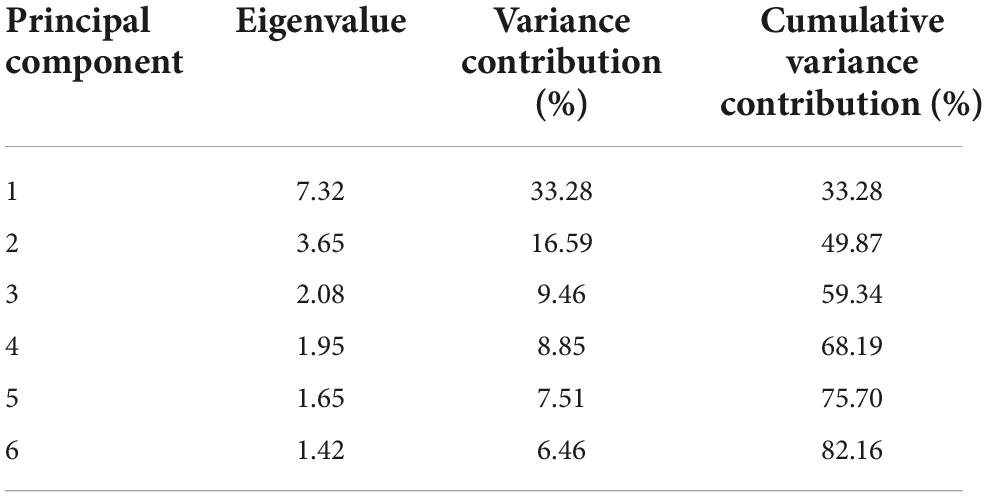
Principal component analysis can extract a few mutually independent indexes and reduce redundant variables (33). PCA was used to extract components from evaluation indexes based on SPSS 18.0 software, and the eigenvalue matrix of the evaluation indexes was obtained. The cumulative variance contribution rate of the first six principal components was 82.26%, and λ > 1, indicating that it could represent most of the original evaluation indexes (34, 35). The variance contribution rate indicates the dispersion degree of different index traits in the principal component. The larger the variance contribution rate is, the more important the principal component is in the analysis of sample data. The eigenvalue of the first principal component was 7.32, accounting for 33.28% of the total variance of the original 22 variables, and it was the decisive principal component. The variance contribution rate of the second principal component was 16.59%. The details are shown in Table 5.
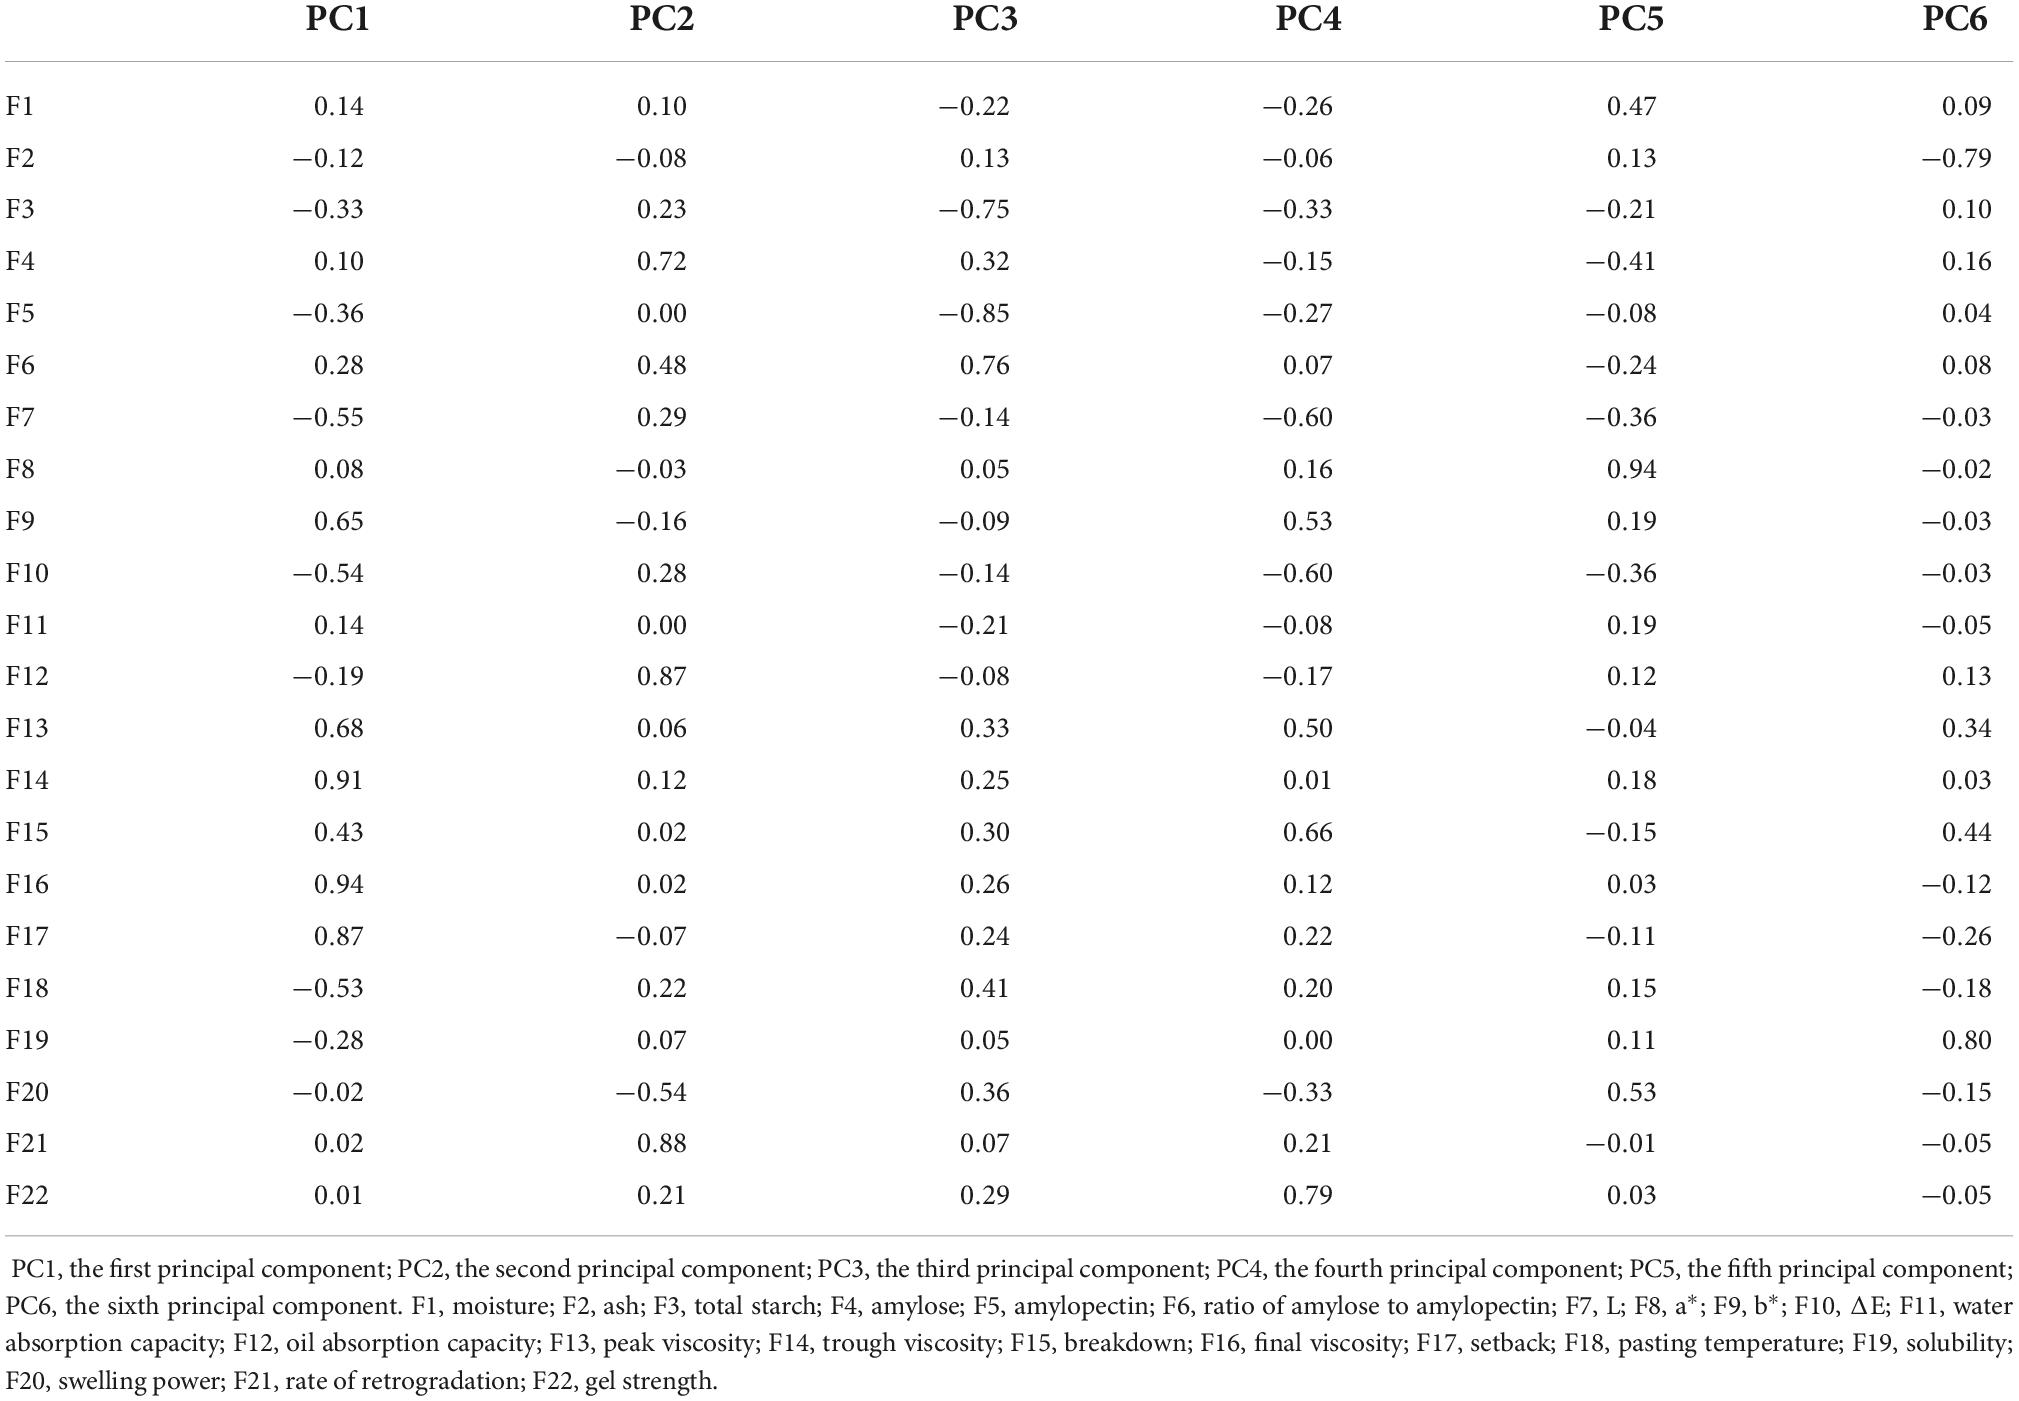
To better explain the relationship between the original evaluation indexes and principal components, the principal component load matrix was constructed by orthogonal rotation method (36, 37). The load values in Table 6 reflect the importance of each original evaluation index in the principal component. As shown in Table 6, the first principal component mainly explained three variables, namely TV, FV, and SB, and their variation coefficient dispersion was small. TV was positively correlated with FV and SB. Considering the correlation, importance, and variation coefficient of quality indexes, the SB value was selected to represent the first principal component. The second principal component corresponded with RR, amylose, and OAC. The OAC was positively correlated with RR; therefore, the RR was selected as the representative of the second principal component. The third principal component mainly integrated the information of total starch and amylopectin and AA. The total starch was positively correlated with amylopectin; AA was significantly positively correlated with amylose in the second principal component; and AA contained information about amylose and amylopectin. Therefore, the AA was selected as the representative of the third principal component. The fourth principal component mainly explained the GS; the fifth principal component mainly explained a* value; and the sixth principal component mainly explained ash and solubility. Finally, seven indexes, namely SB, RR, AA, GS, a* value, ash content, and solubility, were selected as the core indexes of the quality evaluation of sweet potato starch.
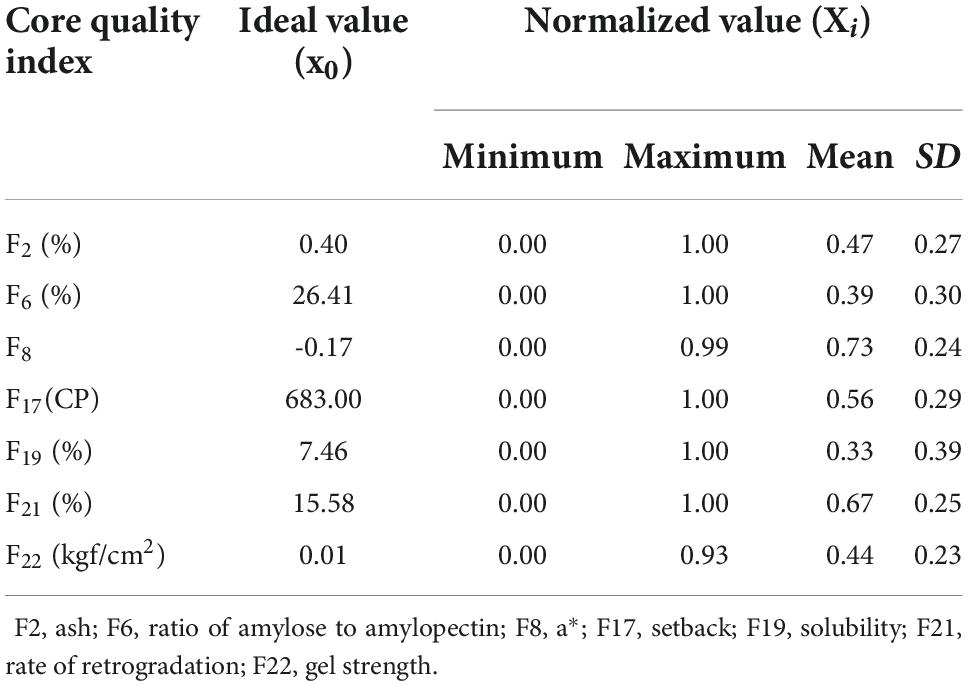
The original data of the seven sweet potato starch quality indexes were normalized (normalized value is Xi). The results are shown in Table 7. The determination of the ideal value depended on the positive and negative directivity of the index. Solubility was a positive index, and the higher the measured value, the better the quality. Thus, the maximum value was selected as the ideal value. The a* value was a neutral index, and the average value was the ideal value. Ash content, AA, SB, RR, and GS were inverse indexes, and the minimum value was taken as the ideal value.
Determination of evaluation index weight
The judgment matrix established by the 1–9 scale method is shown in Table 8. Considering the properties for brewing sweet potato starch, the importance degree of each index affecting the comprehensive evaluation system for brewing sweet potato starch was ranked. The importance ranking of indexes was as follows: AA = GS > a* value > SB = RR > ash content > solubility. The most important quality characteristic of starch was the mouthfeel of starch and starch paste. The taste and gel status of starch paste were affected by amylose content and amylopectin content; thus, the AA and GS had the greatest influence on the evaluation system. The a* value was the third most important factor affecting the evaluation of starch quality because starch color directly affects sensory perception. The SB and RR were the fourth and fifth most important factors because retrogradation affects the stability of starch and starch paste. The ash content was the sixth factor because ash represents impurities in starch. The seventh factor was solubility.
According to the established judgment matrix, the root method was used to test the consistency of the matrix, and the weight coefficients of each quality index were calculated. The calculated results are as follows:
W1 = 0.034, W2 = 0.321, W3 = 0.141, W4 = 0.080, W5 = 0.023, W6 = 0.080, W7 = 0.321,
AW = (0.214,2.322,1.006,0.575,0.172,0.575,2.322)T,
λmax = 7.228, CI = 0.038.
The mean random consistency index was queried, when n = 7, RI = 1.32, CR = 0.029 < 0.1. This indicates the established judgment matrix had satisfactory consistency. The weight coefficients were 0.034, 0.321, 0.141, 0.080, 0.023, 0.080, and 0.321. The determination of weight coefficients based on the method of establishing judgment matrix ensured the acquisition of reasonable and accurate evaluation results and avoided the limitations of the assignment method (36). The comprehensive evaluation model of sweet potato starch was as follows: Y (comprehensive value) = 0.034X2 + 0.321X6 + 0.141X8 + 0.08X17 + 0.023X19 + 0.08X21 + 0.321X22.
Validation of quality comprehensive evaluation model of sweet potato starch
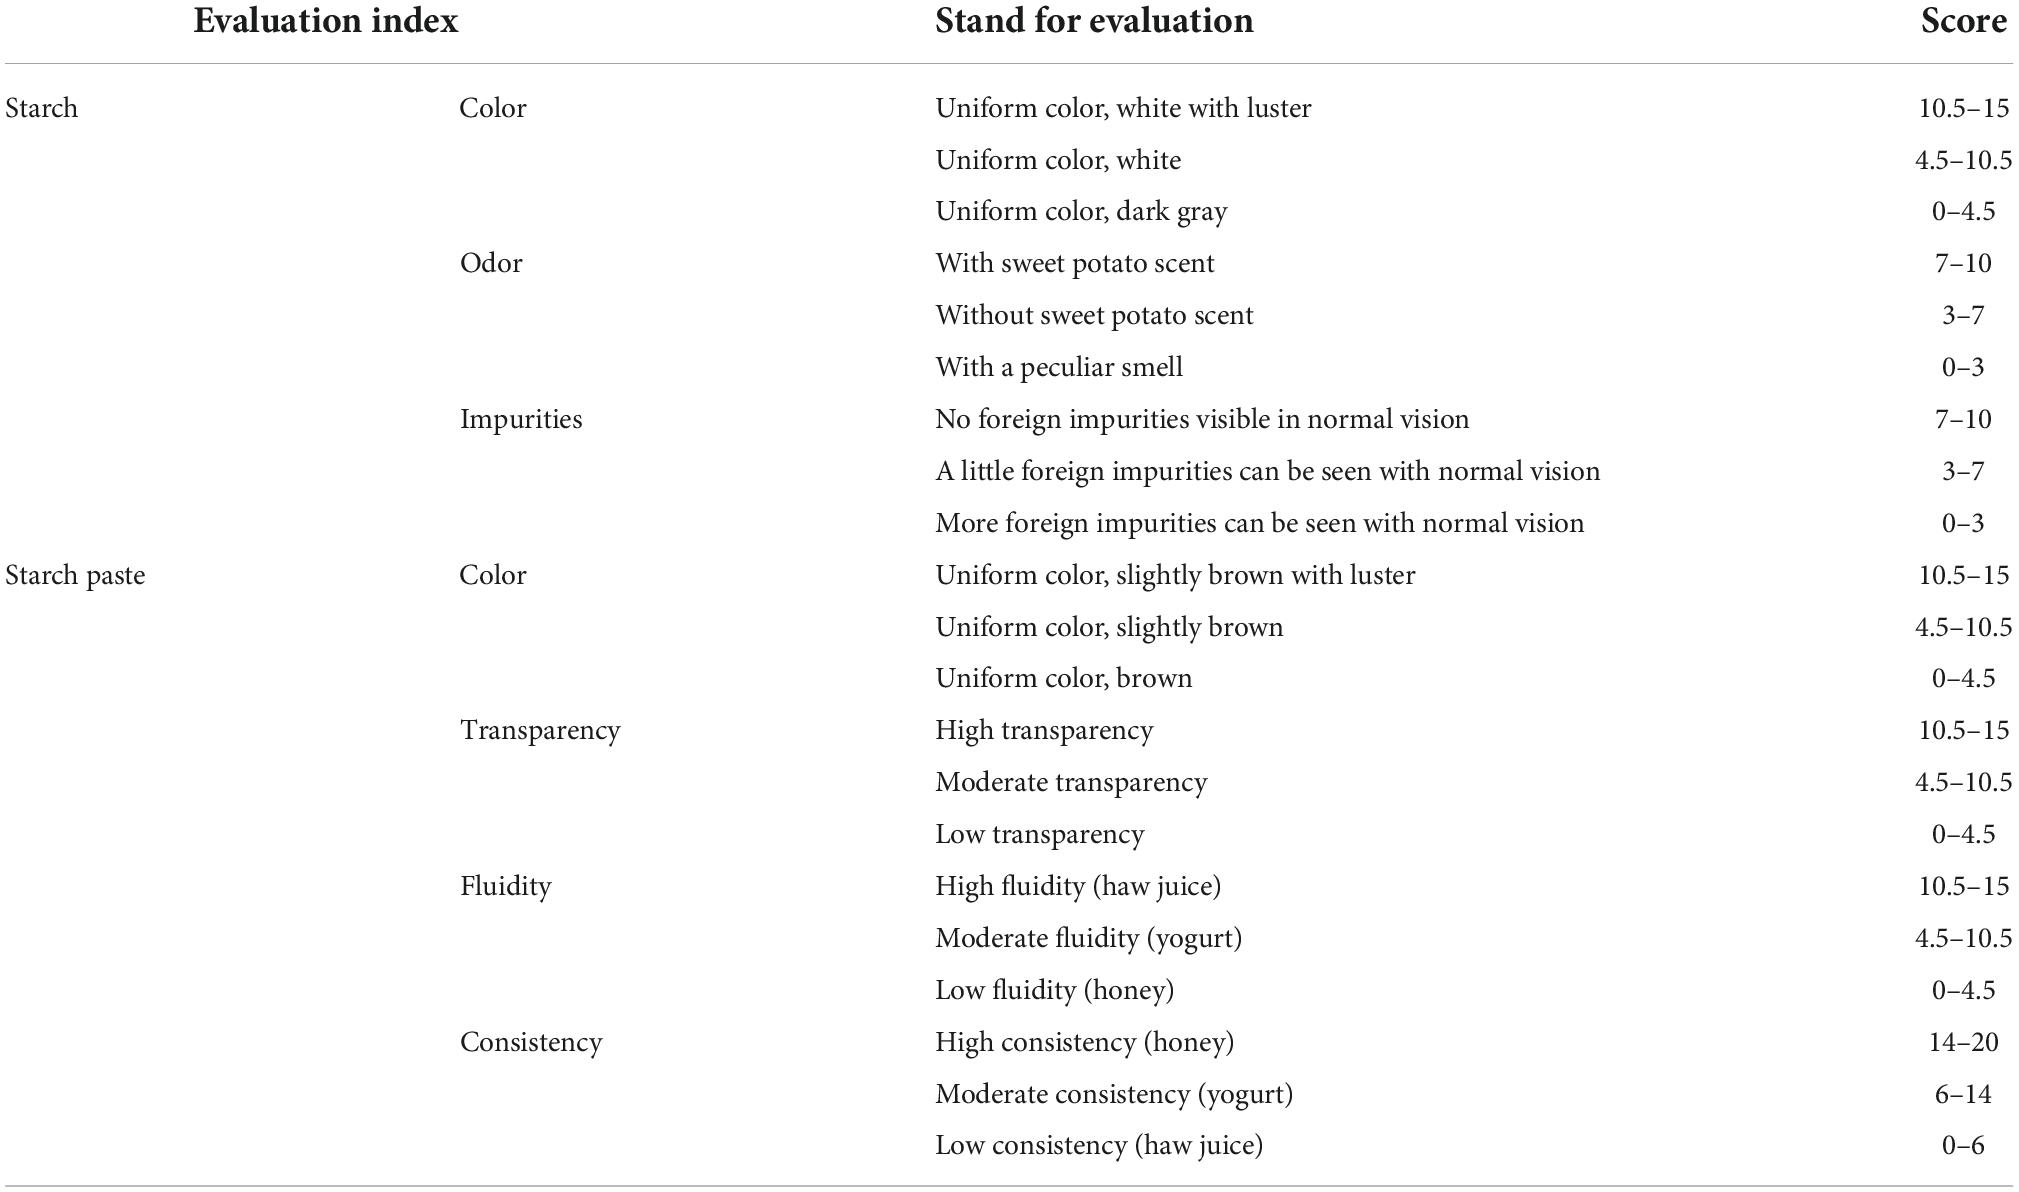
Sensory evaluation uses sensory organs to evaluate the sensory characteristics of a product and to predict the quality of the product (38, 39). Sensory evaluation was used to investigate the accuracy of the evaluation model established by the AHP. The sensory evaluation indexes of sweet potato starch mainly include color, odor, impurities of starch, and color, transparency, fluidity and consistency of starch paste. The sensory evaluation indexes and proportions were determined according to Song et al. (40, 41) (Table 9).
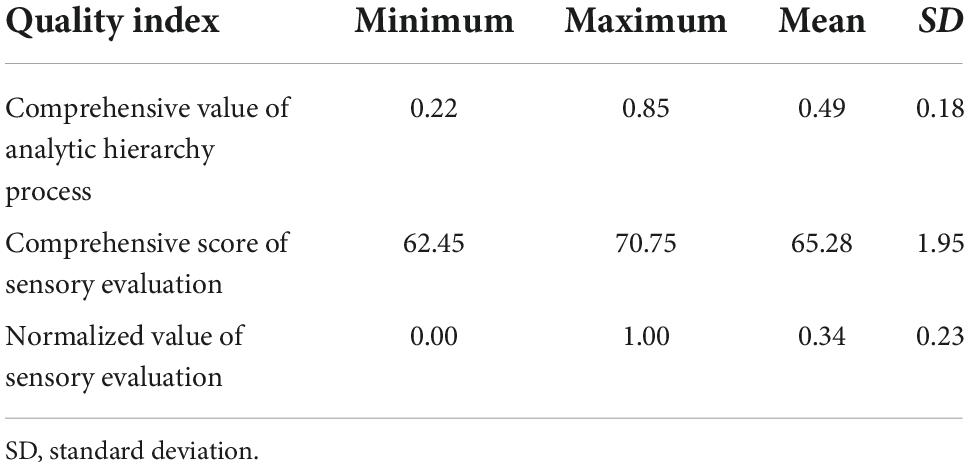
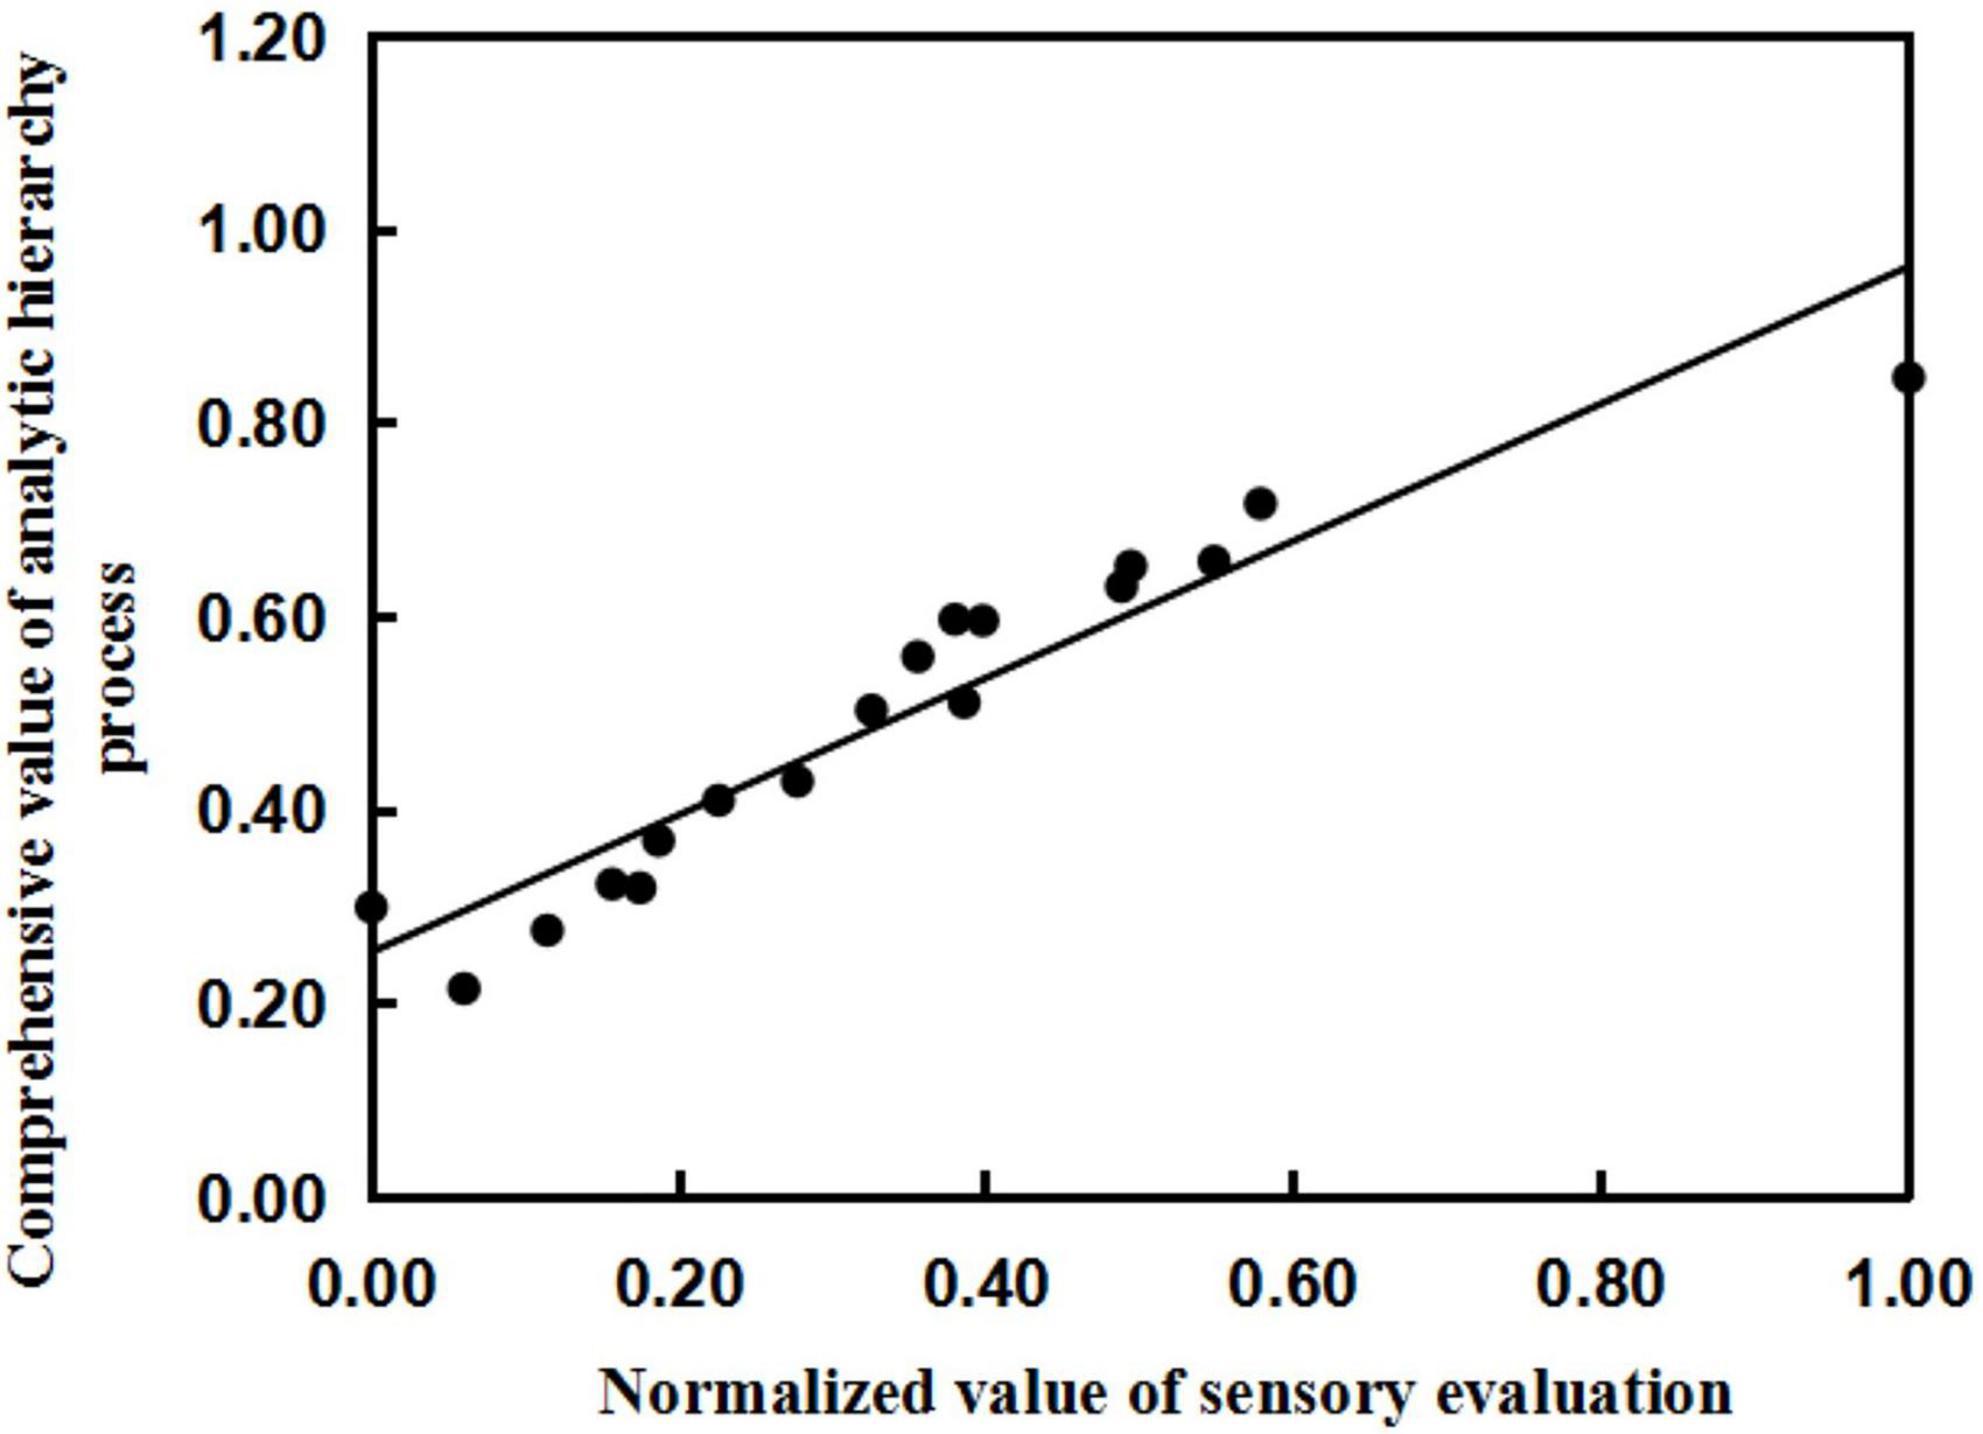
The comprehensive score of the sensory evaluation was normalized (Table 10), and the normalized value of the sensory evaluation and the comprehensive value of the AHP were fitted by regression analysis. The x-axis is the normalized value of the sensory evaluation, and the y-axis is the result of model calculation (comprehensive value of the AHP). The linear relationship between the two was obtained as follows: y = 0.708x + 0.253, R2 = 0.903 (Figure 2). The results show that the established quality evaluation model for brewing sweet potato starch can fit the normalized values of sensory evaluation and the comprehensive value of the AHP well. The results show that the comprehensive evaluation system of sweet potato starch can accurately predict the quality of sweet potato starch, indicating that it is reasonable and feasible to use the mathematical model to evaluate the quality of sweet potato starch.
Discussion
Sweet potato starch is one of the important processing materials, and its quality greatly affects the properties of starch processing products. There are many factors affecting the quality of sweet potato starch, including sensory quality and processing quality (42). Some of these factors are closely related and complicated to determine. Currently, there is no systematic quality evaluation system for sweet potato starch. In this study, 22 indexes of sweet potato starch were determined. The moisture content and total starch content of different sweet potato starch was similar, but the ash content, amylose and amylopectin content were significantly different. These differences affected the physicochemical properties of starch and the quality of starch products. Yong et al. found that amylose content was significantly positively correlated with enthalpy of gelatinization from purple sweet potato with different varieties (43). The study of Yu et al. found that the amylose content in sweet potato starch significantly affected the cooked weight and broken rate of starch noodles (13). The color of 18 kinds of sweet potato starch was slightly different. However, except for a* value, the variation coefficient of other color parameters was small. The RVA viscograph of 18 kinds of sweet potato starch was different. Both morphology and structural of starch and alkali concentration affected pasting properties. Liu et al. and Cardoso et al. found that the pasting properties of starch were affected by the granule size and shape, amylose and phosphorus contents, amylopectin chain length, size and molecular structure of crystallization region, and also affected the quality of starch and starch products (44, 45). The WAC of 18 kinds of sweet potato starches had small difference, while the OAC varied widely. Currently, scholars have different understandings of the differences in WAC. Yang et al. and Singh et al. believed that the high content of hydrophilic groups in starch particles, or exposure of hydrophilic groups, can cause a strong water absorption capacity (31, 46). Zhou et al. suggested that WAC was affected by the proportion of damaged starch in starch, because the water absorption capacity of damaged starch was 2.5 times that of ordinary starch (47). In addition, the WAC of starch was also affected by the size of starch particles, the tightness of structure and the relative humidity of external environment. The OAC depended on the molecular structure difference of starch (48). The solubility and SP of 18 kinds of sweet potato starch were significantly different. Upon heating of the starch paste, changes in the granule size and shape, crystallinity, degree of branching, and complexation of amylose and lipid affected the solubility and SP of starch. These changes also account for the differences between sweet potato starches. Moreover, environmental factors such as external temperature and the addition of exogenous substances also affect the solubility and swelling power of starch (49). The RR of 18 kinds of sweet potato starch was different, and was related to the amount of amylose and lipid in the starch. This was because the lipid could form a complex with amylose, which prevented the expansion of starch particles during gelatinization (50, 51). In addition, the chemical structure, molecular weight, and conformation in carbohydrate aqueous solution affected the interaction between starch molecules, thus affecting the RR of starch gel.
There is a relationship between the composition and physicochemical properties of starch. Consistent with the findings of Yu et al. (13), we found that when the total starch content was high, the amylopectin content was also higher, possibly because amylopectin was dominant in sweet potato starch, and the change of amylopectin more affected the change of total starch. The total starch content was negatively correlated with the setback value. However, Yu et al. believed that there was no obvious change rule between total starch content and setback value (13). The weak correlation between total starch content and setback value may be due to the accidental error. The AA was positively correlated with amylose content, and negatively correlated with amylopectin content. This is due to the definition of the AA. Besides, AA was positively correlated with peak viscosity. But Hou et al. found AA was negatively correlated with peak viscosity (52). The reason for the inconsistency may be that amylose and amylopectin have complex structures, and the AA is only an index to measure the ratio of amylose and amylopectin. It’s these microscopic structures that really affect the peak viscosity. When the amylose content was high, the proportion of chain A was low and the proportion of chain B1 was high, the peak viscosity of starch paste was high (11, 13, 53). Amylose content was positively correlated with OAC and negatively correlated with SP. The reason for this is that amylose forms a complex with lipid, which increases lipid absorption. Further, the complex will affect water absorbing capacity and swelling capacity in starch (49). We also noticed that amylose was positively correlated with RR, which was consistent with the study of Zhang et al. (54). Amylopectin was negatively correlated with BD and SB. This is because the cluster structure of amylopectin makes the starch chain hard to re-order and difficult to retrogradation. Therefore, when amylopectin content is high, the RR of starch is low and the starch is stable and not easy to disintegrate (55). L* value was positively correlated with ΔE. It may be that L* plays a dominant role in the calculation of ΔE, so L* greatly affects ΔE. The PV was positively correlated with TV, BD, FV and setback value. The TV was positively correlated with the FV and setback value. The FV was negatively correlated with the setback value. These results were consistent with the research of Hou et al. and Zhang et al. (52, 54).
In SPA, seven indexes, namely SB, RR, AA, GS, a* value, ash content, and solubility, were selected as the core indexes of the quality evaluation of sweet potato starch. The seven indexes are independent of each other. The a* was chosen as the evaluation index because a* value reflects the red and green value of sweet potato starch, which can be used to evaluate the color quality of sweet potato starch (11). The bad color of starch will affect the quality of starch and starch products, especially the quality of starch noodle. AA was chosen because AA is a basic component of starch and an important factor in determining starch properties and food functions (56). The AA affects the solubility and swelling of starch, and then affects the quality of starch noodle. The ash content was chosen because ash content is mineral and metal oxides in starch, which reflects the quality of starch. Hou et al. found that ash content was significantly positively correlated with setback value, reflecting the characteristics of starch (52). Solubility was chosen because solubility reflects the interaction between starch and water, and greatly affects the quality of starch products (20). When the solubility is small, the texture property and elasticity of starch noodle are good. The SB and RR were chosen because SB and RR reflect the recrystallization ability of starch molecules. The short-term retrogradation process of starch is due to the reorientation of dissolved amylose molecules in a parallel alignment, while long-term retrogradation is represented by the slow recrystallization of the outer branches of amylopectin (57, 58). When the RR is high, the starch paste stability is poor and the brewing ability is not good. The GS was chosen because GS refers to the firmness of the gel after the starch paste is cooled, which is one of the factors used to evaluate the quality of starch. The shorter the recrystallization time during starch aging is, the greater the GS is (20). Sweet potato starch with high gel strength is suitable for making jelly and other products that have certain requirements on gel strength.
Evaluation model of sweet potato starch is the core part of evaluation system. The R2 of the sweet potato starch model established in this study reached 0.903. The results showed that the starch quality could be predicted well. Compared with the existing evaluation methods of sweet potato starch, the evaluation method established in this study integrated all the core evaluation indexes, and scientifically assigned weights to each index. So far, there is no systematic quality evaluation method for sweet potato starch, however, similar methods have been applied to the evaluation of fresh fruit. Bai et al. took different varieties of apples as the research objects, measured the quality indexes of fresh apples, analyzed the distribution of indexes and the correlation among indexes, screened eight evaluation indexes such as SSC, and finally established the comprehensive quality evaluation method of fresh apples by objective assignment method (59). Nie et al. (60) established a quality evaluation model for apple juice. He measured the quality indexes of Fresh apple juice, screened the evaluation indexes of fresh apple juice by factor analysis, decided the weight by analytic hierarchy process, and established discrimination functions of fresh apple juice quality by K-means cluster and discriminant analysis. The established discriminant function has high accuracy and can be used to distinguish the quality of apple juice (60). The accuracy of the quality evaluation model of sweet potato starch is similar to that of the fresh fruit model, which indicates that it is reasonable and feasible to establish sweet potato starch quality evaluation model based on multivariate statistical analysis method. In this study, we expanded the research object of the quality evaluation model from fresh food to processed products, which provided a new idea and method for the evaluation of processed products.
Conclusion
A quality evaluation system of brewing sweet potato starch was established based on a multivariate statistical analysis method. There were different degrees of correlation among different evaluation indexes. Seven core indexes, namely SB, RR, AA, GS, a* value, ash content, and solubility, were screened by PCA. The quality evaluation model of sweet potato starch was Y = 0.034X2 + 0.321X6 + 0.141X8 + 0.08X17 + 0.023X19 + 0.08X21 + 0.321X22. The comprehensive quality evaluation system of sweet potato starch established in this experiment is of great significance for the post-harvest processing of high-starch sweet potato. The results provide a new idea for the quality evaluation of sweet potato starch and its products.
Data availability statement
The original contributions presented in this study are included in the article/supplementary material, further inquiries can be directed to the corresponding authors.
Author contributions
CM: investigation, formal analysis, writing – original draft, writing – review and editing. WZ: chemical analysis. YZ and RY: data analysis. YL, ZM, and HZ: contributed reagent, analysis tools, and materials. JS and FN: conceptualization, methodology, and supervision. All authors contributed to the article and approved the submitted version.
Funding
This work was supported by the National Key R&D Program of China (Grant No. 2020YFD1001400), the earmarked fund for CARS-10-Sweetpotato (CARS-10-GW22), and the Scientific Research Fund Project of the Xuzhou Academy of Agricultural Sciences (XM2021006).
Acknowledgments
We thank LetPub (www.letpub.com) for its linguistic assistance during the preparation of this manuscript. We also thank Fei Xu and Shaoying Deng for providing tools and reagents used in the experiment.
Conflict of interest
Author YL was employed by Hebei Zhongshu Agricultural Technology Group Co., Ltd.
The remaining authors declare that the research was conducted in the absence of any commercial or financial relationships that could be construed as a potential conflict of interest.
Publisher’s note
All claims expressed in this article are solely those of the authors and do not necessarily represent those of their affiliated organizations, or those of the publisher, the editors and the reviewers. Any product that may be evaluated in this article, or claim that may be made by its manufacturer, is not guaranteed or endorsed by the publisher.
Abbreviations
PCA, principal component analysis; AHP, analytic hierarchy process; AA, ratio of amylose to amylopectin; WAC, water absorption capacity; OAC, oil absorption capacity; PV, peak viscosity; TV, trough viscosity; FV, final viscosity; BD, breakdown; SB, setback; PT, pasting temperature; SP, swelling power; RR, rate of retrogradation; GS, gel strength.
References
1. Corre DL, Angellier-Coussy H. Preparation and application of starch nanoparticles for nanocomposites: A review. React Funct Polym. (2014) 85:97–120. doi: 10.1016/j.reactfunctpolym.2014.09.020
2. Vanier NL, Halal S, Dias A, Zavareze EDR. Molecular structure, functionality and applications of oxidized starches: A review. Food Chem. (2017) 221:1546–59. doi: 10.1016/j.foodchem.2016.10.138
3. Pérez S, Bertoft E. The molecular structures of starch components and their contribution to the architecture of starch granules: A comprehensive review. Starch Stärke. (2010) 62:389–420. doi: 10.1002/star.201000013
4. Tong C, Ru W, Wu L, Wu WC, Bao JS. Fine structure and relationships with functional properties of pigmented sweet potato starches. Food Chem. (2020) 311:126011. doi: 10.1016/j.foodchem.2019.126011
5. Han XZ, Hamaker BR. Amylopectin fine structure and rice starch paste breakdown. J Cereal Sci. (2001) 34:279–84. doi: 10.1006/jcrs.2001.0374
6. Xu MY, Zhao XY, Zhang LH, Jia HY, Chen QC, Liu JL. The nutritional value and health care function of sweet potato. China Fruits Veg. (2017) 37:17–21+47. doi: 10.19590/j.cnki.1008-1038.2017.05.006
7. Qin Z, Li AX, Dong SX, Wang QM, Hou FY, Zhang HY. Comparative transcriptome analysis of hybrid population provides insights into starch content in sweet potato (Ipomoea batatas L.) storage root. Plant Mol Biol Rep. (2021) 39:673–84. doi: 10.1007/s11105-021-01282-x
8. Dincer C, Karaoglan M, Erden F, Tetik N, Topuz A, Ozdemir F. Effects of baking and boiling on the nutritional and antioxidant properties of sweet potato [Ipomoea batatas(L.) Lam.] cultivars. Plant Foods Hum Nutr. (2011) 66:341–7. doi: 10.1007/s11130-011-0262-0
9. Bovell-Benjamin AC. Sweet potato: A review of its past, present, and future role in human nutrition. Adv Food Nutr Res. (2007) 52:1–59. doi: 10.1016/S1043-4526(06)52001-7
10. Aina AJ, Falade KO, Akingbala JO, Titus P. Physicochemical properties of twenty-one Caribbean sweet potato cultivars. Int J Food Sci Technol. (2010) 44:1696–704. doi: 10.1111/j.1365-2621.2009.01941.x
11. Sun ZX, Mu TH, Ma MM, Feng YY. Effects of the mixture starches form different sweet potato varieties on the physicochemical characteristics and quality properties of starch noodles. Sci Technol Food Ind. (2020) 41:77–85. doi: 10.13386/j.issn.1002-0306.2020.02.085
12. Menon R, Padmaja G, Jyothi AN, Asha V, Sajeev MS. Gluten-free starch noodles from sweet potato with reduced starch digestibility and enhanced protein content. J Food Sci Technol. (2016) 53:3532–42. doi: 10.1007/s13197-016-2330-9
13. Yu SX, Xing LJ, Mu TH, Zhang M, Sun HN, Chen JW. Study on the correlation of starch composition, physicochemical properties and starch noodles quality of 4 different sweet potato varieties. J Nucl Agric Sci. (2015) 29:734–42. doi: 10.11869/j.issn.100-8551.2015.04.0734
14. Tan HZ, Li ZG, Tan B. Starch noodles: History, classification, materials, processing, structure, nutrition, quality evaluating and improving. Food Res Int. (2009) 42:551–76. doi: 10.1016/j.foodres.2009.02.015
15. Xing LJ, Mu TH, Zhang M, Yu SX, Yang HY. Effects of whole purple sweet potato flour on physicochemical properties of sweet potato starch and properties of starch noodles. J Nucl Agric Sci. (2015) 29:484–92. doi: 10.11869/j.issn.100-8551.2015.03.0484
16. Vithu P, Dash SK, Rayaguru K, Panda MK, Nedunchezhiyan M. Optimization of starch isolation process for sweet potato and characterization of the prepared starch. J Food Meas Charact. (2020) 14:1–13. doi: 10.1007/s11694-020-00401-8
17. Aoac. Official methods of analysis. 21st ed. Rockville, MD: Association of official Analytical Chemists (2000).
18. Qi YY, Wang N, Yu JL, Wang S, Wang SJ, Copeland L. Insights into structure-function relationships of starch from foxtail millet cultivars grown in China. Int J Biol Macromol. (2018) 155:1176–83. doi: 10.1016/j.ijbiomac.2019.11.085
19. Wani IA, Hamid H, Hamdani AM, Gani A, Ashwar BA. Physico-chemical, rheological and antioxidant properties of sweet chestnut (Castanea sativa Mill.) as affected by pan and microwave roasting. J Adv Res. (2017) 8:399–405. doi: 10.1016/j.jare.2017.05.005
20. Qian SY, Tang MQ, Gao Q, Wang XW, Zhang JW, Tanokura M, et al. Effect of different modification methods on the physicochemical and rheological properties of Chinese yam (Dioscorea opposite Thunb.) starch. LWT Food Sci Technol. (2019) 116:108513. doi: 10.1016/j.lwt.2019.108513
21. Wang DW, Liu HC, Song CC, Wei CG, Liu TT. Ultrasonic-assisted extraction and characterization of potato starch. Food Sci. (2013) 34:17–22. doi: 10.7506/spkx1002-6630-201316004
22. Chen ZH. Physicochemical properties of sweet potato starches and their application in noodle products. Wageningen: Wageninge University (2003).
24. Deng TT, Xiao YD, Liu CQ, Xu YY, Zheng TS, Li DJ, et al. Quality evaluation of different varieties of freeze-dried seedless grape crisp. Sci Technol Food Ind. (2020) 41:298–306. doi: 10.13386/j.issn1002-0306.2020.02.048
25. Ge SL. Based on 1-9 scale method to evaluate the functional evaluation coefficient. Value Eng. (1989) 1:33–4. doi: 10.14018/j.cnki.cn13-1085/n.1989.01.014
26. Liu X, Wang P, Bi JF, Wang X, Yang AJ, Lv J. Quality evaluation of late maturity apple chips based on analytic hierarchy process. Food Mach. (2012) 28:46–50. doi: 10.3969/j.issn.1003-5788.2012.05.012
27. Rocha TS, Caeneiro APA, Franco CML. Effect of enzymatic hydrolysis on some physicochemical properties of root and tuber granular starches. Ciênc Tecnol Aliment Campinas. (2010) 30:544–51. doi: 10.1590/S0101-20612010000200039
28. Galvez FCF, Resurrenccion AVA. Reliability of the focus group technique in determining the quality characteristics of mungbean (Vignaradiata (L.)) noodles. J Sens Stud. (1992) 7:315–26. doi: 10.1111/j.1745-459X.1992.tb00197.x
29. Ma C, Sun J, Zhang YY, Niu FX, Zhu H, Xu F, et al. Structural and physicochemical properties and processing applications of sweet potato starch. Acta Agric Jiangxi. (2021) 33:54–62. doi: 10.19386/j.cnki.jxnyxb.2021.12.009
30. Wang HL, Yang QH, Ferdinand U, Gong XW, Qu Y, Gao WC, et al. Isolation and characterization of starch from light yellow, orange, and purple sweet potatoes. Int J Biol Macromol. (2020) 160:660–8. doi: 10.1016/j.ijbiomac.2020.05.259
31. Singh R, Sharanagat VS. Physico-functional and structural characterization of ultrasonic-assisted chemically modified elephant foot yam starch. Int J Biol Macromol. (2020) 164:1061–9. doi: 10.1016/j.ijbiomac.2020.07.185
32. Trung PTB, Ngoc LBB, Hoa PN, Tien NNT, Hung PV. Impact of heat-moisture and annealing treatments on physicochemical properties and digestibility of starches from different colored sweet potato varieties. Int J BiolMacromol. (2017) 105:1071–8. doi: 10.1016/j.ijbiomac.2017.07.131
33. Rodríguez-Garciapiña JL, Beltrán-Pérez G, Castillo-Mixcóatl J, Muñoz-Aguirre S. Application of the principal components analysis technique to optical fiber sensors for acetone detection. Opt Laser Technol. (2021) 143:107314. doi: 10.1016/j.optlastec.2021.107314
34. Amaya A, Martínez R, CerónMuñoz M. Selection indexes using principal component analysis for reproductive, beef and milk traits in Simmental cattle. Trop Anim Health Prod. (2021) 53:378. doi: 10.1007/S11250-021-02815-Y
35. Liu W, Liu X, Yang XF, Yin Q, Zhang YR, Liu Q, et al. Determination of amino acid content and principal component analysis of auricularia auricular form different regions. J Food Saf Qual. (2021) 12:8068–75. doi: 10.19812/j.cnki.jfsq11-5956/ts.2021.20.023
36. Wang SW, Sun HB, Chang H, Zhong S, Zhao JS, Wang XN. Comprehensive evaluation of fruit quality of baitangying litchi based on principal component analysis. J Fruit Sci. (2022) 39:610–20. doi: 10.13925/j.cnki.gsxb.20210365
37. Shi C, Yang X, Han S, Fan BL, Zhao ZY, Wu XM, et al. Nondestructive prediction of tilapia fillet freshness during storage at different temperatures by integrating an electronic nose and tongue with radial basis function neural networks. Food Bioprocess Technol. (2018) 11:1840–52. doi: 10.1007/s11947-018-2148-8
38. Liu DY, Dong L, Tan Y, Liu H. Methodology and application of sensory evaluation technology in food science. Food Sci. (2016) 37:254–8. doi: 10.7506/spkx1002-6630-201605044
39. Shi BL, Zhao L, Wang HY, Zhi RC, Huan C, Yun ZY, et al. Overview of assessment techniques for sensory panel and panelist performance. Food Sci. (2014) 35:29–35. doi: 10.7506/spkx1002-6630-201408006
40. Song X. Screening and processing of thickening sauce for braised sea cucumber. Dalian: Dalian Polytechnic University (2019).
41. General Administration of Quality Supervision, Inspection and Quarantine of the People’s Republic of China,. Standardization administration of the people’s republic of China. GB/T25733-2010 lotus rhizome powder. (2010). Available online at: http://down.foodmate.net/standard/sort/3/28560.html (accessed August, 2022).
42. Klaochanpong N, Puttanlek C, Rungsardthong V, Puncha-Arnon S, Uttapap D. Physicochemical and structural properties of debranched waxy rice, waxy corn and waxy potato starches. Food Hydrocoll. (2015) 45:218–26. doi: 10.1016/j.foodhyd.2014.11.010
43. Yong HM, Wang XC, Sun J, Fang Y, Liu J, Jin CH. Comparison of the structural characterization and physicochemical properties of starches from seven purple sweet potato varieties cultivated in China. Int J Biol Macromol. (2018) 120:1632–8. doi: 10.1016/j.ijbiomac.2018.09.182
44. Liu J, Wang XC, Wen FT, Zhang SR, Shen RR, Jiang W, et al. Morphology, structural and physicochemical properties of starch from the root of Cynanchum auriculatum Royle ex wight. Int J Biol Macromol. (2016) 93:107–16. doi: 10.1016/j.ijbiomac.2016.08.063
45. Cardoso MB, Putaux JL, Samios D, da Silveira NP. Influence of alkali concentration on the deproteinization and/or gelatinization of rice starch. Carbohydr Polym. (2007) 70:160–5. doi: 10.1016/j.carbpol.2007.03.014
46. Yang YC. The process and influencing factors of starch gelatinization. Prod Process. (2009) 2:18–9. doi: 10.3969/j.issn.1671-9646-C.2009.02.010
47. Zhou XJ, Yu SJ, Chen K, Ji MY, Chen SYS, Luan GZ. Effect of gelatinization by extrusion on physicochemical properties of tartary buckwheat flour. Food Sci. (2018) 39:101–6. doi: 10.7506/spkx1002-6630-201811016
48. Guo L, Liu R, Li XL, Sun Y, Du XF. The physical and adsorption properties of different modified corn starches. Starch Stärke. (2015) 64:237–46. doi: 10.1002/star.201400200
49. Chung HJ, Liu Q, Hoover R. Impact of annealing and heat-moisture treatment on rapidly digestible, slowly digestible and resistant starch levels in native and gelatinized corn, pea and lentil starches. Carbohydr Polym. (2008) 75:436–47. doi: 10.1016/j.carbpol.2008.08.006
50. Wang SJ, Wang JR, Yu JL, Wang S. Effect of fatty acids on functional properties of normal wheat and waxy wheat starches: A structural basis. Food Chem. (2016) 190:285–92. doi: 10.1016/j.foodchem.2015.05.086
51. Gerits LR, Pareyt B, Delcour JA. Wheat starches swelling, gelatinization and pasting: Effects of enzymatic modification of wheat endogenous lipids. LWT Food Sci Technol. (2015) 63:361–6. doi: 10.1016/j.lwt.2015.02.035
52. Hou FY, Chen GL, Dong BT, Qin Z, Li AX, Zhang LM, et al. Comparative study on starch composition, physicochemical and noodle quality from different sweet potato varieties. J Nucl Agric Sci. (2022) 36:392–401. doi: 10.11869/j.issn.100-8551.2022.02.0392
53. Hsieh CF, Liu W, Whaley JK, Shi YC. Structure and functional properties of waxy starches. Food Hydrocoll. (2019) 94:238–54. doi: 10.1016/j.foodhyd.2019.03.026
54. Zhang LW, Ju X, Li XX, Hu XY, Ji HF, Bi JC, et al. Physicochemical properties and their correlation ofstarches from eight sweet potato cultivars. Sci Thchnol Food Ind. (2021) 42:26–32.
55. Wang YY. Mechanism of amylopectin retrogradation induced by crystal seeds. Wuxi: Jiangnan University (2021).
56. Karakelle B, Kian-Pour N, Toker OS, Palabiyik I. Effect of process conditions and amylose/amylopectin ratio on the pasting behavior of maize starch: A modeling approach. J Cereal Sci. (2020) 94:102998. doi: 10.1016/j.jcs.2020.102998
57. Matignon A, Tecante A. Starch retrogradation: From starch components to cereal products. Food Hydrocoll. (2017) 68:43–52. doi: 10.1016/j.foodhyd.2016.10.032
58. Tan Y, Li Y, Xu X, Jin Z. Starch retrogradation studied by themogravimetric analysis (TGA). CarbohydrPolym. (2011) 84:1165–8. doi: 10.1016/j.carbpol.2011.01.006
59. Bai SS. The research on quality evaluation of fresh apples. Beijing: Chinese Academy of Agricultural Sciences (2012).
Keywords: sweet potato starch, principal component analysis, analytic hierarchy process, quality evaluation system, evaluation model
Citation: Ma C, Zhang Y, Yue R, Zhang W, Sun J, Ma Z, Niu F, Zhu H and Liu Y (2022) Establishment of a quality evaluation system of sweet potato starch using multivariate statistics. Front. Nutr. 9:1025061. doi: 10.3389/fnut.2022.1025061
Received: 22 August 2022; Accepted: 29 September 2022;
Published: 18 October 2022.
Edited by:
Cheng Li, University of Shanghai for Science and Technology, ChinaReviewed by:
Rafeeya Shams, Sher-e-Kashmir University of Agricultural Sciences and Technology of Jammu, IndiaLuis Arturo Bello-Perez, Instituto Politécnico Nacional (IPN), Mexico
Chuan Tong, Zhejiang University of Technology, China
Copyright © 2022 Ma, Zhang, Yue, Zhang, Sun, Ma, Niu, Zhu and Liu. This is an open-access article distributed under the terms of the Creative Commons Attribution License (CC BY). The use, distribution or reproduction in other forums is permitted, provided the original author(s) and the copyright owner(s) are credited and that the original publication in this journal is cited, in accordance with accepted academic practice. No use, distribution or reproduction is permitted which does not comply with these terms.
*Correspondence: Ruixue Yue, eXVlcnVpeHVlXzE5ODNAMTYzLmNvbQ==; Jian Sun, c2pzZzk5MDJAMTI2LmNvbQ==
 Chen Ma
 Yi Zhang
 Ruixue Yue1*