 Guowei Man1
 Yongtao Wang
 Zhenzhen Xu
95% of researchers rate our articles as excellent or good
Learn more about the work of our research integrity team to safeguard the quality of each article we publish.
Find out more
ORIGINAL RESEARCH article
Front. Nutr. , 24 January 2022
Sec. Food Chemistry
Volume 8 - 2021 | https://doi.org/10.3389/fnut.2021.807447
Pomegranate is widely cultivated across China, and the phenolics in its peel are principal components associated with health benefits. Ultra-high performance liquid chromatography coupled to a quadrupole time-of-flight mass spectrometer (UHPLC-QTOF-MS) and ultra-performance liquid chromatography coupled to a triple quadrupole mass spectrometer (UPLC-QQQ-MS) were used in this study, aiming at profiling the total phenolic composition in pomegranate peel from nine selected cultivars in 7 production areas. Sixty-four phenolic compounds were identified or annotated, and 23 of them were firstly reported in pomegranate peel. Principal component analysis (PCA) plots show differences and similarities of phenolics among nine cultivars. Furthermore, 15 phenolic compounds were quantified with the standards, and punicalagin, ellagic acid, gallocatechin, punicalin, catechin, and corilagin were found to be dominant. Punicalagin weighed the highest content (28.03–104.14 mg/g). This study can provide a deeper and more detailed insight into the phenolic composition in pomegranate peel and facilitate the health-promoting utilization of phenolics.
Pomegranate (Punica granatum L.) has been cultivated with a wide geographical global distribution, namely, China, India, Russia, Iran, Uzbekistan, Afghanistan, Spain, Italy, Greece, Morocco, and America (1). China possesses the genetic diversity of pomegranate cultivars, and pomegranates are planted in 7 main production areas (Xinjiang, Yunnan, Sichuan, Shanxi, Henan, Anhui, and Shandong) (2).
Pomegranate peel is about 50% proportion of the fruit weight. Compared with any other anatomical part of the fruit, pomegranate peel has the most promising pool of phenolics (3). With medicinal and nutritional benefits, a variety of phenolic compounds (such as phenolic acids, flavonoids, and tannins) have attracted the attention of many researchers, and many food products and supplements (such as stabilizers, preservatives, prebiotics, and quality enhancers) have been developed based on pomegranate peel (4). Phenolic compounds, as secondary metabolites, are inhomogeneously distributed in plants, and there is a close relationship between phenolic structures and properties (5). In addition, the content of phenolics may have a significant effect on related health benefits, which lead researchers to extract, separate, and quantify these compounds with rapid, simple, environmentally friendly, and comprehensive methods (6). Thus, more effective and comprehensive approaches for annotation and quantification of the phenolic compounds in pomegranate peel were of vital importance.
For qualitative analysis, additional structural information for identification is provided by tandem mass spectrometry (MS/MS or MSn) experiments (7). With exact mass and highly sensitive and convenient manner of fragmentation pattern, high-resolution and accuracy mass spectral detectors possess the advantages for qualitative studies (8). Ultra-high performance liquid chromatography coupled to a quadrupole time-of-flight mass spectrometer (UHPLC-QTOF-MS) has been used to investigate the composition of food. LC-MS has been widely used for phenolic compound identification in pomegranate peel, and the discovery covers a wide range of phenolic compounds. Also, the comparison among different cultivars is another issue that draws attention from researchers. Abid et al. (9) investigated the phenolic profile of four Tunisian pomegranate peels by liquid chromatographic tandem mass spectrometry (LC-MS/MS) with a total of 24 phenolic compounds differently distributed among them. In addition, the high-resolution instrument of the LC-MS is used. Du et al. (10) investigated phenolic compounds in pomegranate peel from two producing areas in China using the UHPLC-QTOF-MS with the identification of gallic acid, punicalagin, catechin, and ellagic acid. However, there is little comprehensive research regarding the phenolic composition discovery and comparison with different cultivars in pomegranate peel using the UHPLC-QTOF-MS. For quantification, multiple reaction monitoring (MRM), generally requiring standards, becomes a powerful analysis mode in LC-MS/MS and can be used for absolute quantitation of targeted compounds (11, 12). Although MRM has been applied to pomegranate peel investigation (13), over a dozen of main phenolic compounds in pomegranate peel to be absolutely quantified in one analysis under MRM mode are scarcely reported.
Based on the diversity of pomegranate cultivars in China, the aim of this study was to comprehensively investigate the phenolic composition from nine selected cultivars by UHPLC-QTOF-MS and ultra-performance liquid chromatography coupled to a triple quadrupole mass spectrometer (UPLC-QQQ-MS) with optimized conditions under MRM mode. With nine cultivars to be investigated and the use of UHPLC-QTOF-MS, more phenolic compounds are expected to be discovered or understood in this study.
Methanol (HPLC grade, 99.9%), ethanol (HPLC grade, 99.8%), acetonitrile (LC/MS grade, 99.9%), and formic acid (LC/MS grade) were all purchased from Thermo Fisher Scientific Technology Co., Ltd. (Shanghai, China). Standard compounds, namely, punicalagin, punicalin, corilagin, ellagic acid, gallic acid, catechin, epicatechin, epicatechin gallate, gallocatechin, epigallocatechin, epigallocatechin gallate, kaempferol-3-O-glucoside, isoquercitrin, luteolin-7-O-glucoside, naringenin-7-O-glucoside, and rutin, were all purchased from Yuanye Biotechnology Co., Ltd. (Shanghai, China).
There were seven main production areas in China and we selected the cultivars from all seven production areas with the most representativeness. Nine cultivars of pomegranate fruit, Red agate (RA) from Huaiyuan County (Anhui Province, China), Tunisian Soft Seed (TSS) from Yingyang city (Henan Province, China), Sweet With Green Seed (SGS) from Mengzi County (Yunnan Province, China), Green Peel Soft Seed (GPSS) from Huili County (Sichuan Province, China), Green Peel (GP) from Zaozhuang city (Shandong Province, China), Net Skin Sweet (NSS) from Lintong district (Shanxi Province, China), Piyaman (PYM) from Hetian prefecture (Xinjiang Uygur Autonomous Region, China), Acidic Pomegranate (AP) from Kashgar prefecture (Xinjiang Uygur Autonomous Region, China), Sweet Pomegranate (SP) from Kashgar prefecture (Xinjiang Uygur Autonomous Region, China) were collected. Supplementary Figure 1 (the map was generated by EdrawMax 10.5) shows the overview of geographical distribution with selected cultivars in China. Fresh pomegranates of all cultivars were purchased from their production areas, respectively, and then transported by air to the laboratory. The peel was manually separated, dried by the lyophilization method, and ground by a JYS-M01 grinder (Joyoung Co., Ltd, Jinan city, China). The powder was sieved by a 40 mesh sieve and the undersize was collected. Water is an environmentally friendly solvent and it is widely used in phenolic extraction of pomegranate peel (13, 14). The acidic solution could contribute to the stability of phenolics (15). With some modifications of published articles (13–15), the extraction procedure was carried out with a solid-solvent ratio of 1 g: 50 ml (0.3% formic acid aqueous solution) for half an hour. Subsequently, the extracted solution was filtered by a 0.22 μm polyethersulfone membrane of the water system. The samples (1.5 ml LC vials) were stored at −80°C after extraction until they are run. The experiment was repeated three times. In each repeat, we prepared two samples with one injection for each one.
The analysis of phenolic composition among nine cultivars was performed using the UHPLC-QTOF-MS (1290 and 6560, Agilent, Santa Clara, CA, USA) and the method of Xu et al. (16) was referred to with some modifications.
Preliminary separation was performed by UHPLC at the flow rate of 0.4 ml/min with the column (Acquity UPLC HSS T3, 1.8 μm, 2.1 × 150 mm, Waters, Milford, MA, USA) maintained at 40°C and samples maintained at 4°C. Mobile phase A was 0.2% formic acid aqueous solution and B was acetonitrile. The solvent gradient was as followed: 0–11.50 min, 5–30% B; 11.50–11.51 min, 30–100%; 11.51–15.00 min, 100–100% B; 15.00–15.01 min, 100–5%; and 15.01–18.00 min, 5–5% B. The injection volume was 2 μl for all samples.
The MS conditions for positive and negative ion modes were the same in gas temperature (325°C), drying gas flow (7 L/min), spray voltage (35 psi), sheath gas temperature (350°C), sheath gas flow (11 L/min), and fragmentation voltage (380 V). The capillary voltage for positive ion mode was 3,500 V and for negative ion mode was 3,000 V, while the nozzle voltage for positive ion mode was 0 and positive ion mode was 1,500 V, respectively. Data acquisition was performed by TOF MS mode with the m/z range of 50–1,200 and the acquisition rate of 2 spectra/s. The quality control (QC) sample, a mixture of aliquots from every sample, was inserted into the queue every 5 samples to ensure the stability and repeatability of the system. Reference ions were 121.050873 and 922.009798 for positive ion mode, and 112.9855 and 1033.9881 for negative ion mode.
The MS/MS was performed under the auto MS/MS mode with QTOF only. The mass acquisition range was 30–1,200 with an acquisition rate of 4 spectra/s. The four highest responding parent ions were selected to be fragmented in every acquisition cycle. Separately, the samples of TSS cultivar were acquired three times under the collision energy of 10, 20, and 40 eV with other conditions the same as those under MS conditions.
The quantification of main phenolic compounds was performed using a UPLC-QQQ-MS (Acquity I Class and Xevo-TQ-S, Waters, Milford, MA, USA).
Chromatographic separation was firstly carried out using a UPLC at the flow rate of 0.3 ml/min with the column (ACQUITY UPLC HSS T3, 1.8 μm, 2.1 × 150 mm, Waters, Milford, MA, USA) maintained at 40°C and samples maintained at 8°C. Mobile phase A was 0.3% formic acid aqueous solution and B was acetonitrile. The solvent gradient was as followed: 0–10.00 min, 5–27.5% B; 10.00–12.50 min, 27.5–55% B; 12.50–13.50 min, 55–100% B; 13.50–16.50 min, 100–100% B; 16.50–16.51 min, 100–5% B; and 16.51–20.00 min, 5–5% B. The injection volume was 2 μl for all samples.
Under both MRM mode and negative ion mode, the optimization for quantification, especially the parameters of cone voltage and collision energy, was performed by both Intellistart and manual tuning with desolvation gas temperature of 500°C, desolvation gas flow of 1,000 L/h, and capillary voltage of 2.0 kV. All standard compounds were dissolved in appropriate solvents (shown in Supplementary Table 1) and diluted by mobile phase A for a series of gradient concentration solutions. Fifteen compounds (punicalagin was the sum of α-punicalagin and β-punicalagin) were targeted quantified with standards. The external standard method was established with the conversion between peak areas and concentrations. The concentration range for the standard curves is shown in Supplementary Table 1 and the R2 > 0.999.
Based on the reference of Xu et al. (17) with some modifications, the raw data were first imported to Qualitative analysis b.08.00 software for basic examination. Then the raw data files were converted to abf format by Reifycs Abf converter (RIKEN Center, Japan). The converted files were processed by MS-DIAL 4.24 (RIKEN Center, Japan) with MS/MS information. The MS/MS information was matched with databases, such as the Massbank, GNPs, HMDB, and FooDB with a deviation of 10 ppm for MS and 15 ppm for MS/MS, respectively (18, 19). In addition, fragments of MS/MS in references were also used for annotation. Identification was achieved based on the local standard library with retention time and m/z.
After annotation or identification, the compound list with retention time, and the formula was imported into Profinder 10.0 software to extract the peak areas from every sample in MS acquisition. Metaboanalyst (https://www.metaboanalyst.ca/) (20) and SIMCA 14.1 software were used for principal component analysis (PCA).
Statistical analysis was performed by SPSS Statistics 25.0 for the one-way ANOVA, and the bubble plot and the waterfall plot were performed by Origin 2019b.
Figure 1 shows the overview of acquired data under positive (A) and negative (B) ion modes. The total ion chromatogram (TIC) (dark line in the figure) presented the change of summed intensity variation with time. Features were extracted from MS scan data with m/z, and every colored bubble, graded by intensity value with log transformed, represented one feature of m/z appearing at a specific time. All the colored bubbles distribution in the figure reflected the case of acquired data. Most bubbles were yellow and orange under the positive mode, while they were orange and green or even blue under the negative mode, indicating that the samples had a better response intensity under the negative mode.
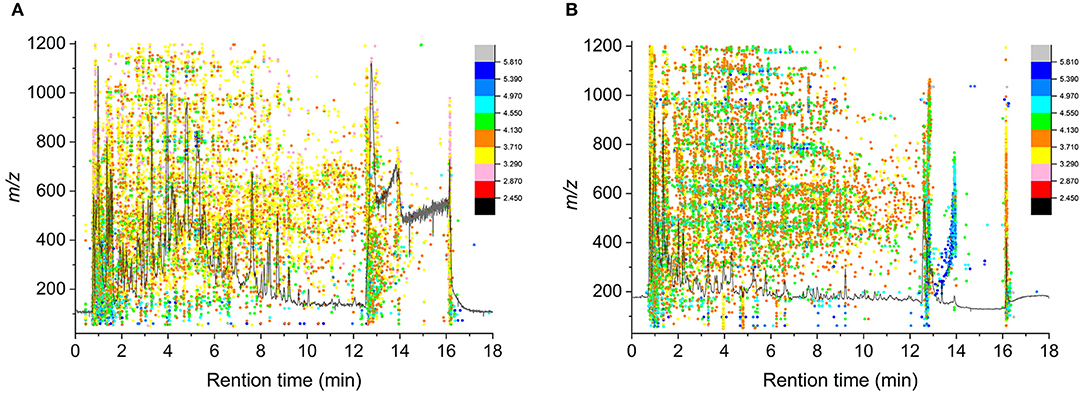
Figure 1. Bubble plot of TIC and acquired data under positive (A) and negative (B) ion mode.
The analyte is usually fragmented to obtain information beyond the molecule mass, and the following step is to search a database of molecular structures with tandem MS data (21). According to the databases and references, the features were carefully annotated with MS/MS information in this study. Furthermore, in order to have a more reliable confirmation for some dominant compounds, the comparisons of standards with m/z and retention time were imported for further identification. Finally, a total of 64 compounds were annotated by UHPLC-QTOF-MS (Table 1), consisting of 10 hydrolyzable tannins, 4 phenolic acids, and 50 flavonoids. Regarding flavonoids, there was a wide range of variety, namely, 6 flavan-3-ols, 13 flavonols, 4 flavanones, 1 dihydrochalcone, 3 isoflavones, 6 flavones, 2 flavanonols, 9 anthocyanins, 3 procyanidins, 2 aurones, and 1 chromone. Among them, 17 of the annotated compounds were identified with the standards. Twenty-three compounds (mirror images are shown in Figure 2), consisting of 2 phenolic acids (thymol and olivetonide), 6 flavonols (kaempferol-3-O-arabinoside, kaempferol-3-glucoside-3″-rhamnoside, quercetin-3-O-xyloside, isorhamnetin-3-galactoside, gossypetin, and fisetin), 2 flavanones (isookanin-7-O-glucoside and eriodictyol), 2 isoflavones (isoprunetin-7-O-glucoside and biochanin-7-O-glucoside), 2 flavones (plantaginin and tiliroside), 2 flavanonols (dihydrokaempferol and taxifolin), 3 anthocyanins (cyanidin-3-O-galactoside, cyanidin-3-O-alpha-arabinoside, and petunidin-3-galactoside), 1 procyanidin (procyanidin C1), 2 aurones (bracteatin and maritimetin-6-O-glucoside), and 1 chromone (undulatoside A) were annotated for the first time in pomegranate peel. In addition, there were 2 compounds that were not detected in all cultivars. Thymol was not detected in TSS, PYM, AP, and SP, while undulatoside A was not detected in GPSS, PYM, AP, and SP. The two compounds possibly possessed the potential to be characteristic markers for cultivar discrimination. All above results highlighted the presence of a wide variety of phenolic compounds in pomegranate peel.
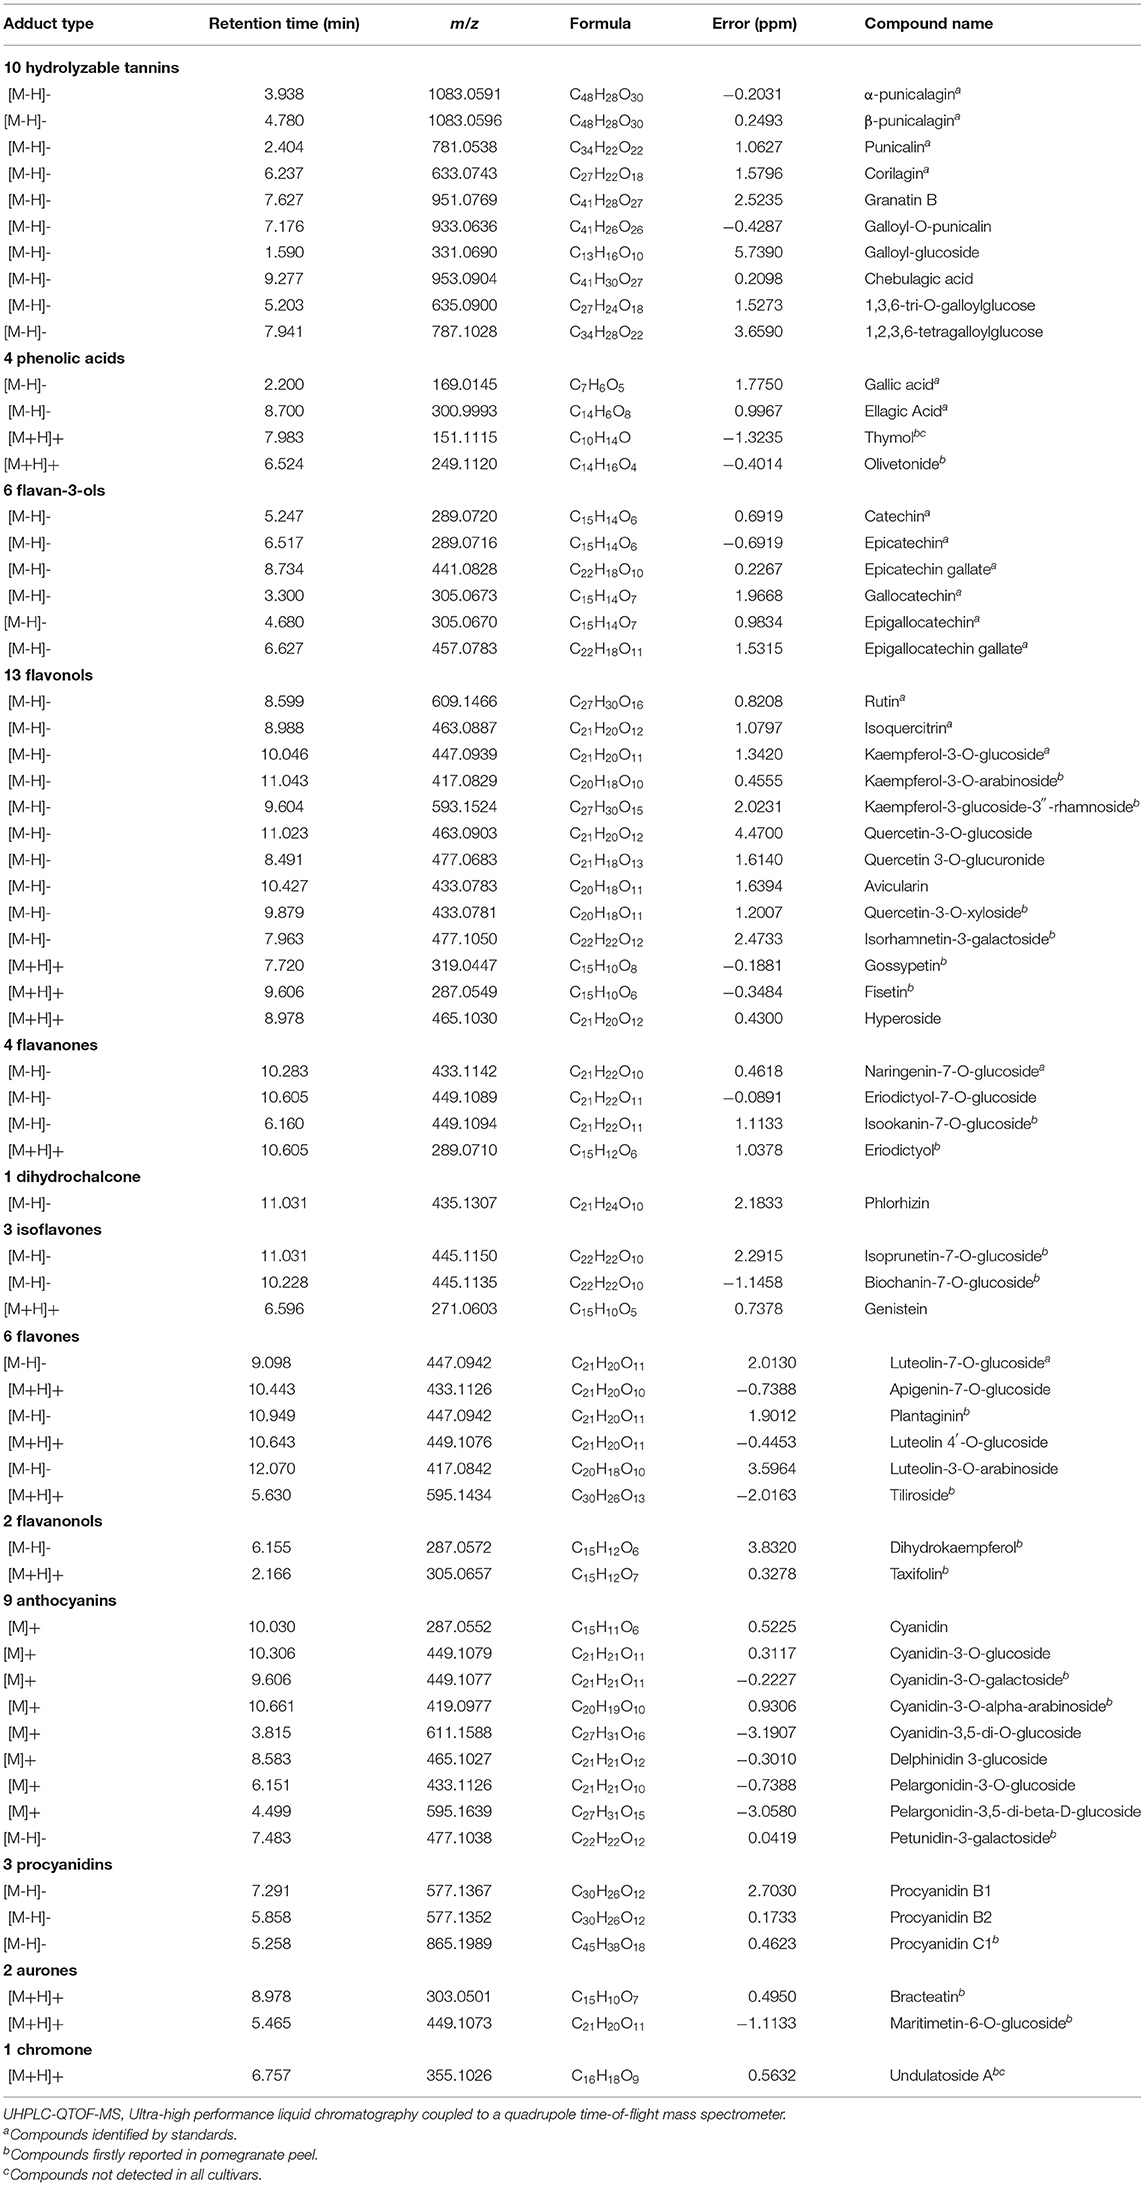
Table 1. Annotation and identification of phenolic compounds by UHPLC-QTOF-MS.
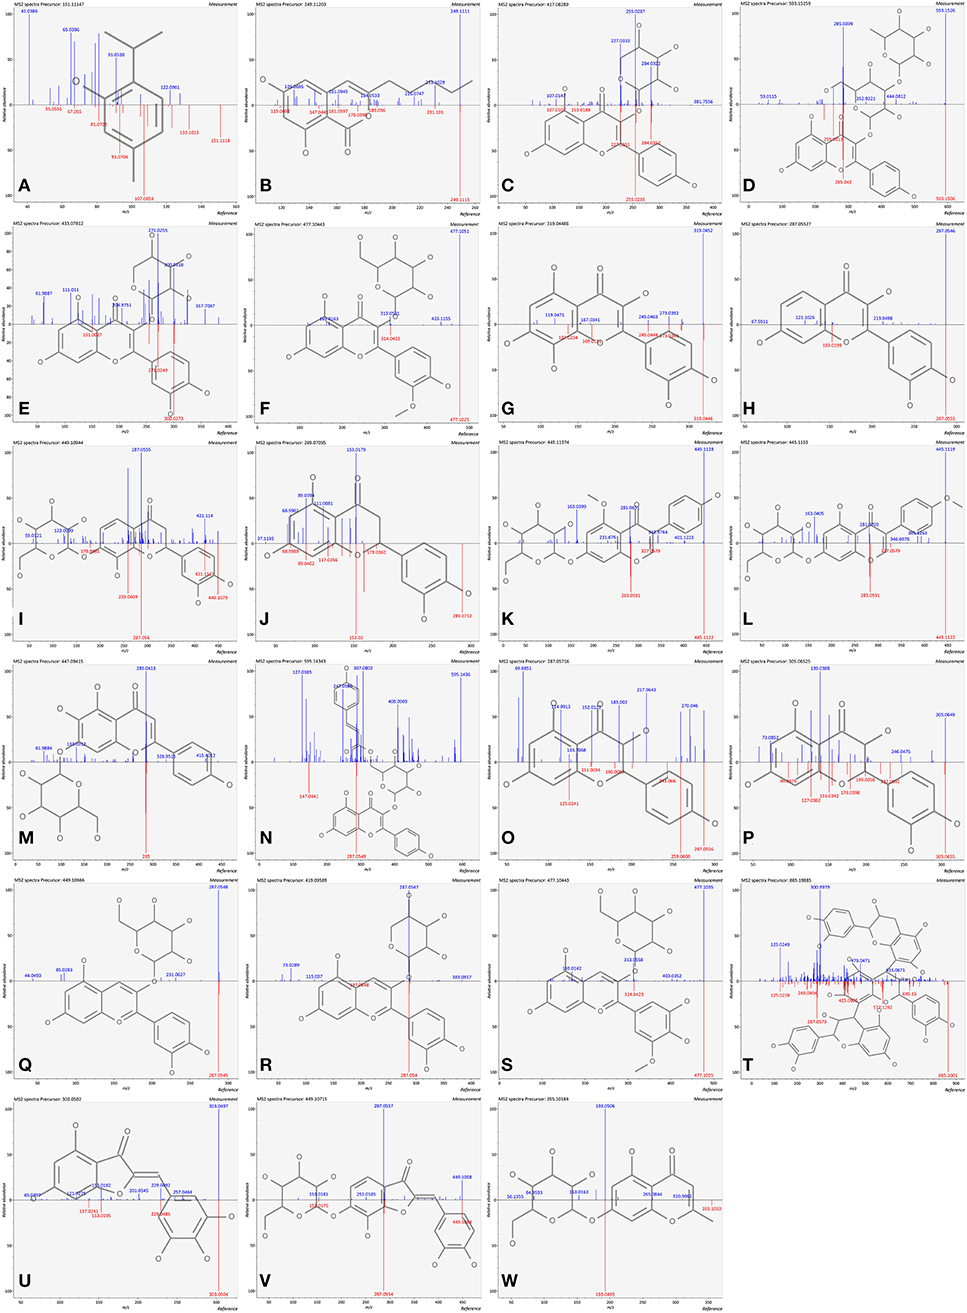
Figure 2. Mirror images of firstly reported compounds in pomegranate peel. (A) thymol; (B) olivetonide; (C) kaempferol-3-O-arabinoside; (D) kaempferol-3-glucoside-3″-rhamnoside; (E) quercetin-3-O-xyloside; (F) isorhamnetin-3-galactoside; (G) gossypetin; (H) fisetin; (I) isookanin-7-O-glucoside; (J) eriodictyol; (K) isoprunetin-7-O-glucoside, (L) biochanin-7-O-glucoside; (M) plantaginin; (N) tiliroside; (O) dihydrokaempferol; (P) taxifolin; (Q) cyanidin-3-O-galactoside; (R) cyanidin-3-O-alpha-arabinoside; (S) petunidin 3-galactoside; (T) procyanidin C1; (U) bracteatin; (V) maritimetin-6-O-glucoside; (W) undulatoside A.
The phenolic composition was one of the popular fields in pomegranate peel investigations, and differences were shown in references for compounds annotation or identification. El-Hadary and Ramadan (22) identified a total of 43 phenolic compounds in pomegranate peel from Egyptian wonderful variety by the comparison of retention time with standards using HPLC. Eight phenolic compounds (gallic acid, catechin, punicalagin, ellagic acid, luteolin-7-O-glucoside, rutin, quercetrin-3-O-glucoside, and apigenin-7-glucoside) were identical with this study. With the absence of molecular weight information, identification performed by HPLC only may come across the problem of co-elution. Moreover, it is hard to build a library of standards covering all detected compounds. MS can measure the mass-to-charge ratio of ions (23), and with HPLC only, it increases a dimension of separation, especially when the compounds are co-eluted. Fischer et al. (24) investigated the Peruvian pomegranate of unknown cultivar purchased from the local market by HPLC-DAD-ESI/MSn, and 9 anthocyanins and 23 other phenolic compounds were annotated in pomegranate peel. Five anthocyanins (cyanidin-3-O-glucoside, cyanidin-3,5-di-O-glucoside, delphinidin-3-glucoside, pelargonidin-3-O-glucoside, and pelargonidin-3,5-di-beta-D-glucoside) and 5 other phenolic compounds (ellagic acid, granatin B, punicalin, punicalagin, and gallic acid) were identical to this study. Ambigaipalan et al. (25) analyzed the phenolic compounds in pomegranate peel in California by HPLC-DAD-ESI-MS. They showed a total of 79 phenolic compounds with 16 phenolic acids, 12 flavonoids, 35 hydrolyzable tannins, 8 proanthocyanidins, and 8 anthocyanins. The majority of the compounds could only be annotated as derivatives based on characteristic fragments. However, some ESI-MS instruments have relatively low-resolution, and high-resolution instruments are needed for compounds annotation. As a powerful and robust instrument, a QTOF mass spectrometer has rapidly been embraced by the analytical community (26). Abdulla et al. (27) did the qualitative analysis of phenolic compounds in pomegranate peel (Xinjiang Uygur Autonomous Region, China). Samples were treated by macroporous HPD-300 resin, and a total of 50 phenolic compounds (35 hydrolyzable tannins and 15 flavonoids) were detected under negative mode by HPLC-QTOF-MS. The m/z could be accurate to four decimal places. Seventeen compounds were identical to this study. However, HPLC separation needed a total of 90 min with a flow rate of 1.2 ml/min. With the purpose of obtaining a faster and more effective method, we chose UHPLC for preliminary separation and shortened the time to 18 min with a flow rate of 0.4 ml/min, which saved time and solvents. Compared with all these references, UHPLC-QTOF-MS was used to investigate the profile of phenolic compounds in pomegranate peel, which could reduce the possibility of co-elution (compared with HPLC only), increase the accuracy of m/z and fragments (compared with LC-MS/MS with low resolution), improve the range of detected compounds, strengthen the confirmation of main phenolic compounds with the standards, and save the time and solvents.
It is noteworthy to have an insight into these compounds. Punicalagin and punicalin are ellagitannins (28). For ellagic acid and punicalagin synthesis, gallic acid is a common precursor (29). To some degree, the synthesis of characteristic tannins in pomegranate peel could explain the collectively reported compounds, such as gallic acid and ellagic acid. The differences of flavonoids come from their structural classes, other substitutions and conjugations, and degree of hydroxylation and polymerization (30). These differences contributed to a large number of annotated flavonoids in this study. Procyanidins, the oligomeric compounds, are composed of catechin and epicatechin monomers (31). Anthocyanins are pigments, which make the flowers and fruits of some plants colored orange, pink, red, violet, or blue (32). The common anthocyanins in pomegranate peel, as discussed before, are cyanidin, delphinidin, and pelargonidin in glucoside form, which provide the natural chromogenic substances on the surface of pomegranate fruits.
Two reasons could explain the differences of phenolic compounds in classes from pomegranate peel. One reason was mainly dependent on the characteristics of cultivars cultivated under different natural conditions. The cultivars in this study covered all the main production areas in China, which are various and different from the cultivars in references. Apart from thymol and olivetonide, the other 21 compounds annotated for the first time were all flavonoids in this study. The various derivatives of the initial phenylpropanoid scaffold play important roles in the plant, such as structural integrity, reproduction, UV photoprotection, and internal regulation of plant cell physiology and signaling (33). Nine selected cultivars in this study were planted and grew with changeable climates and complicated geographical environments, and these factors could lead to the facilitation of flavonoid biosynthesis. Another reason came from experiment procedures. Smaoui et al. (34) summarized the scientific literature on the main active phenolic compounds of pomegranate peel identified and quantified by advances in the separation sciences and spectrometry. The extraction solvent, mobile phase, gradient, and instruments are all influential factors in compound detection. To annotate MS/MS spectra from small molecules, the fastest way is the search of tandem mass spectral library and the search results are influenced by parameters, such as mass accuracy, intensity thresholds, acquisition speed, and so on (35). When compared with conventional methods, the results in this study proved that UHPLC-QTOF-MS was a promising instrument for the reliable and comprehensive investigation of phenolic composition in pomegranate peel with high-throughput, high sensitivity, good resolution, and multi-dimensional data acquisition. Furthermore, the results of all annotated and identified phenolic compounds could be used as the database for further investigations. We hypothesized that the nine cultivars and the use of UHPLC-QTOF-MS could help us to discover and understand more phenolic compounds. The results here might indicate their positive effects on the phenolic compounds annotation.
Peak areas of the compounds (Table 1) were extracted from MS data with retention time and formula. PCA, a statistical tool, can reduce a large set of variables to a small set with most of the information contained (36). In order to have an overview of the phenolic composition and to compare the differences and similarities among cultivars, PCA is carried out and the results are shown in Figure 3 with its scores plot (A) and loading plot (B). The principal component (PC) represents the percentage of variation. The result of PC1 was 47.7% and PC2 was 18%, indicating that a total of 65.7% of the variation was explained by the two components.
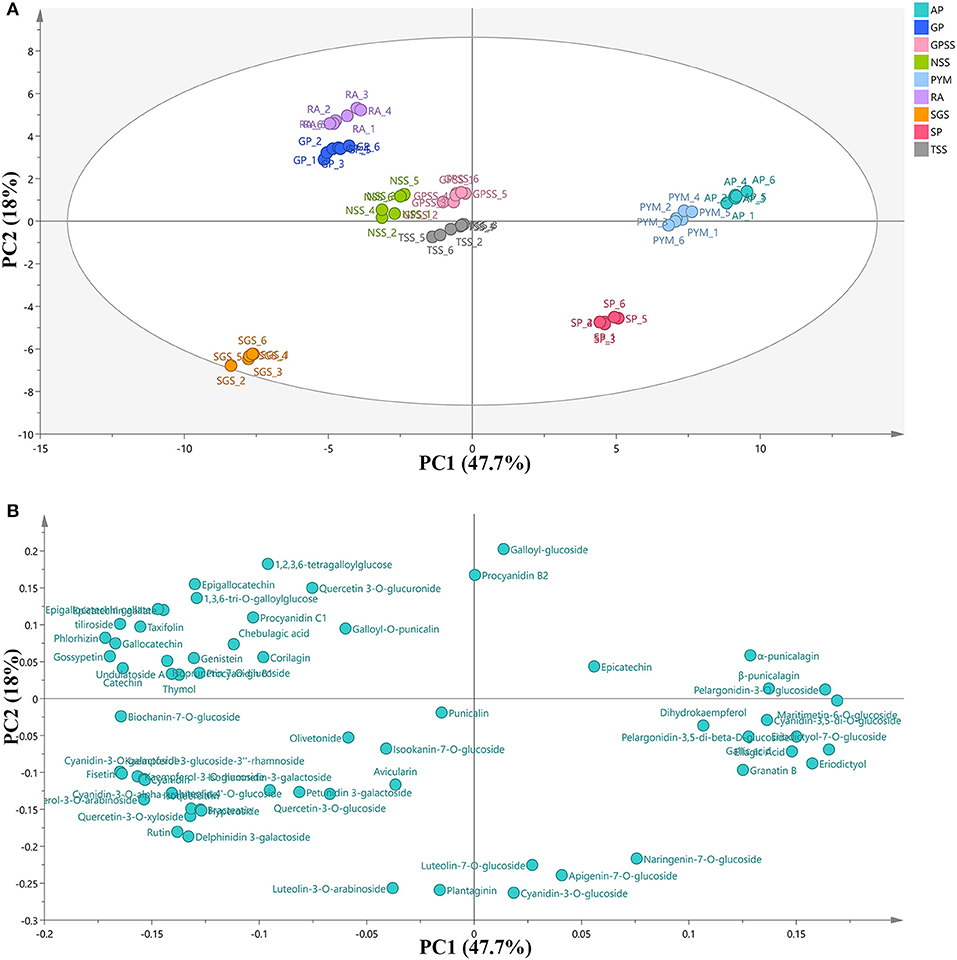
Figure 3. PCA scores plot (A) and loading plot (B) of phenolic composition in nine cultivars. RA, Red Agate; TSS, Tunisian Soft Seed; SGS, Sweet with Green Seed; GPSS, Green Peel Soft Seed; GP, Green Peel; NSS, Net Skin Sweet; PYM, Piyaman; AP, Acidic Pomegranate; SP, Sweet Pomegranate; PCA, principal component analysis.
In the PCA score plot, the points in the same color represented the repeated samples for one cultivar. The separations were observed among the cultivars, and the distance among them symbolized the degree of similarity. AP (from Kashgar prefecture) and PYM (from Hetian prefecture) were very close to each other. However, SP, also from Kashgar prefecture, was far from AP or PYM. The three cultivars were all from Xinjiang Uygur Autonomous Region. The results showed that AP and PYM were more similar to each other in phenolic composition, while SP was significantly different from the other two cultivars. RA, GP, GPSS, NSS, and TS were in a big cluster, indicating that these five cultivars were relatively similar in phenolic composition. The unique one was SGS, from Mengzi County, Yunnan Province. It was very far from any other cultivars in the scores plot, showing its specificity in phenolic composition. The relation between cultivars and phenolic compounds was displayed by the combination of the loading plot and the PCA score plot. AP and PYM showed high positive scores along PC1 and the observations in the loading plot indicated that the two cultivars could be positively associated with maritimetin-6-O-glucoside, eriodictyol-7-O-glucoside, pelargonidin-3-O-glucoside, eriodictyol, pelargonidin-3,5-di-beta-D-glucoside, ellagic acid, β-punicalagin, cyanidin-3,5-di-O-glucoside, α-punicalagin, gallic acid, granatin B, and dihydrokaempferol. SGS was highly associated with kaempferol-3-glucoside-3”-rhamnoside, fisetin, kaempferol-3-O-glucoside, kaempferol-3-O-arabinoside, cyanidin-3-O-alpha-arabinoside, luteolin 4'-O-glucoside, hyperoside, bracteatin, quercetin-3-O-xyloside, isoquercitrin, delphinidin 3-galactoside, and rutin. All these phenolic compounds related to SGS were flavonoids and this fact could account for the unique separation in PCA score plot of SGS. In addition, it could be deduced that the cultivar from Yunnan Province had the potential for the use of flavonoids. Li et al. (37) investigated polyphenol composition in pomegranate juices of 10 cultivars from 4 Chinese regions (Kashi prefecture, Zaozhuang city, Mengzi County, Lintong district) with the analysis of environmental factors. The results showed that average temperature and daily temperature difference during maturity and harvest period had big effects on phenolic composition and antioxidant potential. And to some degree, they were also influenced by the latitude and longitude of growing regions. Thus, the differences in phenolic composition of different cultivars in pomegranate peel were also affected by natural conditions. From the PCA plots, we concluded that the separation among the cultivars may be helpful for raw material screening and further purification of specific phenolic compounds.
Fifteen phenolic compounds are quantified by UPLC-QQQ-MS under negative ion mode with the optimized condition of cone voltage and collision energy, as shown in supporting information Table 1. Supplementary Figure 2 showed their mirror images and structures. The waterfall plot (Figure 4) was the extracted ion chromatography for quantification of the compounds under MRM mode.
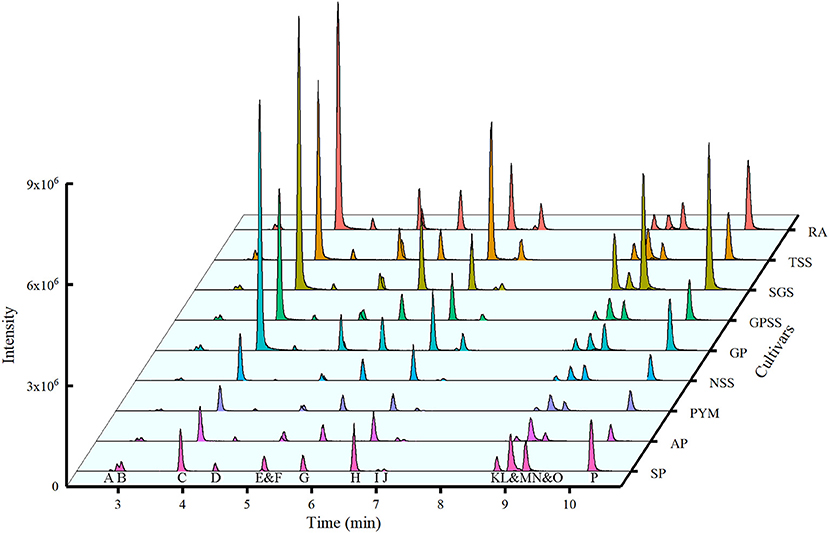
Figure 4. Waterfall chromatogram of ions for quantification from nine cultivars. RA, Red Agate; TSS, Tunisian Soft Seed; SGS, Sweet with Green Seed; GPSS, Green Peel Soft Seed; GP, Green Peel; NSS, Net Skin Sweet; PYM, Piyaman; AP, Acidic Pomegranate; SP, Sweet Pomegranate. The capital letters under the peaks represented the extracted ion chromatography for quantification of the compounds. The name of the compound was A, gallic acid; B, punicalin; C, gallocatechin; D, α-punicalagin; E, epigallocatechin; F, β-punicalagin; G, catechin; H, corilagin; I, epicatechin; J, epigallocatechin gallate; K, rutin; L, ellagic acid; M, epicatechin gallate; N, isoquercitrin; O, luteolin-7-O-glucoside; P, kaempferol-3-O-glucoside.
As shown in Table 2, punicalagin, ellagic acid, gallocatechin, punicalin, catechin, and corilagin dominate, while luteolin-7-O-glucoside is the least among 15 phenolic compounds. Punicalagin (28.03–104.14 mg/g) possessed the highest content among all the compounds in nine selected cultivars, especially in RA and TSS. The highest content of punicalin was obtained in TSS and the least was in PYM. Corilagin content was highest in TSS. SP ranked first with the content of ellagic acid. Catechin and gallocatechin were found with the highest content in SGS.
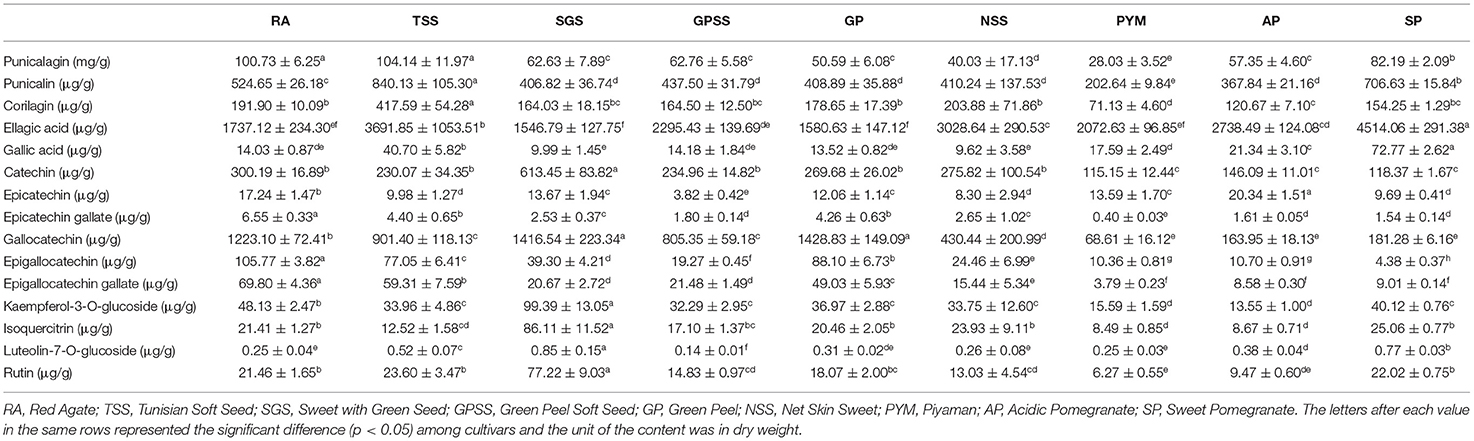
Table 2. Contents of 15 phenolic compounds.
Li et al. (38) investigated 4 main compounds (punicalagin, punicalin, gallic acid, and ellagic acid) in pomegranates from five Chinese cultivars (sweet green-peel pomegranate, sweet red-peel pomegranate, and sour red-peel pomegranate from Huili county, sour red-peel pomegranate from Mengzi County, and sweet Tai-mountain red-peel pomegranate from Taian city) with standards only by HPLC. They showed that the content of punicalagin was much higher than any other phenolic compounds with a range from 61.75 (mg/g DW) to 125.23 (mg/g DW), which was higher than the content of punicalagin in this study. Lu et al. (39) investigated the punicalagin content in pomegranate peel of 14 cultivars collected from seven provinces in China and two cultivars of dried pomegranate peel from drugstores by HPLC. The content ranged from 39.8 to 121.5 mg/g. However, the comparison of the results from the same production areas (provinces) is different between this study and our study. The cultivars, extraction procedure, and the instrument for the experiment could contribute to these differences. It proved that the cultivars in China showed great differences in punicalagin content. Although the differences could come from many aspects, the risk of co-elution should be noticed when the quantification was performed by HPLC only, especially when over a dozen of analytes were analyzed in one analysis. Several overlaps of the retention time were observed among peaks (Figure 4). During the MRM process, the time of MS analysis is focused only on specific masses with all others excluded. Both parent and one or more product ions are monitored simultaneously (40). MRM methods are very suitable to analyze the multiple compounds fastly, sensitively, and simultaneously under the condition of other more abundant compounds presented (41). Chandra et al. (42) provided a method for the quantification of structurally related substances, using the equivalent and molecular weight correction factor. But when comparing the results of Table 2 and Figure 4, we could see that some compounds had high absolute contents with relatively low intensities, such as punicalagin. That was the reason for the necessity to build one-to-one standard curves. However, there were a few reports on the quantification of so many phenolic compounds with standards in pomegranate peel using MRM mode. With the advantages of avoiding the co-elution and quantifying all phenolic compounds in one analysis, the results could be more reliable and accurate under MRM mode with the standards. Therefore, the absolute quantity of 15 phenolic compounds in this study could be helpful for further extraction or by-product development.
Sixty-four phenolic compounds in pomegranate peel from nine selected cultivars were identified or putatively annotated, and 23 of them were firstly annotated. Thymol and undulatoside A were not detected in all cultivars. Cultivars were well-separated by PCA. For quantification, punicalagin, ellagic acid, gallocatechin, punicalin, catechin, and corilagin dominated among all the phenolic compounds. Punicalagin possessed the highest content with the range from 28.03 to 104.14 mg/g. These results confirmed that the nine cultivars and the use of UHPLC-QTOF-MS were helpful for the discovery and understanding of more phenolic compounds in pomegranate peel. The variety of phenolic compounds revealed the potential of these valuable compounds and the results could be used as the database for pomegranate peel. For absolutely quantified compounds with relatively high contents, more attention should be paid, and further investigations and developments of them are still needed such as extraction, bioactivity, or function.
The original contributions presented in the study are included in the article/Supplementary Materials, further inquiries can be directed to the corresponding author/s.
GM and LX contributed to methodology, investigation, and formal analysis. LX, XL, and ZX contributed to reviewing and editing. GM did data curation and original draft writing. XL helped in supervision and resources. All authors contributed conceptualization to the article and approved the submitted version.
The authors declare that the research was conducted in the absence of any commercial or financial relationships that could be construed as a potential conflict of interest.
All claims expressed in this article are solely those of the authors and do not necessarily represent those of their affiliated organizations, or those of the publisher, the editors and the reviewers. Any product that may be evaluated in this article, or claim that may be made by its manufacturer, is not guaranteed or endorsed by the publisher.
The Supplementary Material for this article can be found online at: https://www.frontiersin.org/articles/10.3389/fnut.2021.807447/full#supplementary-material
1. Shaygannia E, Bahmani M, Zamanzad B, Rafieian-Kopaei M. A review study on Punica granatum L. J Evidence-Based Complementary Altern Med. (2016) 21:221–7. doi: 10.1177/2156587215598039
2. Zhao L, Li M, Cai G, Pan T, Shan C. Assessment of the genetic diversity and genetic relationships of pomegranate (Punica granatum L.) in China using RAMP markers. Sci Hortic. (2013) 151:63–67. doi: 10.1016/j.scienta.2012.12.015
3. Akhtar S, Ismail T, Fraternale D, Sestili P. Pomegranate peel and peel extracts: chemistry and food features. Food Chem. (2015) 174:417–25. doi: 10.1016/j.foodchem.2014.11.035
4. Singh B, Singh JP, Kaur A, Singh N. Phenolic compounds as beneficial phytochemicals in pomegranate (Punica granatum L.) peel: A review. Food Chem. (2018) 261:75–86. doi: 10.1016/j.foodchem.2018.04.039
5. Cheynier V. Phenolic compounds: from plants to foods. Phytochem Rev. (2012) 11:153–77. doi: 10.1007/s11101-012-9242-8
6. Khoddami A, Wilkes MA, Roberts TH. Techniques for analysis of plant phenolic compounds. Molecules. (2013) 18:2328–75. doi: 10.3390/molecules18022328
7. Herrero M, Simo C, Garciacanas V, Ibanez E, Cifuentes AJMSR. Foodomics: MS-based strategies in modern food science and nutrition. Mass Spectrom Rev. (2012) 31:49–69. doi: 10.1002/mas.20335
8. Gradillas A, Martinez-Alcazar MP, Gutierrez E, Ramos-Solano B, Garcia A. A novel strategy for rapid screening of the complex triterpene saponin mixture present in the methanolic extract of blackberry leaves (Rubus cv. Loch Ness) by UHPLC/QTOF-MS. J Pharm Biomed Anal. (2019) 164:47–56. doi: 10.1016/j.jpba.2018.10.014
9. Abid M, Yaich H, Cheikhrouhou S, Khemakhem I, Bouaziz M, Attia H, et al. Antioxidant properties and phenolic profile characterization by LC-MS/MS of selected Tunisian pomegranate peels. J Food Sci Technol. (2017) 54:2890–901. doi: 10.1007/s13197-017-2727-0
10. Du LJ, Huang JP, Wang B, Wang CH, Wang QY, Hu YH, et al. Carbon molecular sieve based micro-matrix-solid-phase dispersion for the extraction of polyphenols in pomegranate peel by UHPLC-Q-TOF/MS. Electrophoresis. (2018) 39:2218–27. doi: 10.1002/elps.201800045
11. Peti APF, Locachevic GA, Prado MKB, de Moraes LAB, Faccioli LH. High-resolution multiple reaction monitoring method for quantification of steroidal hormones in plasma. J Mass Spectrom. (2018) 53:423–31. doi: 10.1002/jms.4075
12. Zheng F, Zhao X, Zeng Z, Wang L, Lv W, Wang Q, et al. Development of a plasma pseudotargeted metabolomics method based on ultra-high-performance liquid chromatography-mass spectrometry. Nat Protoc. (2020) 15:2519–37. doi: 10.1038/s41596-020-0341-5
13. Sumere BR, de Souza MC, Dos Santos MP, Bezerra RMN, da Cunha DT, Martinez J, et al. Combining pressurized liquids with ultrasound to improve the extraction of phenolic compounds from pomegranate peel (Punica granatum L.). Ultrason Sonochem. (2018) 48:151–62. doi: 10.1016/j.ultsonch.2018.05.028
14. Kaderides K, Goula AM, Adamopoulos KG. A process for turning pomegranate peels into a valuable food ingredient using ultrasound-assisted extraction and encapsulation. Innov Food Sci Emerg. (2015) 31:204–15. doi: 10.1016/j.ifset.2015.08.006
15. Zeng LM, Luo LY. Stability of tea polyphenols solution with different pH at different temperatures. Int J Food Prop. (2017) 20:1–18. doi: 10.1080/10942912.2014.983605
16. Xu L, Lao F, Xu Z, Wang X, Chen F, Liao X, et al. Use of liquid chromatography quadrupole time-of-flight mass spectrometry and metabolomic approach to discriminate coffee brewed by different methods. Food Chem. (2019) 286:106–12. doi: 10.1016/j.foodchem.2019.01.154
17. Xu L, Wang L, Xu Z, Zhang X, Zhang Z, Qian Y. Physicochemical quality and metabolomics comparison of the green food apple and conventional apple in China. Food Res Int. (2021) 139:109804. doi: 10.1016/j.foodres.2020.109804
18. Tsugawa H, Kind T, Nakabayashi R, Yukihira D, Tanaka W, Cajka T, et al. Hydrogen rearrangement rules: computational MS/MS fragmentation and structure elucidation using MS-FINDER software. Anal Chem. (2016) 88:7946–58. doi: 10.1021/acs.analchem.6b00770
19. Lai Z, Tsugawa H, Wohlgemuth G, Mehta S, Mueller M, Zheng Y, et al. Identifying metabolites by integrating metabolome databases with mass spectrometry cheminformatics. Nat Methods. (2018) 15:53–6. doi: 10.1038/nmeth.4512
20. Chong J, Soufan O, Li C, Caraus I, Li S, Bourque G, et al. MetaboAnalyst 4.0: towards more transparent and integrative metabolomics analysis. Nucleic Acids Res. (2018) 46:W486–94. doi: 10.1093/nar/gky310
21. Hufsky F, Bocker S. Mining molecular structure databases: Identification of small molecules based on fragmentation mass spectrometry data. Mass Spectrom Rev. (2017) 36:624–33. doi: 10.1002/mas.21489
22. El-Hadary AE, Ramadan MF. Phenolic profiles, antihyperglycemic, antihyperlipidemic, and antioxidant properties of pomegranate (Punica granatum) peel extract. J Food Biochem. (2019) 43:e12803. doi: 10.1111/jfbc.12803
23. Finehout JE, Lee HK. An introduction to mass spectrometry applications in biological research. Biochem Mol Biol Educ. (2004) 32:93–100. doi: 10.1002/bmb.2004.494032020331
24. Fischer UA, Carle R, Kammerer DR. Identification and quantification of phenolic compounds from pomegranate (Punica granatum L.) peel, mesocarp, aril and differently produced juices by HPLC-DAD-ESI/MS(n). Food Chem. (2011) 127:807–21. doi: 10.1016/j.foodchem.2010.12.156
25. Ambigaipalan P, de Camargo AC, Shahidi F. Phenolic compounds of pomegranate byproducts (outer skin, mesocarp, divider membrane) and their antioxidant activities. J Agric Food Chem. (2016) 64:6584–604. doi: 10.1021/acs.jafc.6b02950
26. Chernushevich IV, Loboda AV, Thomson BA. An introduction to quadrupole-time-of-flight mass spectrometry. J Mass Spectrom. (2001) 36:849–65. doi: 10.1002/jms.207
27. Abdulla R, Mansur S, Lai H, Ubul A, Sun G, Huang G, et al. Qualitative analysis of polyphenols in macroporous resin pretreated pomegranate husk extract by HPLC-QTOF-MS. Phytochem Anal. (2017) 28:465–73. doi: 10.1002/pca.2695
28. Cerda B, Llorach R, Ceron JJ, Espin JC, Tomas-Barberan FA. Evaluation of the bioavailability and metabolism in the rat of punicalagin, an antioxidant polyphenol from pomegranate juice. Eur J Nutr. (2003) 42:18–28. doi: 10.1007/s00394-003-0396-4
29. Qin G, Xu C, Ming R, Tang H, Guyot R, Kramer EM, et al. The pomegranate (Punica granatum L.) genome and the genomics of punicalagin biosynthesis. Plant J. (2017) 91:1108–28. doi: 10.1111/tpj.13625
30. Kumar S, Pandey AK. Chemistry and biological activities of flavonoids: an overview. Sci World J. (2013) 2013:162750. doi: 10.1155/2013/162750
31. Rue EA, Rush MD, van Breemen RB. Procyanidins: a comprehensive review encompassing structure elucidation via mass spectrometry. Phytochem Rev. (2018) 17:1–16. doi: 10.1007/s11101-017-9507-3
32. Castañeda-Ovando A, Pacheco-Hernández ML, Páez-Hernández ME, Rodríguez JA, Galán-Vidal CA. Chemical studies of anthocyanins: A review. Food Chem. (2009) 113:859–71. doi: 10.1016/j.foodchem.2008.09.001
33. Falcone Ferreyra ML, Rius SP, Casati P. Flavonoids: biosynthesis, biological functions, and biotechnological applications. Front Plant Sci. (2012) 3:222. doi: 10.3389/fpls.2012.00222
34. Smaoui S, Hlima HB, Mtibaa AC, Fourati M, Sellem I, Elhadef K, et al. Pomegranate peel as phenolic compounds source: Advanced analytical strategies and practical use in meat products. Meat Sci. (2019) 158:107914. doi: 10.1016/j.meatsci.2019.107914
35. Kind T, Tsugawa H, Cajka T, Ma Y, Lai Z, Mehta SS, et al. Identification of small molecules using accurate mass MS/MS search. Mass Spectrom Rev. (2018) 37:513–32. doi: 10.1002/mas.21535
36. Cossignani L, Blasi F, Simonetti MS, Montesano D. Fatty acids and phytosterols to discriminate geographic origin of lycium barbarum berry. Food Anal Methods. (2017) 11:1180–8. doi: 10.1007/s12161-017-1098-5
37. Li X, Wasila H, Liu L, Yuan T, Gao Z, Zhao B, et al. Physicochemical characteristics, polyphenol compositions and antioxidant potential of pomegranate juices from 10 Chinese cultivars and the environmental factors analysis. Food Chem. (2015) 175:575–84. doi: 10.1016/j.foodchem.2014.12.003
38. Li R, Chen XG, Jia K, Liu ZP, Peng HY. A systematic determination of polyphenols constituents and cytotoxic ability in fruit parts of pomegranates derived from five Chinese cultivars. SpringerPlus. (2016) 5:914. doi: 10.1186/s40064-016-2639-x
39. Lu J, Ding K, Yuan Q. Determination of Punicalagin Isomers in Pomegranate Husk. Chromatographia. (2008) 68:303–6. doi: 10.1365/s10337-008-0699-y
40. Kitteringham NR, Jenkins RE, Lane CS, Elliott VL, Park BK. Multiple reaction monitoring for quantitative biomarker analysis in proteomics and metabolomics. J Chromatogr B. (2009) 877:1229–39. doi: 10.1016/j.jchromb.2008.11.013
41. Ruhaak LR, Lebrilla CB. Applications of multiple reaction monitoring to clinical glycomics. Chromatographia. (2015) 78:335–42. doi: 10.1007/s10337-014-2783-9
Keywords: pomegranate peel, cultivars, phenolic composition, UHPLC-QTOF-MS, UPLC-QQQ-MS, MRM
Citation: Man G, Xu L, Wang Y, Liao X and Xu Z (2022) Profiling Phenolic Composition in Pomegranate Peel From Nine Selected Cultivars Using UHPLC-QTOF-MS and UPLC-QQQ-MS. Front. Nutr. 8:807447. doi: 10.3389/fnut.2021.807447
Received: 02 November 2021; Accepted: 13 December 2021;
Published: 24 January 2022.
Edited by:
Jinsong Bao, Zhejiang University, ChinaReviewed by:
Lidia Montero, University of Duisburg-Essen, GermanyCopyright © 2022 Man, Xu, Wang, Liao and Xu. This is an open-access article distributed under the terms of the Creative Commons Attribution License (CC BY). The use, distribution or reproduction in other forums is permitted, provided the original author(s) and the copyright owner(s) are credited and that the original publication in this journal is cited, in accordance with accepted academic practice. No use, distribution or reproduction is permitted which does not comply with these terms.
*Correspondence: Xiaojun Liao, bGlhb3hqdW5AY2F1LmVkdS5jbg==; Zhenzhen Xu, eHV6aGVuemhlbkBjYWFzLmNu
Disclaimer: All claims expressed in this article are solely those of the authors and do not necessarily represent those of their affiliated organizations, or those of the publisher, the editors and the reviewers. Any product that may be evaluated in this article or claim that may be made by its manufacturer is not guaranteed or endorsed by the publisher.
Research integrity at Frontiers
Learn more about the work of our research integrity team to safeguard the quality of each article we publish.