
94% of researchers rate our articles as excellent or good
Learn more about the work of our research integrity team to safeguard the quality of each article we publish.
Find out more
SYSTEMATIC REVIEW article
Front. Nutr. , 10 September 2021
Sec. Nutritional Epidemiology
Volume 8 - 2021 | https://doi.org/10.3389/fnut.2021.718658
 Priya Dewansingh1*
 Gerlof A. R. Reckman1,2Caspar F. Mijlius1,2Wim P. Krijnen1,3Cees P. van der Schans1,4,5,6
 Harriët Jager-Wittenaar1,7Ellen G. H. M. van den Heuvel8
The aging process is often accompanied by increase in body weight. Older adults with overweight or obesity might have an overconsumption in energy that is accompanied by inadequate intake of protein, vitamin D, and calcium. It is unclear if intake of protein and vitamin D and calcium is sufficient in older adults with overweight/obesity, and whether it differs from older adults with normal weight, since a recent overview of the literature review is lacking. Therefore, we systematically analyzed the current evidence on differences in nutrient intake/status of protein, vitamin D and calcium between older adults with different body mass index (BMI) categories. Randomized controlled trials and prospective cohort studies were identified from PubMed and EMBASE. Studies reporting nutrient intake/status in older adults aged ≥50 years with overweight/obesity and studies comparing between overweight/obesity and normal weight were included. Nutrient intake/status baseline values were reviewed and when possible calculated for one BMI category (single-group meta-analysis), or compared between BMI categories (meta-analysis). Nutrient intake/status was compared with international recommendations. Mean protein (N = 8) and calcium intake (N = 5) was 0.98 gram/kilogram body weight/day (g/kg/d) [95% Confidence Interval (CI) 0.89–1.08] and 965 mg [95% CI: 704–1225] in overweight/obese. Vitamin D intake was insufficient in all BMI categories (N = 5). The pooled mean for vitamin D intake was 6 ug [95% CI 4–9]. For 25(OH)D, the pooled mean was 54 nmol/L [95% CI 45–62], 52 nmol/L [95% CI 46–58], and 48 nmol/l [95% CI 33–62] in normal (N = 7), combined overweight and obese (N = 12), and obese older adults (N = 4), respectively. In conclusion, older adults with overweight and obesity have a borderline sufficient protein and sufficient calcium intake, but insufficient vitamin D intake. The 25(OH)D concentration is deficient for the obese older adults.
In older adults with overweight or obesity, nutrient insufficiencies have been associated with a higher energy and fat intake, due to intake of food products with low nutrient density (1–3). The most frequently reported nutrient insufficiencies that have been associated with obesity are protein, vitamin D, and calcium. Insufficiencies of these nutrients, as well as overweight or obesity can have a negative effect on muscle strength (4, 5), physical function (5–7), and/or bone strength (8–10). To promote healthy aging by slowing down, halting, or reverting the process of deterioration in muscle strength, physical functioning, and bone strength in older adults, nutrient insufficiencies should therefore be prevented or treated.
Currently, an overview of the available studies on mean intake and serum values of protein, vitamin D, and calcium and the difference between older adults with overweight, obesity, and normal weight is lacking. To better guide healthcare professionals in effectively preventing and treating nutrient insufficiencies, various knowledge gaps need to be filled. First, consistent evidence is currently lacking on mean intake for protein, vitamin D, and calcium and 25-hydroxyvitamin D [25(OH)D] concentrations in older adults with overweight and obesity in comparison to their respective nutrient recommendations [e.g., from the European Society for Clinical Nutrition and Metabolism (11), the Institute of Medicine (12), and the European Food Safety Authority (13)]. Second, although other systematic reviews determined nutrient insufficiencies and deficiencies in the mainly obese population, it is currently unknown how large and severe the difference in nutrient intake and serum exactly is between older adults with overweight, obesity, and normal weight (14–18).
Therefore, in this systematic review combined with several meta-analyses, we aimed to compare the recent mean intake of protein, vitamin D, calcium, and 25(OH)D concentrations in older adults with overweight or obesity with nutrient recommendations, and to determine the difference in protein, vitamin D, calcium intake, and 25(OH)D concentrations between older adults with overweight, obese, and normal weight.
This systematic review and meta-analysis was performed in accordance with the Preferred Reporting Items for Systematic Reviews and Meta-analyses (PRISMA) 2020 guidelines (19). The review (protocol) was not registered.
The electronic databases Embase and PubMed were searched, until 13 July 2021, using the following key words: Aged AND “Body Mass Index” OR overweight OR obese AND “vitamin D” OR calcium. A combination of medical subjecht headings (MeSH) terms and free text terms was used. The complete overview of the search strategy is presented in Supplementary File 1.
Prospective cohort studies and randomized controlled trials (RCTs) were included if participants were older adults, i.e., aged ≥50 years, with overweight or obesity, or if studies included older adults with normal weight older adults, in addition to older adults with overweight or obesity. Only baseline data such as mean, standard deviation (SD) and sample size were extracted as the current systematic review and meta-analysis focused on habitual nutrient intake/status. Studies were excluded when participants had renal or kidney dysfunction. Studies from the last 10 years were included.
The title and abstract of every retrieved study was independently screened for relevance and eligibility by two reviewers. After the title and abstract selection, the remaining full-text studies were screened. The reference lists from the included full-text studies were also screened on title, abstract, and full-text. In addition, reference lists of review studies were also screened for additional relevant studies based on title, abstract and full-text. Disagreement between the two reviewers was settled by discussion with the co-authors reaching consensus in all cases.
After the screening process, study sample characteristics, i.e., gender, age, country, and outcome measurements were collected by the first author. Body mass index (BMI) was used to define normal weight, overweight, and obesity, according to the values 18.5–24.9, 25.0–29.9, and ≥30 kg/m2, respectively (20). Participants in the BMI category <18.5 kg/m2 were excluded, since they are generally considered as underweight (20). Studies that did not distinguish older adults between normal weight and underweight will be included. Outcomes for this study were: protein (g/day, g/kg body weight/day), vitamin D [microgram (μg), international units], calcium intake (milligram/day) and 25(OH)D concentrations in nanomole/liter (nmol/L). Missing or unclear information was mentioned in the evidence table.
Quality assessment was performed by the first author. Since for RCTs the baseline data were of primary interest, the methodological quality was not tested for RCTs. Prospective cohort studies were assessed with the relevant part of Cochrane's Tool to Assess Risk of Bias in Cohort Studies (21). More specifically, the investigated questions were: (a) Was selection of exposed and non-exposed cohorts drawn from the same population? (b) Can we be confident in the assessment of exposure? (c) Did the study match exposed and unexposed for all variables that are associated with the outcome of interest or did the statistical analysis adjust for these prognostic variables? (d) Can we be confident in the assessment of the presence or absence of prognostic factors? (e) Was the follow up of cohorts adequate? [Higgins and Green (21)].
To determine if the habitual nutrient intake or nutrient status was sufficient, intake/status was compared to recommendations from international guidelines. Table 1 shows the recommendations for protein, vitamin D, and calcium intake, and 25(OH)D concentration.
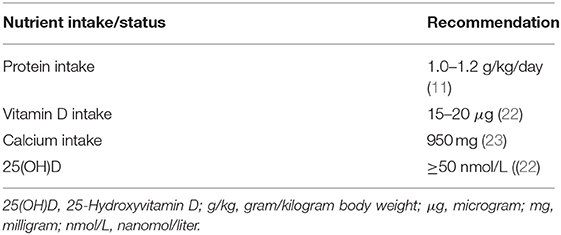
Table 1. The international recommendation for protein, vitamin D, and calcium intake, and 25(OH)D concentration.
To estimate pooled baseline means for the nutrient intake and nutrient status in the studies that included older adults who were overweight or obese, a single-group meta-analysis was performed using a random effects model (RE). Subgroups (e.g., gender-based) in studies were combined with respect to the mean, SD, and number of participants (n) according to formulas recommended by the Cochrane Handbook [Higgins and Green (21)].
In studies in which the older adults were distributed over multiple BMI categories, a meta-analysis was performed to investigate the mean difference, with corresponding 95% confidence interval (CI), between older adults with overweight, obesity, and normal weight. Meta-analysis was performed when at least three studies were available. Heterogeneity was identified byI2. I2 was interpreted according to the Cochrane handbook: 0 to 40% = might not be important; 30 to 60% = may represent moderate heterogeneity; 50 to 90% = may represent substantial heterogeneity; 75 to 100% = considerable heterogeneity (24).
Funnel plots were formed to identify possible publication bias (24). The single-group meta-analyses were performed in R version 3.4.0, and all other meta-analyses were performed in RevMan 5.3.
The search in both databases indentified 3,992 studies, and the reference lists search identified 2,140 additional studies. From the total of 5,397 studies, 28 studies passed the inclusion criteria and were included in the systematic review of which 23 were suitable for meta-analyses, (Figure 1).
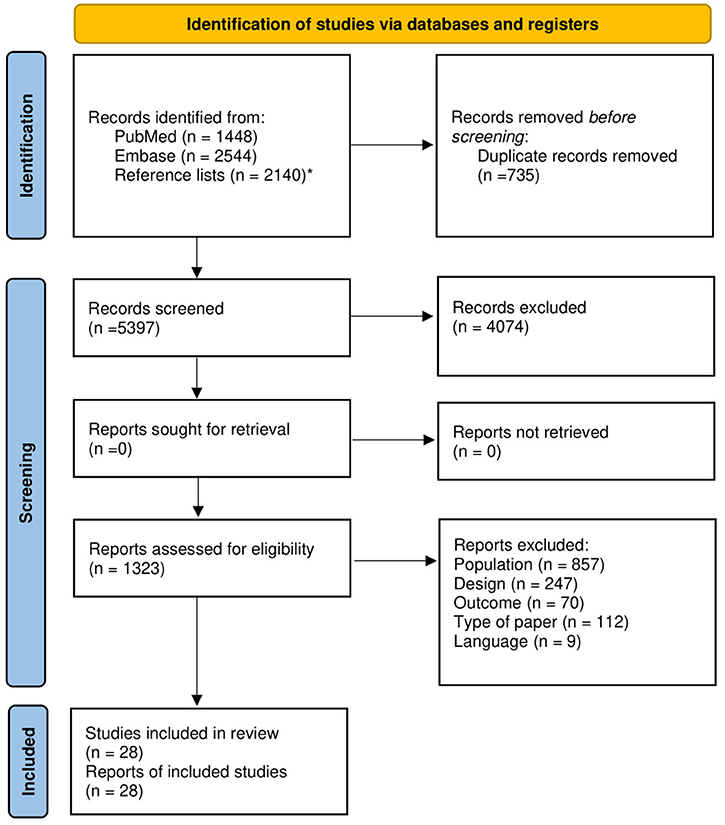
Figure 1. Flow-chart of study selection for systematic reviewing and meta-analysis. *The reference lists from the included full-text studies were also screened on title, abstract and full text.
The 28 included studies comprised a total number of 45,814 older adults. Ten studies were found on intake of protein, five on vitamin D, seven on calcium intake, and 13 on 25(OH)D concentrations. Table 2 provides an overview of all studies. Single-group meta-analysis could be performed for the outcomes protein intake, calcium intake, and 25(OH)D concentrations, in older adults with overweight and obesity combined. For 25(OH)D concentrations, a separate single-group meta-analysis was performed comparing mean differences between older adults with obesity and normal weight.
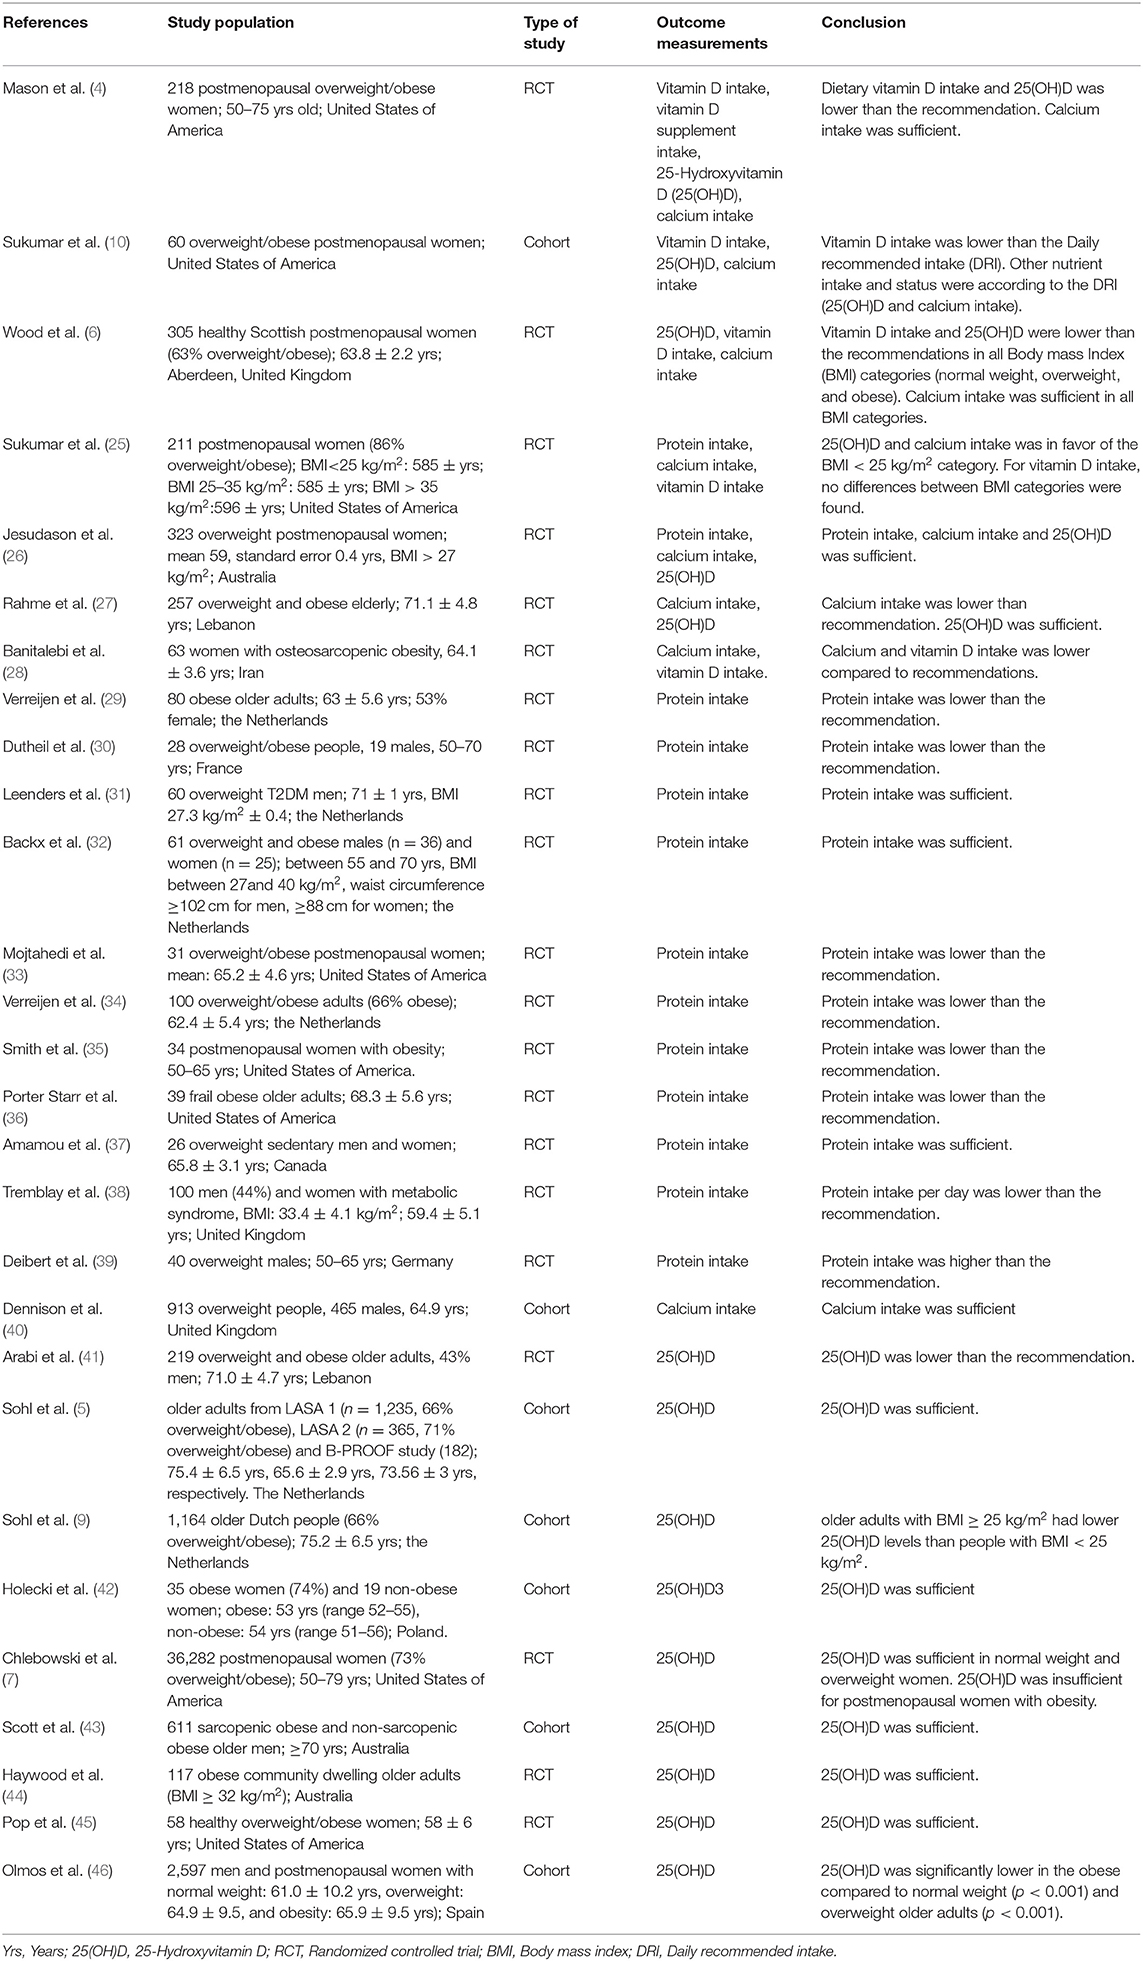
Table 2. Overview of studies included in the systematic review and meta-analysis.
Seven cohort studies were assessed for risk of bias for population selection, assessment of exposure, match between exposed and unexposed for all variables, and presence or absence of prognostic factors (Table 3). All studies had a low risk of bias for population selection and assessment of exposure. For match between exposed and unexposed for all variables, and presence or absence of prognostic factors, two and five studies, respectively, scored a low risk of bias.
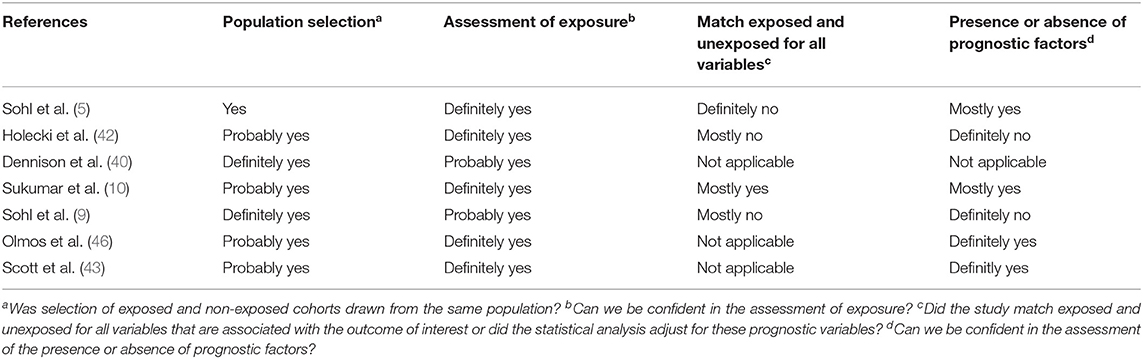
Table 3. Risk of bias per cohort study.
All older adults (n = 988) in the 10 studies regarding protein intake were either overweight or obese. The mean protein intake (g/kg body weight/day) pooled from eight studies of 522 older adults with overweight/obesity was 0.98 g/kg body weight (g/kg)/day; 95% CI: 0.92–1.04), I2 = 71%, p = 0.0036 (Figure 2). The funnel plot (Supplementary Figure 2) on protein intake in older adults with overweigh/obesity showed a small asymmetry.

Figure 2. Forest plot of included studies on protein intake (g/kg/day) in older adults with overweight/obesity mean [95% confidence interval], RE, random effects.
Seven studies reported protein intake as g/day in older adults with overweight and obesity, with a pooled mean intake of 87.4 mg; 82.4–92.3), I2 = 83% g/day, p < 0.0001 (Figure 3) (10, 26, 34–36, 38, 47). The funnel plot (Supplementary Figure 3) on protein intake (g/day) in older adults with overweigh/obesity showed a small asymmetry.
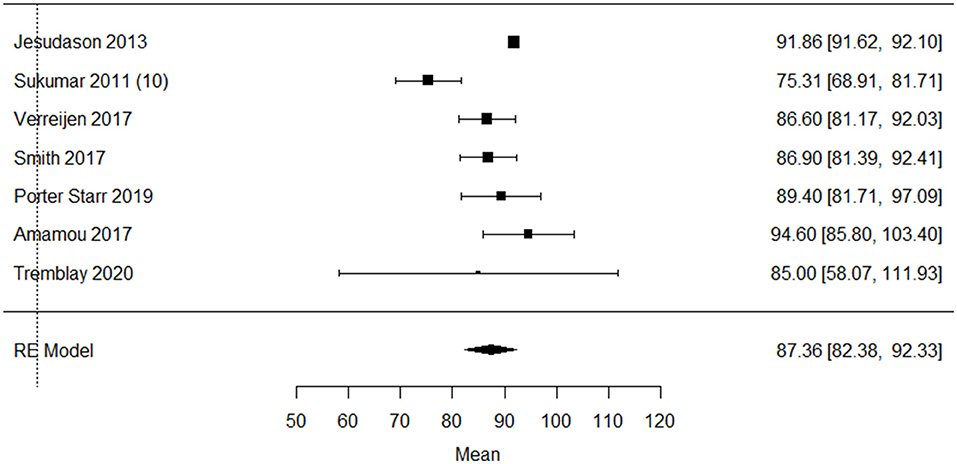
Figure 3. Forest plot of included studies on protein intake (g/day) in older adults with overweight/obesity mean [95% confidence interval], RE, random effects.
Five studies (n = 632) reported the baseline vitamin D intake. The pooled single-group meta-analysis in Figure 4 showed a mean vitamin D intake of 6.2 μg (95% CI: 3.51–8.92), I2 = 99.8%, p < 0.001 in older adults with overweight/obesity (4, 6, 10, 25, 28). The funnel plot (Supplementary Figure 4) on vitamin D intake in older adults with overweight/obesity showed asymmetry, indicating possible weak publication bias. Two studies investigated the difference in vitamin D intake between BMI categories. Neither of these studies reported significant differences between the older adults with overweight, or obesity and normal weight (6, 25).
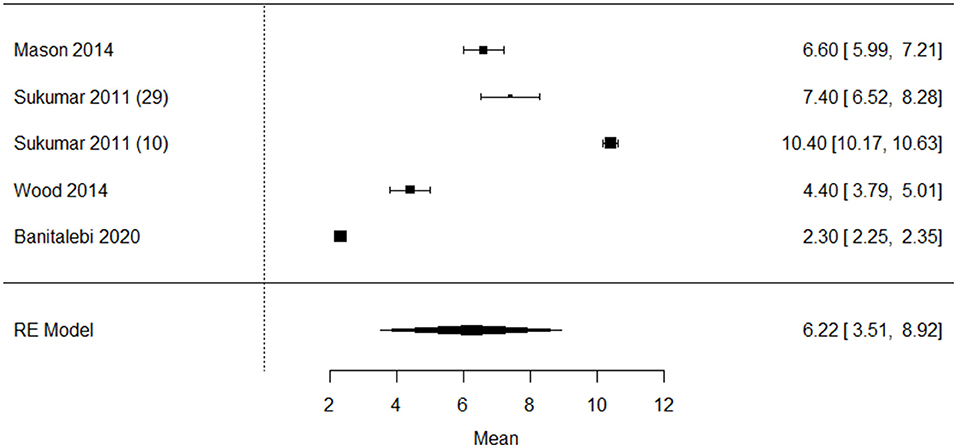
Figure 4. Forest plot of included studies on vitamin D intake (ug/day) in older adults with overweight/obesity mean [95% confidence interval], RE, random effects.
Fourteen studies that reported baseline 25(OH)D concentrations were included (4–9, 25, 41–45, 48). Nine of these compared older adults with overweight or obesity with older adults with normal weight. Four studies showed a significantly lower mean vitamin D status in older adults with overweight and obesity when comparing with normal weight older adults (6, 7, 25, 46). However, one study in overweight and obese Caucasian postmenopausal Scottish women (6) reported the lowest 25(OH)D concentrations (32.4 nmol/L, respectively), and indicated no significant differences in vitamin D status between older women with overweight, obesity and normal weight. 25(OH)D concentrations were obtained between January and March (6).
pooled single-group meta-analysis in Figure 5 showed a mean 25(OH)D concentration of 54.9 nmol/L (95% CI: 40.1–69.7), I2 = 99.3%, p < 0.001 in 1,639 older adults with overweight (Figure 5A), 51.9 nmol/L (95% CI: 45.9–57.8), I2 = 98.9%, p < 0.001 in 5,417 older adults with overweight/obesity (Figure 5B), 47.6 nmol/L (95%CI 33.1–62.1), I2 = 98.2%, p < 0.001) in 583 older adults with obesity (Figure 5C), and 53.6 nmol/L (95% CI: 44.8–62.4), I2 = 99.4%, p < 0.001 in 3,446 older adults with normal weight (Figure 5D), respectively. The funnel plot on 25(OH)D concentrations in older adults with overweight (Supplementary Figure 5), overweight/obesity (Supplementary Figure 6), obesity (Supplementary Figure 7), and normal weight (Supplementary Figure 8) showed asymmetry, indicating possible publication bias.
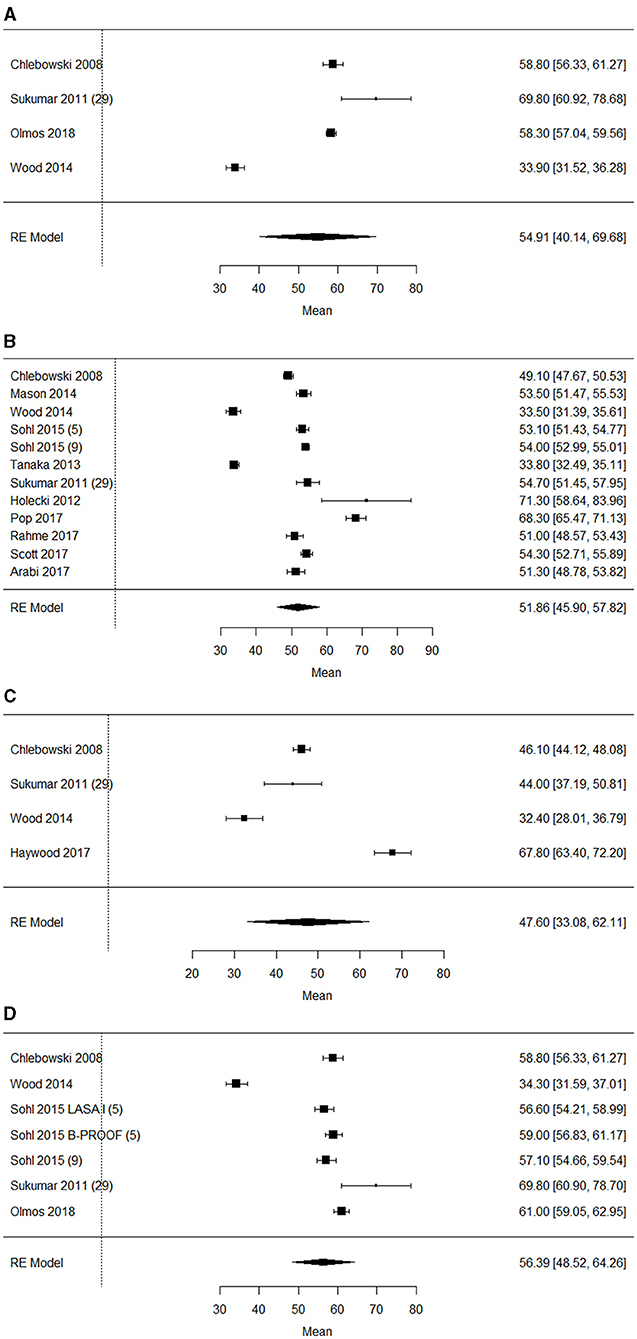
Figure 5. (A) Forest plot of included studies on 25(OH)D concentrations (nmol/L) in older adults with overweight mean [95% confidence interval], RE, random effects. (B) Forest plot of included studies on 25(OH)D concentrations (nmol/L) in older adults with overweight/obesity mean [95% confidence interval], RE, random effects. (C) Forest plot of included studies on 25(OH)D concentrations (nmol/L) in older adults with obesity mean [95% confidence interval], RE, random effects. (D) Forest plot of included studies on 25(OH)D concentrations (nmol/L) in older adults with normal weight mean [95% confidence interval], RE, random effects.
Figure 6 shows results of the meta-analyses for 25(OH)D concentrations between older adults with overweight (Figure 6A), overweight/obese (Figure 6B), obese (Figure 6C) and normal weight (Figure 6D). The meta-analysis on baseline 25(OH)D concentrations showed that in three studies (n = 3,956), the older adults with overweight/obesity had lower 25(OH)D concentrations than the older adults with normal weight. The largest difference was found between older adults with obesity and normal weight (n = 899) with a MD of 9.56 nmol/L; 95% CI: 7.81–11.31, I2 = 86%, p <0.001. The funnel plot (Supplementary Figures 9–12) on 25(OH)D concentrations between BMI categories showed a small asymmetry, indicating possible weak publication bias.
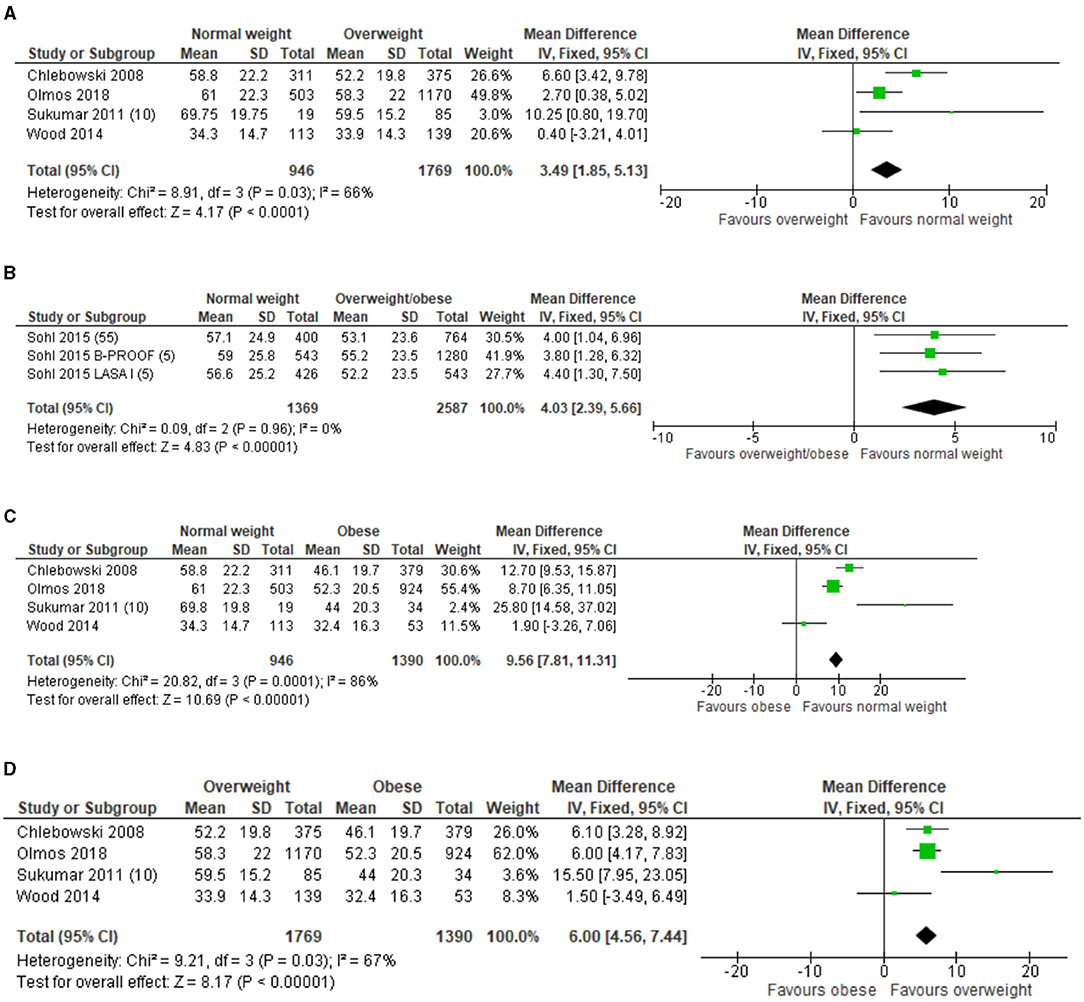
Figure 6. (A) Forest plot of included studies on 25(OH)D concentrations (nmol/L) in older adults between BMI categories overweight compared to normal weight. SD, standard deviation; IV, inverse varience; CI, confidence interval. (B) Forest plot of included studies on 25(OH)D concentrations (nmol/L) in older adults between BMI categories overweight/obese compared to normal weight. SD, standard deviation; IV, inverse varience; CI, confidence interval. (C) Forest plot of included studies on 25(OH)D concentrations (nmol/L) in older adults with between BMI categories obesity compared to normal weight. SD, standard deviation; IV, inverse varience; CI, confidence interval. (D) Forest plot of included studies on 25(OH)D concentrations (nmol/L) in older adults with between BMI categories overweight compared to obesity. SD, standard deviation; IV, inverse varience; CI, confidence interval.
In total, seven studies (n = 1,869) reported baseline intake for calcium. Five studies included only older adults who were overweight (40), obese (26, 28), or both (10, 27). Two studies included older adults with overweight, obesity, and normal weight, and ascertained a lower calcium intake in postmenopausal women with a BMI >35 kg/m2 compared to postmenopausal women with a BMI <25 kg/m2 (p < 0.02) (25). The other study in postmenopausal women reported no significant differences between older adults with overweight, obesity, and normal weight (6). Single-group meta-analysis in older adults with overweight and obesity was performed in six studies and showed a pooled mean calcium intake of 964.5.0 mg (95% CI: 704.3–1224.7), I2 = 99.1%, p < 0.001 (Figure 7). The funnel plot (Supplementary Figure 13) on calcium intake in older adults with overweight/obesity showed asymmetry, indicating possible publication bias.
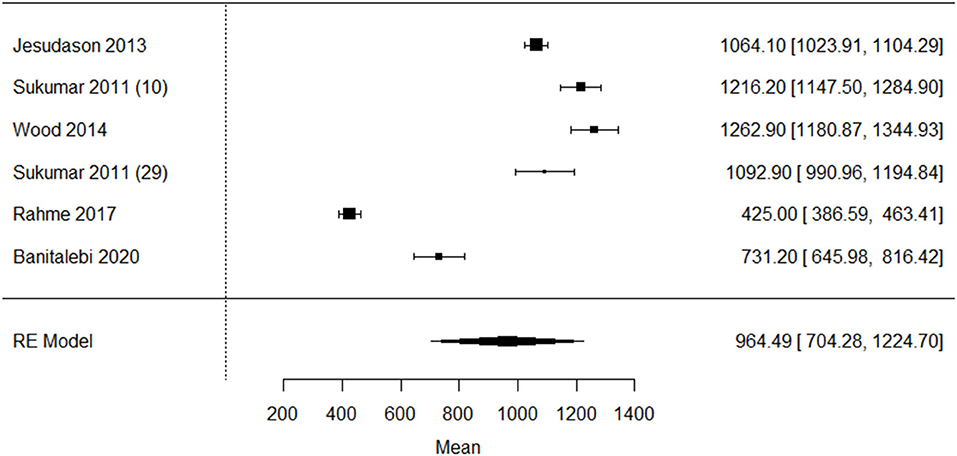
Figure 7. Forest plot of included studies on calcium intake (milligram/day) in older adults with overweight/obesity mean [95% confidence interval]. RE, Random effects.
One study in Lebanese older adults reported the very low mean dietary calcium intake (425 ± 292 mg) (27) compared to the other studies. Since it is known that the Lebanese population has a low calcium intake due to lower intake of dairy (49), this study was excluded from the meta-analysis (Figure 8). The sensitivity analysis showed a asymmetry, indicating possible publication bias (Supplementary Figure 14).
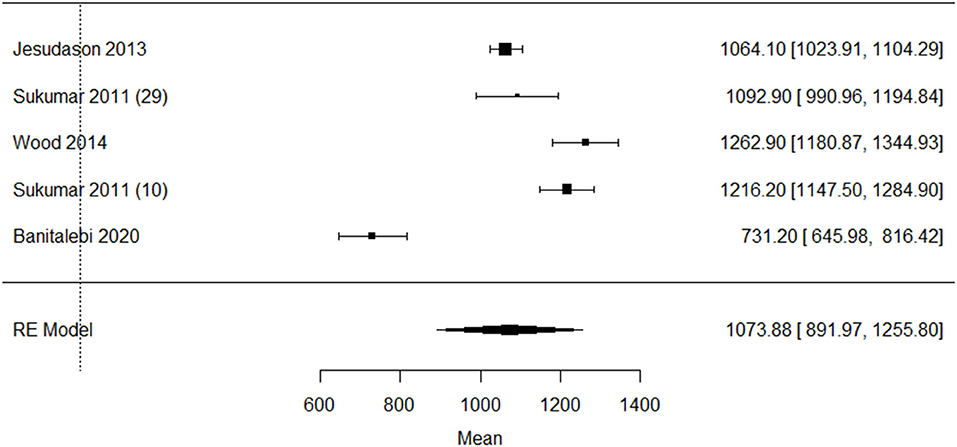
Figure 8. Sensitivity analysis of included studies on calcium intake (milligram/day) in older adults with overweight/obesity mean [95% confidence interval]. RE, Random effects.
This is the first systematic review combined with a meta-analysis that compared the mean intake of protein, vitamin D, calcium, and 25(OH)D concentrations in older adults with overweight or obesity with nutrient recommendations, and determined the difference in protein, vitamin D, calcium intake, and 25(OH)D concentrations between older adults overweight, obesity, and normal weight. We found that the pooled mean protein intake is borderline sufficient when compared to the recommendations for a general healthy population. No studies were found with a focus on differences in protein intake between older adults with overweight, obesity, and normal weight. Vitamin D intake is insufficient in older adults across all BMI categories. Only in older adults with obesity, the pooled mean 25(OH)D concentration is deficient. Unfortunately, a meta-analysis could not be performed on the differences in protein, vitamin D, and calcium intake between older adults with overweight, obesity, and normal weight, due to the small number of studies available.
This study showed that the pooled mean of protein intake in older adults with overweight or obesity is almost equal to the recommendation from the European Society for Clinical Nutrition and Metabolism (ESPEN) of 1.0–1.2 gram protein/g/kg/day for healthy older adults (11). However, since the average pooled protein intake is bordeline sufficient, this strongly suggests that still a large proportion of these populations does not consume a sufficient daily amount of protein. The ESPEN recommendation for protein intake differs from the general EFSA recommendation for healthy adults, which is 0.83 g/kg/day (13). The ESPEN recommendation was based on the possible development of anabolic resistance in older adults (50, 51). The latter may result from underlying mechanisms such as increased splanchnic sequestration of amino acids, decreased postprandial availability of amino acids, lower postprandial perfusion of muscle, decreased muscle uptake of dietary amino acids, reduced anabolic signaling for protein synthesis, and reduced digestive capacity (50, 52, 53). Therefore, older adults are likely to benefit from a higher amount of protein intake per day. Data from the National Health and Nutrition Survey (NHANES) showed that 10–25% of the older adults in all BMI categories have a protein intake lower than the recommended dietary allowance of 0.8 g/kg/day (13, 54). This percentage seems lower compared to our results. The low prevalence of deficient protein intake in older adults from the NHANES study could be explained by the use of a different protein recommendation per day. In our study, we compared the pooled mean protein intake with the recommendation of 1.0 g protein/kg/day, while the NHANES compared the protein intake of their participants with the protein recommendation of 0.8 g/kg/day.
This systematic review found that vitamin D intake is insuffient in older adults with overweight, obesity, and normal weight, while the pooled mean for calcium intake was sufficient in older adults with overweight and obese. One of the included studies in a Lebanese elderly population showed a mean dietary calcium intake of 425 mg per day, indicating a very insuffient mean intake of dietary calcium in Lebanese elderly when compared to the EFSA recommendation for daily calcium intake of 950 mg (23).
Another study in Lebanese adults also demonstrated low dietary calcium intake in Lebanese adults, which was explained by a low intake of animal calcium sources, i.e., dairy (49). In the current study, mean vitamin D intake was insufficient in all weight groups, while the pooled mean 25(OH)D concentrations in the overweight/obese combined was barely sufficient, and the pooled mean for older adults with obesity was deficient compared to the 25(OH)D recommendation by the Institute of Medicine of ≥50 nmol/L (12). The results of the current study on vitamin D and calcium intake are in agreement with those found in another study in Americans aged ≥19 years, which reported also insufficient vitamin D intake and supplement intake and sufficient calcium intake/supplement intake across all BMI categories (55). Another study also showed that obese adults have a lower intake of dietary supplements compared to overweight, and normal weight adults (56–58). In the current study, older adults with obesity also had the highest deficiencies. Therefore, healthcare professionals may broaden their attention to especially adults with obesity who are at higher risk of having insufficient intake of vitamin D compared to older adults with normal weight.
The current meta-analysis showed that the pooled mean for 25(OH)D concentrations was bordeline sufficient for older adults with overweight and normal weight and insufficient for older adults with obesity,. One study showed a very low mean 25(OH)D concentration of 33 nmol/L when compared to the other included studies and the recommendations of ≥50 nmol/L. This study was performed in healthy Scottish postmenopausal women and their 25(OH)D concentrations were measured in the winter (January–March). Although the study in Scottish postmenopausal women showed low 25(OH)D concentrations, the mean concentration was comparable with another study in Scottish women aged between 60 and 70 years old, namely 30 nmol/L. Possible explanations were given for low 25(OH)D concentrations in Scotland and include the very low yearly quota of sun and therefore solar radiation. Also due to the high latitude, a large additional loss of ultraviolet light (UVB) is seen in Scotland (59–61). Lastly, dietary intake of vitamin D and/or supplements are insufficient. Three studies showed a 25(OH)D concentrations range between 68 and 71 nmol/L (42, 44, 45), which was well above the pooled mean of 48–55 nmol/L for the older adults with obesity and overweight, respectively. The possible reasons for the higher mean 25(OH)D concentrations in these studies might be due to several reasons, like more sun exposure in countries like Australia (44), fortification of food products with vitamin D, e.g., milk in the USA (45), and/or vitamin D supplementation use (42, 44, 45). However, information on these factors is hardly discussed in the studies, which make forming conclusions difficult.
When evaluating vitamin D status, body weight and body composition, in particular adipose tissue, should be taken into account. Firstly, it is known that the overweight and obese engage less in (outside) physical activity (62), and are therefore less exposed to solar ultraviolet radiation, which lowers the cutaneous vitamin D3 synthesis (63). Accumulation of visceral adipose tissue and physical inactivity has shown to be associated (64, 65). Secondly, adipose tissue stores the fat-soluble vitamin D, which can result in lower 25(OH)D concentrations. Studies found that increased amounts of vitamin D have been found in adipose tissue while 25(OH)D concentrations were considered insufficient in individuals with obesity (66, 67).
Besides insufficient intake of nutrient dense products as a cause of nutrient insufficiencies, overweight and obese individuals are reported to have altered absorption, distribution, metabolism, excretion of micronutrients, or a combination of these (14). In contrast to insufficient intake, excessive intake of calories can lead to incomplete biochemical reactions that can produce toxic by-products. These by-products are hypothesized to create a vicious circle of more weight gain and the negative features that accompanies the obese population, such as depression, fatigue, and the metabolic syndrome (68). In addition, concentrations of different antioxidants, vitamins, and minerals are correlated with serum leptin concentrations, which is important for the regulation of food intake and energy expenditure. Changes in leptin concentrations can lead to changes in adipose tissue mass and can therefore trigger an (systemic) inflammatory response, which is a risk factor for obesity (15).
Previous research has shown that persons with a higher BMI may misreport dietary intake. Underreporting of energy (69) and protein intake has been associated with a higher BMI in adults. Several studies reported underestimation of protein intake by ~12–20% (70–72), which indicates that the results for protein intake from this meta-analysis might be an underestimation. Underestimation of the protein intake could lead to less older adults with overweight/obesity with insuffient protein intake. However, it is less clear if older adults with overweight or obesity also underreport calcium intake and vitamin D intake. One cross-sectional Canadian study in children and adults from all BMI categories (n = 16,190) showed underestimation of vitamin D and calcium intake by 7 and 8%, respectively (22). More research on the possibility of misreportinging micronutrients in adults with overweight, obesity, and normal weight is needed to correctly interpret habitual micronutrient intake.
The current systematic review has various implications for future research. First, we could only compare mean pooled data with reference values for nutrient intake and nutrient status. These reference values are primarily based on a healthy older population, as no reference values for older adults with overweight, obesity, or both are available. Specific reference values for with overweight and obesity can be nesscary, due to their reported altered absorption, distribution, metabolism, excretion of micronutrients, or a combination of these (14). Second, only a small number of studies determined the nutrient intake separately for with normal weight, overweight, and obesity. Therefore, additional studies are needed to allow for a more representative meta-analysis. Third, the heterogenity of the studies (I2) was considerable, i.e., 71–99%. This finding was not suprising since the study populations differed considerably by including healthy older adults, postmenopausal women, and different countries. The results of the meta analysis should therefore be interpretated with caution, for example for postmenopausal women.
The results of our systematic review and meta-analysis also have implications for daily practice. Awareness on older adults with overweight and obesity having have risk for nutrient defiencies even though their food intake might be higher than older adults with normal weight should be increased. Based on the current study, special consideration for deficiencies in protein, calcium, and vitamin D intake is needed to prevent decrease in healthy aging by deterioration in muscle strength, physical performance, and bone strength (4, 5, 7, 8). Also, older adults with overweight and obese should include food products high in protein (e.g., meat, fish, dairy, cheese, nuts, lentils, beans, and legumes) and calcium (e.g., dairy, cheese, vegetables, nuts, and legumes) in their diet. To increase vitamin D intake, vitamin D supplementation is recommended in most countries, next to sufficient sun exposure.
In the current systematic review combined with meta-analysis, we demonstrated that on average, older adults with overweight and obesity have a bordeline suffient protein intake, insufficient vitamin D intake and sufficient calcium intake. Although the average intake of protein and calium is sufficient, still a high number of older adults with overweight and obesity show insufficient intake. The severity of 25(OH)D deficiency is lowest in older adults with normal weight and highest in older adults with obesity. Healthcare professionals should be made aware of these deficiencies in older adults with overweight and obesity, since there are no guidelines for nutrient deficiencies based on weight.
The raw data supporting the conclusions of this article will be made available by the authors, without undue reservation.
PD: collecting data, the first author of the manuscript, and performed statistical analyses. GR: collecting data, and assisted the first author with all versions of the draft manuscript. CM: collecting data, and assisted the first author with the last draft of the manuscript. WK: performed statistical analyses and assisted in writing the whole manuscript. CS: assisted in writing the complete manuscript. EH and HJ-W: assisted in writing the complete manuscript, assisted in article search/selection when the first author and second author opinion was inconclusive, and assisted in forming the research question and key words for article selection. All authors contributed to the article and approved the submitted version.
The authors declare that the research was conducted in the absence of any commercial or financial relationships that could be construed as a potential conflict of interest.
All claims expressed in this article are solely those of the authors and do not necessarily represent those of their affiliated organizations, or those of the publisher, the editors and the reviewers. Any product that may be evaluated in this article, or claim that may be made by its manufacturer, is not guaranteed or endorsed by the publisher.
We would like to thank Frederiek Bosch for her assistance with the screening process of this systematic review.
The Supplementary Material for this article can be found online at: https://www.frontiersin.org/articles/10.3389/fnut.2021.718658/full#supplementary-material
25(OH)D, 25-hydroxyvitamin D; BMI, Body mass index; CI, Confidence interval; DRI, Dietary reference intake; ESPEN, European Society for Clinical Nutrition and Metabolism; EFSA, European Food Safety Authority; g/kg, Gram/kilogram body weight; IU, International unit; MeSH, Medical subject headings; MD, Mean difference; N.A., Not applicable; nmol/L, Nanomole/liter; PRISMA, Preferred Reporting Items for Systematic Reviews and Meta-analyses; RCT, Randomized controlled trial; RE, Random effects; SD, Standard deviation.
1. Agte V, Tarwadi K, Mengale S, Hinge A, Chiplonkar S. Vitamin profile of cooked foods: How healthy is the practice of ready-to-eat foods? Int J Food Sci Nutr. (2002) 53:197–208. doi: 10.1080/09637480220132814
2. Shapiro H, Pecht T, Shaco-Levy R, Harman-Boehm I, Kirshtein B, Kuperman Y, et al. Adipose tissue foam cells are present in human obesity. J Clin Endocrinol Metab. (2013) 98:1173–81. doi: 10.1210/jc.2012-2745
3. Jun S, Cowan AE, Bhadra A, Dodd KW, Dwyer JT, Eicher-Miller HA, et al. Older adults with obesity have higher risks of some micronutrient inadequacies and lower overall dietary quality compared to peers with a healthy weight, National Health and Nutrition Examination Surveys (NHANES), 2011–2014. Public Health Nutr. (2020) 3:2268–79. doi: 10.1017/S1368980020000257
4. Mason C, Xiao L, Imayama I, Duggan C, Wang CY, Korde L, et al. Vitamin D3 supplementation during weight loss: a double-blind randomized controlled trial. Am J Clin Nutr. (2014) 99:1015–25. doi: 10.3945/ajcn.113.073734
5. Sohl E, De Jongh RT, Heymans MW, Van Schoor NM, Lips P. Thresholds for serum 25(OH)D concentrations with respect to different outcomes. J Clin Endocrinol Metab. (2015) 100:2480–8. doi: 10.1210/jc.2015-1353
6. Wood AD, Secombes KR, Thies F, Aucott LS, Black AJ, Reid DM, et al. A parallel group double-blind RCT of vitamin D3 assessing physical function: Is the biochemical response to treatment affected by overweight and obesity? Osteoporos Int. (2014) 25:305–15. doi: 10.1007/s00198-013-2473-8
7. Chlebowski RT, Johnson KC, Kooperberg C, Pettinger M, Wactawski-Wende J, Rohan T, et al. Calcium plus vitamin D supplementation and the risk of breast cancer. J Natl Cancer Inst. 100. (2008) 1581–91. doi: 10.1093/jnci/djn360
8. Tanaka S, Kuroda T, Saito M, Shiraki M. Overweight/obesity and underweight are both risk factors for osteoporotic fractures at different sites in Japanese postmenopausal women. Osteoporos Int. (2013) 24:69–76. doi: 10.1007/s00198-012-2209-1
9. Sohl E, de Jongh RT, Swart KM, Enneman AW, van Wijngaarden JP, van Dijk SC, et al. The association between vitamin D status and parameters for bone density and quality is modified by body mass index. Calcif Tissue Int. (2015) 96:113–22. doi: 10.1007/s00223-014-9943-7
10. Sukumar D, Ambia-Sobhan H, Zurfluh R, Schlussel Y, Stahl TJ, Gordon CL, et al. Areal and volumetric bone mineral density and geometry at two levels of protein intake during caloric restriction: A randomized, controlled trial. J Bone Miner Res. (2011) 26:1339–48. doi: 10.1002/jbmr.318
11. Deutz NEP, Bauer JM, Barazzoni R, Biolo G, Boirie Y, Bosy-Westphal A, et al. Protein intake and exercise for optimal muscle function with aging: Recommendations from the ESPEN Expert Group. Clin Nutr. (2014) 33:929–36. doi: 10.1016/j.clnu.2014.04.007
12. Ross AC, Taylor CL, Yaktine AL, Del Valle HB. Institute of Medicine. Dietary reference intakes for calcium and vitamin D. Washington, DC: National academies Press. (2011).
13. EFSA. Scientific opinion on dietary reference values for protein. (2015). Available online at: https://efsa.onlinelibrary.wiley.com/doi/epdf/10.2903/j.efsa.2012.2557
14. Kaidar-Person O, Person B, Szomstein S, Rosenthal RJ. Nutritional deficiencies in morbidly obese patients: a new form of malnutrition? - Part A: vitamins. Obes Surg. (2008) 18:870–6. doi: 10.1007/s11695-007-9349-y
15. García OP, Long KZ, Rosado JL. Impact of micronutrient deficiencies on obesity. Nutr Rev. (2009) 67:559–72. doi: 10.1111/j.1753-4887.2009.00228.x
16. Kimmons JE, Blanck HM, Tohill BC, Zhang J, Khan LK. Associations between body mass index and the prevalence of low micronutrient levels among US adults. Med Gen Med. (2006) 8:59.
17. Astrup A, Bügel S. Overfed but undernourished: recognizing nutritional inadequacies/deficiencies in patients with overweight or obesity. Int J Obes. (2019) 43:219–32. doi: 10.1038/s41366-018-0143-9
18. Renzaho A, Halliday J, Nowson C. Vitamin D, obesity, and obesity-related chronic disease among ethnic minorities: a systematic review. Nutrition. (2011) 27:868–79.
19. Page M, McKenzie J, Bossuyt P, Boutron I, Hoffmann T, Mulrow C. The PRISMA 2020 statement: an updated guideline for reporting systematic reviews. Br J Med. (2021) 372. doi: 10.1136/bmj.n71
20. World Health Organization. Obesity: preventing and managing the global epidemic. Report of a WHO Consultation (WHO Technical Report Series). (2000). Available online at: https://apps.who.int/iris/handle/10665/42330
21. Higgins J. P. T, Green S. Chapter 8: Assessing risk of bias in included studies. In: Higgins JPT, Green S, editors. Cochrane Handbook for systematic Reviews of Interventions. Cochrane Collab. Chichester: John Wiley & Sons (2011)
22. Garriguet D. Impact of identifying plausible respondents on the under-reporting of energy intake in the Canadian Community Health Survey. Heal Reports. (2009) 219:47–55.
23. EFSA. Dietary Reference Values for nutrients - Summary report. (2017) p. 44. Available online at: https://www.efsa.europa.eu/en/supporting/pub/e15121
24. The Cochrane Collaboration. Cochrane Handbook for Systematic Reviews of Interventions. Cochrane Collab. Chichester: John Wiley & Sons (2011)
25. Sukumar D, Schlussel Y, Riedt CS, Gordon C, Stahl T, Shapses SA. Obesity alters cortical and trabecular bone density and geometry in women. Osteoporos. (2011) 22:635–45. doi: 10.1007/s00198-010-1305-3
26. Jesudason D, Nordin BEC, Keogh J, Clifton P. Comparison of 2 weight-loss diets of different protein content on bone health: A randomized trial. Am J Clin Nutr. (2013) 98:1343–52. doi: 10.3945/ajcn.113.058586
27. Rahme M, Sharara SL, Baddoura R, Habib RH, Halaby G, Arabi A, et al. Impact of calcium and two doses of vitamin D on bone metabolism in the elderly: a randomized controlled trial. J Bone Miner Res. (2017) 32:1486–95. doi: 10.1002/jbmr.3122
28. Banitalebi E, Faramarzi M, Ghahfarokhi MM, SavariNikoo F, Soltani N, Bahramzadeh A. Osteosarcopenic obesity markers following elastic band resistance training: A randomized controlled trial. Exp Gerontol. (2020) 135:110884. doi: 10.1016/j.exger.2020.110884
29. Verreijen AM, Verlaan S, Engberink MF, Swinkels S, De Vogel-Van Den Bosch J, Weijs PJM. A high whey protein-, leucine-, and vitamin D-enriched supplement preserves muscle mass during intentional weight loss in obese older adults: A double-blind randomized controlled trial. Am J Clin Nutr. (2015) 101:279–86. doi: 10.3945/ajcn.114.090290
30. Dutheil F, Lac G, Courteix D, Doré E, Chapier R, Roszyk L, et al. Treatment of metabolic syndrome by combination of physical activity and diet needs an optimal protein intake: a randomized controlled trial. Nutr J. (2012) 11:72. doi: 10.1186/1475-2891-11-72
31. Leenders M, Verdijk LB, van der Hoeven L, van Kranenburg J, Hartgens F, Wodzig WKWH, et al. Prolonged leucine supplementation does not augment muscle mass or affect glycemic control in elderly type 2 diabetic men. J Nutr [Internet]. (2011) 141:1070–6.
32. Backx EMP, Tieland M, Borgonjen-Van Den Berg KJ, Claessen PR, Van Loon LJC, De Groot LCPGM. Protein intake and lean body mass preservation during energy intake restriction in overweight older adults. Int J Obes. (2016) 40:299–304. doi: 10.1038/ijo.2015.182
33. Mojtahedi MC, Thorpe MP, Karampinos DC, Johnson CL, Layman DK, Georgiadis JG, et al. The effects of a higher protein intake during energy restriction on changes in body composition and physical function in older women. J Gerontol A Biol Sci Med Sci. (2011) 66:1218–25. doi: 10.1093/gerona/glr120
34. Verreijen AM, Engberink MF, Memelink RG, Van der Plas SE, Visser M, Weijs PJM. Effect of a high protein diet and/or resistance exercise on the preservation of fat free mass during weight loss in overweight and obese older adults: a randomized controlled trial. Nutr J. (2017) 16:1–8.
35. Smith GI, Yoshino J, Kelly SC, Reeds DN, Okunade A, Patterson BW, et al. High-protein intake during weight loss therapy eliminates the weight-loss-induced improvement in insulin action in obese postmenopausal women. Cell Rep. (2016) 11:849–61. doi: 10.1016/j.celrep.2016.09.047
36. Porter Starr KN, Orenduff M, McDonald SR, Mulder H, Sloane R, Pieper CF, et al. Influence of weight reduction and enhanced protein intake on biomarkers of inflammation in older adults with obesity. J Nutr Gerontol Geriatr. (2019) 38:33–49. doi: 10.1080/21551197.2018.1564200
37. Amamou T, Normandin E, Pouliot J, Dionne IJ, Brochu M, Riesco E. Effect of a high-protein energy-restricted diet combined with resistance training on metabolic profile in older individuals with metabolic impairments. J Nutr Heal Aging. (2017) 21:67–74. doi: 10.3389/fspor.2021.683327
38. Tremblay A, Clinchamps M, Pereira B, Courteix D, Lesourd B, Chapier R, et al. Dietary fibres and the management of obesity and metabolic syndrome: The resolve study. Nutrients. (2020) 12:1–20. doi: 10.3390/nu12102911
39. Deibert P, Solleder F, Konig D, Vitolins MZ, Dickhuth HH, Gollhofer A, et al. Soy protein based supplementation supports metabolic effects of resistance training in previously untrained middle aged males. Aging Male. (2011) 14:273–9. doi: 10.3109/13685538.2011.565091
40. Dennison EM, Syddall HE, Aihie Sayer A, Martin HJ, Cooper C. Lipid profile, obesity and bone mineral density: The Hertfordshire Cohort Study. QJM. (2007) 100:297–303. doi: 10.1093/qjmed/hcm023
41. Arabi A, Khoueiry-Zgheib N, Awada Z, Mahfouz R, Al-Shaar L, Hoteit M, et al. CYP2R1 polymorphisms are important modulators of circulating 25-hydroxyvitamin D levels in elderly females with vitamin insufficiency, but not of the response to vitamin D supplementation. Osteoporos Int. (2017) 28:279–90. doi: 10.1007/s00198-016-3713-5
42. Holecki M, Chudek J, Titz-Bober M, Wiecek A, Zahorska-Markiewicz B, Duława J. Changes of bone mineral density in obese perimenopausal women during 5-year follow-up. Pol Arch Med Wewnetrznej. (2012) 122:139–47. doi: 10.20452/pamw.1175
43. Scott D, Seibel M, Cumming R, Naganathan V, Blyth F, Le Couteur DG, et al. Sarcopenic obesity and its temporal associations with changes in bone mineral density, incident falls, and fractures in older men: the concord health and ageing in men project. J Bone Miner Res. (2017) 32:575–83. doi: 10.1002/jbmr.3016
44. Haywood CJ, Prendergast LA, Purcell K, Le Fevre L, Lim WK, Galea M, et al. Very low calorie diets for weight loss in obese older adults-a randomized trial. J Gerontol A Biol Sci Med Sci73. (2017) 59–65. doi: 10.1093/gerona/glx012
45. Pop LC, Sukumar D, Schneider SH, Schlussel Y, Stahl T, Gordon C, et al. Three doses of vitamin D, bone mineral density, and geometry in older women during modest weight control in a 1-year randomized controlled trial. Osteoporos Int. (2017) 28:377–88. doi: 10.1007/s00198-016-3735-z
46. Olmos JM, Hernández JL, Pariente E, Martínez J, González-Macías, et al. Serum 25-hydroxyvitamin D in obese Spanish adults: the Camargo Cohort Study. Obes Surg. (2018) 28:3862–71. doi: 10.1007/s11695-018-3430-6
47. Amamou T, Normandin E, Pouliot J, Dionne IJ, Brochu M, et al. Effect of a high-protein energy-restricted diet combined with resistance training on metabolic profile in older individuals with metabolic impairments. J Nutr Heal Aging. (2017) 2:67–74. doi: 10.1007/s12603-016-0760-8
48. Olmos JM, Hernández JL, Martínez J, Castillo J, Olmos-Martínez JM, González-Macías J. Trabecular bone score (TBS) in Spanish adult men: The camargo cohort study. Calcif Tissue Int. (2018) 102:S122–3. doi: 10.1016/j.semarthrit.2020.01.008
49. Gannagé-Yared MH, Chemali R, Sfeir C, Maalouf G, Halaby G. Dietary calcium and vitamin D intake in an adult Middle Eastern population: Food sources and relation to lifestyle and PTH. Int J Vitam Nutr Res. (2005) 75:281–9. doi: 10.1024/0300-9831.75.4.281
50. Burd NA, Gorissen SH, van Loon LJC. Anabolic resistance of muscle protein synthesis with aging. Exerc Sport Sci Rev. (2013) 41:169–73. doi: 10.1097/JES.0b013e318292f3d5
51. Rennie MJ. Anabolic resistance: the effects of aging, sexual dimorphism, and immobilization on human muscle protein turnover. Appl Physiol Nutr Metab. (2009) 34:377–81.
52. Bauer J, Biolo G, Cederholm T, Cesari M, Cruz-Jentoft AJ, Morley JE, et al. Evidence-based recommendations for optimal dietary protein intake in older people: A position paper from the prot-age study group. J Am Med Dir Assoc. (2013) 14:542–59. doi: 10.1016/j.jamda.2013.05.021
53. Koopman R, Walrand S, Beelen M, Gijsen AP, Kies AK, Boirie Y, et al. Dietary protein digestion and absorption rates and the subsequent postprandial muscle protein synthetic response do not differ between young and elderly men. J Nutr. (2009) 139:1707–13. doi: 10.3945/jn.109.109173
54. Fulgoni VL. Current protein intake in America: Analysis of the National Health and Nutrition Examination Survey, 2003-2004. Am J Clini Nutr. (2008) 87:1553–75. doi: 10.1093/ajcn/87.5.1554S
55. Wallace TC, Reider C, Fulgoni VL. Calcium and vitamin D disparities are related to gender, age, race, household income level, and weight classification but not vegetarian status in the united states: analysis of the NHANES 2001-2008 Data Set. J Am Coll Nutr. (2013) 32:321–30. doi: 10.1080/07315724.2013.839905
56. Webb AR, Kline L, Holick MF. Influence of season and latitude on the cutaneous synthesis of vitamin D3: exposure to winter sunlight in boston and edmonton will not promote vitamin D3 synthesis in human skin. J Clin Endocrinol Metab. (1988) 67:373–8. doi: 10.1210/jcem-67-2-373
57. Agarwal S, Reider C, Brooks JR, Fulgoni VL. Comparison of prevalence of inadequate nutrient intake based on body weight status of adults in the United States: An analysis of NHANES 2001–2008. J Am Coll Nutr. (2015) 34:126–34. doi: 10.1080/07315724.2014.901196
58. Orces C. The Association between Body Mass Index and Vitamin D Supplement Use among Adults in the United States. Cureus. (2019) 11:e5721, doi: 10.7759/cureus.5721
59. Zgaga L, Theodoratou E, Farrington SM, Agakov F, Tenesa A, Walker M, et al. Diet, environmental factors, and lifestyle underlie the high prevalence of vitamin D deficiency in healthy adults in Scotland, and supplementation reduces the proportion that are severely deficient. J Nutr. (2011) 141:1531–42. doi: 10.3945/jn.111.140012
60. Gies P, Roy C, Javorniczky J, Henderson S, Lemus-Deschamps L, Driscoll C. Global solar UV index: Australian measurements, forecasts and comparison with the UK - PubMed. Photochem Photobiol. (2004) 79:32–9.
61. Wang X, Gao W, Davis J, Olson B, Janson G, Slusser J. Dependence of erythemally weighted UV radiation on geographical parameters in the United States. SPIE. (2007) 6679:667903. doi: 10.1117/12.735284
62. Brock K, Huang WY, Fraser DR, Ke L, Tseng M, Stolzenberg-Solomon R, et al. Low vitamin D status is associated with physical inactivity, obesity and low vitamin D intake in a large US sample of healthy middle-aged men and women. J Steroid Biochem Mol Biol. (2010) 121:462–6. doi: 10.1016/j.jsbmb.2010.03.091
63. Compston JE, Vedi S, Ledger JE, Webb A, Gazet JC, Pilkington TR. Vitamin D status and bone histomorphometry in gross obesity. Am J Clin Nutr. (1981) 34:2359–63. doi: 10.1093/ajcn/34.11.2359
64. Ross R, Freeman JA, Janssen I. Exercise Alone Is an Effective Strategy for Reducing Obesity and related comorbidities. Exerc Sport Sci Rev. (2000) 28:165–70.
65. Riechman SE, Schoen RE, Weissfeld JL, Thaete FL, Kriska AM. Association of physical activity and visceral adipose tissue in older women and men. Obes Res. (2002) 10:1065–73. doi: 10.1038/oby.2002.144
66. Pramyothin P, Biancuzzo RM, Lu Z, Hess DT, Apovian CM, Holick MF. Vitamin D in adipose tissue and serum 25-hydroxyvitamin D after roux-en-Y gastric bypass. Obes (Silver Spring). (2011) 19:2228–34.
67. Beckman LM, Earthman CP, Thomas W, Compher CW, Muniz J, Horst RL, et al. Serum 25(OH) vitamin D concentration changes after Roux-en-Y gastric bypass surgery. Obes. (2013) 21:E599–606. doi: 10.1002/oby.20464
68. Lonsdale D. Crime and violence: A hypothetical explanation of its relationship with high calorie malnutrition. J Adv Med. (1994) 7:171–80. doi: 10.1093/ecam/nek009
69. Meng X, Kerr DA, Zhu K, Devine A, Solah VA, Wright J, et al. Under-reporting of energy intake in elderly Australian women is associated with a higher body mass index. J Nutr Heal aging. (2012) 172:112–8. doi: 10.1007/s12603-012-0382-8
70. Trijsburg L, Geelen A, Hollman PC, Hulshof PJ, Feskens EJ, Veer P., van't, et al. BMI was found to be a consistent determinant related to misreporting of energy, protein and potassium intake using self-report and duplicate portion methods. Public Health Nutr. (2017) 20:598–607. doi: 10.1017/S1368980016002743
71. Mossavar-Rahmani Y, Shaw PA, Wong WW, Sotres-Alvarez D, Gellman MD, Van Horn L, et al. Applying recovery biomarkers to calibrate self-report measures of energy and protein in the Hispanic community health study/study of latinos. Am J Epidemiol [Internet] 181, 996–. (1007). (2015).
72. Freisling H, Bakel MME, van Biessy C, May AM, Byrnes G, Norat T, et al. Dietary reporting errors on 24 h recalls and dietary questionnaires are associated with BMI across six European countries as evaluated with recovery biomarkers for protein and potassium intake. Br J Nutr [Internet]. (2012) 107:910–20. doi: 10.1093/aje/kwu468
Keywords: overweight, obesity, protein, micronutrients, older adults
Citation: Dewansingh P, Reckman GAR, Mijlius CF, Krijnen WP, van der Schans CP, Jager-Wittenaar H and van den Heuvel EGHM (2021) Protein, Calcium, Vitamin D Intake and 25(OH)D Status in Normal Weight, Overweight, and Obese Older Adults: A Systematic Review and Meta-Analysis. Front. Nutr. 8:718658. doi: 10.3389/fnut.2021.718658
Received: 01 June 2021; Accepted: 16 August 2021;
Published: 10 September 2021.
Edited by:
Donato Angelino, University of Teramo, ItalyReviewed by:
Immacolata Cristina Nettore, Federico II University Hospital, ItalyCopyright © 2021 Dewansingh, Reckman, Mijlius, Krijnen, van der Schans, Jager-Wittenaar and van den Heuvel. This is an open-access article distributed under the terms of the Creative Commons Attribution License (CC BY). The use, distribution or reproduction in other forums is permitted, provided the original author(s) and the copyright owner(s) are credited and that the original publication in this journal is cited, in accordance with accepted academic practice. No use, distribution or reproduction is permitted which does not comply with these terms.
*Correspondence: Priya Dewansingh, cC5kZXdhbnNpbmdoQHBsLmhhbnplLm5s
Disclaimer: All claims expressed in this article are solely those of the authors and do not necessarily represent those of their affiliated organizations, or those of the publisher, the editors and the reviewers. Any product that may be evaluated in this article or claim that may be made by its manufacturer is not guaranteed or endorsed by the publisher.
Research integrity at Frontiers
Learn more about the work of our research integrity team to safeguard the quality of each article we publish.