 Halima S. Twabi
 Samuel O. M. Manda
 Dylan S. Small4‡
94% of researchers rate our articles as excellent or good
Learn more about the work of our research integrity team to safeguard the quality of each article we publish.
Find out more
ORIGINAL RESEARCH article
Front. Nutr. , 18 November 2021
Sec. Nutrition Methodology
Volume 8 - 2021 | https://doi.org/10.3389/fnut.2021.714232
Introduction: Appropriate complementary foods have been found to provide infants and young children with nutritional needs for their growth and development. In the absence of a randomized control trial (RCT), this study used observational data to evaluate the effect of appropriate complementary feeding practices on the nutritional status of children aged 6–23 months in Malawi using a propensity score matching statistical technique.
Methods: Data on 4,722 children aged 6 to 23 months from the 2015–16 Malawi Demographic and Health Survey (MDHS) were analyzed. Appropriate complementary feeding practices were assessed using the core indicators recommended by the World Health Organization (WHO)/United Nations Children's Fund (UNICEF), and consist of the introduction of complementary feeding, minimum dietary diversity, minimum meal frequency and minimum acceptable diet based on a dietary intake during a most recent 24-h period.
Results: The prevalence of stunting (height-for-age z-score < −2 SD) was 31.9% (95% CI: 29.3%, 34.6%), wasting (weight-for-height z-score < −2 SD) 3.5% (95% CI: 2.6%, 4.7%) and underweight (weight-for-age z-score < −2 SD) 9.9% (95% CI: 8.4%, 11.8%). Of the 4,722 children, 7.7% (95% CI: 6.9%, 8.5%) were provided appropriate complementary foods. Appropriate complementary feeding practices were found to result in significant decrease in stunting (OR = 0.7, 95% CI: 0.4, 0.95). They also resulted in the decrease of wasting (OR = 0.4, 95% CI: 0.1, 1.7) and underweight (OR = 0.6, 95% CI: 0.2, 1.7).
Conclusion: Appropriate complementary feeding practices resulted in a reduction of stunting, wasting, and underweight among children 6 to 23 months of age in Malawi. We recommend the continued provision of appropriate complementary foods to infants and young children to ensure that the diet has adequate nutritional needs for their healthy growth.
Undernourished children have their immune system compromised, making them more vulnerable to chronic diseases and infections. They take longer to recover from illnesses and have an increased risk of dying, especially from infectious diseases (1). Malnutrition levels among children aged under 5 years are high in Sub-Saharan Africa (SSA). They are too short for their age (stunted) (32%), too thin for their height (wasted) (10%), and too thin for their age (underweight) (15%) (2–4). To enhance their nutrition needs, complementary iron, minerals and vitamin-rich foods are introduced at the age of 6 months. Complementary feeding entails giving a child other semi-solid, soft foods and solid foods, liquids, water along with breast milk (5). Several randomized control trials (RCTs) have shown the beneficial nutritional effect of optimal timing and amount of complementary foods on child growth (6–9). Similar findings of the effect of complementary foods were also found using observational studies (10–12).
Due to high levels of poverty, inadequate diversity in farming and foods, and high levels of HIV, under-nutrition among children in Malawi has remained a public health concern. Children in Malawi experience chronic under-nutrition and high levels of deficiencies in important micro-nutrients that are needed for optimal growth (13, 14). Thus, the Government of Malawi has initiated several policies, a Food and Nutrition Security Policy (2007) and a National Nutrition Policy and Strategic Plan (NNPSP) (15, 16). The Young Child Nutrition Strategy (2009–2014) (17, 18) set a number of priority areas, one of which was improved infant and young child feeding practices, with the aim of improving the intake of essential micro-nutrients. In particular, children aged 6–23 months are fed porridge made from Maize flour (grains) with the addition of legumes, such as groundnuts and soybeans, cooking oil and leafy vegetables to the porridge (19) for improved nutrition. There is a need to provide empirically driven evidence that evaluates the impact of child nutrition interventions in Malawi. However, there has been a paucity of randomized control studies that have evaluated and confirmed the beneficial effect of appropriate complementary feeding practices on child growth indicators.
Even though a randomized control trial (RCT) could be conceived, it would be very unethical based on evidence found in previous RCT studies on the beneficial effect of complementary feeding. However, we could still assess the efficacy of appropriate complementary feeding practices on growth measures of children 6–23 months of age using observational data with appropriate statistical techniques. In this study, we used observational complementary feeding data from the 2015–16 Malawi Demographic and Health Survey (2016 MDHS). The DHS Program provides very revealing health data on which most of the health indicators in the sub-Saharan African region are derived (20).
Our proposed method relies on balancing confounder variables between children who were provided appropriate complementary foods and those who were not. For example, a mother's education, counseling on child feeding, household wealth, a child's age, duration of breastfeeding, source of drinking water, media exposure, mother's body mass index, a mother's HIV status, previous history of infections, sex of a child and low birth weight are associated with child growth indicators (11, 21–25). A statistical method that could be used to balance the distribution of confounder variables is based on the Propensity Score (PS) methods (26–28). In this way, we would have derived a quasi-experiment to estimate the effect of appropriate complementary feeding practices on growth measurements of children 6–23 months of age based on the survey data.
The data was obtained from the 2015–16 Malawian Demographic Health Survey (MDHS), which was implemented by the National Statistical Office of Malawi in conjunction with the Ministry of Health and the Community Health Services Unit of Malawi. More details on the sampling procedure and design can be obtained from the 2015–16 MDHS report (29). The study analyzed data on 4,722 children aged 6 to 23 months for whom weight (in kilograms) and height (in centimeters) were measured.
We used three anthropometric indices for children as outcome variables, namely height-for-age, weight-for-height and weight-for-age. For our study, we followed the convention of recording each index as a z-score, which indicates how many standard deviations (SD) is a child's index from the median of the World Health Organization (WHO) Child Growth Standards (30). For example, height-for-age z-score < −2 SD denotes a child who is stunted; similarly for wasting (weight-for-height z-score < −2 SD), and underweight (weight-for-age z-score < −2 SD).
Covariates that were identified within the Malawi Demographic and Health Survey as potential confounders included: mother's education, counseling on breastfeeding, history of diarrhea, household wealth, child's age, mother's employment, sex of a child, place of residence, wealth quintile, mother's age, mother's HIV status, birth weight and antenatal visits. However, we replaced mother's employment status with mother's education and wealth as only a few mothers were employed full-time, hence, the matched sample would have been small within mothers belonging in the full-time category.
Appropriate complementary feeding practices were defined using the core indicators recommended by the WHO/UNICEF in 2008 (31) which combines the introduction of complementary feeding, minimum dietary diversity, minimum meal frequency and minimum acceptable diet based on a dietary intake 24-h before the survey and calculated for the age range 6–23 months of age. These are defined as:
a) Introduction of complementary foods = 1 if a child aged 6–23 months was complementary fed (solid, semi-solid or soft foods) and 0 otherwise (21, 31).
b) Minimum dietary diversity (MDD) = 1 if a child received foods from four or more food groups during the previous day and 0 otherwise. This refers to the child receiving the following food groups; grains, roots and tubers; legumes and nuts; dairy products (milk, yogurt and cheese); flesh foods (meat, fish, poultry and liver/organ meats); eggs; vitamin A-rich fruits and vegetables; and other fruits and vegetables (21, 31).
c) Minimum meal frequency (MMF) = 1 if a breastfeeding and non-breastfeeding child aged 6–23 months received complementary foods the minimum number of times or more (minimum was defined as two times for breastfed infants 6–8 months; three times for breastfed children 9–23 months; and four times for non-breastfed children 6–23 months) in the previous day (21, 31), 0 otherwise.
d) Minimum acceptable diet (MAD) = 1 if a child was fed a minimum dietary diversity and minimum meal frequency during the day or night preceding the survey (31) and 0 otherwise. Minimum acceptable diet was calculated as a composite indicator from the following;
i Breastfed children—minimum dietary diversity and minimum meal frequency as above.
ii Non-breastfed children—minimum dietary diversity but excluding the dairy products category (4 out of 6 groups) and minimum meal frequency and 2 or more milk feeds.
In measuring the appropriate complementary feeding practice exposure using the MDHS data, we set it equal to 1 if a child was provided complementary foods and had a minimum dietary diversity and a minimum meal frequency, otherwise, it was set to 0.
The propensity score matching (PSM) was used to balance the covariate differences between children who were provided appropriate complementary foods and those who were not. In the estimation of propensity scores (PS), we used a binary logistic regression to model whether a child was provided appropriate complementary foods as a function of potential confounders. From this model, probabilities of whether a child was given appropriate complementary foods conditional on the confounders were estimated to give “propensity scores.” The scores were then subsequently used in covariate matching between the two appropriate complementary feeding practice groups (26–28, 32, 33). We used the nearest neighbor method on a 1:1 ratio (34) at a recommended 0.2 caliper (35).
The standardized difference was used to assess balance for the distribution of measured potentially confounded covariates between appropriately and inappropriately complementary fed children (36). A standardized difference of 10% (0.1) is commonly used as a cut-off point to assess adequate balance of the covariates (36, 37). We further compare the balance in the measured confounders between children who were provided appropriate complementary foods and those who were not using a McNemar's Bowker's test for categorical variables and a paired t-test for continuous variables.
One strong assumption of conducting the PSM is that there remains no unobserved confounding. It is impossible to prove that no unobserved confounding exists, but through a sensitivity analysis, we can measure if the results are sensitive to hidden bias. This was done by using a McNemar's exact test of sensitivity for binary outcomes. McNemar's test compares the number of discordant pairs in which appropriately complementary fed children had improved growth against inappropriately complementary fed children who did not have improved growth (38–40). Several packages are available to conduct a sensitivity test on the effects for binary outcomes in R (41) and Stata (42). We used the binarysens of Rbound package in R to obtain the values of the upper and lower bounds on the estimates for wasting, stunting and underweight (43).
Summary information about characteristics of feeding practices and prevalence of the growth indicators for the 4,722 studied children aged 6–23 months is presented in Table 1. Of these children, 3.7% (95% CI: 2.7%, 4.6%), 27% (24.8%, 29.3%), and 13.6% (95% CI: 12.1%, 15%) were wasted, stunted, and underweight, respectively. Of the 4,722 children, 3,725 (78.9%) were still breastfeeding while 997 (21.1%) were not breastfeeding at the time of the survey. A majority of the children 3,929 (83.2%) were given complementary foods, and of these children, 1,589 (42.7%) were aged 6–11 months. More than half of all the children (57.5 %) were fed more than two times a day, the day preceding the survey. The common dietary foods given to the children were grains (27.9%) followed by legumes and nuts (24.5%). Out of the 4,722 children, 3,942 (83.6%) children had mothers who were counseled on breastfeeding.
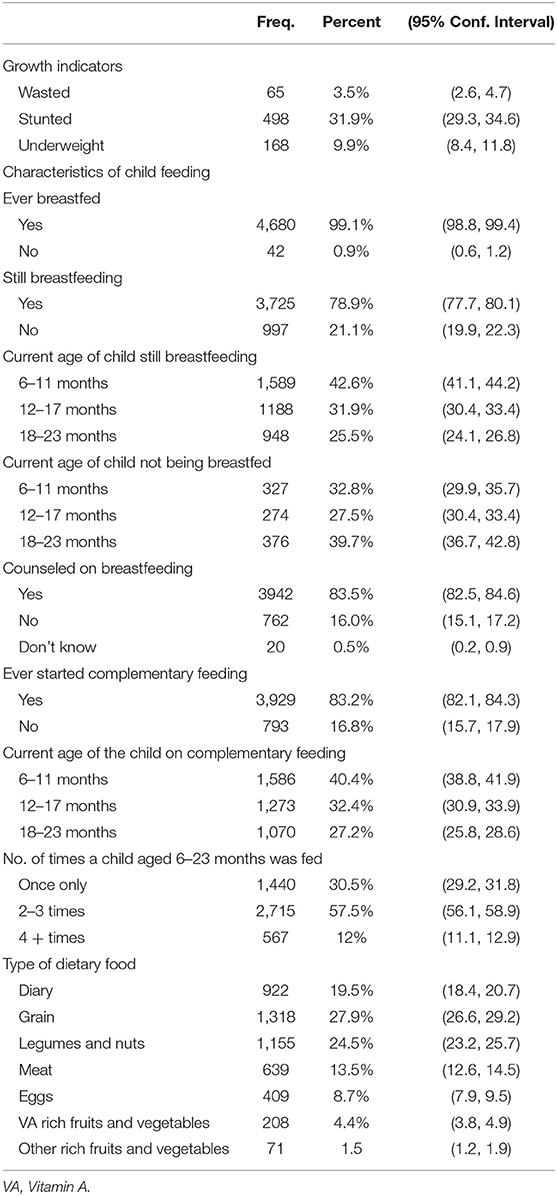
Table 1. Characteristics of complementary feeding and growth indicators among the 4,722 children 6–23 months old from the 2015–16 MDHS.
Table 2 presents the proportion of children meeting the four WHO/UNICEF feeding indicators. Of the 4,722 children, 1,434 (30.4%) children aged 6–23 months received solid, semi-solid or soft foods the minimum number of times meeting a minimum meal frequency (MMF), 1,073 (22.7%) children were offered four or more food groups on the day preceding the survey meeting the minimum dietary diet (MDD), and 342 (8.0%) children were given a minimum adequate diet. Combining the three feeding indicators, introduction of complementary foods, minimum dietary diversity and minimum meal frequency, the overall prevalence of children provided with appropriate complementary foods was 7.7 % (95% CI: 6.9, 8.5).
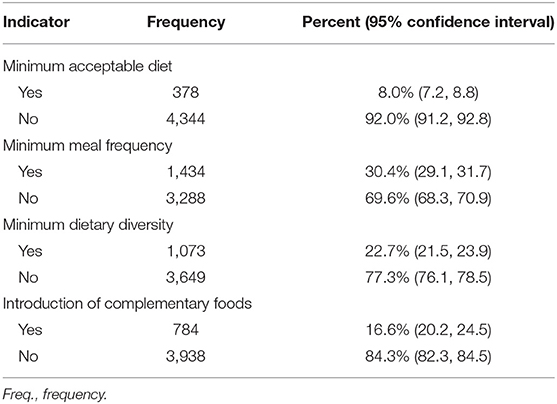
Table 2. Proportion of infants and young children meeting the four WHO/UNICEF feeding indicators in 2015–16.
We modeled the probability of whether a child was provided appropriate complementary foods as a function of potential confounders namely, mother's HIV status, mother's age, child's age, child's sex, household wealth, mother's education, antenatal care visits, place of residence, birth weight, history of diarrhea and the results are presented in Table 3. In the univariate associations, there was a significant association between older child age (12–17 months) (OR = 1.32, 95% CI: 1.01, 1.73), (18–23 months) (OR = 1.46, 95% CI: 1.12, 1.92), rural residence (OR = 0.44, 95 % CI: 0.3, 0.6), Secondary/Post-Secondary education for mothers (OR = 2.9, 95 % CI: 1.5, 5.6) and low birth weight (OR = 1.42, 95% CI: 1.04, 1.93) with the provision of appropriate complementary foods. However, in the multivariate logistic regression analysis, only the age of the child was associated with appropriate complementary feeding practice (as expected older children were more likely to be given complementary foods; for example, children aged 18–23 months were one and a half times more likely than children aged 6–11 months (OR = 1.68, 95% CI: 1.01, 2.78), (see Table 3).
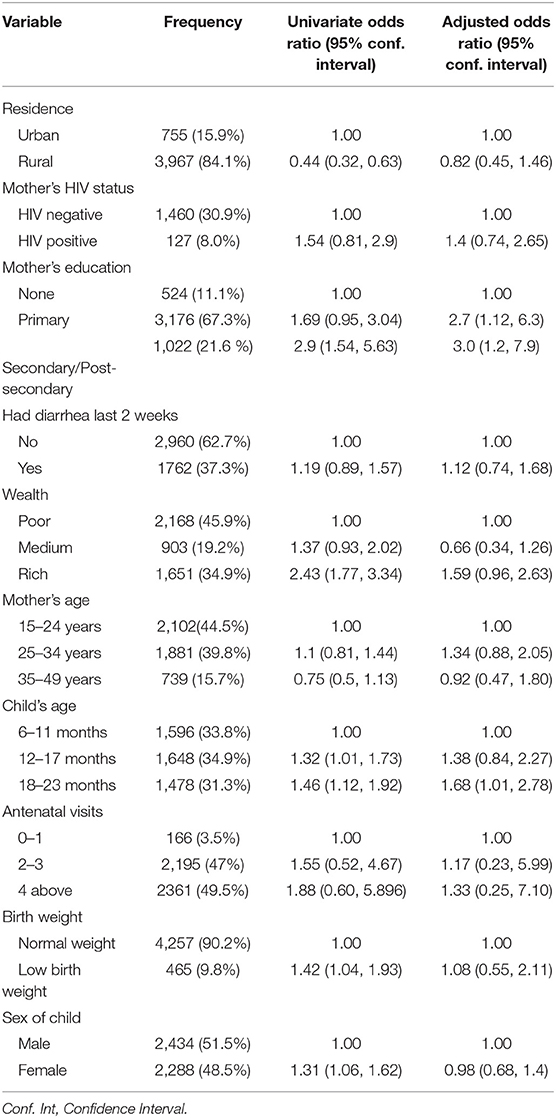
Table 3. Odds ratio (95% Confidence Interval) for the association between provision of appropriate complementary foods and predictors of child growth.
The Hosmer and Lemeshow goodness-of-fit test was performed to check if the propensity score model fit the data well. The Hosmer and Lemeshow test statistic had a p-value of 0.5881 indicating that the model used to estimate the propensity scores fit the data reasonably well. In addition, a classification accuracy analysis test was done to check the percentage of children correctly specified as being provided with appropriate complementary foods. The results for classification analysis showed that 91.05% of the children were correctly specified to either being appropriately complementary fed or not.
Table 4 presents the distribution of the studied confounder variables before and after matching. We used the nearest neighbor matching algorithm with a 0.2 caliper to restrict the difference in propensity scores between matched children. Before matching on the propensity score, out of the 4,722 children, 368 (7.7%) were provided appropriate complementary foods and 4,354 (92.3%) were not provided appropriate complementary foods. Of the 368 children, 43.8% were born to HIV-uninfected mothers, while 56.2% were born to HIV-infected mothers. Of those children who were provided appropriate complementary foods, 205 (55.7 %) were males and 163 (44.3%) were females, 232 (63.1%) resided in the rural area and 136 (36.9%) were from the urban area, 325 (88.3%) had a normal weight and 43 (11.7 %) had a low birth weight, and 194 (52.7%) had mothers who had primary education. Place of residence, sex of a child, household wealth index, mother's educational status, and mother's age were distributed differently between children provided appropriate complementary foods and those not provided appropriate complementary foods (P < 0.05), (see Table 4).
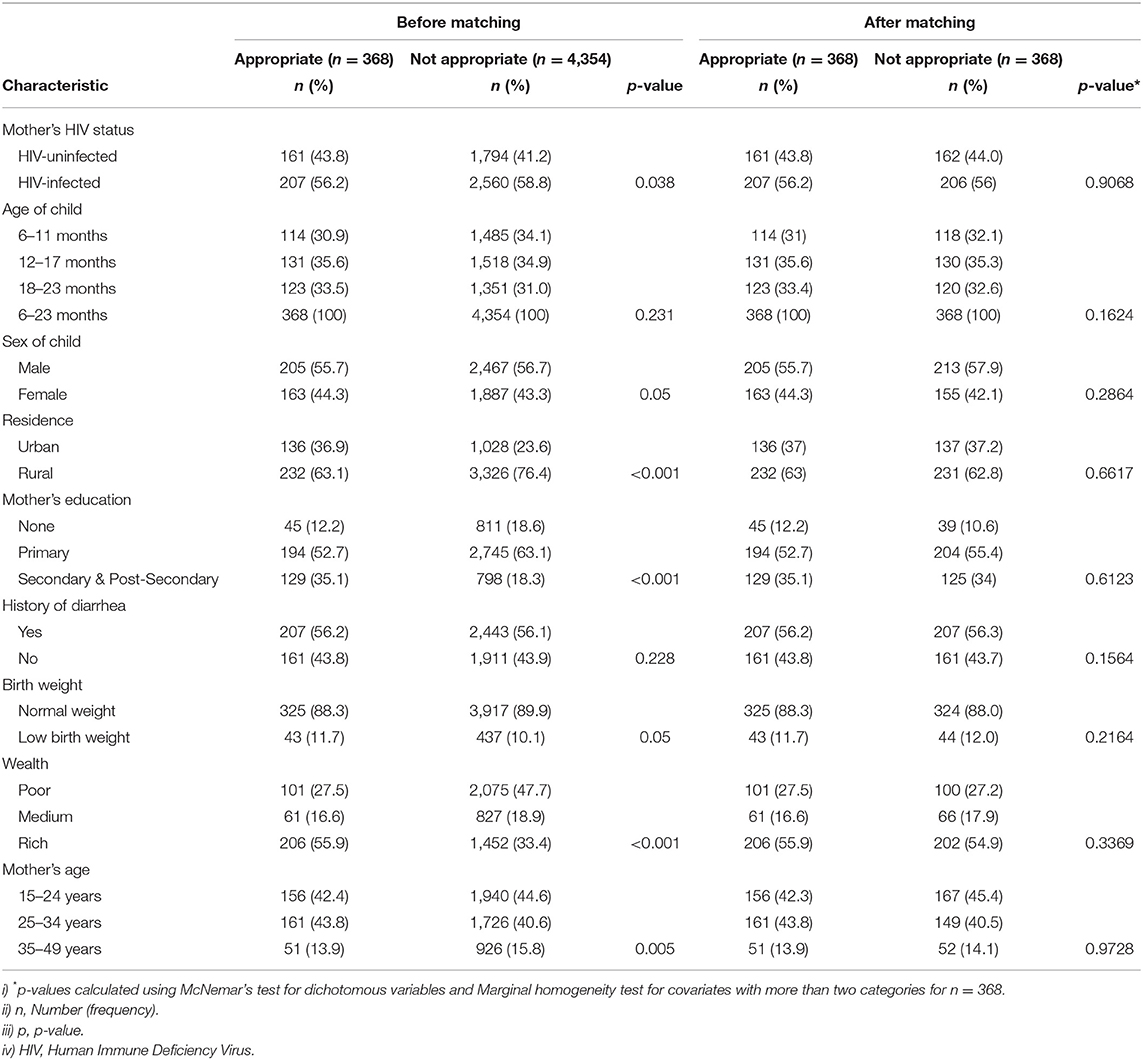
Table 4. Distribution of characteristics between appropriately and inappropriately fed children before and after matching.
We assessed for balance on the matched sample by checking that each confounder did not significantly differ in proportion between children who were given appropriate complementary foods and those who were not using McNemar's Bowker's test for categorical variables. After PS matching on the confounders, 368 matched pairs (appropriately and not appropriately complementary fed pairs of children) were analyzed for the difference in baseline characteristics as shown in Table 4. No significant difference was observed in the covariates between children provided appropriate complementary foods and those who were not provided.
A standardized difference of 0.1 (10 per cent) was used as a decision criterion for balance in the measured covariates (37). We observed homogeneity in the distribution of the covariates between children provided with appropriate complementary foods and those who were not (P > 0.05) on the matched sample (Table 5). Before matching, the absolute value of the standardized difference was >0.1 for mother's education, child's age, mother's age, sex of a child, and history of diarrhea. After matching, all covariates had an absolute standardized difference of <0.1 indicating a balance in differences within the observed covariates between children who were provided appropriately complementary foods and those who were not.
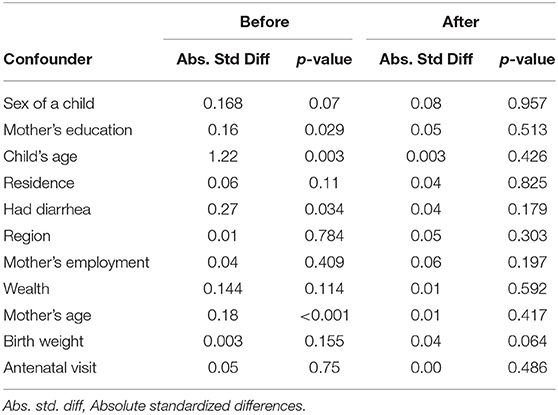
Table 5. Absolute standard differences and p-values before and after application of propensity matching.
For the unmatched sample, an ordinary logistic regression was used to assess the effect of appropriate complementary feeding practices on wasting, stunting and underweight, accounting for potential confounders. For the effect estimation of appropriate complementary feeding practices on child growth on the matched data, conditional logistic regression models were used, the results are shown in Table 6. For the unmatched sample, there was no significant association between appropriate complementary foods and child growth even though there was an indication that appropriate complementary foods were protective. For the matched sample, appropriate complementary foods were associated with a reduction in stunting (OR = 0.7, 95% CI: 0.4, 0.95); wasting (OR = 0.4, 95% CI: 0.1, 1.7) and underweight (OR = 0.6, 95% CI: 0.2, 1.7), but the association was not significant for wasting and underweight.
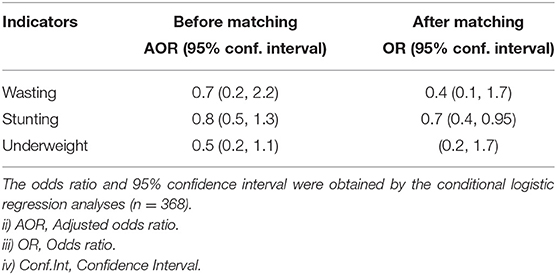
Table 6. The effect of appropriate complementary feeding practices on child growth indicators for children aged 6–23 months in Malawi.
For a sensitivity analysis, we consider a range of values of the odds ratio of two matched children to be given appropriate complementary foods [this is denoted as gamma in the literature (40, 44)] from 1 to a maximum value of 2 with an increment of 0.1. If there were no unmeasured confounding, this maximum odds ratio would be 1; higher values of the maximum odds ratio correspond to more unmeasured confounding. The results for the sensitivity analysis for the upper bound p-values of McNemar's sensitivity test are presented in Table A1 in the Appendix. The finding of a positive effect of appropriate complementary foods on stunting was least robust to possible unobserved confounders. The significant level of gamma at which we would have to question our conclusion of a positive effect on stunting was very close to 1 (between 1.1 and 1.2). For wasting, it would require gamma values between 1.7 and 1.8 to render the conclusion of the beneficial effect of appropriate complementary foods on wasting spurious. In the case of the effect of appropriate complementary foods on underweight, the effect was sensitive to an unobserved confounder at gamma values between 1.5 and 1.6.
The study set out to estimate the beneficial effect of appropriate complementary foods on anthropometric indices of children 6–23 months of age in Malawi using observational data from the 2015–16 Malawi Demographic and Health Survey. We applied propensity score matching to balance confounders between appropriate complementary feeding practice groups. We found that children who were provided appropriate complementary foods resulted in a decrease in stunting, wasting and underweight. To the best of knowledge, this is first study that has estimated the effect of appropriate complementary feeding practices on child growth using observational data by employing quasi-experimental statistical methods such as propensity score matching.
Similar findings were obtained using randomized control trials (11, 45–48), and (11, 49–51) using observational studies. Our findings confirm WHO guidelines (5, 52) that recommend initiating complementary feeding at 6 months of age while continuing to breastfeed, with adequate timing of meals and the appropriate diversity of the foods. In addition, the findings support the importance of guidelines that emphasize appropriate feeding practices among young children in Malawi (53, 54).
Appropriate complementary feeding practices among children 6–23 months should be encouraged in Malawi. The timely introduction of appropriate complementary foods has been suggested by the World Health Organization (WHO) as an effective measure in promoting improved child growth (31). Strategies that promote appropriate feeding practices must be emphasized to ensure that children receive the appropriate diet, especially those living within poor households. Poor households in Malawi are known to be food insecure (19). Regular access to highly nutritious food such as meat, eggs, milk and cooking oil is a challenge, as a result, children may be given maize porridge only without additional supplements (9, 55). Child feeding interventions that improve complementary feeding practices by using locally available recipes should be encouraged and promoted.
One of the strengths of our study is that we used the propensity score (derived from a logistic regression) matching to balance confounders between children who were provided appropriate complementary foods and those who were not. Thus, we have avoided ethical concerns that could have arisen by allocating children into appropriately complementary fed and inappropriately complementary fed groups while available evidence shows a clear benefit of appropriate complementary feeding practices. The beneficial effect of the provision of appropriate complementary foods to children 6–23 months of age in this study has been ascertained using observational data, which is readily available and owned by the government of Malawi. Our analyses have shown the viability of using observational data to provide appropriate scientific evidence on the effect of a locally relevant intervention on a major public health issue.
There were some limitations in the study that could have affected our findings. For example, the use of cross-sectional data does not provide a temporal association between the provision of appropriate complementary foods and the growth indicators. Longitudinal studies allow for such temporal associations between exposures and outcomes to estimate beneficial effects. For our study, it could have been that some children were initiated on complementary feeding before the survey. Thus, some sort of temporal association could be assumed, implying that the estimated beneficial effects could be possible. Appropriate complementary feeding practice used as exposure in our study was self-reported by the mothers. Self-reporting is subject to recall bias and may have underestimated or overestimated the effects (56, 57). However, since the recall time was short (24 h before the survey), we assume that the bias could be minimal. Furthermore, as expected the sample size reduced from 4,722 to 736, which is one of the inherent problems of using the PS matching. We were limited to the confounder variables available in the data set used for our study. One of the unobserved confounders that were not measured from the data is exclusive breastfeeding (EBF). Children who may have been exclusively breastfed and then provided with appropriate complementary foods would have had better growth indicators than those who were not exclusively breastfed. However, we assume that the EBF status was already accounted for in both appropriate complementary feeding groups. Findings from the sensitivity analysis show that the observed effect on stunting could have been affected by the unobserved confounders, while those of wasting and underweight were not. Thus, the results from our study on the effect of appropriate complementary feeding practices on child growth must be interpreted with caution.
Appropriate complementary foods were found to result in the reduction of stunting, wasting and underweight among children 6 to 23 months of age in Malawi. We recommend continuation of nutritional interventions that promote improved feeding practices and intake of essential micro-nutrients for infants and young children as outlined in several Government of Malawi nutritional policies and strategies. These interventions will significantly aid in sustained reduction of retarded growth among children in Malawi and low-middle-income countries (LMIC).
The datasets presented in this study can be found in online repositories. The names of the repository/repositories and accession number(s) can be found below: https://dhsprogram.com/data/available-datasets.cfm.
The MDHS study was ethically approved by the Malawi Health Research Committee, Institutional Review Board of ICF Macro, and Center for Disease and Control (CDC) in Atlanta, GA, USA, and Prevention IRB. Written informed consent to participate in this study was provided by the participants' legal guardian/next of kin.
HT performed data management, statistical analysis, and wrote the initial draft of the manuscript. SM conceived and suggested the direction for this paper, reviewed statistical analysis and results, and helped with the revision of the manuscript. DS helped with the concept and direction. All authors have read and approved the final manuscript.
HT's work on this manuscript was partially supported by the DELTAS Africa Sub-Saharan Africa Consortium for Advanced Biostatistics Training (SSACABT). (The DELTAS Africa Initiative is an independent funding scheme of the African Academy of Sciences (AAS)'s Alliance for Accelerating Excellence in Science in Africa (AESA) and supported by the New Partnership for Africa's Development Planning and Coordinating Agency (NEPAD Agency) with funding from the Wellcome Trust and the UK Government.) HT was also supported by the L'Oreal-UNESCO for Women in Science Sub-Saharan Africa Young Talents Programme through the Young Talents award. She also thanks the South African Medical Research Council (SAMRC) for funding part of her research visit to the SAMRC. SOMM's research work on this study was supported by the SAMRC. The views expressed in this publication are those of the author(s) and not those of the funders (AAS, NEPAD Agency, Wellcome Trust or the UK Government, L'Oreal, SAMRC). The funders were not involved in the study design, collection, analysis, interpretation of data, the writing of this article or the decision to submit it for publication.
The authors declare that the research was conducted in the absence of any commercial or financial relationships that could be construed as a potential conflict of interest.
All claims expressed in this article are solely those of the authors and do not necessarily represent those of their affiliated organizations, or those of the publisher, the editors and the reviewers. Any product that may be evaluated in this article, or claim that may be made by its manufacturer, is not guaranteed or endorsed by the publisher.
HT thanks the Biostatistics Research Unit of the SAMRC for hosting her PhD research visits. We acknowledge the DHS team for making the 2016 MDHS data available to us to use on this study.
1. Rice AL, Sacco L, Hyder A, Black RE. Malnutrition as an underlying cause of childhood deaths associated with infectious diseases in developing countries. Bull World Health Organ. (2000) 78:1207–21. doi: 10.1590/S0042-96862000001000007
2. WHO. Global Targets 2025 to Improve Maternal, Infant and Young Children Nutrition. Tech. Rep. World Health Organization. Geneva, Switzerland (2017).
3. UNICEF. Children, Food and Nutrition: Growing Well in a Changing World. New York, NY: UNICEF (2019).
4. UNICEF. WHO, World Bank Group. Joint Child Malnutrition Estimates. Levels and Trends in Child Malnutrition, 2016. New York, NY: UNICEF (2020).
5. WHO. Infant and Young Child Feeding: Model Chapter for Textbooks for Medical Students and Allied Health Professionals. Geneva: World Health Organization (2009).
6. Dewey KG, Adu-Afarwuah S. Systematic review of the efficacy and effectiveness of complementary feeding interventions in developing countries. Matern Child Nutr. (2008) 4:24–85. doi: 10.1111/j.1740-8709.2007.00124.x
7. Krebs NF, Hambidge KM, Mazariegos M, Westcott J, Goco N, Wright LL, et al. Complementary feeding: a global network cluster randomized controlled trial. BMC Pediatr. (2011) 11:4. doi: 10.1186/1471-2431-11-4
8. Martinez B, Webb MF, Gonzalez A, Douglas K, del Pilar Grazioso M, Rohloff P. Complementary feeding intervention on stunted Guatemalan children: a randomised controlled trial. BMJ Paediatr Open. (2018) 2:e000213. doi: 10.1136/bmjpo-2017-000213
9. Vazir S, Engle P, Balakrishna N, Griffiths PL, Johnson SL, Creed-Kanashiro H, et al. Cluster-randomized trial on complementary and responsive feeding education to caregivers found improved dietary intake, growth and development among rural Indian toddlers. Matern Child Nutr. (2013) 9:99–117. doi: 10.1111/j.1740-8709.2012.00413.x
10. Perkins JM, Jayatissa R, Subramanian S. Dietary diversity and anthropometric status and failure among infants and young children in Sri Lanka. Nutrition. (2018) 55:76–83. doi: 10.1016/j.nut.2018.03.049
11. Walters CN, Rakotomanana H, Komakech JJ, Stoecker BJ. Maternal determinants of optimal breastfeeding and complementary feeding and their association with child under-nutrition in Malawi (2015–2016). BMC Public Health. (2019) 19:1503. doi: 10.1186/s12889-019-7877-8
12. Pokharel P, Adhikari A, Lamsal P, Adhikari R. Effect of complementary feeding practices and nutritional status of children (6-23 months) in Tamang community, Ambhanjyang Vdc of Makwanpur. Janaki Med Coll J Med Sci. (2017) 5:22–32. doi: 10.3126/jmcjms.v5i1.17984
13. Lelijveld N, Seal A, Wells JC, Kirkby J, Opondo C, Chimwezi E, et al. Chronic disease outcomes after severe acute malnutrition in Malawian children (chrosam): a cohort study. Lancet Glob Health. (2016) 4:e654–62. doi: 10.1016/S2214-109X(16)30133-4
14. Kumchulesi G. Persistence of child malnutrition in Malawi: explanations from demographic and health surveys. J Afr Dev Afr Finance Econ Assoc. (2018) 20:69–75. Available online at: https://www.jstor.org/stable/10.5325/jafrideve.20.1.0069
15. Malawi Ministry of Agriculture M. Food and Nutrition Security Policy. Tech. Rep. Government of Malawi. Lilongwe, Malawi (2007).
16. Government of Malawi M. National Nutrition Policy and Strategic Plan 2007 - 2012. Tech. Report. Government of Malawi. Lilongwe, Malawi (2007).
17. Malawi Ministry of Health P. Infant and Young Child Nutrition Strategy, 2009-2014. Tech. Report. Malawi Ministry of Health and Population. Lilongwe, Malawi (2009).
18. Osendarp SJ, Shilpi F, Gondwe T, Pangapanga-Phiri I, Kalimbira A, Mtimuni B, et al. Determinants of Reductions in Childhood Stunting in Malawi's Community-based Nutrition Programs Health, Nutrition, and Population Discussion Paper. Washington DC: World Bank (2019). doi: 10.1596/32302
19. Geresomo N, Mbuthia E, Matofari J, Mwangwela A. Risk factors associated with stunting among infants and young children aged 6-23 months in Dedza district of central Malawi. Afr J Food Agric Nutr Dev. (2017) 17:12854–70. doi: 10.18697/ajfand.80.16730
20. Manda SO, Kandala N-B, Ghilagaber G. Advanced techniques for modelling maternal and child health in Africa. In: Advanced Techniques for Modelling Maternal and Child Health in Africa. Dordrecht: Springer (2014). p. 1–7. doi: 10.1007/978-94-007-6778-2_1
21. Kassa T, Meshesha B, Haji Y, Ebrahim J. Appropriate complementary feeding practices and associated factors among mothers of children age 6–23 months in southern Ethiopia, 2015. BMC Pediatr. (2016) 16:131. doi: 10.1186/s12887-016-0675-x
22. Nkoka O, Mhone TG, Ntenda PA. Factors associated with complementary feeding practices among children aged 6–23 months in Malawi: an analysis of the demographic and health survey 2015–2016. Int Health. (2018) 10:466–79. doi: 10.1093/inthealth/ihy047
23. Dhami MV, Ogbo FA, Osuagwu UL, Agho KE. Prevalence and factors associated with complementary feeding practices among children aged 6–23 months in India: a regional analysis. BMC Public Health. (2019) 19:1034. doi: 10.1186/s12889-019-7360-6
24. Li Z, Kim R, Vollmer S, Subramanian S. Factors associated with child stunting, wasting, and underweight in 35 low-and middle-income countries. JAMA Netw Open. (2020) 3:e203386–e203386. doi: 10.1001/jamanetworkopen.2020.3386
25. Twabi HS, Manda SO, Small DS. Assessing the effects of maternal HIV infection on pregnancy outcomes using cross-sectional data in Malawi. BMC Public Health. (2020) 20:974. doi: 10.1186/s12889-020-09046-0
26. Rosenbaum PR, Rubin DB. The central role of the propensity score in observational studies for causal effects. Biometrika. (1983) 70:41–55. doi: 10.1093/biomet/70.1.41
27. Rubin DB, Thomas N. Matching using estimated propensity scores: relating theory to practice. Biometrics. (1996) 52:249–64. doi: 10.2307/2533160
28. Austin PC. An introduction to propensity score methods for reducing the effect of confounding in observational. Multivariate Behav Res. (2011) 46:399–424. doi: 10.1080/00273171.2011.568786
29. National Statistical Office (NSO) [Malawi] and ICF. Malawi Demographic and Health Survey 2015-16 Report. Tech. Rep. National Statistics Office Malawi and ICF. Zomba, Malawi, and Rockville, Maryland, USA. NSO and ICF (2007).
30. WHO. WHO Child Growth Standards: Length/Height-for-Age, Weight-for-Age, Weight-for-Length, Weight-for-Height and Body Mass Index-for-Age: Methods and Development. Geneva: World Health Organization (2006).
31. WHO. Indicators for Assessing Infant and Young Child Feeding Practices: Part 2: Measurement. Geneva: World Health Organization (2010).
32. Lunceford JK, Davidian M. Stratification and weighting via the propensity score in estimation of causal treatment effects: a comparative study. Stat Med. (2004) 23:2937–60. doi: 10.1002/sim.1903
33. Cole S, Hernan MA. Constructing inverse probability weights for marginal structural models. Am J Epidemiol. (2008) 168:656–64. doi: 10.1093/aje/kwn164
34. Austin PC, Mamdani MM. A comparison of propensity score methods: a case-study estimating the effectiveness of post-ami statin use. Stat Med. (2006) 25:2084–106. doi: 10.1002/sim.2328
35. Gu XS, Rosenbaum PR. Comparison of multivariate matching methods: structures, distances, and algorithms. J Comput Graph Stat. (1993) 2:405–20. doi: 10.1080/10618600.1993.10474623
36. Austin PC. Balance diagnostics for comparing the distribution of baseline covariates between treatment groups in propensity-score matched samples. Stat Med. (2009) 28:3083–107. doi: 10.1002/sim.3697
37. Normand S-LT, Landrum MB, Guadagnoli E, Ayanian JZ, Ryan TJ, Cleary PD, et al. Validating recommendations for coronary angiography following acute myocardial infarction in the elderly: a matched analysis using propensity scores. J Clin Epidemiol. (2001) 54:387–98. doi: 10.1016/S0895-4356(00)00321-8
39. Rosenbaum P. Observational Studies. 2nd ed. New York, NY: Springer-Verlag (2002). doi: 10.1007/978-1-4757-3692-2
40. Rosenbaum PR. Sensitivity analysis in observational studies. Stat Ref Online. (2005) 4:1809–14. doi: 10.1002/0470013192.bsa606
41. Rosenbaum PR, Small DS. An adaptive Mantel–Haenszel test for sensitivity analysis in observational studies. Biometrics. (2017) 73:422–30. doi: 10.1111/biom.12591
42. Becker SO, Caliendo M. Sensitivity analysis for average treatment effects. Stata J. (2007) 7:71–83. doi: 10.1177/1536867X0700700104
43. Keele L. An Overview of Rbounds: An R Package for Rosenbaum Bounds Sensitivity Analysis With Matched Data. Vol. 1. Columbus, OH: White Paper (2010). p. 15.
44. Aakvik A. Bounding a matching estimator: the case of a Norwegian training program. Oxf Bull Econ Stat. (2001) 63:115–43. doi: 10.1111/1468-0084.00211
45. Marriott BP, White A, Hadden L, Davies JC, Wallingford JC. World Health Organization (who) infant and young child feeding indicators: associations with growth measures in 14 low-income countries. Matern Child Nutr. (2012) 8:354–70. doi: 10.1111/j.1740-8709.2011.00380.x
46. Disha A, Rawat R, Subandoro A, Menon P. Infant and young child feeding (iycf) practices in Ethiopia and Zambia and their association with child nutrition: analysis of demographic and health survey data. Afr J Food Agric Nutr Dev. (2012) 12:5895–914. doi: 10.4314/AJFAND.V12I2
47. Udoh EE, Amodu OK. Complementary feeding practices among mothers and nutritional status of infants in Akpabuyo area, cross river state Nigeria. Springerplus. (2016) 5:2073. doi: 10.1186/s40064-016-3751-7
48. Lassi ZS, Rind F, Irfan O, Hadi R, Das JK, Bhutta ZA. Impact of infant and young child feeding (iycf) nutrition interventions on breastfeeding practices, growth and mortality in low-and middle-income countries: systematic review. Nutrients. (2020) 12:722. doi: 10.3390/nu12030722
49. Kumar D, Goel N, Mittal PC, Misra P. Influence of infant-feeding practices on nutritional status of under-five children. Indian J Pediatr. (2006) 73:417–21. doi: 10.1007/BF02758565
50. Zongrone A, Winskell K, Menon P. Infant and young child feeding practices and child undernutrition in Bangladesh: insights from nationally representative data. Public Health Nutr. (2012) 15:1697–704. doi: 10.1017/S1368980012001073
51. Lassi ZS, Das JK, Zahid G, Imdad A, Bhutta ZA. Impact of education and provision of complementary feeding on growth and morbidity in children less than 2 years of age in developing countries: a systematic review. BMC Public Health. (2013) 13:S13. doi: 10.1186/1471-2458-13-S3-S13
52. WHO. Global Strategy for Infant and Young Child Feeding. Geneva: World Health Organization (2003).
53. Malawi Ministry of Health P. Infant and Young Child Nutrition Policy and Guidelines 2003 - 2020. Tech. Rep. Malawi Ministry of Health and Population. Lilongwe, Malawi (2011).
54. Phiri FP. Experiences of multi-sector programming in Malawi. Field Exchange. (2016) 52:97. Available online at: www.ennonline.net/fex/52/multisectorprogrammingmalawi
55. Kinyoki DK, Kandala N-B, Manda SO, Krainski ET, Fuglstad G-A, Moloney GM, et al. Assessing comorbidity and correlates of wasting and stunting among children in Somalia using cross-sectional household surveys: 2007 to 2010. BMJ Open. (2016) 6:e009854. doi: 10.1136/bmjopen-2015-009854
56. Althubaiti A. Information bias in health research: definition, pitfalls, and adjustment methods. J Multidiscip Healthc. (2016) 9:211. doi: 10.2147/JMDH.S104807
57. Paeratakul S, Popkin B, Kohlmeier L, Hertz-Picciotto I, Guo X, Edwards L. Measurement error in dietary data: implications for the epidemiologic study of the diet–disease relationship. Eur J Clin Nutr. (1998) 52:722–7. doi: 10.1038/sj.ejcn.1600633
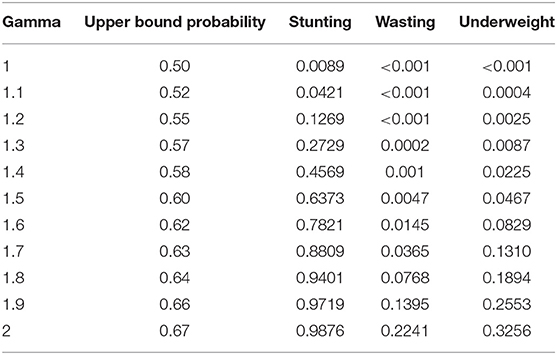
Table A1. Sensitivity analysis - Rosenbaums upper bounds for stunting, wasting and underweight.
Keywords: average treatment effect, child growth and nutrition, complementary feeding practices, Sub-Saharan Africa, propensity score matching, quasi-experimental method
Citation: Twabi HS, Manda SOM and Small DS (2021) Evaluating the Effect of Appropriate Complementary Feeding Practices on Child Growth in Malawi Using Cross-Sectional Data: An Application of Propensity Score Matching. Front. Nutr. 8:714232. doi: 10.3389/fnut.2021.714232
Received: 05 August 2021; Accepted: 28 September 2021;
Published: 18 November 2021.
Edited by:
Samiran Bisai, Regional Medical Research Centre for Tribals (ICMR), IndiaReviewed by:
Suman Chakrabarty, West Bengal State University, IndiaCopyright © 2021 Twabi, Manda and Small. This is an open-access article distributed under the terms of the Creative Commons Attribution License (CC BY). The use, distribution or reproduction in other forums is permitted, provided the original author(s) and the copyright owner(s) are credited and that the original publication in this journal is cited, in accordance with accepted academic practice. No use, distribution or reproduction is permitted which does not comply with these terms.
*Correspondence: Halima S. Twabi, aHR3YWJpQHVuaW1hLmFjLm13
†These authors share first authorship
‡Senior author
Disclaimer: All claims expressed in this article are solely those of the authors and do not necessarily represent those of their affiliated organizations, or those of the publisher, the editors and the reviewers. Any product that may be evaluated in this article or claim that may be made by its manufacturer is not guaranteed or endorsed by the publisher.
Research integrity at Frontiers
Learn more about the work of our research integrity team to safeguard the quality of each article we publish.