
95% of researchers rate our articles as excellent or good
Learn more about the work of our research integrity team to safeguard the quality of each article we publish.
Find out more
ORIGINAL RESEARCH article
Front. Nutr. , 20 September 2021
Sec. Nutritional Epidemiology
Volume 8 - 2021 | https://doi.org/10.3389/fnut.2021.690428
 Ni Shi1,2†
 Desmond Aroke1,3†
 Qi Jin1,4Dong Hoon Lee5Hisham Hussan1,6
 Xuehong Zhang5
 JoAnn E. Manson7,8
 Erin S. LeBlanc9
 Ana Barac10
 Chrisa Arcan11Steven K. Clinton1,2,4
 Edward L. Giovannucci5,7,8
 Fred K. Tabung1,2,4,5,12*
Background: Dietary patterns promoting hyperinsulinemia and chronic inflammation, including the empirical dietary index for hyperinsulinemia (EDIH) and empirical dietary inflammatory pattern (EDIP), have been shown to strongly influence risk of weight gain, type 2 diabetes, cardiovascular disease, and cancer. EDIH was developed using plasma C-peptide, whereas EDIP was based on plasma C-reactive protein (CRP), interleukin-6, and tumor necrosis factor alpha receptor 2 (TNF-αR2). We investigated whether these dietary patterns were associated with a broader range of relevant biomarkers not previously tested.
Methods: In this cross-sectional study, we included 35,360 women aged 50–79 years from the Women's Health Initiative with baseline (1993–1998) fasting blood samples. We calculated EDIH and EDIP scores from baseline food frequency questionnaire data and tested their associations with 40 circulating biomarkers of insulin response/insulin-like growth factor (IGF) system, chronic systemic inflammation, endothelial dysfunction, lipids, and lipid particle size. Multivariable-adjusted linear regression was used to estimate the percent difference in biomarker concentrations per 1 standard deviation increment in dietary index. FDR-adjusted p < 0.05 was considered statistically significant.
Results: Empirical dietary index for hyperinsulinemia (EDIH) and empirical dietary inflammatory pattern (EDIP) were significantly associated with altered concentrations of 25 of the 40 biomarkers examined. For EDIH, the percent change in biomarker concentration in the insulin-related biomarkers ranged from +1.3% (glucose) to +8% (homeostatic model assessment for insulin resistance) and −9.7% for IGF-binding protein-1. EDIH impacted inflammation and endothelial dysfunction biomarkers from +1.1% (TNF-αR2) to +7.8% (CRP) and reduced adiponectin by 2.4%; and for lipid biomarkers: +0.3% (total cholesterol) to +3% (triglycerides/total cholesterol ratio) while reducing high-density lipoprotein cholesterol by 2.4%. EDIP showed a similar trend of associations with most biomarkers, although the magnitude of association was slightly weaker for the insulin-related biomarkers and stronger for lipids and lipid particle size.
Conclusions: Dietary patterns with high potential to contribute to insulin hypersecretion and to chronic systemic inflammation, based on higher EDIH and EDIP scores, were associated with an unfavorable profile of circulating biomarkers of glucose-insulin dysregulation, chronic systemic inflammation, endothelial dysfunction and dyslipidemia. The broad range of biomarkers further validates EDIH and EDIP as mechanisms-based dietary patterns for use in clinical and population-based studies of metabolic and inflammatory diseases.
The dietary pattern approach has been widely integrated into nutritional epidemiology as a more comprehensive approach to understanding the relationship between whole diets and disease risk and prognosis (1). Two major strategies for defining dietary patterns are the a priori or hypothesis-oriented approach and the a posteriori or empirical approach. The hypothesis-oriented approach uses prevailing evidence regarding a diet-disease relation to define a pattern or dietary guidelines, such as the Dietary Guidelines for Americans assessed using the healthy eating index. In contrast, the a posteriori strategy employs statistical approaches to group dietary variables into patterns in a purely empirical manner (2). These strategies do not account for the potential of the diet to influence biomarkers of biological processes, such as insulin response or systemic inflammation, which are important in the pathogenesis of several chronic diseases.
Systemic inflammation and hyperinsulinemia are associated with the development of several chronic diseases, including type 2 diabetes, cardiovascular disease, and cancer (3, 4). Our team previously utilized a hybrid approach to define empirical hypothesis-oriented dietary patterns that are data driven, yet based on a specific hypothesis (e.g., hyperinsulinemia, chronic systemic inflammation) relating diet with disease. Two dietary indices were developed and validated: empirical dietary index for the hyperinsulinemia (EDIH) score and the empirical dietary inflammatory pattern (EDIP) score for systemic inflammation (5). Both indices were developed by weighting how foods consumed predicted concentrations of relevant biomarkers, C-peptide as a marker of insulin resistance and β-cell secretory activity for EDIH and inflammatory markers CRP, IL-6, and TNFa-R2 for EDIP (5). Although previous studies evaluating EDIH and EDIP reported significant associations with chronic diseases, including obesity (6), type 2 diabetes (7, 8), cardiovascular disease (9), and cancers (10–17), it is unclear if these dietary patterns predict other relevant biomarkers of metabolic disease beyond the few biomarkers involved in the original development of the indices.
Inflammation and hyperinsulinemia are conceptually distinct but interrelated phenomena, particularly as both are strongly associated with obesity, and each process acts through numerous and interacting pathways. Multiple biomarkers in these pathways have been investigated in various clinical and epidemiologic studies as objective measures of inflammation and insulinemia and relationships to downstream clinical disease processes. The EDIH and EDIP scores were developed and validated using a limited set of biomarkers. If the EDIH and EDIP broadly reflect the ability of respective dietary patterns to impact insulinemia and inflammation, we hypothesize that EDIH and EDIP scores will be linked to concentrations of a broader range of mediators and biomarkers related to these pathways. In addition, given the cross talk between inflammation and hyperinsulinemia, as well as the moderate statistical correlation between the EDIH and EDIP (Spearman r = 0.5–0.7), it is important to test the extent to which each dietary index predicts biomarkers representing the construct of the other dietary index.
In the current study, our objective was to examine a large cohort within the Women's Health Initiative and define associations of EDIH and EDIP dietary patterns with concentrations of a comprehensive panel of 40 circulating biomarkers of insulin response/IGF signaling, chronic systemic inflammation, endothelial dysfunction, and dyslipidemia. In secondary analyses, we examined the association of the dietary indices with type 2 diabetes and further explored associations in subgroups of potential modifying factors.
About 161,808 postmenopausal women aged 50–79 years were enrolled in the Women's Health Initiative (WHI) in 40 clinical sites in the United States between 1993 and 1998 (18, 19). The full WHI consisted of four clinical trials (CT): dietary modification trial (DMT), calcium and Vitamin D trial, two hormone therapies—estrogen alone and estrogen plus progestin trials; and an observational study (OS). The WHI-OS was composed of 93,676 women who were not eligible or unwilling to participate in the CT (18). Trained study nurses drew blood samples and measured blood pressure, height, and weight at the baseline clinic visit.
In this cross-sectional study, we considered 61,606 women for inclusion from OS and three CT except DMT, who provided baseline blood sample data on circulating biomarkers of insulin response/IGF system, inflammation, endothelial dysfunction, and dyslipidemia. After the exclusions described in Figure 1 were applied, a total of 35,360 women were retained for final analysis. The final analytic sample and the excluded sample were comparable in major demographic and lifestyle characteristics (Supplementary Table 1). The WHI protocol was approved by the institutional review boards at the Clinical Coordinating Center at the Fred Hutchinson Cancer Research Center in Seattle, WA, and at each of the 40 clinical centers (18).
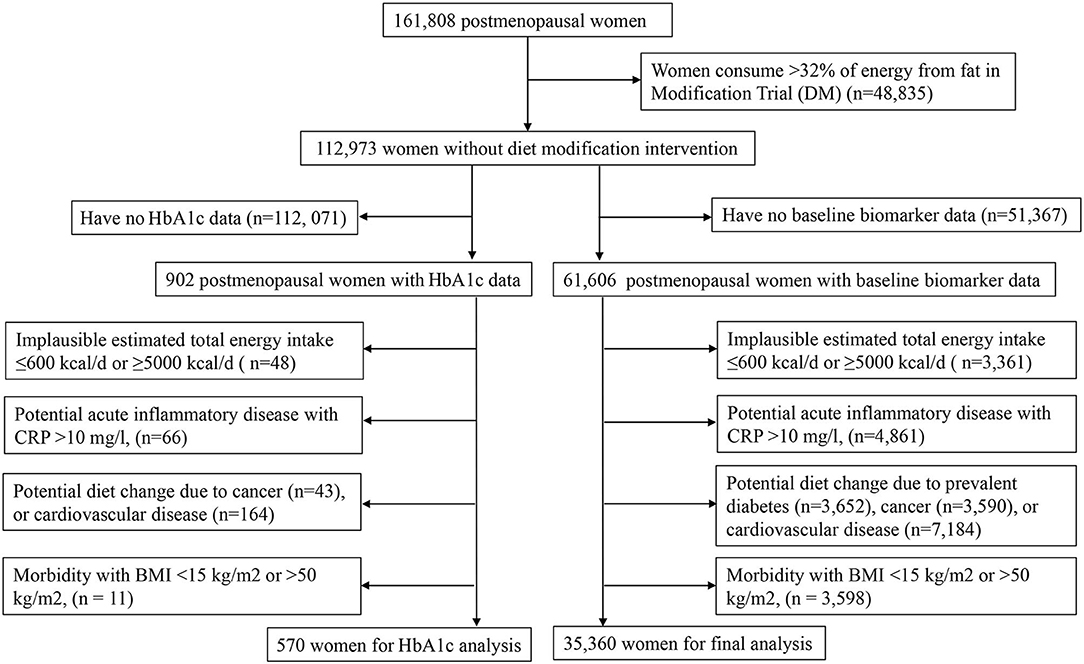
Figure 1. A flow chart for eligible participants enrolled in the Women's Health Initiative.
Baseline habitual diet was estimated from the WHI baseline semiquantitative food frequency questionnaire (FFQ) (20, 21). The WHI FFQ contained 122-line items, covering more than 300 foods and assessed dietary intake in the preceding 3-month period. The WHI FFQ was previously evaluated for validity against intakes from four 24-h dietary recall interviews and 4 days of food diaries recorded within the WHI. Intakes of 31 nutrients were found to be quite comparable across the dietary assessment instruments. Foods (servings per day) and nutrient intakes were then estimated using the Nutrition Data System for Research (NDSR) database version 2005 (22) of the University of Minnesota.
We developed and validated the EDIP and EDIH scores in the Nurses' Health Study (NHS) to empirically assess the insulinemic (EDIH) or inflammatory (EDIP) potential of dietary patterns based upon specific combinations of foods/food groups (5). Briefly, the EDIH is comprised of 18 food groups most predictive of plasma C-peptide concentrations. The food groups contributing to high EDIH scores include cream soups, butter, red meat, low-energy sugar-sweetened beverages (e.g., diet soda), high-energy sugar-sweetened beverages (e.g., regular soda), processed meat, poultry, margarine, French fries, non-dark fish, tomatoes, low-fat dairy, and eggs; whereas the food groups contributing to lower EDIH score include wine, whole fruit, coffee, full-fat dairy products and green leafy vegetables. More positive EDIH scores indicate a hyperinsulinemic dietary pattern (5). EDIP, developed in a separate study, is a weighted sum of 18 food groups most predictive of three plasma inflammatory biomarkers (IL6, CRP, and TNFαR-2). Food groups that contributed to higher EDIP scores are the following: red meat, organ meat, processed meat, non-dark fish, refined grains, other vegetables (i.e., vegetables other than green leafy vegetables and dark-yellow vegetables), low-energy sugar-sweetened beverages, high-energy sugar-sweetened beverages, and tomatoes; whereas the foods contributing to lower EDIP scores include tea, coffee, beer, wine, dark-yellow vegetables, green leafy vegetables, snacks, fruit juice, and pizza. Higher EDIP scores reflect more proinflammatory dietary patterns (5). We calculated both scores for each participant using the baseline WHI FFQ food data, and the food components comprising each food group in the WHI as listed in Supplementary Table 2.
We obtained biomarker data assessed at baseline in several case-control studies nested within the WHI (Supplementary Table 3). These included insulin-related and insulin-like growth factors (IGF) and binding proteins (BP): glucose, insulin, C-peptide, homeostasis model assessment of insulin resistance, [HOMA-IR = insulin (μIU/ml) × glucose (mmol/L)/22.5], homeostasis model assessment of beta-cell function, [HOMA-β = (20 × insulin (μIU/ml)/(glucose (mmol/L)-3.5] (23), glycated hemoglobin (HbA1c), IGF-1, free IGF-1, IGFBP-1, IGFBP-3, and IGFBP-4 (24). Inflammatory biomarkers included C-reactive protein (CRP), serum amyloid A (SAA), interleukins (IL-6, IL-10), tumor necrosis factor (TNF)-alpha, TNF-alpha receptor 1 (TNF-αR1), TNF-αR2, adiponectin and leptin (25). Endothelial dysfunction biomarkers included vascular endothelial growth factor (VEGF), endothelial leukocyte adhesion molecule, E-selectin, vascular cell adhesion molecule 1 (VCAM-1), intercellular adhesion molecule 1 (ICAM-1), granulocyte colony stimulating factor (GCSF) (25). Blood lipid biomarkers including total cholesterol (TC), triglycerides (TG), high-density lipoprotein cholesterol (HDL), low-density lipoprotein cholesterol (LDL), the ratio of TG/HDL and the ratio of TG/TC (26). Lipid particles biomarkers included large LDL particles, medium LDL particles, small LDL particles, very small LDL particles, total size of all LDL particles, intermediate density lipoprotein (IDL) particles, large HDL particles, medium HDL particles, small HDL particles, and total size of all HDL particles (26). Biomarker assessment details are described in Supplementary Table 3.
To describe characteristics of participants, all categorical variables were presented using frequencies (%), and all continuous variables were presented using means (standard deviations) across quintiles of the dietary indices (EDIH and EDIP). Biomarker data were normalized via log transformation using natural logs. We estimated the relative change (as a percent) in biomarker concentration per 1 standard deviation increase in the dietary score using multivariable linear regression analyses with the continuous dietary index score, adjusting for all the covariates listed below. In addition, we estimated the absolute concentrations of biomarkers in quintiles of EDIH and EDIP via back transformation of the log-transformed values. We also calculated the percentage difference in biomarker concentration between the highest and lowest dietary index quintiles. A false discovery rate (FDR)-adjusted p < 0.05 was considered statistically significant.
In a subsample analysis among 902 women with data on glycated hemoglobin (HbA1c) and fasting blood glucose, we examined associations of the dietary indices with prediabetes and type 2 diabetes defined based on the American Diabetes Association (ADA) criteria: prediabetes—HbA1c 5.7–6.4% or impaired fasting glucose (IFG) 100 mg/dL to 125 mg/dL; and type 2 diabetes—HbA1c ≥ 6.5% and IFG ≥ 126 mg/dL (27). We applied the same exclusion criteria as for the main analysis except the exclusion of women with prevalent diabetes at baseline and retained 570 women for the subsample analysis. We used multivariable-adjusted logistic regression to estimate odds of prediabetes, diabetes, and prediabetes and diabetes combined.
The following covariates were assessed and included in the multivariable-adjusted models: total energy intake (kcal/day, continuous); age at the WHI baseline (years, continuous); body mass index [BMI = weight (kg)/(height (m)2, continuous]; total recreational physical activity (MET-hours/week, calculated as a continuous variable by summing the metabolic equivalent tasks for all reported activities for each individual, such as walking, aerobics, jogging, tennis, swimming, biking outdoors, exercise machine, calisthenics, popular or folk dancing); pack-years of smoking (continuous); number of nutrient supplements used (continuous); fasting status at blood draw (<8 h or ≥8 h); the self-reported racial/ethnic group [American Indian or Alaska Native, Asian or Pacific Islander, Black or African-American, Hispanic/Latino, White (not of Hispanic origin), and others]; educational levels (some high school or lower educational level, high school graduate or some college or associate degree, and ≥4 years of college); regular use of medications: aspirin and other non-steroidal anti-inflammatory drugs (NSAIDs) (yes/no), unopposed estrogen and/or estrogen plus progesterone (yes/no), and statins (yes/no) (regular use was defined as ≥2 times in each of the 2 weeks preceding the interview); hormone therapy (HT) study arms (not randomized to HT, estrogen-alone intervention, estrogen-alone control, estrogen-plus-progestin intervention, estrogen-plus progestin control). Data on these covariates were collected by self-administered questionnaires on demographics, medical history, and lifestyle factors at the baseline (18, 19).
In exploratory analyses, we performed six subgroup analyses in categories of potential effect modifiers that included BMI (normal weight −18.5 to <25, overweight −25 to <30, obese −30 to 50 kg/m2); waist-to-hip ratio (high WHR > 0.85; low WHR ≤ 0.85); the race/ethnic group (non-Hispanic White, Black/African American, Hispanic/Latino); NSAIDs (regular user/non-user); unopposed estrogen (never user, past user, and current user) and statin use (regular user /non-user). Interaction was assessed using the Wald p value of the interaction term. Significant interaction and associations within the subgroup were assessed at an FDR-adjusted p < 0.10. All analyses were conducted using SAS® version 9.4 (SAS Institute, Cary, NC).
Table 1 shows the baseline characteristics of participants in quintiles of EDIH and EDIP dietary patterns. Women consuming the most hyperinsulinemic or proinflammatory dietary patterns (quintile 5 of EDIH or EDIP had higher proportions of Black or African-American and Hispanic/Latino women, lower proportion of White women, higher BMI, lower physical activity, and higher proportion with a lower level of education, compared with those in quintile 1. In terms of food intake, women in the highest quintile of EDIH and EDIP had a higher intake of red/processed meat, sugar-sweetened beverages, and lower intakes of fruit and green-leafy vegetables compared with those in the lowest quintile. The macronutrient profile of women in the highest quintile of EDIH and EDIP was characterized by higher intakes of total and saturated fat and lower total carbohydrate, coupled with lower total fiber, compared with those in the lowest quintiles.
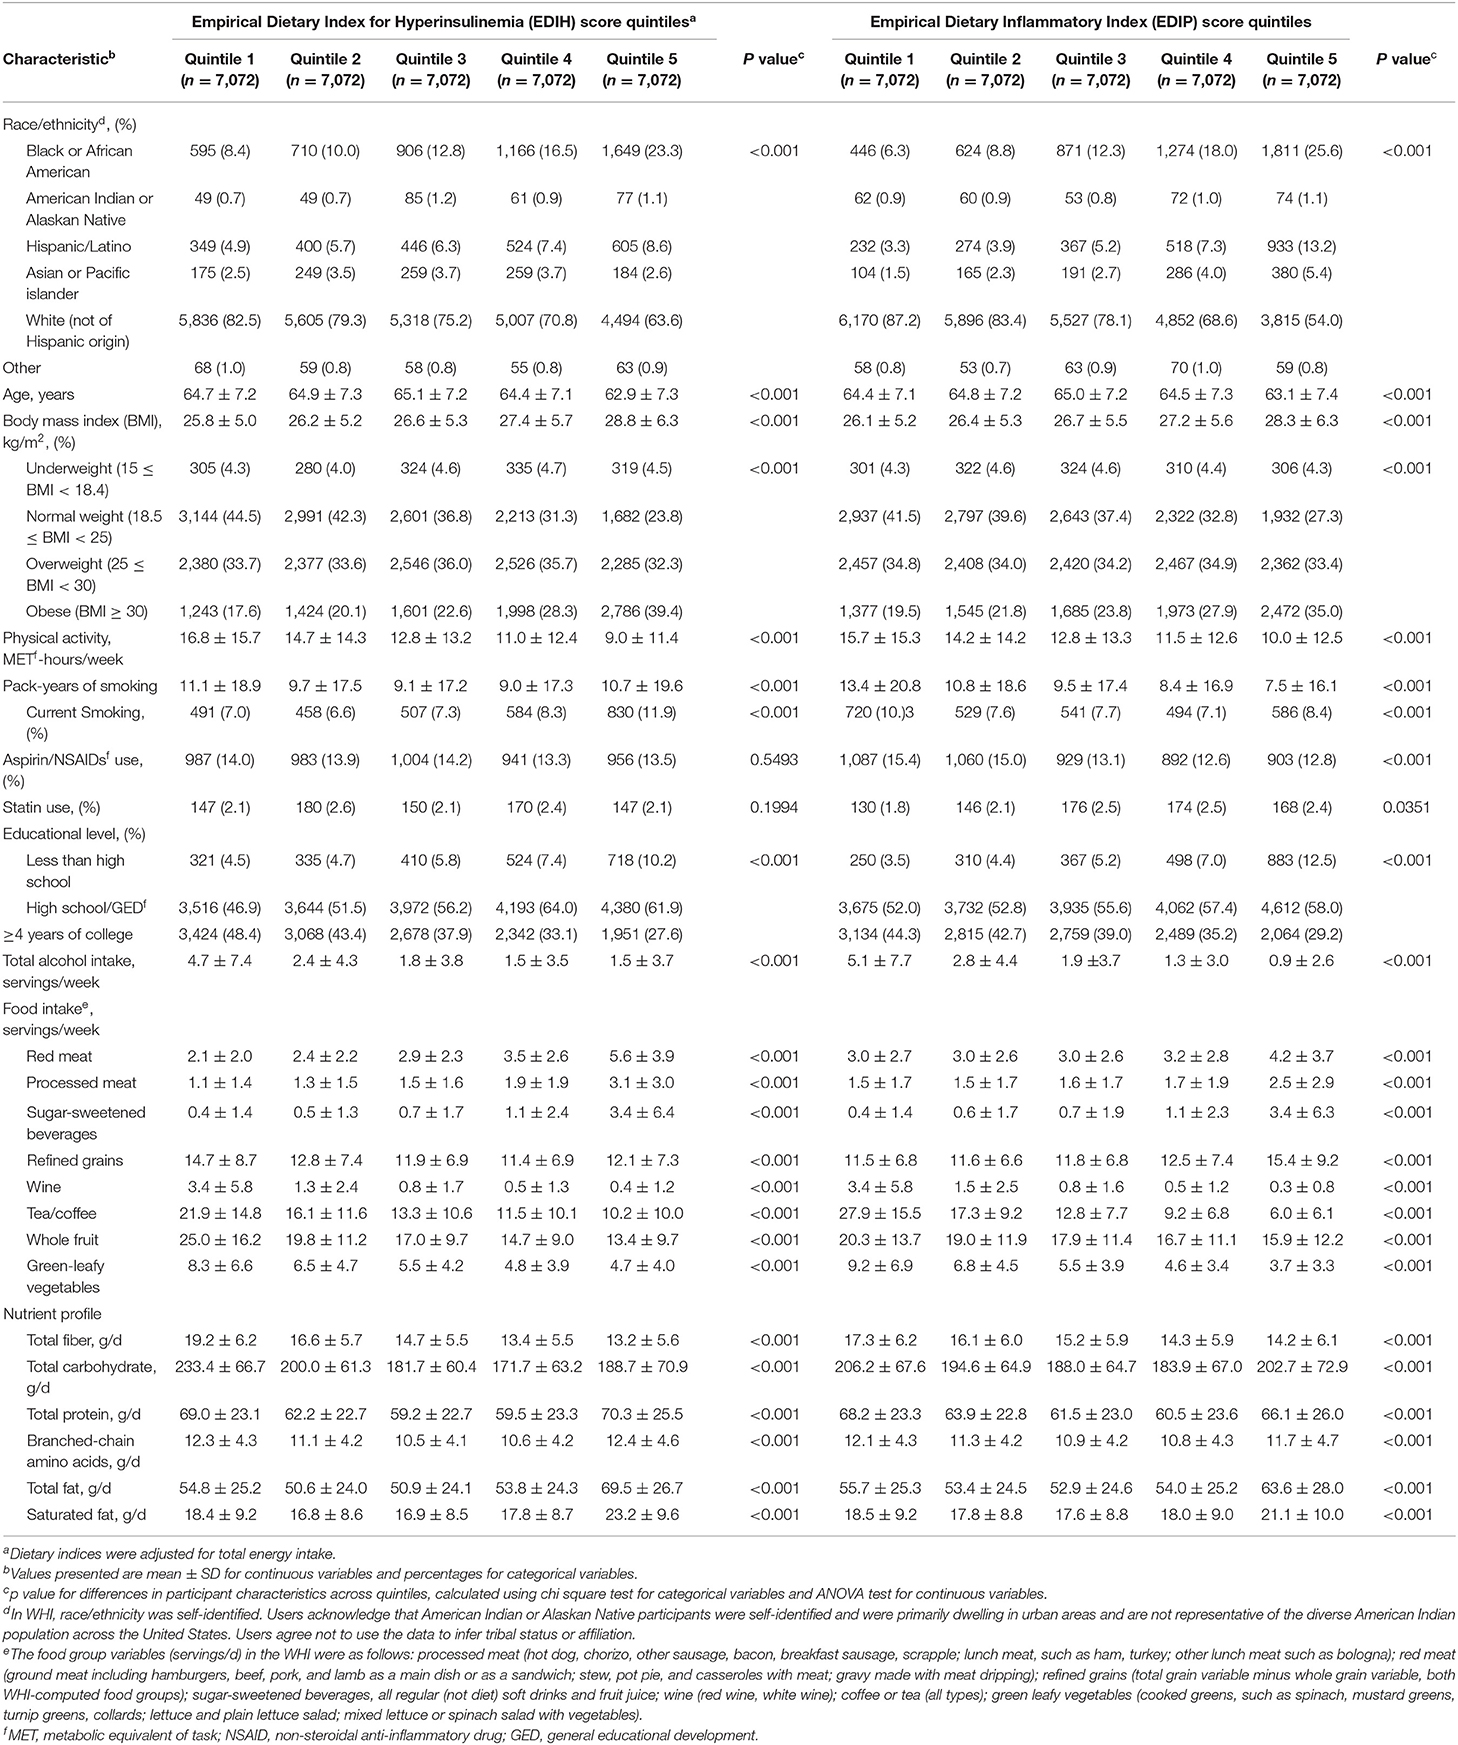
Table 1. Baseline characteristics of the study sample in quintiles of dietary indices among 35,360 postmenopausal women in Women's Health Initiative.
Intake of higher EDIH scores (representing more hyperinsulinemic dietary patterns) was associated with greater concentrations of all five insulin response markers, with the percent difference (PD) smallest for glucose (1.3%) and largest for insulin resistance (HOMA-IR, 8.%) (Figure 2A). EDIH was significantly associated with only one (IGFBP-1, −9.7%) of the five (IGF-1, free IGF-1, IGFBP-3, IGFBP-4) IGF-signaling biomarkers. Similarly, higher EDIP scores, reflecting more proinflammatory dietary patterns, were associated with greater concentration of the insulin response biomarkers, although the magnitude of associations was smaller: glucose (0.9%), HOMA-IR (6.1%), and IGFBP1 (−5.3%) (Figure 2B). The absolute concentrations of the insulin response/IGF-signaling biomarkers in each dietary index quintile and the percent difference between highest and lowest quintiles are presented in Table 2. The findings from these categorical analyses are consistent with the findings from the analyses with the continuous dietary scores.
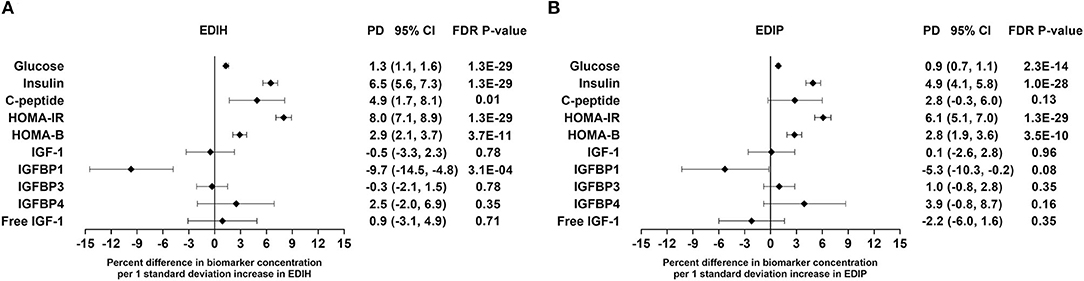
Figure 2. Percentage difference (PD—beta coefficients) (95% confidence intervals) in insulin response/IGF-signaling biomarker per 1 standard deviation increment in EDIH (A) and EDIP (B) in the Women's Health Initiative. Biomarkers were log-transformed, using natural logs. Values were obtained via multivariable-adjusted linear regression models adjusted for the following variables: total energy intake, BMI-continuous, age, total recreational physical activity, pack years of smoking; number of supplements used, fasting status at blood draw, race/ethnic groups, educational levels, regular use of NSAID, statins, unopposed estrogen and/or estrogen plus progesterone hormones, hormone therapy (HT) study arms. The sample sizes for each biomarker were as follows: glucose, 21,669; insulin, 23,756; C-peptide, 943; HOMA-IR, 19,865; HOMA-B, 19,865; insulin-like growth factor (IGF)-1, 3,126; IGF-binding protein (BP)-1, 993; IGF-BP3, 2,349; IGF-BP4, 354; free IGF-1, 2,203.
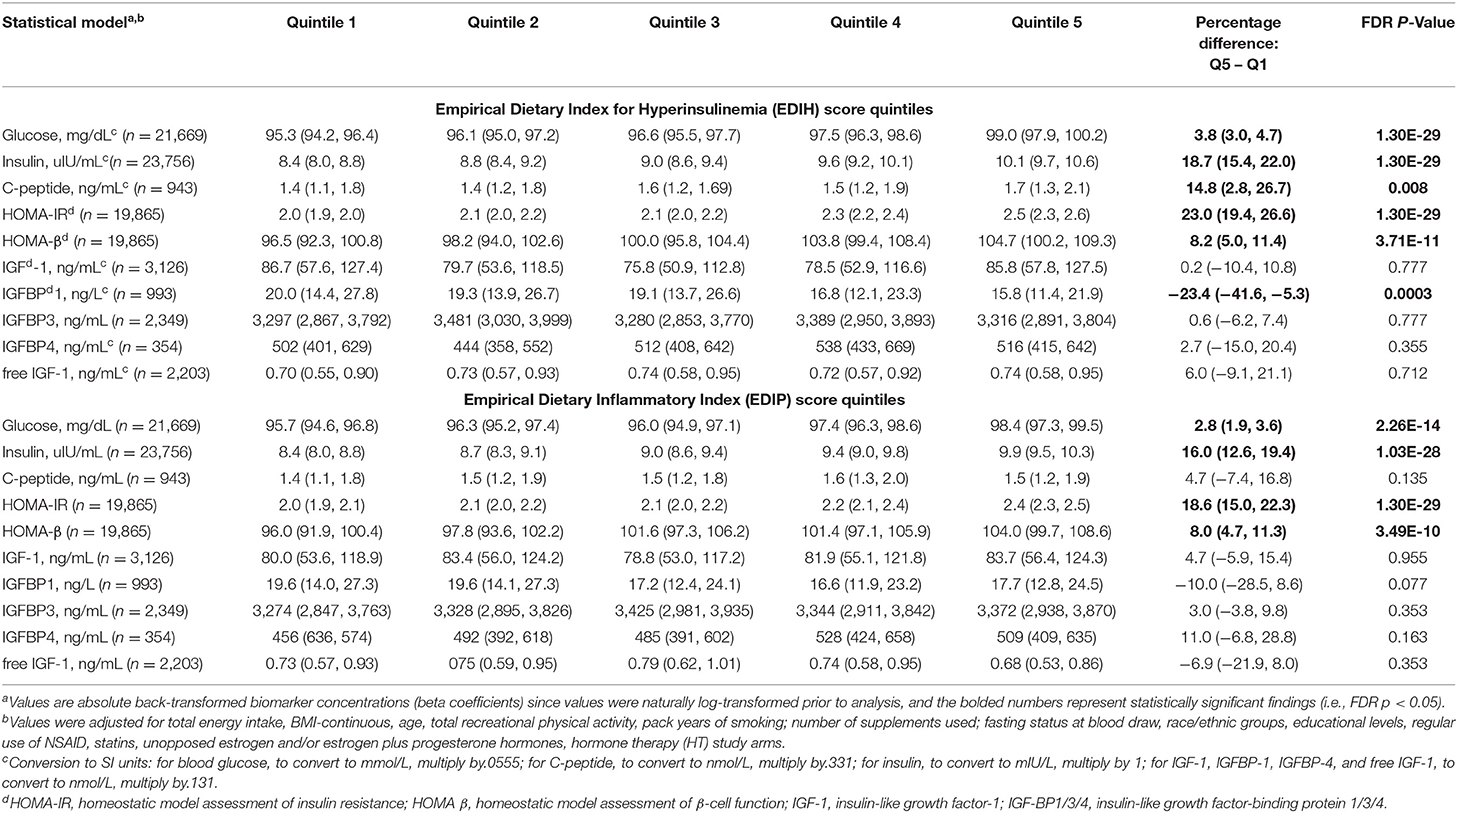
Table 2. Multivariable-adjusted absolute concentration (95% CI) of circulating biomarkers of insulin response/IGF signaling in quintiles of the dietary indices.
In this subsample analysis, characteristics of the 570 participants with HbA1c and fasting plasma glucose data were similar to the overall sample (Supplementary Table 4). For each one SD increase in the EDIH score, there were 33% higher odds of prediabetes and type 2 diabetes combined (OR, 1.33; 95% CI, 1.07, 1.66) and 47% higher odds of type 2 diabetes (OR, 1.47; 95% CI, 1.10, 1.96). Similarly, for each one SD increment in the EDIP score, there were 50% higher odds of prediabetes and type 2 diabetes combined (OR, 1.50; 95% CI, 1.15, 1.97) and 87% higher odds of type 2 diabetes (OR, 1.87; 95% CI, 1.25, 2.80). For both dietary patterns, odds of prediabetes were elevated but did not attain statistical significance (Table 3).
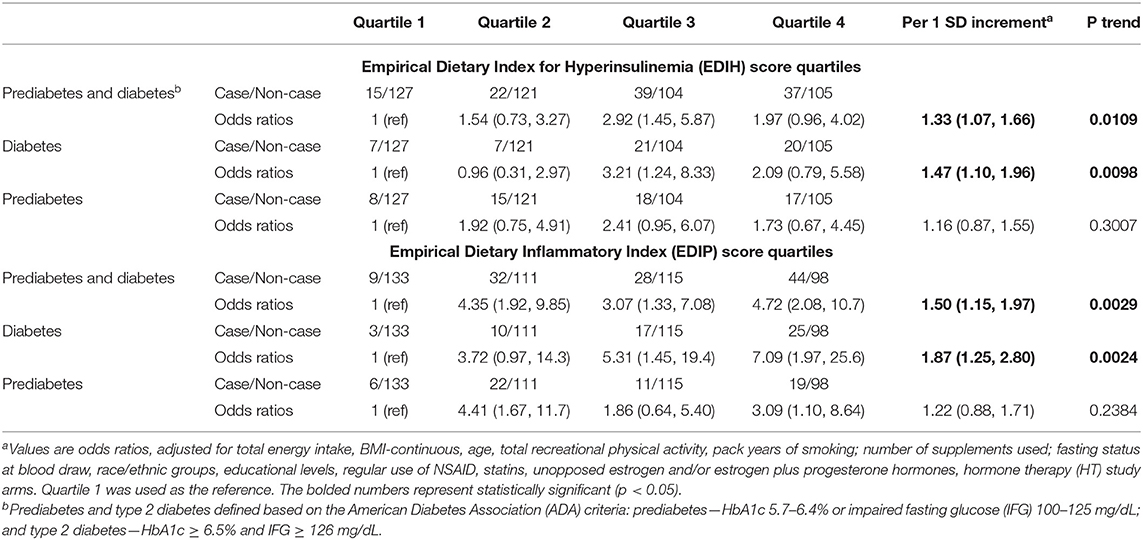
Table 3. Odds ratios (95% CI) for the associations of diet indices with diabetes.
Higher EDIH scores were associated with greater concentration of five out of the nine inflammatory biomarkers and with lower concentrations of adiponectin. For a one SD increment in the EDIH score, the percent differences in biomarker concentrations were as follows: CRP, 7.8%; IL-6, 5.8%; TNF-α, 6.9%; TNF-αR2, 1.1%; leptin, 5.6%; and adiponectin, −3.1%. EDIH was not associated with SAA and TNF-αR1 (Figure 3A). EDIP followed a similar trend with higher EDIP scores associated with greater concentrations of four out of the nine inflammatory biomarkers and with lower concentrations of adiponectin; and with percent differences as follows: CRP, 6.7%; IL-6, 4.3%; TNF-αR2, 1.8%; leptin, 3.3%; and adiponectin, −2.9% (Figure 3B). EDIH and EDIP both had an inverse trend of associations with IL-10, although not statistically significant. For the five endothelial dysfunction biomarkers, higher EDIH scores were associated with greater concentration of E-selectin (2.8%) and ICAM-1 (5.%) (Figure 3A). Higher EDIP scores were associated with greater concentration of E-selectin (3.2%), ICAM-1 (1.3%), and VCAM-1 (3.5%) (Figure 3B). Absolute concentrations of these inflammatory biomarkers in dietary score quintiles and the percent difference between highest and lowest quintiles are presented in Table 4.
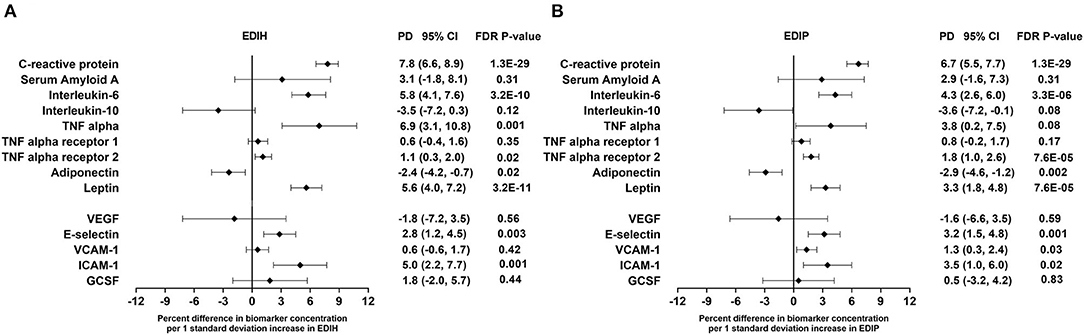
Figure 3. Percentage difference (PD—beta coefficients) (95% confidence intervals) in inflammation and endothelial dysfunction biomarkers biomarker per 1 standard deviation increment in EDIH (A) and EDIP (B) in the Women's Health Initiative. Biomarkers are log-transformed using natural logs. Values were obtained via multivariable-adjusted linear regression models adjusted for the following variables: total energy intake, BMI-continuous, age, total recreational physical activity, pack years of smoking; number of supplements used; fasting status at blood draw, race/ethnic groups, educational levels, regular use of NSAID, statins, unopposed estrogen and/or estrogen plus progesterone hormones, hormone therapy (HT) study arms. The sample size for each biomarker was as follows: C-reactive protein, 26,482; Serum Amyloid A, 1,181; Interleukin-6, 12,408; Interleukin-10, 2,466; TNF alpha, 5,302; TNF alpha receptor 13,908; TNF alpha receptor 27,746; adiponectin, 7,552; leptin, 8,045; vascular endothelial growth factor (VEGF), 873; E-selectin, 3,817; vascular cell adhesion molecule (VCAM), 14,050; intercellular adhesion molecule (ICAM), 11,075; granulocyte colony-stimulating factor (GCSF), 1,413.
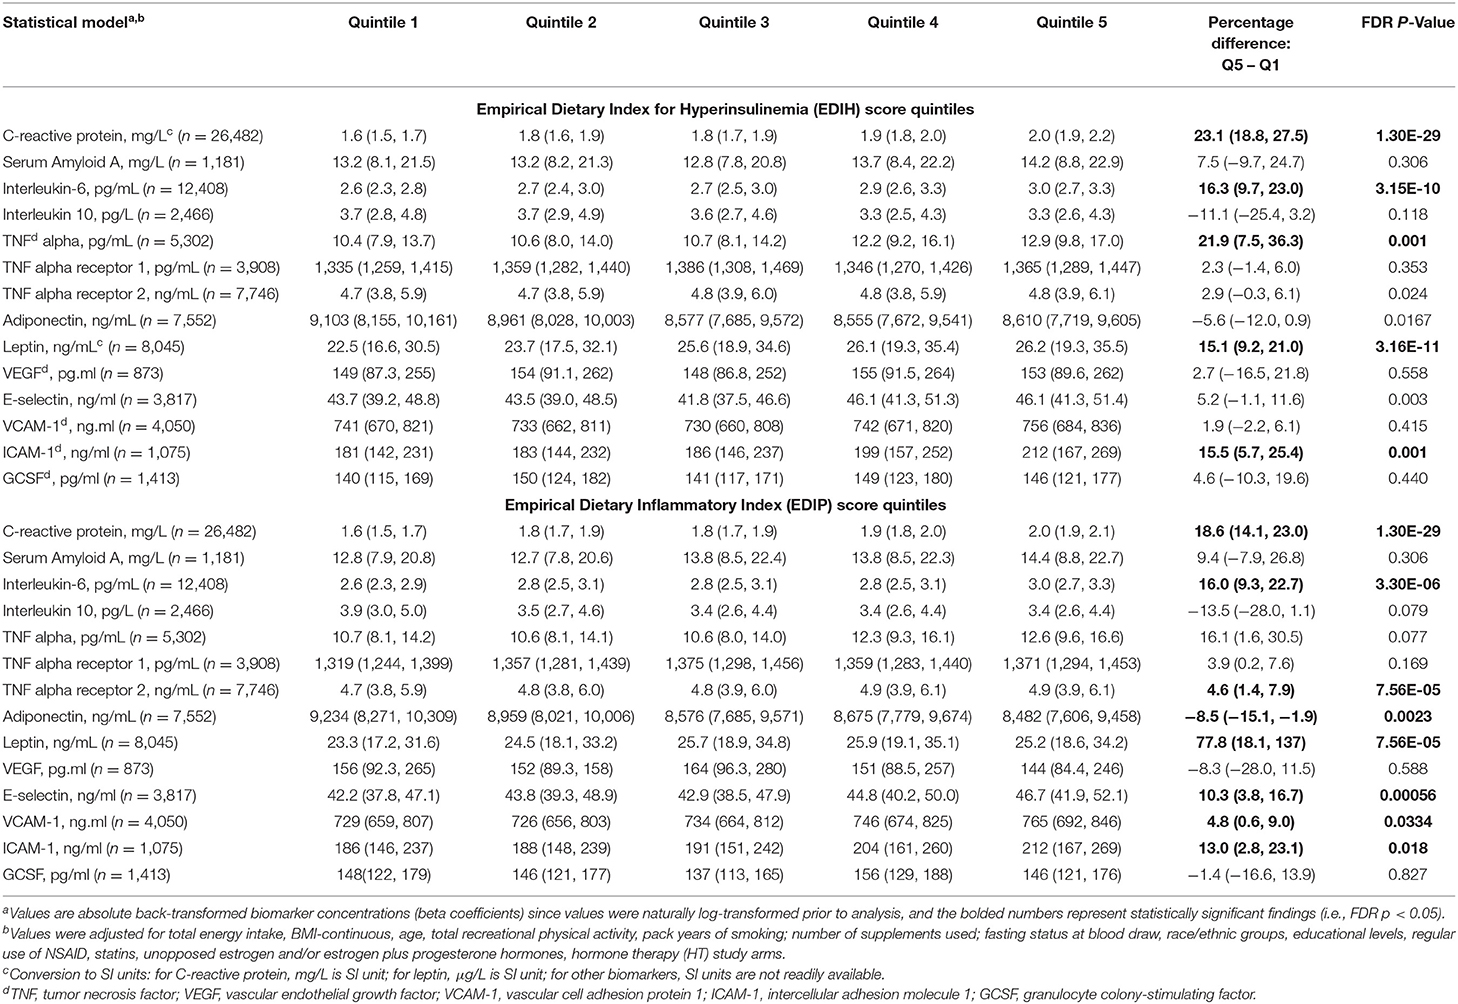
Table 4. Multivariable-adjusted absolute concentrations (95% CI) of circulating biomarkers of inflammation and endothelial dysfunction in quintiles of the dietary indices.
EDIH was significantly associated with the lipid panel as follows (for one SD increments): TC, 0.3%; TG, 2.%; HDL, −0.7%; LDL, 0.5%; TG/HDL ratio, 3.%; TG/TC ratio, 1.7%. The magnitude of associations was slightly higher for EDIP: TG, 3.2%; HDL, −1.3%; TG/HDL ratio, 4.4%; TG/TC ratio, 3.%; although there was no significant association with TC and LDL (Figure 4A). EDIH was generally not associated with lipid particles of differing sizes; however, higher EDIP was associated with higher medium LDL (3%), very small LDL (2.9%), and with lower large LDL (−3%) and total size of all LDL particles (−0.2%) (Figure 4B). Absolute concentrations of lipids and lipid particles in dietary index quintiles and the percent difference between highest and lowest quintiles are presented in Table 5.
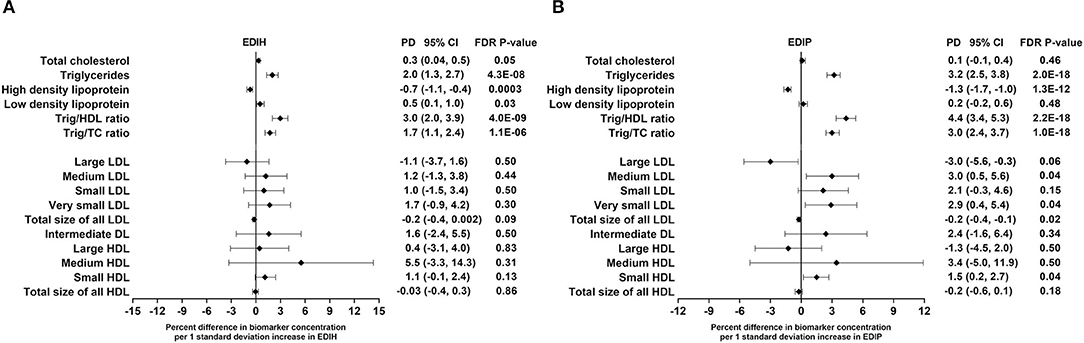
Figure 4. Percentage difference (PD—beta coefficients) (95% confidence intervals) in lipid and lipid particles biomarkers biomarker per 1 standard deviation increment in EDIH (A) and EDIP (B) in the Women's Health Initiative. Biomarkers were log transformed using natural logs. Values were obtained via multivariable-adjusted linear regression models adjusted for the following variables: total energy intake, BMI-continuous, age, total recreational physical activity, pack years of smoking; number of supplements used; fasting status at blood draw, race/ethnic groups, educational levels, regular use of NSAID, statins, unopposed estrogen and/or estrogen plus progesterone hormones, hormone therapy (HT) study arms. The sample sizes for each biomarker were as follows: total cholesterol (TG), 21,378; triglycerides (TC), 18,833; high-density lipoprotein (HDL), 20,508; low-density lipoprotein (LDL), 16,525; TG/HDL ratio, 17,761; TG/TC ratio, 18,631; large LDL, 1,653; medium LDL, 1,356; small LDL, 1,653; very small LDL, 1,356; total size of all LDL, 1,652; intermediate density lipoprotein, 1,653; large HDL, 1,653; medium HDL, 1,241; small HDL, 1,653; total size of all HDL, 1,653.
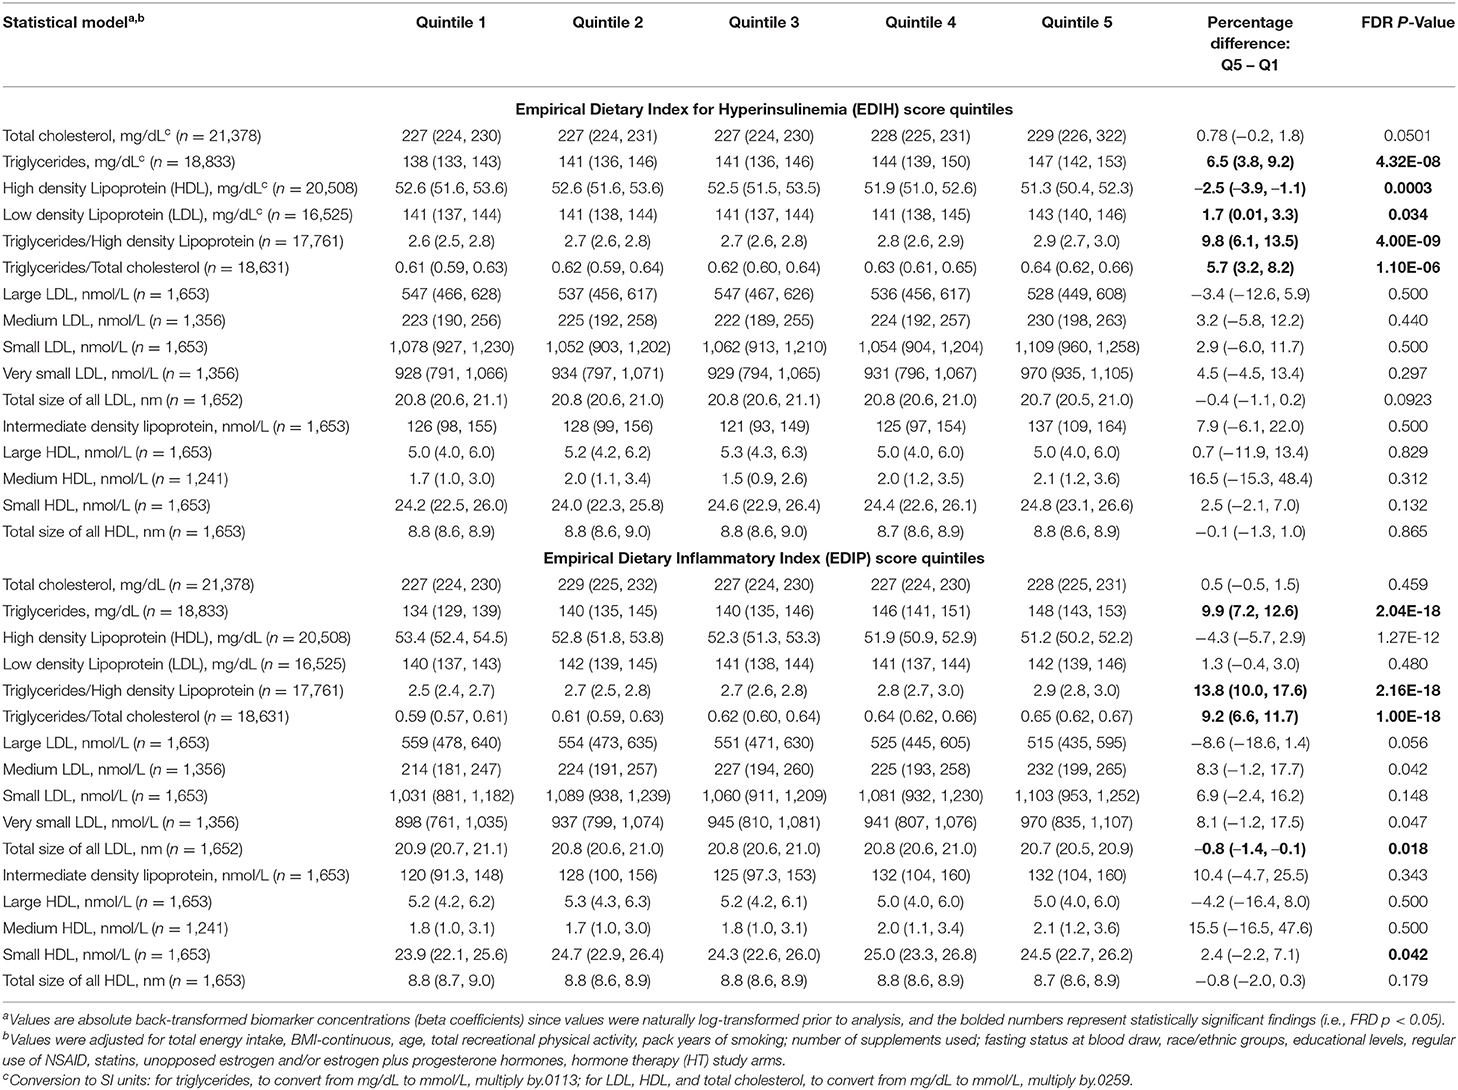
Table 5. Multivariable-adjusted percent difference (95% CI) in the relative concentrations of circulating lipid and lipid particle biomarkers in quintiles of the dietary indices.
In BMI subgroups (Figure 5A; Supplementary Table 5), there were significant interactions between BMI and EDIH for glucose, insulin, HOMA-IR, and HOMA-β, but no clinically meaningful differences in these markers between BMI categories. Generally, there were no clear patterns of associations between BMI categories. Among categories of WHR, both dietary indices showed stronger associations with IGFBP-1, IL-10 (both inverse), TNF-α, TNF-αR1, E-selectin, ICAM-1 among women with high WHR; and stronger associations with TG, HDL, TG/HDL ratio and TG/TC ratio among those with low WHR, although interactions were not always significant (Figure 5B; Supplementary Table 6). In subgroups defined by race/ethnicity, interactions were, generally, not significant, although the dietary patterns had particularly stronger associations among African-American women for some biomarkers: TNF-α, adiponectin, medium LDL, and very small LDL (Figure 6; Supplementary Table 7).
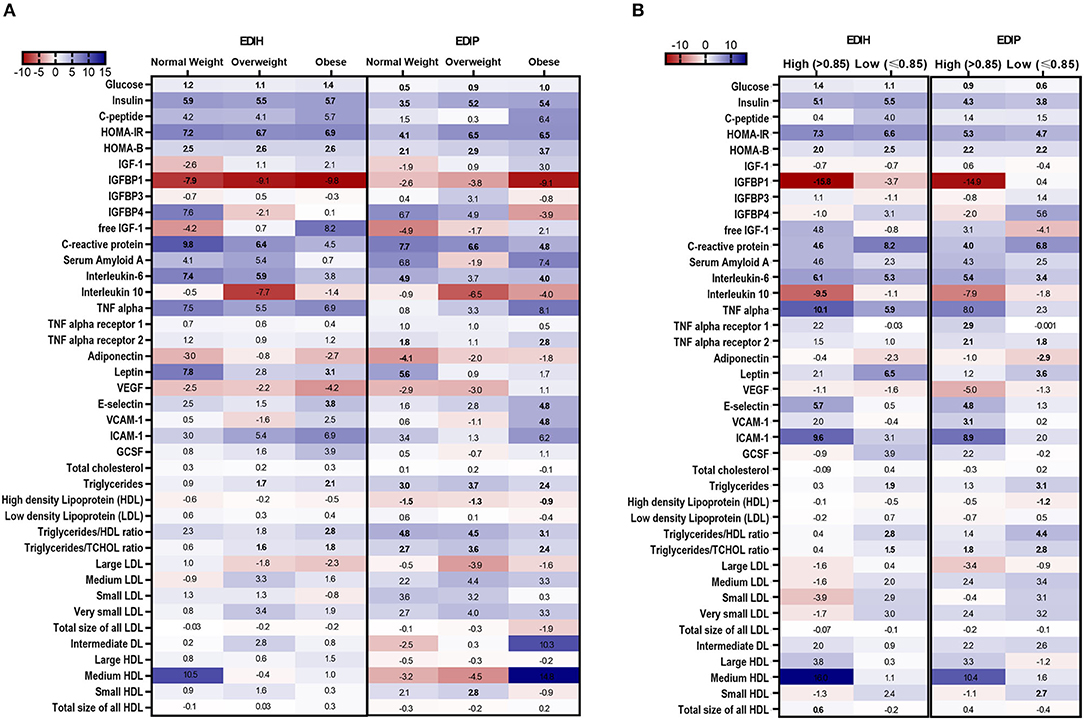
Figure 5. Heat map showing the percentage difference (PD) in biomarker concentrations for each 1 standard deviation increment in the dietary index score in subgroups of BMI and waist-to-hip ratio (WHR). (A) BMI subgroups: normal weight, 18.5–24.9; overweight, 25–29.9; obesity BMI, 30–50 kg/m2. (B) WHR subgroups: high WHR > 0.85; low WHR ≤ 0.85. Biomarker concentrations were log transformed using natural logs. Values (beta coefficients) presented were obtained via multivariable-adjusted linear regression models adjusted for the following variables: total energy intake, BMI-continuous, age, total recreational physical activity, pack years of smoking; number of supplements used; fasting status at blood draw, race/ethnic groups, educational levels, regular use of NSAID, statins, unopposed estrogen and/or estrogen plus progesterone hormones, hormone therapy (HT) study arms. The color gradient ranges from red (inverse associations) to blue (positive associations). Values in bold font were statistically significant (FDR p < 0.10).
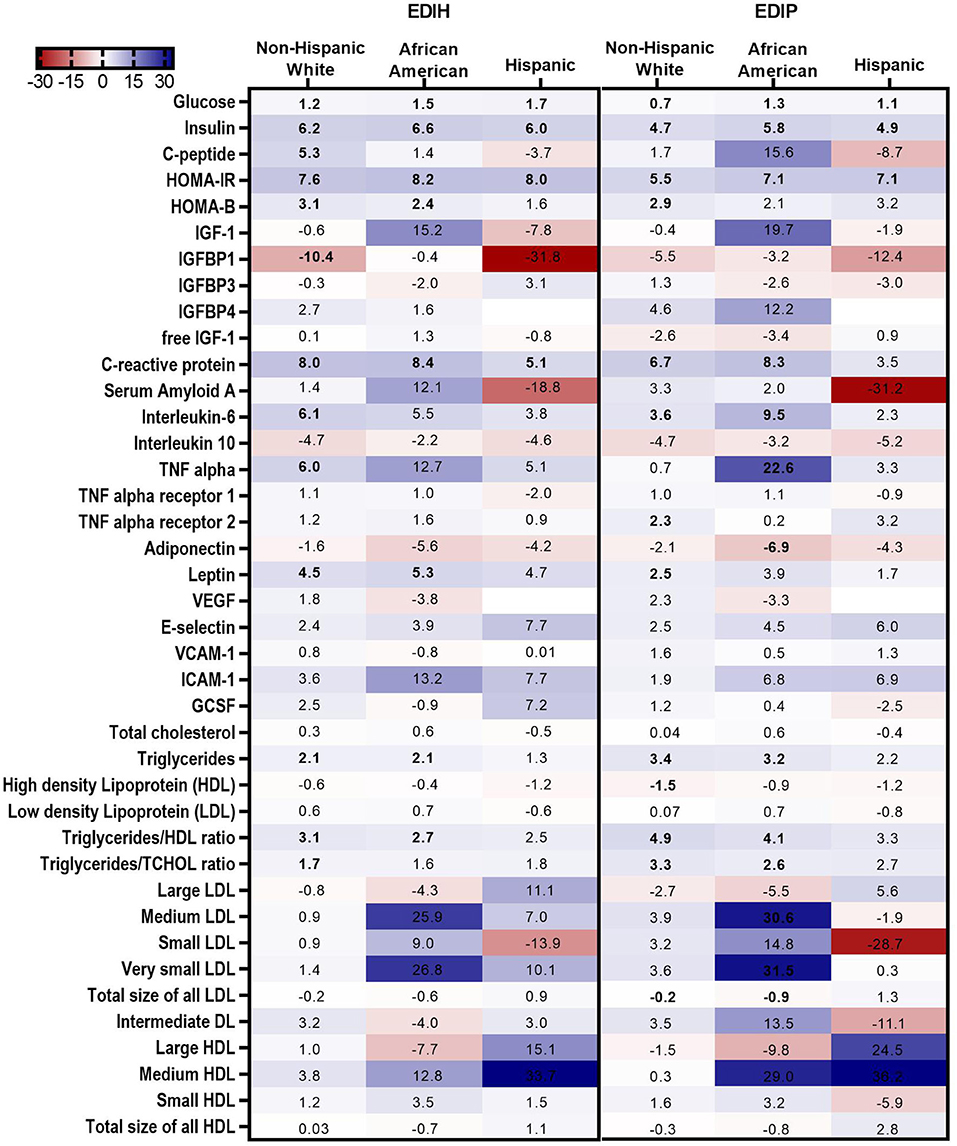
Figure 6. Heat map showing the percentage difference (PD) in biomarker concentrations for each 1 standard deviation increment in the dietary index score in race/ethnic categories. Biomarker concentrations were log transformed using natural logs. Values (beta coefficients) presented were obtained via multivariable-adjusted linear regression models adjusted for the following variables: total energy intake, BMI-continuous, age, total recreational physical activity, pack years of smoking; number of supplements used; fasting status at blood draw, educational levels, regular use of NSAID, statins, unopposed estrogen and/or estrogen plus progesterone hormones, hormone therapy (HT) study arms. The color gradient ranges from red (inverse associations) to blue (positive associations). Values in bold font were statistically significant (FDR p < 0.10). Small sample sizes in race groups, such as Asian/Pacific Islander and American Indian/Alaskan Native, could not allow for subgroup analyses.
Associations between the dietary indices and biomarkers were mainly limited to those who reported not regularly using statins: glucose, insulin, C-peptide, HOMA-IR, HOMA-β, and IGFBP1 for the insulin-related biomarkers; CRP, IL-6, adiponectin, leptin, E-selectin, and ICAM-1 for the inflammation/endothelial dysfunction biomarkers; HDL and TG/HDL ratio for lipids (Figure 7A; Supplementary Table 8). For NSAIDs subgroup analyses, the within-group significant associations for the insulin-related and inflammatory/endothelial dysfunction biomarkers were found among non-users and regular users alike (Figure 7; Supplementary Table 9). Interactions between the dietary indices and estrogen usage status were also not significant. Higher scores of both dietary indices were associated with higher levels of insulin, glucose, HOMA-IR, HOMA-β, CRP, and IL-6 in all three estrogen use categories and strongly associated with lower levels of IGFBP-1 levels mainly among never users (Figure 7C; Supplementary Table 10).
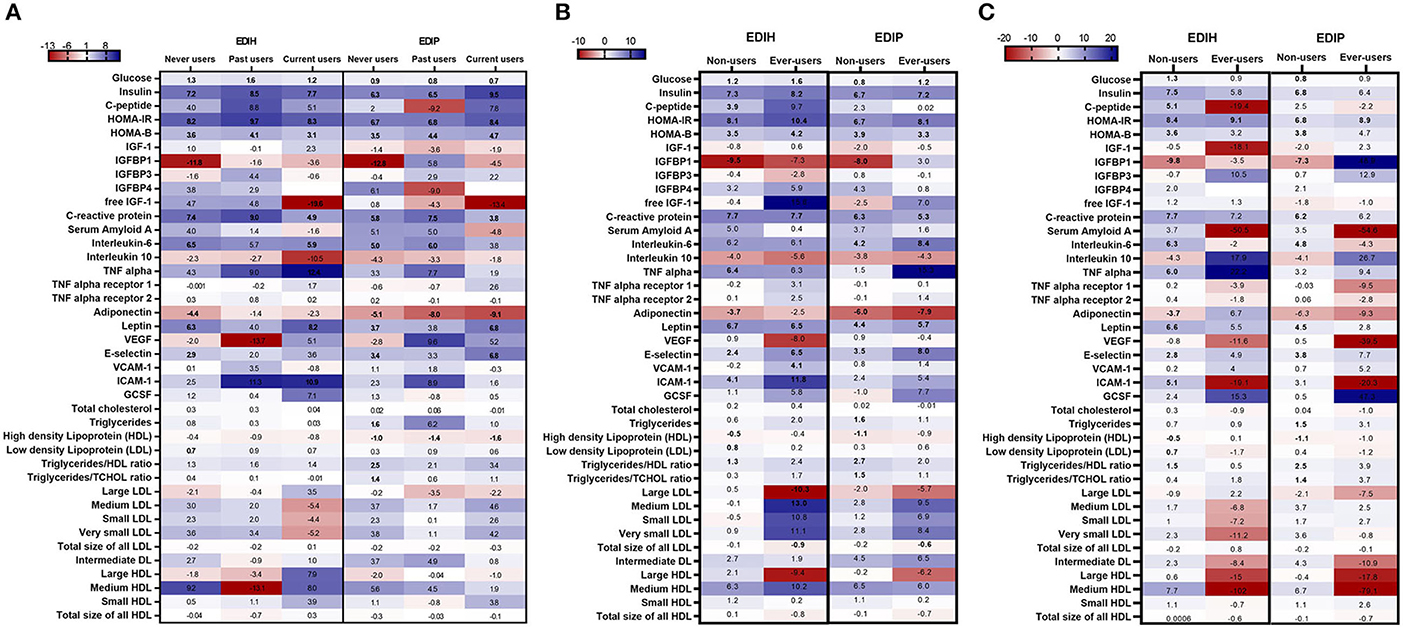
Figure 7. Heat map showing the percentage difference (PD) in biomarker concentrations for each 1 standard deviation increment in the dietary index score in subgroups defined by (A) estrogen usage status, (B) NSAIDs use and (C) statin use. Biomarker concentrations were log transformed using natural logs. Values (beta coefficients) presented were obtained via multivariable-adjusted linear regression models adjusted for the following variables: total energy intake, BMI-continuous, age, total recreational physical activity, pack years of smoking; number of supplements used; fasting status at blood draw, race/ethnic groups, educational levels, regular use of NSAID, statins, unopposed estrogen and/or estrogen plus progesterone hormones, hormone therapy (HT) study arms, except when the covariate was the potential effect modifier. The color gradient ranges from red (inverse associations) to blue (positive associations). Values in bold font were statistically significant (FDR p < 0.10).
The evolution of research on diet and chronic diseases has for decades employed a reductionist approach focusing upon specific nutrients and foods with findings informing public health recommendations for healthy eating and disease prevention. Improvements in dietary assessment tools, establishment of large cohort studies, and banking of blood samples for biomarker evaluation, coupled with advances in biostatical approaches, has created an opportunity for the evaluation of more complex patterns of food intake relative to disease risk. In this large study in the WHI, we leveraged the well-characterized dietary data and an extensive array of blood biomarker assessment to examine the interrelationships with two recently established empirical hypothesis-oriented indices of dietary patterns: the EDIH as a pattern associated with dysfunctions in glucose and insulin homeostasis and EDIP, a pattern reflecting the ability of diet to contribute to chronic systemic inflammation (5). EDIH and EDIP were significantly associated with concentrations of 25 of the 40 biomarkers examined. We also observed that EDIH was more strongly related to biomarkers of insulin response, showed about equal magnitude of associations with biomarkers of inflammation and endothelial dysfunction, and showed weaker associations with lipids, compared to EDIP. Our findings provide additional insight into mechanisms linking dietary patterns to disease outcomes while also providing insights into where EDIH and EDIP show overlapping or distinctive impacts on relevant biomarkers.
EDIH and EDIP, as empirical hypothesis-oriented dietary indices, are unique and different than other dietary indices. The underlying hypothesis is that we can more precisely elucidate dietary patterns linked to relevant biomarkers and thus to disease risk, perhaps leading to more personalized dietary recommendations for those at risk. Given that the goal was to identify the combination of foods and beverages that optimize circulating concentrations of the relevant biomarkers, the resulting food combination may not always align with prevailing knowledge from studies of single foods or nutrients or from dietary patterns designed, using other dietary pattern methods, such as the Healthy Eating Index (28). Interestingly, EDIP and EDIH both contain wine, green-leafy vegetables, and full-fat dairy as favorable components to increase in the dietary pattern and low/non-fat dairy as an unfavorable component to reduce in the dietary pattern, in complex combinations with the other foods. Increasing the intake of green-leafy vegetables in proportion to all other vegetables could achieve the goal of optimal insulin response or circulating inflammatory markers. The fat content alone in the dairy products may not be as important as the whole dairy food regarding circulating levels of these biomarkers, e.g., although cheese and butter may have similar proportions of saturated fat, cheese has been associated with a more favorable biomarker profile than butter (29, 30). However, much remains to be learned regarding specific foods that may be mechanistically involved or could themselves simply be markers for other foods within a specific dietary pattern. Although, the empirical hypothesis-oriented patterns may not mimic patterns derived by other approaches, such as HEI or the Mediterranean pattern, the EDIP and EDIH warrant further investigation, especially in clinical trials, as they are robustly associated with risk of weight gain or incidence and mortality from several major chronic diseases, including type 2 diabetes (6–8), inflammatory bowel disease (31), digestive system cancer, including colorectal cancer (10–14), multiple myeloma (15), and prostate cancer (16, 17).
Hyperinsulinemia and insulin resistance, as well as chronic low-grade inflammation, both cluster within the pathogenesis of metabolic syndrome; therefore, it may not be surprising that the EDIH and EDIP, developed separately, share many food items and are demonstrating similar impacts on multiple biomarkers. The dietary indices generally have a moderate statistical correlation (Spearman r = 0.50–0.70), and higher scores of both dietary indices are associated with higher BMI and diets rich in red or processed meat, sugar-sweetened beverages, total fat and saturated fat, and reduced wine, tea/coffee, whole fruit, green-leafy vegetables, and total fiber. Yet EDIH and EDIP maintain some unique features. A hyperinsulinemic dietary pattern appears to be more strongly driven by the relative low intake of total fiber and, perhaps, has higher intake of total and saturated fat than a proinflammatory dietary pattern. We note that this is a nutrient profile that may not appear to align with the food components in these dietary patterns, especially in relation to fats, based on the prevailing knowledge base underlying the a priori dietary pattern approach. That is, the healthy or low insulinemic or the anti-inflammatory dietary pattern includes full-fat dairy foods yet is lower overall in total and saturated fats compared to hyperinsulinemic or proinflammatory dietary patterns that are high in low/non-fat dairy.
In the WHI cohort, we observed that, although EDIH showed stronger associations, both EDIH and EDIP were linked to elevations in the glucose/insulin biomarkers but with minimal association with the IGF system biomarkers. As would be hypothesized, the EDIH compared to EDIP, is more strongly associated with greater concentrations of glucose, insulin, C-peptide, HOMA-IR, and HOMA-β, yet we do see significant associations between dysregulated glucose homeostasis with higher EDIP scores, illustrating the pathophysiologic interface of hyperinsulinemic and proinflammatory dietary patterns. Interestingly, the dietary indices were generally not associated with IGF system biomarkers (IGF-1, free IGF-1, IGFBP-3, and IGFBP-4), except for the inverse association with IGFBP-1. Although greater IGF-1 bioactivity has been linked to the risk of carcinogenesis in laboratory (32), rodent (33), and some human studies (34–36), the regulation of the IGF system is likely related to dietary patterns unique from EDIH or EDIP or related to dietary patterns acting during earlier phases of the life course, for example, during periods of rapid growth (37–39). Indeed, components of the IGF system (IGF-1, IGFBP-3, etc.) are dependent on and positively correlated with growth hormone levels in children and adolescents (40). Therefore, the IGF system may be more important in early life events and less impacted by diet and lifestyle factors in adulthood. Also, insulin and IGF-1 concentrations are regulated differently and have very specific biological functions, although there may be overlap. Insulin and IGF-1 signal through their respective cell surface receptors (IR and IGF-1R), although the downstream-signaling pathways of the two receptors share components. The IR pathway is central to glucose homeostasis, while the IGF-1R pathway is crucial in mediating tissue growth in response to growth hormone (41), which may partly explain the differential associations between the dietary patterns and the insulin response biomarkers versus the IGF system biomarkers in the current study. However, the inverse association between both EDIH and EDIP with IGFBP-1 is intriguing, as lower IGFBP-1 has been associated with risk of insulin resistance, type 2 diabetes, obesity, and cardiovascular disease in human and rodent studies (42, 43). Additional studies on IGFBP-1 as impacted by EDIH and EDIP as a link to disease processes are warranted.
Among the 14 biomarkers of inflammation and endothelial dysfunction, EDIH performed similarly to or slightly better than EDIP. Both indices were predictive of β-cell function (HOMA-β) and insulin resistance (HOMA-IR), and human studies have linked insulin resistance with inflammatory signaling. The metabolic and inflammatory changes associated with EDIH and EDIP overlap and may share master regulators (44). Large prospective studies and meta-analyses have concluded that anti-TNF therapy improved hyperglycemia or insulin sensitivity and, importantly, reduced lifetime risk of diabetes (45). One study conducted among obese individuals without diabetes reported that prolonged (6 months) TNF inhibition significantly decreased fasting glucose and increased adiponectin, probably reflecting improved insulin sensitivity (46). Also, repeated observations that the treatment of inflammatory diseases such as psoriasis, rheumatoid arthritis, and Crohn's disease with TNF antagonists improves glycemia, provides additional hints that TNF may, indeed, have an important role in metabolic diseases (45). Other studies have shown that IL-6 has metabolic effects, which are pleotropic and context dependent (47). In the current study, EDIH was more strongly associated with IL-6, TNF-α, leptin, and ICAM-1 than EDIP; however, both dietary indices were strongly associated with type 2 diabetes prevalence in the current study and with type 2 diabetes risk in recent prospective cohort studies (7, 8), although with EDIP showing stronger associations than EDIH. The reasons for the stronger association of EDIP with type 2 diabetes are not entirely clear but could be related to its stronger associations with lipids.
It has been known for decades that nutrients, particularly circulating lipids, have a role in determining insulin sensitivity (48). Since then, it has become clear from human and animal studies that lipid-induced insulin resistance and impaired glucose metabolism may also involve other mechanisms, including the activation of inflammatory pathways (49, 50). In the current study, EDIP was more strongly associated with lipids including TG/HDL—a marker of insulin resistance (51), and lipid particle size than EDIH. Although previous studies have shown TG/HDL not to be a good marker of insulin resistance among African Americans (52), both dietary patterns were associated with TG/HDL among non-Hispanic white and African-African women but not among Hispanic women. Small-dense LDL particles have been associated with higher risk of metabolic syndrome, atherosclerosis, and CVD risk than large-size LDL particles (53, 54). Although EDIH was generally not associated with lipid particle size, EDIP was positively associated with medium and very small LDL particles and inversely associated with large LDL size and total LDL particle size. Among individuals with a proinflammatory constitution, such as in obesity, EDIH, and EDIP, dietary patterns may drive a vascular immunometabolic stress response within blood vessel endothelial and smooth muscle cells to promote vascular dysfunction and disease (55). For example, in vascular atherosclerosis, a disease process representing an interface between metabolism and a local inflammatory response, the plaques formed on the arterial walls are composed of lipids (cholesterol) and other substances, and the condition begins with dysfunction of the vascular endothelium, leading to higher concentrations of circulating inflammatory and endothelial adhesion molecules such as E-selectin, ICAM-1, and VCAM-1 (56). These vascular cell adhesion molecules respond to inflammatory cytokines and initiate the pathologic process of coronary artery disease and insulin resistance by forming atherosclerotic plaque and inhibiting insulin sensitivity and other biological functions. The consistently strong associations between the EDIH and EDIP and lipids, insulin response biomarkers, inflammatory and endothelial dysfunction markers in the current study could explain recent findings showing robust associations between higher EDIP scores and higher CVD (including coronary heart disease and stroke) (9).
Limitations of our study include potential measurement error in the FFQ (57, 58), although the WHI FFQ was evaluated for measurement characteristics prior to using it (20). Although we controlled for several confounding factors, the potential for confounding by unmeasured variables or residual confounding by inadequately measured variables may not be completely removed. Although we had a multiethnic sample, it was composed of postmenopausal women; therefore, future studies are warranted to examine these associations in the broader population of men and women over a wider age range. Although the sample sizes differed between biomarkers, the distribution of the exposures of interest (dietary indices) did not vary materially by outcome (biomarker) sample size, suggesting that differing biomarker sample sizes may not have induced selection bias. We could only conduct exploratory analyses in subgroups because of smaller sample sizes. Our study has several strengths as well, including the use of novel food-based empirical hypothesis-oriented dietary patterns in a well-characterized study population and use of a comprehensive set of circulating biomarkers for the construct validation of the dietary indices.
In this large cohort of postmenopausal women in the United States, both hyperinsulinemic and proinflammatory dietary patterns, assessed using EDIH and EDIP scores, respectively, were associated with a broad range of circulating biomarkers of glucose-insulin dysregulation, chronic systemic inflammation, endothelial dysfunction, and dyslipidemia. Our findings further validate the EDIH and EDIP as dietary patterns reflective of broader chronic metabolic and inflammatory dysfunction associated with obesity and likely mediating a greater risk for type 2 diabetes, CVD, several cancers, and other disease processes. The future application of EDIH and EDIP scores in clinical and population-based studies to gain greater insight into dietary pattern and disease relationships is warranted. Most critically, the translation of low insulinemic (low-EDIH) and low inflammatory (low-EDIP) dietary patterns to future human clinical intervention trials may define strategies to reduce disease risk.
The original contributions presented in the study are included in the article/Supplementary Material, further inquiries can be directed to the corresponding author/s.
The studies involving human participants were reviewed and approved by WHI. The WHI protocol was approved by the institutional review boards at the Clinical Coordinating Center at the Fred Hutchinson Cancer Research Center in Seattle, WA, and at each of the 40 Clinical Centers. The patients/participants provided their written informed consent to participate in this study.
DA and FT designed research. NS performed statistical analyses and drafted the manuscript. DA performed statistical analyses, and DA and QJ reviewed statistical programs for accuracy. DL, HH, XZ, JM, EL, AB, CA, SC, EG, and FT analyzed and interpreted the data and provided critical intellectual input. DA, NS, and FT had full access to all the data and take responsibility for the integrity of the data and the accuracy of the data analysis and results. FT provided overall study oversight. All the authors read, edited, and approved the final manuscript.
The WHI program is funded by the National Heart, Lung, and Blood Institute, National Institutes of Health, U.S. Department of Health and Human Services through contracts HHSN268201600018C, HHSN268201600001C, HHSN268201600002C, HHSN268201600003C, and HHSN268201600004C.
The authors declare that the research was conducted in the absence of any commercial or financial relationships that could be construed as a potential conflict of interest.
All claims expressed in this article are solely those of the authors and do not necessarily represent those of their affiliated organizations, or those of the publisher, the editors and the reviewers. Any product that may be evaluated in this article, or claim that may be made by its manufacturer, is not guaranteed or endorsed by the publisher.
The Supplementary Material for this article can be found online at: https://www.frontiersin.org/articles/10.3389/fnut.2021.690428/full#supplementary-material
1. Hu FB. Dietary pattern analysis: a new direction in nutritional epidemiology. Curr Opin Lipidol. (2002) 13:3–9. doi: 10.1097/00041433-200202000-00002
2. Fransen HP, May AM, Stricker MD, Boer JM, Hennig C, Rosseel Y, et al. A posteriori dietary patterns: how many patterns to retain? J Nutr. (2014) 144:1274–82. doi: 10.3945/jn.113.188680
3. Furman D, Campisi J, Verdin E, Carrera-Bastos P, Targ S, Franceschi C, et al. Chronic inflammation in the etiology of disease across the life span. Nat Med. (2019) 25:1822–32. doi: 10.1038/s41591-019-0675-0
4. Saltiel AR, Olefsky JM. Inflammatory mechanisms linking obesity and metabolic disease. J Clin Invest. (2017) 127:1–4. doi: 10.1172/JCI92035
5. Tabung FK, Wang W, Fung TT, Hu FB, Smith-Warner SA, Chavarro JE, et al. Development and validation of empirical indices to assess the insulinaemic potential of diet and lifestyle. Br J Nutr. (2016) 116:1–12. doi: 10.1017/S0007114516003755
6. Tabung FK, Satija A, Fung TT, Clinton SK, Giovannucci EL. Long-term change in both dietary insulinemic and inflammatory potential is associated with weight gain in adult women and men. J Nutr. (2019) 149:804–15. doi: 10.1093/jn/nxy319
7. Jin Q, Shi N, Aroke D, Lee DH, Joseph JJ, Donneyong M, et al. Insulinemic and inflammatory dietary patterns show enhanced predictive potential for type 2 diabetes risk in postmenopausal women. Diabetes Care. (2021) 44:707–14. doi: 10.2337/dc20-2216
8. Lee DH, Li J, Li Y, Liu G, Wu K, Bhupathiraju S. et al. Dietary inflammatory and insulinemic potential and risk of type 2 diabetes: results from three prospective US cohort studies. Diabetes Care. (2020) 43:2675–83. doi: 10.2337/dc20-0815
9. Li J, Lee DH, Hu J, Tabung FK, Li Y, Bhupathiraju SN. et al. Dietary inflammatory potential and risk of cardiovascular disease among men and women in the US. J Am Coll Cardiol. (2020) 76:2181–93. doi: 10.1016/j.jacc.2020.09.535
10. Liu L, Nishihara R, Qian ZR, Tabung FK, Nevo D, Zhang X, et al. Association between inflammatory diet pattern and risk of colorectal carcinoma subtypes classified by immune responses to tumor. Gastroenterology. (2017) 153:1517–30.e14. doi: 10.1053/j.gastro.2017.08.045
11. Liu L, Tabung FK, Zhang X, Nowak JA, Qian ZR, Hamada T, et al. Diets that promote colon inflammation associate with risk of colorectal carcinomas that contain fusobacterium nucleatum. Clin Gastroenterol Hepatol. (2018) 16:1622–31.e3. doi: 10.1016/j.cgh.2018.04.030
12. Tabung FK, Wang W, Fung TT, Smith-Warner SA, Keum N, Wu K, et al. Association of dietary insulinemic potential and colorectal cancer risk in men and women. Am J Clin Nutr. (2018) 108:363–70. doi: 10.1093/ajcn/nqy093
13. Wang W, Fung TT, Wang M, Smith-Warner SA, Giovannucci EL, Tabung FK. Association of the insulinemic potential of diet and lifestyle with risk of digestive system cancers in men and women. JNCI Cancer Spectr. (2018) 2:pky080. doi: 10.1093/jncics/pky080
14. Tabung FK, Liu L, Wang W, Fung TT, Wu K, Smith-Warner SA, et al. Association of dietary inflammatory potential with colorectal cancer risk in men and women. JAMA Oncol. (2018) 4:366–73. doi: 10.1001/jamaoncol.2017.4844
15. Lee DH, Fung TT, Tabung FK, Colditz GA, Ghobrial IM, Rosner BA, et al. Dietary pattern and risk of multiple myeloma in two large prospective US cohort studies. JNCI Cancer Spectr. (2019) 3:pkz025. doi: 10.1093/jncics/pkz025
16. Aroke D, Folefac E, Shi N, Jin Q, Clinton SK, Tabung FK. Inflammatory and insulinemic dietary patterns: influence on circulating biomarkers and prostate cancer risk. Cancer Prev Res. (2020) 13:841–52. doi: 10.1158/1940-6207.CAPR-20-0236
17. Fu BC, Tabung FK, Pernar CH, Wang W, Gonzalez-Feliciano AG, Chowdhury-Paulino IM, et al. Insulinemic and inflammatory dietary patterns and risk of prostate cancer. Eur Urol. (2021) 9:405–12. doi: 10.1016/j.eururo.2020.12.030
18. Design of the Women's Health Initiative clinical trial and observational study. The women's health initiative study group. Control Clin Trials. (1998) 19:61–109. doi: 10.1016/s0197-2456(97)00078-0
19. Tabung FK, Liang L, Huang T, Balasubramanian R, Zhao Y, Chandler PD, et al. Identifying metabolomic profiles of inflammatory diets in postmenopausal women. Clin Nutr. (2020) 39:1478–90. doi: 10.1016/j.clnu.2019.06.010
20. Patterson RE, Kristal AR, Tinker LF, Carter RA, Bolton MP, Agurs-Collins T. Measurement characteristics of the Women's Health Initiative food frequency questionnaire. Ann Epidemiol. (1999) 9:178–87. doi: 10.1016/s1047-2797(98)00055-6
21. Margolis KL, Wei F, de Boer IH, Howard BV, Liu S, Manson JE, et al. A diet high in low-fat dairy products lowers diabetes risk in postmenopausal women. J Nutr. (2011) 141:1969–74. doi: 10.3945/jn.111.143339
22. Schakel SF, Sievert YA, Buzzard IM. Sources of data for developing and maintaining a nutrient database. J Am Diet Assoc. (1988) 88:1268–71
23. Song Y, Manson JE, Tinker L, Howard BV, Kuller LH, Nathan L, et al. Insulin sensitivity and insulin secretion determined by homeostasis model assessment and risk of diabetes in a multiethnic cohort of women: the women's health initiative observational study. Diabetes Care. (2007) 30:1747–52. doi: 10.2337/dc07-0358
24. Paxton RJ, Jung SY, Vitolins MZ, Fenton J, Paskett E, Pollak M, et al. Associations between time spent sitting and cancer-related biomarkers in postmenopausal women: an exploration of effect modifiers. Cancer Causes Control. (2014) 25:1427–37. doi: 10.1007/s10552-014-0434-y
25. Song Y, Manson JE, Tinker L, Rifai N, Cook NR, Hu FB, et al. Circulating levels of endothelial adhesion molecules and risk of diabetes in an ethnically diverse cohort of women. Diabetes. (2007) 56:1898–904. doi: 10.2337/db07-0250
26. Mackey RH, McTigue KM, Chang YF, Barinas-Mitchell E, Evans RW, Tinker LF, et al. Lipoprotein particles and size, total and high molecular weight adiponectin, and leptin in relation to incident coronary heart disease among severely obese postmenopausal women: the women's health initiative observational study. BBA Clin. (2015) 3:243–50. doi: 10.1016/j.bbacli.2015.03.005
27. American Diabetes Association. Diagnosis and classification of diabetes mellitus. Diabetes Care. (2010) 33(Suppl. 1):S62–9. doi: 10.2337/dc10-S062
28. Krebs-Smith SM, Pannucci TE, Subar AF, Kirkpatrick SI, Lerman JL, Tooze JA, et al. Update of the healthy eating index: HEI-2015. J Acad Nutr Diet. (2018) 118:1591–602. doi: 10.1016/j.jand.2018.05.021
29. Khaw KT, Sharp SJ, Finikarides L, Afzal I, Lentjes M, Luben R, et al. Randomised trial of coconut oil, olive oil or butter on blood lipids and other cardiovascular risk factors in healthy men and women. BMJ Open. (2018) 8:e020167. doi: 10.1136/bmjopen-2017-020167
30. Feeney EL, Barron R, Dible V, Hamilton Z, Power Y, Tanner L, et al. Dairy matrix effects: response to consumption of dairy fat differs when eaten within the cheese matrix-a randomized controlled trial. Am J Clin Nutr. (2018) 108:667–74. doi: 10.1093/ajcn/nqy146
31. Lo CH, Lochhead P, Khalili H, Song M, Tabung FK, Burke KE, et al. Dietary inflammatory potential and risk of Crohn's disease and ulcerative colitis. Gastroenterology. (2020) 159:873–83.e1. doi: 10.1053/j.gastro.2020.05.011
32. Sekharam M, Zhao H, Sun M, Fang Q, Zhang Q, Yuan Z, et al. Insulin-like growth factor 1 receptor enhances invasion and induces resistance to apoptosis of colon cancer cells through the Akt/Bcl-x(L) pathway. Cancer Res. (2003) 63:7708–16
33. Singh P, Guo YS, Narayan S, Chandrasekhar Y. IGF-I and IGF-I receptor in mouse colon cancer cells. In Vitro Cell Dev Biol. (1991) 27A:755–8. doi: 10.1007/BF02631237
34. Murphy N, Carreras-Torres R, Song M, Chan AT, Martin RM, Papadimitriou N, et al. Circulating levels of insulin-like growth factor 1 and insulin-like growth factor binding protein 3 associate with risk of colorectal cancer based on serologic and mendelian randomization analyses. Gastroenterology. (2020) 158:1300–12.e20. doi: 10.1053/j.gastro.2019.12.020
35. Gao Y, Katki H, Graubard B, Pollak M, Martin M, Tao Y, et al. Serum IGF1, IGF2 and IGFBP3 and risk of advanced colorectal adenoma. Int J Cancer. (2012) 131:E105–13. doi: 10.1002/ijc.26438
36. Furstenberger G, Senn HJ. Insulin-like growth factors and cancer. Lancet Oncol. (2002) 3:298–302. doi: 10.1016/s1470-2045(02)00731-3
37. Ranke MB, Schweizer R, Elmlinger MW, Weber K, Binder G, Schwarze CP, et al. Significance of basal IGF-I, IGFBP-3 and IGFBP-2 measurements in the diagnostics of short stature in children. Horm Res. (2000) 54:60–8. doi: 10.1159/000053233
38. Ranke MB. A proposal to develop new references for serum IGF-I levels in children. J Clin Res Pediatr Endocrinol. (2020) 12:140–2. doi: 10.4274/jcrpe.galenos.2020.2020.0040
39. Cianfarani S, Liguori A, Germani D. IGF-I and IGFBP-3 assessment in the management of childhood onset growth hormone deficiency. Endocr Dev. (2005) 9:66–75. doi: 10.1159/000085757
40. Blum WF, Albertsson-Wikland K, Rosberg S, Ranke MB. Serum levels of insulin-like growth factor I (IGF-I) and IGF binding protein 3 reflect spontaneous growth hormone secretion. J Clin Endocrinol Metab. (1993) 76:1610–6. doi: 10.1210/jcem.76.6.7684744
41. Belfiore A. The role of insulin receptor isoforms and hybrid insulin/IGF-I receptors in human cancer. Curr Pharm Des. (2007) 13:671–86. doi: 10.2174/138161207780249173
42. Lu J, Liu KC, Schulz N, Karampelias C, Charbord J, Hilding A, et al. IGFBP1 increases beta-cell regeneration by promoting alpha- to beta-cell transdifferentiation. EMBO J. (2016) 35:2026–44. doi: 10.15252/embj.201592903
43. Haywood NJ, Cordell PA, Tang KY, Makova N, Yuldasheva NY, Imrie H, et al. Insulin-like growth factor binding protein 1 could improve glucose regulation and insulin sensitivity through its RGD domain. Diabetes. (2017) 66:287–99. doi: 10.2337/db16-0997
44. Hotamisligil GS. Inflammation, metaflammation and immunometabolic disorders. Nature. (2017) 542:177–85. doi: 10.1038/nature21363
45. Donath MY. Targeting inflammation in the treatment of type 2 diabetes: time to start. Nat Rev Drug Discov. (2014) 13:465–76. doi: 10.1038/nrd4275
46. Yazdani-Biuki B, Stelzl H, Brezinschek HP, Hermann J, Mueller T, Krippl P, et al. Improvement of insulin sensitivity in insulin resistant subjects during prolonged treatment with the anti-TNF-alpha antibody infliximab. Eur J Clin Invest. (2004) 34:641–2. doi: 10.1111/j.1365-2362.2004.01390.x
47. Yuen DY, Dwyer RM, Matthews VB, Zhang L, Drew BG, Neill B, et al. Interleukin-6 attenuates insulin-mediated increases in endothelial cell signaling but augments skeletal muscle insulin action via differential effects on tumor necrosis factor-alpha expression. Diabetes. (2009) 58:1086–95. doi: 10.2337/db08-0775
48. Randle PJ, Garland PB, Hales CN, Newsholme EA. The glucose fatty-acid cycle. Its role in insulin sensitivity and the metabolic disturbances of diabetes mellitus. Lancet. (1963) 1:785–9. doi: 10.1016/s0140-6736(63)91500-9
49. Glass CK, Olefsky JM. Inflammation and lipid signaling in the etiology of insulin resistance. Cell Metab. (2012) 15:635–45. doi: 10.1016/j.cmet.2012.04.001
50. Nguyen MT, Satoh H, Favelyukis S, Babendure JL, Imamura T, Sbodio JI, et al. JNK and tumor necrosis factor-alpha mediate free fatty acid-induced insulin resistance in 3T3-L1 adipocytes. J Biol Chem. (2005) 280:35361–71. doi: 10.1074/jbc.M504611200
51. Zhou M, Zhu L, Cui X, Feng L, Zhao X, He S, et al. The triglyceride to high-density lipoprotein cholesterol (TG/HDL-C) ratio as a predictor of insulin resistance but not of beta cell function in a Chinese population with different glucose tolerance status. Lipids Health Dis. (2016) 15:104. doi: 10.1186/s12944-016-0270-z
52. Yu SS, Castillo DC, Courville AB, Sumner AE. The triglyceride paradox in people of African descent. Metab Syndr Relat Disord. (2012) 10:77–82. doi: 10.1089/met.2011.0108
53. Bowden RG, Wilson RL, Beaujean AA. LDL particle size and number compared with LDL cholesterol and risk categorization in end-stage renal disease patients. J Nephrol. (2011) 24:771–7. doi: 10.5301/JN.2011.6376
54. Hulthe J, Bokemark L, Wikstrand J, Fagerberg B. The metabolic syndrome, LDL particle size, and atherosclerosis: the Atherosclerosis and Insulin Resistance (AIR) study. Arterioscler Thromb Vasc Biol. (2000) 20:2140–7. doi: 10.1161/01.atv.20.9.2140
55. Ketelhuth DFJ, Lutgens E, Back M, Binder CJ, Van den Bossche J, Daniel C, et al. Immunometabolism and atherosclerosis: perspectives and clinical significance: a position paper from the working group on atherosclerosis and vascular biology of the European society of cardiology. Cardiovasc Res. (2019) 115:1385–92. doi: 10.1093/cvr/cvz166
56. Meigs JB, Hu FB, Rifai N, Manson JE. Biomarkers of endothelial dysfunction and risk of type 2 diabetes mellitus. JAMA. (2004) 291:1978–86. doi: 10.1001/jama.291.16.1978
57. Neuhouser ML, Tinker L, Shaw PA, Schoeller D, Bingham SA, Horn LV, et al. Use of recovery biomarkers to calibrate nutrient consumption self-reports in the Women's Health Initiative. Am J Epidemiol. (2008) 167:1247–59. doi: 10.1093/aje/kwn026
Keywords: hyperinsulinemic dietary pattern, proinflammatory dietary pattern, circulating biomarkers, inflammation, insulin response/IGF system, lipids
Citation: Shi N, Aroke D, Jin Q, Lee DH, Hussan H, Zhang X, Manson JE, LeBlanc ES, Barac A, Arcan C, Clinton SK, Giovannucci EL and Tabung FK (2021) Proinflammatory and Hyperinsulinemic Dietary Patterns Are Associated With Specific Profiles of Biomarkers Predictive of Chronic Inflammation, Glucose-Insulin Dysregulation, and Dyslipidemia in Postmenopausal Women. Front. Nutr. 8:690428. doi: 10.3389/fnut.2021.690428
Received: 02 April 2021; Accepted: 17 August 2021;
Published: 20 September 2021.
Edited by:
Carlo La Vecchia, University of Milan, ItalyReviewed by:
Tiziano Verri, University of Salento, ItalyCopyright © 2021 Shi, Aroke, Jin, Lee, Hussan, Zhang, Manson, LeBlanc, Barac, Arcan, Clinton, Giovannucci and Tabung. This is an open-access article distributed under the terms of the Creative Commons Attribution License (CC BY). The use, distribution or reproduction in other forums is permitted, provided the original author(s) and the copyright owner(s) are credited and that the original publication in this journal is cited, in accordance with accepted academic practice. No use, distribution or reproduction is permitted which does not comply with these terms.
*Correspondence: Fred K. Tabung, ZnJlZC50YWJ1bmdAb3N1bWMuZWR1
†These authors have contributed equally to this work and share first authorship
Disclaimer: All claims expressed in this article are solely those of the authors and do not necessarily represent those of their affiliated organizations, or those of the publisher, the editors and the reviewers. Any product that may be evaluated in this article or claim that may be made by its manufacturer is not guaranteed or endorsed by the publisher.
Research integrity at Frontiers
Learn more about the work of our research integrity team to safeguard the quality of each article we publish.