 Ivana Šarac1*
 Jovica Jovanović2
 Manja Zec1
 Zoran Pavlović3
 Jasmina Debeljak-Martačić1
 Milica Zeković1
 Jelena Milešević1
 Mirjana Gurinović1
 Maria Glibetić1
- 1Laboratory for Public Health Nutrition, Centre of Research Excellence in Nutrition and Metabolism, Institute for Medical Research, National Institute of Republic of Serbia, University of Belgrade, Belgrade, Serbia
- 2Faculty of Medicine, Department of Occupational Health, University of Niš, Niš, Serbia
- 3Department of Sanitary Chemistry and Ecotoxicology, Institute for Public Health Požarevac, Požarevac, Serbia
The status of vitamin D in underground working coal miners and its association with their cardiometabolic health is rarely studied. This study aimed to examine vitamin D (VitD) status in Serbian underground coal miners and to correlate it with anthropometric and laboratory indicators of cardiometabolic risk. Nutritional data (food frequency questionnaire, FFQ, and two times repeated 24 h recall), anthropometric data (including segmental analysis by bio-impedance analyzer TANITA BC-545N), arterial tension, and biochemical and hematological data of 103 coal miners (aged 22–63 years) were correlated with their late summer (early September) serum 25 (OH)D levels (measured by HPLC). 68.9% of the studied coal miners were overweight/obese, and 48.5% had metabolic syndrome. Their mean VitD nutritional intakes were low: 5.3 ± 3.8 μg/day (FFQ) and 4.9 ± 8 μg/day (24 h recalls), but their mean serum 25 (OH)D levels were surprisingly high (143.7 ± 41.4 nmol/L). Only 2.9% of the coal miners had 25(OH)D levels lower than 75 nmol/L (indicating an insufficient/deficient status), while 63.2% had values above 125 nmol/L (upper optimal limit), and even 10.7% had values above 200 nmol/L. There were no statistical differences in 25 (OH)D levels in the coal miners with or without metabolic syndrome (or overweight/obesity). Interestingly, 25(OH)D levels had significant positive correlations with body mass index (BMI), fat mass (FM), fat mass percentage (FM%), limbs FM%, serum triglycerides, GGT, AST, ALT, and ALT/AST ratio, and had significant negative correlations with serum HDL-cholesterol and age. All these correlations were lost after corrections for age, FM, FM%, and legs FM%. In Serbian coal miners, high levels of early September VitD levels were observed, indicating sufficient non-working-hour sun exposure during the summer period. Furthermore, the unexpected positive correlations of VitD levels with anthropometric and biochemical parameters indicative of obesity, metabolic syndrome, and fatty liver disease were found. More research is needed on the VitD status of coal miners (particularly in the winter period) and its relationship with their cardiometabolic status.
Introduction
The relationship between vitamin D (VitD) status and obesity, metabolic syndrome, diabetes, and cardiovascular diseases has gained scientific attention over the last decades. Low serum vitamin D levels have been associated with obesity, metabolic syndrome, and increased risk for diabetes and cardiovascular diseases (1–4). However, inconsistent findings exist, and cause/effect relationships still need to be confirmed (1–5).
On the other hand, in parallel with the increasing worldwide prevalence of obesity, metabolic syndrome, diabetes, and cardiovascular diseases (6–8), with the latter two being among the first four leading causes of death across the world, there is an increasing prevalence of VitD insufficiency/deficiency (9, 10). Some populations are at increased risk for low VitD levels (10–12). The modern lifestyle in big cities, with high buildings, air pollution, and low insolation of streets; everyday commuting by closed vehicles and predominantly indoor work and leisure activities (without enough outdoor activities and direct exposure to the sun), leads to an increased prevalence of VitD insufficiency/deficiency among populations (10, 13) where it was not expected to appear (e.g., in regions with low latitude and high insolation) (14, 15). Some professions and working conditions are more associated with low VitD levels. For example, shift work, night work, and working indoors, without direct sun exposure, are associated with lower VitD serum levels (16, 17). All of those are characteristics of underground mining work. Nevertheless, insufficient data exist on the serum levels of VitD in this population of workers (17–21), and the data do not show the lower levels compared with the general population or surface workers from the same geographic region (17–21). Therefore, more data are needed on this topic. Furthermore, there are insufficient data on the cardiometabolic status of coal miners, with only few recently published studies (22–26).
Given that, this study aimed to examine the following: (1) the levels of serum VitD among a sample of underground working coal miners in Serbia; (2) the anthropometric and biochemical indicators of cardiometabolic risk among them; (3) the association of VitD levels with indicators of cardiometabolic risk.
Materials and Methods
Participants and Study Design
This cross-sectional study included 103 male coal miners, aged 22–63 years, from the underground Brown Coal Mine “Rembas” (shaft “Vodna,” Strmosten), in the Resavica coal mining basin in Serbia, who during the period May 9, 2016, to September 9, 2016, (late summer) underwent their periodic (annual) preventive systematic medical examinations, obliged by the law and performed by the Institute of Occupational Medicine Niš. The study was a joint project of the Institute of Medical Research of the University of Belgrade and the Institute of Occupational Medicine Nis and supported by the Ministry of Education, Science and Technological Development of the Republic of Serbia. The study was in accordance with the ethical principles of the Declaration of Helsinki and approved by the Institute of Occupational Health Niš Ethics Board.
According to official data (27), in 2016, in Serbia, there were 2,750 underground coal miners, working in shafts, and the vast majority of them were employed in the Resavica basin (76.4%). The required study sample size was 45 subjects, which was calculated according to the previously published data on summer Serbian general male population VitD levels (28) and the decided precision (margin of error) of ± 5 nmol/L at 95% confidence level, and the formula: needed sample size = (1.96)2 * (SD)2/(decided precision)2 (29). Considering possible unfitness, dropout, and planned further correlation analyses, we decided to initially include (i.e., invite to participate in the study) all 140 employed miners in this coal mine who attended their preventive systematic medical examinations, which would represent about 5% of Serbian coal miners.
On the day of the examination, the coal miners attended the center for preventive medical checkups at 07:00, after fasting overnight for 12 h. Detailed examinations to obtain information on their health were performed by medical specialists (including specialists of occupational health and internal medicine), and incorporated, inter alia, blood pressure measurements and fasting blood, and urine sampling for laboratory biochemical analyses. Supplementary analyses for this study involved the following: (1) anthropometric measures (including, among others segmental body composition analysis by bioelectrical impedance, BIA); (2) dietary surveys [such as the two times repeated 24 h recall and FFQ, which was validated for VitD intake (30)], (3) and further analyses of the obtained biochemical serum samples to determine VitD status by high-performance liquid chromatography (HPLC).
From the 140 coal miners who attended the medical preventive checkups and were invited to participate in the study, a total of 103 agreed to participate in the study, signed written consent, and performed all the tests and analyses required for this study (i.e., the participants who did not manage to perform all of the required examinations, presented here, or fulfilled the exclusion criteria, were excluded from the study). The exclusion criteria were the following: the presence of serious medical conditions; established diagnosis of diabetes mellitus with regular use of glucose-lowering therapy; established diagnosis of hyperlipidemia with regular use of lipid lower drugs; a known liver disease with non-metabolic etiology, excluding non-alcoholic fatty liver disease (NAFLD); taking any antihypertensive and glucose/lipid-lowering agents in the previous 24 h).
All the underground miners worked in three rotating shifts (2 days in first shift: 07:00–15:00; 2 days in second shift: 15:00–23:00; 2 days in third shift: 23:00–07:00; then, 2 days off) and always stayed underground, in the shaft during their shifts. They all performed heavy physical work (31), such as hewing coal, loading coal, and erecting roof supports.
Anthropometric Measurements and Measurement of Arterial Tension
Measurements of body height, body weight, fat mass (FM), fat mass percentage (FM%), fat-free mass (FFM), muscle mass, bone mass, waist circumference, and hip circumference were taken by a trained medical doctor, following standard techniques (32, 33). The subjects were measured fasted at 8 am, after emptying their bladder and bowels, wearing only underwear. Body height was measured to the nearest 0.01 m with a wall-mounted stadiometer. Bodyweight, FM, FM%, FFM, muscle mass, and bone mass were measured on a portable scale Tanita Inner Scan V BC-545N Segmental Body Composition Monitor (Tanita, Aerolit d.o.o., Belgrade, Serbia), by BIA. The body weight was measured to the nearest 0.1 kg. The measurements were performed according to the recommendations provided by the manufacturer. Additional segmental analyses included muscle mass of trunk, arms, and legs; fat percentage of the trunk, arms, and legs; and visceral fat level (VFL), calculated according to the Tanita algorithm by the BIA segmental body analysis (34, 35). Body mass index (BMI: kg/m2) was calculated by dividing the weight (in kilograms) by the square of height (in meters), and according to their BMI, the coal miners were classified into three groups: normal weight (BMI: 18.5–24.9 kg/m2), overweight (BMI: 25–29.9 kg/m2), and obese (BMI 30 kg/m2) (36). Increased adiposity was defined according to %FM ≥ 21–22 (depending on age) (37). Waist and hip circumferences were measured with a flexible, stretch-resistant tape, to the nearest centimeter. Waist circumference was measured at the approximate midpoint between the lower margin of the last palpable rib and the top of the iliac crest, at minimum respiration. Hip circumference was measured at the widest points over the hip at the level of the greater trochanter, with the tape parallel to the floor (33). Abdominal obesity was defined by waist circumference ≥ 102 cm (33). Supplementary calculations included waist to hip ratio (WHR), and WHR ≥0.91 was considered as indicative of centripetal obesity, i.e., truncal fat distribution (33).
Arterial blood pressures were measured in the morning, after sitting for at least 10 min, on the left upper arm, with a calibrated mechanic sphygmomanometer and stethoscope (Becton Dickinson, Franklin Lakes, NJ, United States), and the average of two measurements was presented as the result. Hypertension was defined by systolic blood pressure ≥ 140 mmHg and/or diastolic blood pressure ≥ 90 mmHg, while pre-hypertension was defined by systolic blood pressure between 130 and 140 mmHg and/or diastolic blood pressure between 85 and 90 mmHg (38).
Laboratory Biochemical Analyses of Blood Samples
Fasting blood samples were collected between 07:00 and 08:00 in specific Vacutest Kima® blood collection tubes, available from Vacutest Kima® S.R.L., Italy (Yunycom d.o.o., Belgrade, Serbia), including the following: Vacutest® Kimased sodium citrate 3.8% 1.6 ml tubes (for erythrocyte sedimentation rate, tubes, erythrocyte sedimentation rate (ESR), analysis), Vacutest® K3EDTA 3 ml tubes (for blood cell count, hematocrit, and hemoglobin analysis), Vacutest® Serum Separator Clot Activator 6 ml tubes for analysis of serum glucose, total cholesterol, high-density lipoproteins (HDL)-cholesterol and low-density lipoproteins (LDL)-cholesterol, triglycerides, urea, creatinine, total bilirubin, aspartate aminotransferase (AST), alanine aminotransferase (ALT), alkaline phosphatase (ALP), gamma-glutamyl transferase (GGT), and VitD.
Following the instructions of the manufacturer for processing and handling of the blood collection tubes, ESR analyses were performed with the Westergren's method at 18°C, using the Kimased ESR rack with scaling. One-hour Westergren values were determined by reading the distance (in mm) from the plasma meniscus to the top of the column of sedimented erythrocytes 30 min, immediately (maximum 1 h) after blood collection. Analyses of blood cell counts, hematocrit, and hemoglobin were performed on Phoenix NCCNCC-2310 (NeoMedica d.o.o., Nis, Serbia), and the serum coagulation tubes (after allowing them to clot for at least 30 min in an upright position at room temperature) were centrifuged at 3,000 × g for 10 min at room temperature. Following centrifugation, standard photometric assays were performed using an ARCHITECT c8000 Abbott clinical chemistry analyzer (Abbott Laboratories S.A., Belgrade, Serbia), and commercially available kits (Abbott Laboratories S.A., Belgrade, Serbia). Intra- and inter-assay coefficients of variation (CVs) for all measurements were <5%.
The criteria for the existence of diabetes and impaired fasting glucose were set according to the American Diabetes Association (ADA) 2016 guidelines (39). The existence of dyslipidemia was established based on the National Cholesterol Education Program—Adult Treatment Panel III (NCEP-ATP III) criteria from 2001 (40). The atherogenic risk was also calculated as the ratio of total cholesterol/HDL-cholesterol, the ratio of LDL-cholesterol/HDL-cholesterol, and the ratio of triglycerides/HDL-cholesterol, as all of these ratios have clinical implications (41, 42). Metabolic syndrome was defined according to the American Heart Association/National Heart, Lung, and Blood Institute (AHA/NHLBI) 2005 criteria (43).
Serum VitD Analysis by HPLC Method
Serum total 25 (OH) vitamin D, calculated as a sum of 25 (OH) vitamin D2 and 25 (OH) vitamin D3, was determined using an Agilent 1100 series HPLC system equipped with a diode array detector (DAD) and the RECIPE's (RECIPE Chemicals + Instruments GmbH, Munich, Germany) ClinRep® HPLC Complete Kit for 25 (OH) VitD2/D3 in plasma and serum (containing a ClinTest® Test Solution, ClinCal® Serum Calibrators, ClinChek® Serum Controls, sample preparation vials, the precipitation agent, internal standard, mobile phase, and analytical column), according to the instructions of the manufacturer.
Immediately after the analyses with the ARCHITECT c8000 clinical chemistry analyzer were performed, 1.5 ml of serum was separated from the serum coagulation tubes in 2 ml Eppendorf microtubes and kept frozen at −80°C in a freezer until further VitD assays were performed.
After 24 months of storage at −80°C (which should not influence the results, since vitamin D is quite stable during prolonged storage at −80°C, up to 6–30 years) (44, 45), serum samples were defrosted and vortex-mixed and 0.4 ml of the samples were transferred to the sample preparation vials, filled with 0.5 ml of the precipitation agent. Afterward, 0.4 ml of internal standard was added (cooled at temperature −20°C), and the vials were vortex-mixed for 30 s and centrifuged for 5 min at 10,000 × g. After centrifugation, 50 μl of the upper liquid phase of the supernatant was injected into the Aligent 1100 HPLC system, with a flow rate of 1 ml/min, and the column heater at 40°C. The sample components were separated on the analytical column, and the analytes, 25 (OH) VitD2 and 25 (OH) VitD3, were detected with the DAD detector at a wavelength of 264 nm, with retention times of 7.3 and 6.4 min, respectively. Quantification was performed comparing the peak areas of 25 (OH) VitD2 and 25 (OH) VitD3 with the peak area of the internal standard (its retention time was 8.3 min). In addition, the ClinChek® Serum Controls were used after running every 10 examined samples to perform quality control. The precision of measurement (expressed as CVs) for 25 (OH) VitD2 and 25 (OH) VitD3 was 6.5 and 6%, respectively.
Taking into consideration different cutoff values for defining VitD deficiency/insufficiency (9, 10, 46–48), the serum levels of 25 (OH) VitD below 50 nmol/L were defined as a deficient state, while those between 50 and 75 nmol/L were defined as an insufficient state (9). Deficiency below 50 nmol/L was defined as mild to moderate and below 30 nmol/L was defined as severe (10). The values above 175 nmol/L were defined as mildly increased, above 200 nmol/L was defined as moderately increased (the lowest literature-reported level associated with toxicity in subjects with normal renal function and without primary hyperparathyroidism), and above 250 nmol/L was defined as excessive (hypervitaminosis) (46). The values between 75 and 175 nmol/L were defined as VitD sufficiency (“normal range”), while the values between 75 and 125 nmol/L were defined as “optimal.” (46, 49).
Assessment of Dietary Intakes
Dietary intake data were collected by a trained medical doctor using a validated food frequency questionnaire (FFQ) (30) and the two times repeated 24 h recall method, in accordance with the European Food Safety Authority (EFSA) EU Menu methodology (32, 50). The FFQ and the first 24 h recall were performed on the day of physical examination and blood sampling, while the second 24 h recall was performed with a minimum of 7 days apart, by a telephone call. The average intakes of energy, macronutrients, and VitD were calculated with the DIET ASSESS & PLAN (DAP) software (51, 52), which was evaluated by the EFSA (32, 50) using the national validated Food Atlas for Portion Size Estimation (53) and Serbian Food Composition Database, developed in compliance with EuroFIR standards (54). Calculated data for VitD intakes were evaluated by comparison with the adequate intake (AI) defined by the EFSA in 2016 (i.e., minimum 15 μg/day for adults) (48).
Statistical Analysis
Statistical analyses were performed using the SPSS 22.0 (SPSS Inc., Chicago, IL, United States) statistical software. Data are presented as the mean ± SD, along with minimum and maximum values. The normality of data distribution was tested by the Kolmogorov–Smirnov test. Differences in VitD levels between subjects with and without overweight/obesity or metabolic syndrome were analyzed by the Mann–Whitney U-test. Correlation between VitD levels and biochemical data, anthropometric measurements, daily energy, and macronutrient/micronutrient nutrient intake was assessed by Pearson's correlation coefficient (for parametric data) and Spearman's correlation coefficient (for non-parametric data). Partial correlations were used when one or more controlling variables were included in the analyses. Linear stepwise regression models were made to explore the strength and independence of associations between VitD levels and characteristics of analyzed subjects. P-value was expressed as a number rounded up to three decimal places; statistical significance was assumed at a two-tailed P < 0.05.
Results
Descriptive Statistics: Characteristics of the Studied Population of Coal Miners
Table 1 presents general, anthropometric, and blood pressure data, Table 2 presents the data on biochemical analyses, and Table 3 gives the data on dietary intakes of energy, macronutrients, and VitD.
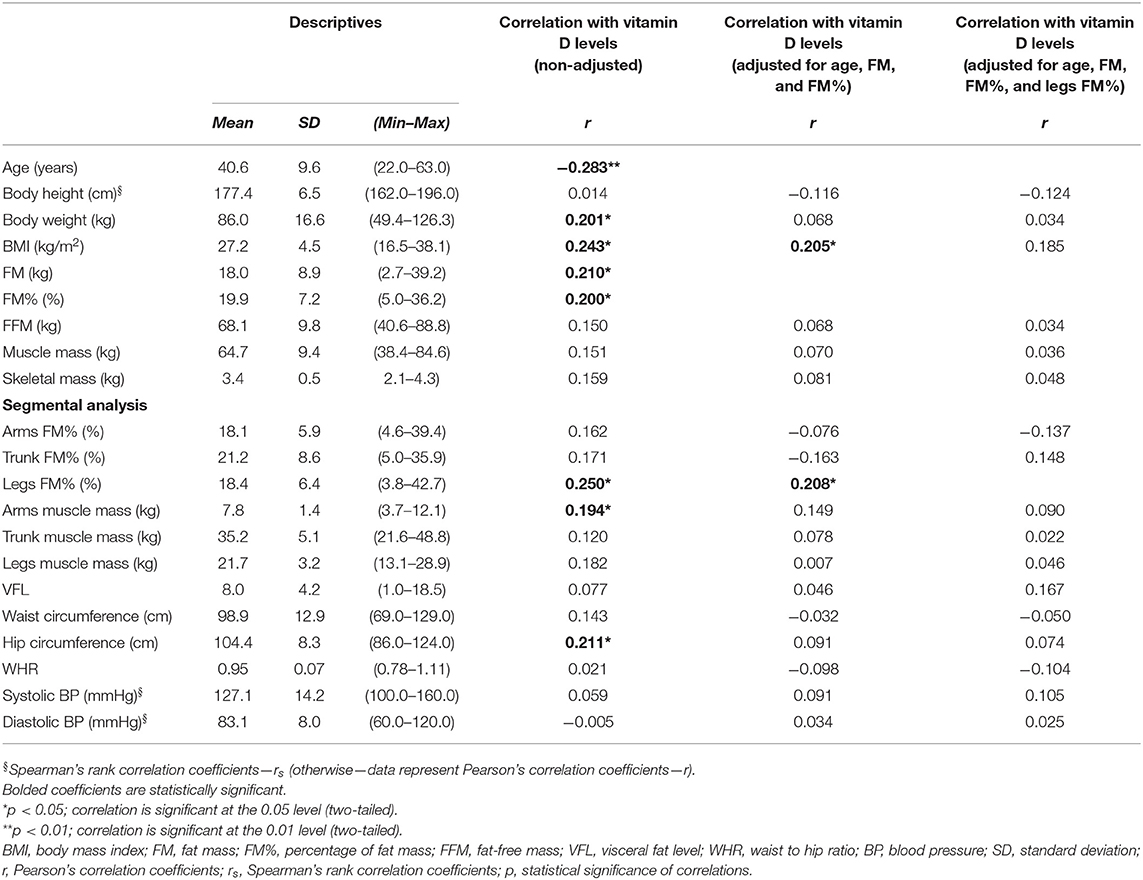
Table 1. Demographic, anthropometric, and arterial BP data of the studied coal miners (N = 103, men), and correlation with serum 25 (OH) vitamin D levels.
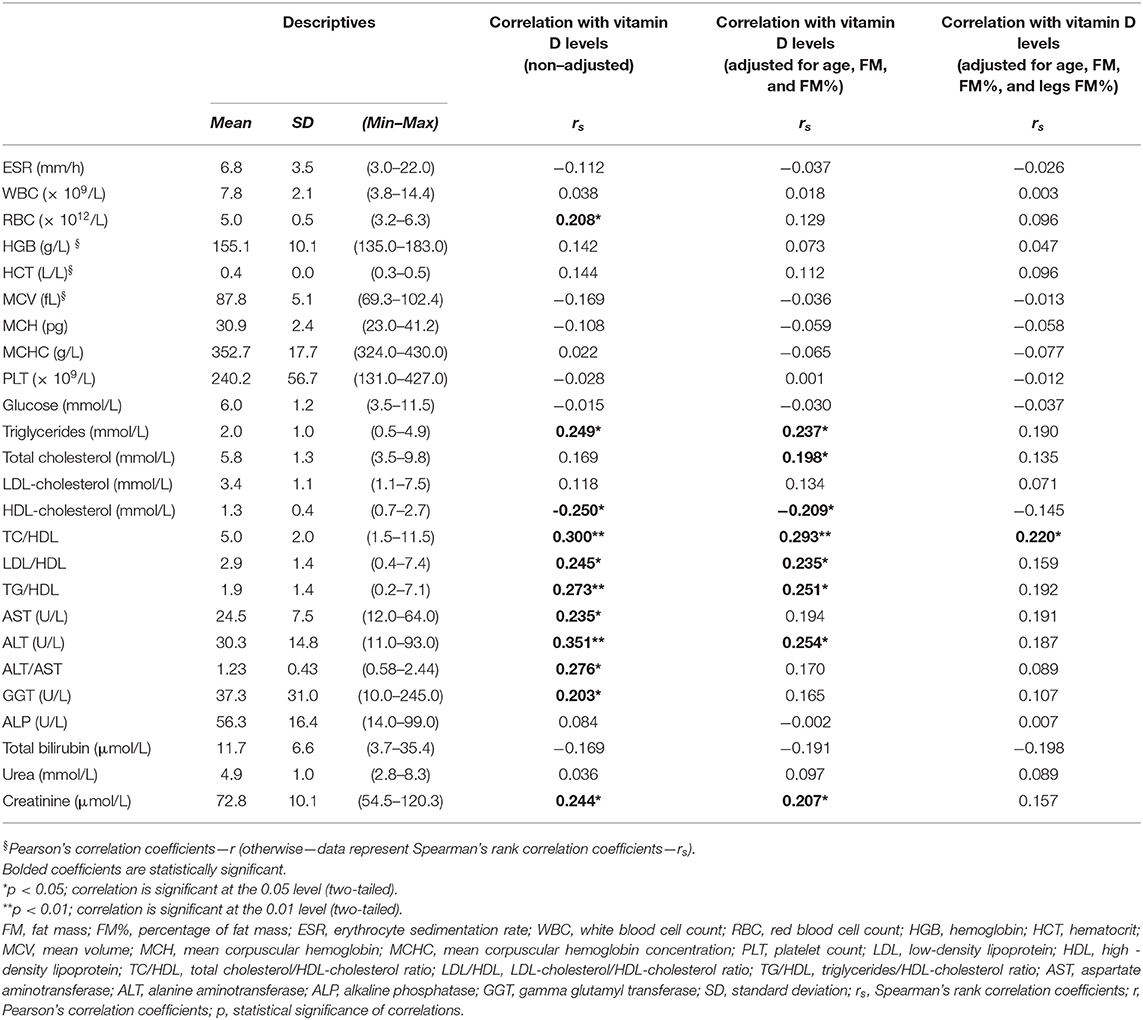
Table 2. Hematological and biochemical data of the studied coal miners (N =103, men), and correlation with serum 25 (OH) vitamin D levels.
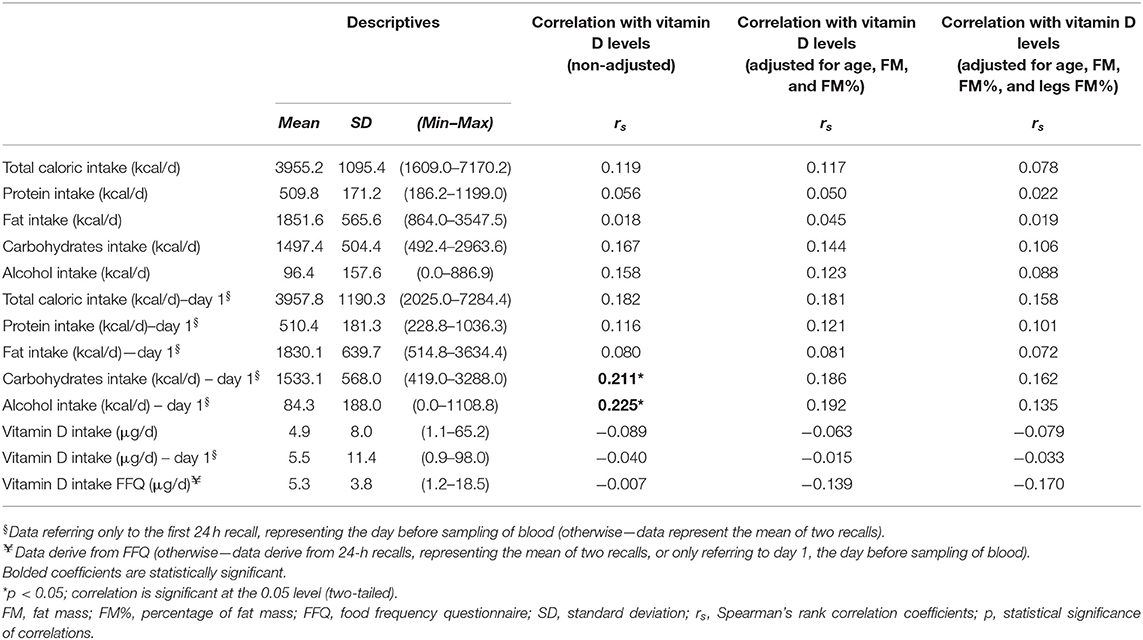
Table 3. Nutritional intakes data of the studied coal miners (N =103, men), and correlation with serum 25 (OH) vitamin D levels.
The mean age was 40.6 ± 9.6 years, but 10-year age categories were not represented equally, and only 11.7% of the participants were above 52-year-old (Supplementary Figure 1). More than half (53.5%) of the participants were smokers, and the huge majority (79.6%) lived in rural areas (the rest lived in semi-urban areas).
The average BMI belonged to the category of overweight (27.2 ± 4.5 kg/m2), and almost half of the participants (45.6%) were overweight, while about one-quarter (23.3%) were obese, with these two BMI categories making together above two-third of the studied population (68.9%). Less than one-third (28.2%) had normal weight, and only 2.9% were underweight. Almost half of the participants (45.6%) had increased adiposity, according to % FM ≥ 21–22 (depending on age). According to waist circumference, almost half of the participants (45.6%) had abdominal obesity, even though the average waist circumference value was under the cutoff value for abdominal obesity (i.e., < 102 cm). Centripetal obesity/fat distribution according to WHR was present in 75.7% of the participants.
The average measured values of fasting serum glucose (Table 2) were above the ADA cutoff values for the diagnosis of impaired fasting glucose (“pre-diabetes”), and 63.1% of the participants had serum glucose values above this value (i.e., ≥5.6 mmol/L), while at the same time 11.7% of the participants also met the criteria for diabetes (i.e., fasting serum glucose ≥ 7 mmol/L). Also, the average blood lipid levels were above the ATP III cutoff values for triglycerides (i.e., ≥1.69 mmol/L), total cholesterol (i.e., ≥5.17 mmol/L), and LDL-cholesterol (i.e., ≥3.34 mmol/L), while the average HDL-cholesterol levels were below the recommended values for men (i.e., <1.03 mmol/L) (Table 2). In total, 53.4, 62.1, and 45.6% of the participants had elevated triglycerides, total cholesterol, and LDL-cholesterol, respectively, while only 26.2% of the participants had reduced HDL-cholesterol levels. In total, 84 participants (81.6%) had dyslipidemia according to at least one of the ATP III criteria, while 11 participants (10.7%) fulfilled all the ATP III criteria for dyslipidemia (at the same time having increased triglycerides and LDL-cholesterol levels, and decreased HDL-cholesterol levels). The ratios of total cholesterol, LDL-cholesterol, and triglycerides to HDL-cholesterol were increased (i.e., respectively, ≥5, ≥3.3, and ≥0.87) in 43.7, 34, and 73.8% of the participants, respectively.
The average systolic and diastolic pressures were in the normal range, but 51.5% of the participants met the criteria for pre-hypertension or hypertension.
Only three participants used lipid-lowering agents (but they did not use them regularly), while 11 participants used antihypertensive drugs. No other medicaments used were reported, and no medications were used on the morning of the examination.
According to the obtained data on glucose, triglycerides, HDL-cholesterol, blood pressure, and waist circumference (or regular use of relevant medicaments), 48.5% of the participants fulfilled the 2005 AHA criteria for the diagnosis of metabolic syndrome. The serum levels of ALT above 30 U/L, GGT above 30 U/L, and ALT/AST ratio higher than 1.25 [indicative for NAFLD (55–57)] had 36.9, 48.5, and 40.8% of the participants, respectively.
The average energy intake, according to the repeated 24 h recalls, was 3955.2 ± 1095.4 kcal/day, which is in accordance with existing recommendations (58), but there was a huge inter-individual difference (individual intakes ranged from 1,600 to 7,200 kcal) (Table 3). On average, proteins, fats, carbohydrates, and alcohol provided 12.9 ± 2.1, 46.8 ± 6.7, 38.1 ± 7.1, and 2.2 ± 3.5% of total daily energy intake, respectively. Daily alcohol intake (average for 2 days, according to 24 h recalls) varied from 0 g (in 54.4% of coal miners) to 126.7 g. Similarly, according to FFQs, only 58.3% of the coal miners reported alcohol intake.
The average intake of VitD was quite low and far below the recommended values by EFSA: 5.3 ± 3.8 μg/day (according to FFQs) and 4.9 ± 8 μg/day (according to 24 h recalls) (Table 3). Only two of the participants had an adequate nutritional intake of VitD, above 15 μg/day. There was a statistically significant correlation between VitD intakes by FFQs and 24 h recalls (Spearman's rho correlation coefficient 0.268, p = 0.04). Only four of the coal miners consumed supplements of VitD.
Vitamin D Status
The average value of serum 25(OH) vitamin D was way above the lower cutoff value for the sufficient state: 143.7 ± 41.4 nmol/L, ranging from 43.5 to even 247.5 nmol/L. Only three (2.9%) of the coal miners had levels of VitD lower than 75 nmol/L (indicating an insufficient/deficient status, with two subjects having mild deficiency), while 63.2% had values above 125 nmol/L (upper optimal limit). In total, 22.3% of the coal miners had 25(OH) VitD above 175 nmol/L (the upper limit for normal range), and even 10.7% had values above 200 nmol/L (the lowest literature-reported level associated with toxicity). None of the coal miners had VitD values above 250 nmol/l (hypervitaminosis) (For graphical presentation, refer to Supplementary Figure 2.)
Most of the total serum 25 (OH) VitD was 25(OH) vitamin D3 (143.5 ± 41.4 nmol/L, ranging from 43.5 to 247.5 nmol/L), while 25(OH) VitD2 made only a small part (0.2 ± 1.6 nmol/L, ranging from 0 to 15 nmol/L).
The results on 25 (OH) VitD levels were not much different if the subjects who consumed supplements of VitD were excluded from the analysis (mean total serum 25 (OH) VitD was 144.1 ± 42.1 nmol/L, again ranging from 43.5 to 247.5 nmol/L). Considering the four coal miners who consumed the supplements, their VitD levels ranged from 105.5 to 149.5 nmol/L (in average 123.2 ± 18.7 nmol/L), only nine subjects were sunbathing by the seaside during the summer, and the levels of VitD were statistically marginally higher in them: 172.3 ± 46.5 vs. 141 ± 40.1 nmol/L (Mann–Whitney test p = 0.05).
There was no statistically significant difference in VitD levels between those who lived in rural and semi-urban areas (141.6 ± 42.2 vs. 152.1 ± 37.6 nmol/L, respectively), or smokers and non-smokers 140.8 ± 43.2 vs. 146.4 ± 40.3 nmol/L, respectively).
There was no correlation between serum 25 (OH) VitD levels and VitD nutritional intake, according to both FFQs and 24 h recalls (Table 3).
When only nutritional data from the day before blood sampling were analyzed, VitD levels correlated with 24 h recall carbohydrates and alcohol intake the previous day (Table 3).
Association of VitD Levels With Cardiometabolic (Anthropometric and Biochemical) Parameters
There were no statistically significant difference in 25 (OH) VitD levels in the coal miners with or without metabolic syndrome, or with or without overweight/obesity (148.9 ± 42.0 vs. 138.8 ± 40.5 nmol/L, and 147 ± 37.1 vs. 136.4 ± 49.5 nmol/L, respectively, Mann–Whitney test p > 0.05), even though in subjects with those conditions VitD levels seemed somehow higher.
Tables 1, 2 show the correlation of VitD levels with cardiometabolic (anthropometric and biochemical) parameters.
Serum 25 (OH) vitamin D levels had significant negative correlations with age and HDL-cholesterol levels and had significant positive correlations with body weight, BMI, FM, FM%, limbs FM%, arms muscle mass, hip circumference, serum triglycerides, GGT, AST, ALT, total cholesterol/HDL-cholesterol, LDL-cholesterol/HDL-cholesterol, triglycerides/HDL-cholesterol ratios, and ALT/AST ratio (Tables 1, 2). Leg FM% was the anthropometric parameter that correlated most with VitD levels. At the same time, the above-mentioned biochemical variables had significant positive inter-correlations with anthropometric parameters indicative of increased adiposity (FM and FM%) and, surprisingly, some of them more with indicators of peripheral (gluteo-femoral) rather than with indicators of centripetal (truncal) adiposity (e.g., lipid levels correlated more with hip circumference and leg FM%, than with waist circumference and trunk FM%, Supplementary Table 1). Serum 25 (OH) VitD levels also positively correlated with erythrocytes count and creatinine (Table 3), while creatinine also had a positive correlation with muscular mass (Supplementary Table 1).
To eliminate the possible confounding, we performed Pearson's and Spearman's rank partial correlations. The correlations with lipids, creatinine, and ALT remained significant even after correcting for age, FM, and FM%, but were lost after additional corrections for leg FM% (with exception of total cholesterol/HDL-cholesterol ratio, which only remained significant correlation with VitD levels after this additional correction) (Table 3).
The stepwise linear regression analysis (which included age, and biochemical and anthropometric data as predictor variables), identified that the most significant predictors of VitD levels were age, leg FM%, and triglyceride levels (the models 1 and 2 have accounted for a statistically significant amount of VitD variance, and explained 23.8 and 23% of VitD variance, respectively) (Table 4).
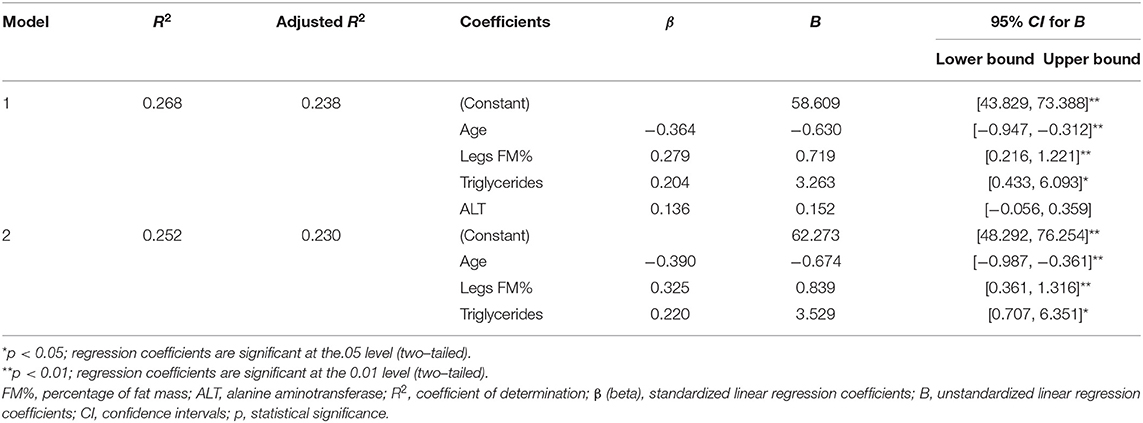
Table 4. Linear (stepwise) regression models for assessing the impact of specific characteristics of coal miners (general, anthropometric, biochemical, and nutritional) on serum 25 (OH) vitamin D levels.
Discussion
This study is among the very rare ones that examined the levels of VitD in a population of underground coal miners. We found surprisingly high levels of late-summer serum 25 (OH) VitD, which were much higher compared with the same season VitD data on an urban-living, general male Serbian population from similar geographic latitude (28), and previously published values for coal miners from other geographic regions (18–21).
Apart from this, to the best of our knowledge, this is the first published study that examined the association of VitD levels in coal miners with their cardiometabolic status. Again, we have found unexpected positive correlations with anthropometric data and biochemical parameters indicative of obesity, metabolic syndrome, and fatty liver disease, which is in contrast with previously published data (28, 59).
Such unexpected findings require explanation and more exploration.
The high levels of serum 25 (OH) vitamin D can be explained by the late summer season (beginning of September) when the serum levels of VitD are expected to be highest, and by living in rural/semi-urban areas, with high isolation, where additional agricultural work is quite common in that period (leading to additional sun exposure during non-coal mining working hours). Therefore, it would be necessary to examine the winter/early spring levels of VitD in the same group, when there would be much less sun exposure. The nutritional intake of VitD in this study was quite low, and far below the current EFSA recommendations, and only four subjects consumed VitD supplements. Therefore, it could be expected to find much lower values during winter/early spring.
However, the higher vitamin D levels can be also a consequence of their heavy physical work, leading to increased lipolysis and release of VitD from fat and muscular depots (60–62). Studies indicate that serum VitD levels increase after intensive physical activity (60, 63–65) and remain increased even after 24 h (60, 63, 64). People who exercise regularly, even indoors, have higher VitD levels compared with sedentary people (60, 65–67). The data on increased VitD levels after weight loss (accompanied by increased lipolysis) also support this hypothesis (68). This can additionally explain the difference in VitD status with the urban-living Serbian general male population, not performing hard physical work, in which levels were almost three times lower (49.8 ± 17.2 nmol/L), despite quite similar BMI (28 ± 6.3 kg/m2), waist circumference (98.5 ± 18 cm), and slightly higher FM% (24.8 ± 10.3%) (28). However, this cannot explain the difference in VitD status with other published data on summer VitD status in coal miners around the world (18–21). The main explanations for the difference with the Newcastle (UK) coal miners [where average values of 73.8 ± 73.4 nmol/L were found during the summer period (18), which were two times lower compared with these data] are geographic latitude and the lower level of insolation, apart from the earlier time of sampling (from May to July). In the study from India, samples were taken over a whole year, not specified if summer or winter (21), and in two other studies from UK and Turkey, the samples were from the winter/early spring period (19, 20). Nevertheless, the values in all those studies were much lower, particularly in Turkish workers (20).
However, there can be some additional explanations for the high vitamin D levels in the coal miners of this study.
In this study, vitD levels had a significant positive association with alcohol intake the previous day. Nevertheless, it is quite possible that the coal miners consciously withheld their alcohol consumption both in the 24 h recalls and FFQs (since it was an official medical checkup), and that their alcohol intake was much higher, since some data place this profession among the professions with highest alcohol consumption (21, 69, 70). Several cross-sectional studies showed positive associations of alcohol consumption with serum 25 (OH) VitD levels (66, 71–74). Even though these could be confounding findings, there can be a direct association between alcohol intake and VitD metabolism. It was shown in rats that chronic alcohol intake increases serum 25 (OH) VitD3, while it decreases serum 1, 25 (OH)2 VitD3 (75). The effect is most probably conveyed by a direct inhibition of parathyroid hormone (PTH) secretion by alcohol (76, 77). PTH stimulates the 1-alpha hydroxylation of 25 (OH) VitD3 to 1,25 (OH)2 VitD3. Nevertheless, only a small fraction of 25 (OH) VitD3 is converted to 1,25 (OH)2 VitD3 (78), and it is less likely that the inhibited 1-alpha hydroxylation significantly contributed to the considerably increased 25 (OH) VitD3 levels in this study. In accordance, in one study, only about a 10 nmol/L increase in serum 25 (OH) VitD was noted 5 years after parathyroidectomy connected with significant decreases in PTH (79). However, we cannot exclude the effect of habitual alcohol consumption on VitD levels in this study, even though regression models did not identify alcohol consumption as a significant predictor of VitD levels.
Probably the most difficult is to explain the positive association of vitamin D with the level of adiposity, triglycerides, and liver enzymes indicative of fatty liver disease, and the negative association with HDL-cholesterol. Most literature data contrast with these findings and show the negative association with the level of adiposity (3), blood lipids (80, 81), and liver enzymes (82), even though there are also some conflicting findings (1–4, 83).
In line with this study findings of increased prevalence of obesity and metabolic disturbances among coal miners despite their heavy physical activity, in a recent NHANES study, only increased recreational physical activity was found to be associated with an improved metabolic profile, while occupational physical activity was not (84). In contrast, in a recent study of Chinese coal miners, the higher level of occupational physical activity was related to a decreased prevalence of metabolic syndrome among them (23).
Even though most (almost 70%) of the subjects were overweight and obese (according to BMI), only less than half of them had increased adiposity, centripetal obesity, or metabolic syndrome, which can be explained by the increased muscular mass related to their heavy physical work and the effect of physical activity on waist circumference and metabolic parameters (85–87). However, in this study, hyperglycemia was detected in more than 60%, while dyslipidemia (according to at least one lipid parameter) was detected in even more than 80% of the study subjects. In accordance with this study, in a study of Indian coal miners, serum triglycerides, total cholesterol, very-low-density lipoproteins (VLDL)-cholesterol, and LDL- cholesterol levels were found to be increased, while HDL- cholesterol levels were found to be decreased, in the coal miners compared with other workers, irrespective of the level of adiposity, which suggests that some other factors (inappropriate diet or working conditions, e.g., shift work) additionally contribute to metabolic disturbances (22).
In this study, the most prevalent type of dyslipidemia was hypertriglyceridemia. However, the levels of HDL-cholesterol were not decreased in the same magnitude (only in one-quarter of the subjects were they decreased), which can be explained by the positive effect of heavy physical activity on HDL-cholesterol, which is more sensitive to physical activity compared with LDL-cholesterol and triglycerides (87).
The positive association of serum 25 (OH) vitamin D levels with the levels of adiposity in this study can be explained by increased lipolysis and VitD release from adipose tissue depots during and after heavy physical work (60). Consistent with this, in the study of Sun et al. (64), increased 25 (OH) VitD levels after physical activity persisted for 24 h, and the strongest positive predictor of the incremental area under the curve was %FM, which is in agreement with the here presented findings. In this study, there were also positive correlations of VitD levels with limb muscle mass (although on the borderline statistical significance), which also confirms that muscular depots contribute to VitD status, although to a lesser extent (60–62).
In adipose tissue, most of the stored vitamin D is in its non-hydroxylated form (60). After the non-hydroxylated form of VitD is released from fat and muscular depots, it binds to a VitD binding protein, (DBP) and enters the liver where it is activated (25–hydroxylated) and, without delay, is released again into circulation, to be stored again in fat and muscular depots (and other target organs), with a half-life of ~2–3 weeks, which ensures that the circulating 25 (OH) VitD levels are quite stable and not significantly influenced by transient dietary intake and sun exposure changes (60). This is in accordance with the findings of this study that the previous day VitD intake did not correlate with the measured 25 (OH) VitD levels.
The negative correlation of vitamin D status with age in this study is in agreement with previously published data since older people produce less cutaneous VitD3 (46), and we have used age as a controlling factor to examine the association of VitD with other parameters. Since in this study both VitD status and different types of dyslipidemia had a positive association with the level of adiposity (but not centripetal obesity), we used adiposity parameters (FM and FM%) as additional controlling factors. In the adjusted analyses, the associations with TG, HDL, lipid ratios, ALT, and creatinine remained significant, as well with leg FM%. Only after additionally correcting for leg FM% was the significance of these associations with biochemical parameters lost, indicating that leg FM% was an additional factor affecting the association of VitD and biochemical parameters. Similarly, in the regression analysis, the only significant predictors of VitD status were age, leg FM%, and triglyceride levels.
The association with leg FM% can be explained by the fact that leg (femoral) fat depots represent an important resource of lipolysis during coal mining, even though the upper body subcutaneous fat generally contributes more to lipolysis in men during rest and exercise (88, 89). However, there are some conflicting data, indicating that in younger overweight men (in contrast to older overweight men) femoral fat depots respond more to exercise by lipolysis, compared with abdominal fat depots, which was related to the initial size of the depot (89, 90). In addition, even though leg fat is considered to have a more protective metabolic function and to be associated with a more beneficial metabolic profile (88), the findings from this study indicate the opposite. In this study, different types of dyslipidemia had a positive association with the level of adiposity, but, surprisingly, more with indicators of peripheral (gluteo-femoral) rather than centripetal (truncal) adiposity (e.g., lipid levels more correlated with hip circumference and leg FM% than with waist circumference and trunk FM%).
Unfortunately, there are not enough data on the difference between distinct subcutaneous and visceral fat depots in the storage and release capacity for VitD, particularly on the difference between distinct subcutaneous depots (60, 91). In one study (91), the concentrations of the non-hydroxylated form of VitD in visceral fat depots were moderately higher compared with abdominal subcutaneous fat depots, in both obese and non-obese women (with no difference between them). Nevertheless, considering a significantly larger amount of subcutaneous fat depots (4–6-fold), these depots contribute the most to circulating VitD levels (60).
On the other hand, the association of vitD with adipose tissue is bidirectional, and vitD can influence fat accumulation and re-distribution: in one study (92), supplementation with VitD decreased truncal subcutaneous fat without changing total fat mass, and this effect can be attributed to the direct effects of VitD on adipose tissue (probably through adipose tissue VitD receptor actions, or through its effects on calcium metabolism) and lower PTH levels (93–96).
Since high 25 (OH) vitD3 levels have a reverse relationship with PTH levels (78), we suppose that in the population of coal miners (with high VitD levels), the levels of PTH were lower than in the general Serbian male population. PTH is known to simulate truncal fat distribution, thus centripetal obesity and related metabolic disturbances (i.e., metabolic syndrome) are often observed in primary hyperparathyroidism (79, 97–99). Therefore, lowering the levels of PTH can lead to a more favorable peripheral fat distribution and metabolic profile (79, 98, 99). Increased/decreased PTH secretion can be a possible explanation for commonly observed negative relationships of serum VitD with centripetal obesity and metabolic syndrome (28) and the in this study found positive association with peripheral fat accumulation (hip circumference and leg FM%). Unfortunately, we did not measure the levels of PTH in this study, as it was not originally planned in the study design to measure PTH, and even though (after measuring VitD) we had some leftovers of the serum samples of coal miners, with an adequate quantity for PTH measurements, the low stability of PTH in the serum samples during long-term storage (100) did not allow us to perform reliable measurements. Nevertheless, in this study, three-quarters of the coal miners had a centripetal body fat distribution (according to WHR), despite the very high levels of VitD (and probably low levels of PTH), and there was no association of VitD with WHR or waist circumference, which indicates that the role of VitD and PTH on body fat distribution was insignificant in the coal miners. This is in accordance with data on the imperceptible effects of VitD on obesity treatment (94, 101) and with data that show that in subjects with high levels of VitD, there is no effect of additional supplementation with VitD on body fat re-distribution (96, 101).
Particularly interesting is the finding of a positive association of serum 25 (OH) VitD levels with serum triglycerides levels. In general, most of the published data (but not all) indicate a negative association of VitD with triglyceride levels, and a positive association with HDL-cholesterol levels (80, 81). Triglycerides and HDL-cholesterol generally have an inverse association (102, 103), which we confirmed in this study (Spearman's coefficient of correlation = −0.615, p < 0.001), and the linear regression analysis identified only triglycerides as significant predictors of VitD levels. Interestingly, and in line with this study findings, some studies show that VitD supplementation increased the levels of triglycerides (104–106), even though both unchanged (107–109) and decreased (110) levels were found in other studies. Therefore, we hypothesize that the observed positive relationship of VitD with serum triglycerides reflects the effect of positive association with lipolysis after an enduring physical work (89). The increased lipolysis during prolonged physical work not only increases the release of VitD from adipose and muscular depots but also increases the supply of free fatty acids (FFAs), released from fat tissue, to the liver. In the liver, accumulated FFAs stimulate the production and secretion of VLDL, the main transporters of serum triglycerides, which are consequently cleared, mostly by muscle and adipose tissue (89, 111).
In general, under fasting and resting conditions, circulating triglycerides are in direct proportion with the rates of release and oxidation of FFAs (111). After physical activity, lipolysis is still increased, and this effect can last up to 24 to 42 h (89, 112, 113). The increased FFAs' release after physical activity increase the FFAs' supply to the liver. The increased supply of FFAs to the liver increases triglycerides secretion from the liver (in the form of VLDL) (111), but one could expect that triglycerides will be rapidly cleared from circulation by lipoprotein lipase (LPL), whose activity in a muscle is concomitantly increased during recovery after a physical activity (87), which would lead to a drop in triglycerides levels. However, quite the opposite, increases in triglyceride levels have also been described several hours after physical activity, indicating that their increased production can prevail over their increased clearance (87, 114). In accordance, the increased FFAs supply to muscle and fat tissue after physical activity can interfere with triglyceride clearance by LPL (111). Alcohol consumption additionally decreases LPL activity (115). Finally, studies show that total energy replacement after physical activity (what coal miners do after their work) diminishes/completely abolishes the beneficial effects of the physical activity on the next-day fasting and postprandial triglyceride and HDL-cholesterol levels (87, 114, 116, 117).
Nevertheless, these hypotheses need to be confirmed by further studies, and there can also be other mechanisms of the found associations of VitD levels with cardiometabolic parameters.
In accordance with the present study findings of high vitD values associated with worse metabolic profile among coal miners, some studies show a U-shaped association of VitD levels with cardiovascular mortality and risk, which requires further investigation (46).
Although not a primary aim of this study, the positive correlation of VitD with creatinine can be explained by the confounding effect of increased physical activity and release from muscular depots, since after a heavy physical activity the levels of creatinine also increase (118, 119), apart from the levels of VitD. Similarly, after heavy physical activity, the levels of ALT, AST, and GGT increase and can stay increased even after 24 h (118). The positive correlation with erythrocyte number could be explained by the direct effects of VitD on erythropoiesis and/or erythrocytes survival (120, 121), but can also be another confounding effect of physical activity (connected with increased erythrocyte release, due to splenic contraction, and hemoconcentration) (122).
This study has several limitations. The main limitation of this study is that only the late summer VitD levels are measured, without additional measurements of the winter/early spring VitD levels [which are expected to be much lower (19, 20)]. An additional limitation is the non-existence of a direct control group of non-coal miners from the same area, matched by sex, age, and anthropometric variables. However, we compared the data with recent literature findings for the Serbian general male population (urban-living and not working in physically demanding jobs but with similar age and anthropometric features), even though the method for VitD measurement (chemiluminescent immunoassay, CLIA) and the month and year of study sampling (July 2014) were not the same (28). Nevertheless, we had some serum samples from a small group of urban-living general population from the same latitude, from the beginning of September 2016 (the same as in the present study) and analyzed by HPLC at the same time with the samples from the coal miners, but that group was very small and mostly made of women (22 women and two men), and the data only served for HPLC method verification. The mean values in this group were 55.1 ± 30.9 nmol/L, again almost three times lower than in the coal miners and similar to data in reference (28). Another limitation is that the sample of the miners was not randomly taken (as it was a part of systematic medical examinations of all employed coal miners from one coal mine/shaft in the Resavica basin) and was only from one region for coal mining in Serbia, but we think that also in other regions situation will be quite similar (since they are very near geographically), and the most of Serbian coal miners work in the sampled region (76.4%) (27). Furthermore, we performed HPLC, but liquid chromatography-tandem mass spectrometry (LC-MS/MS) is the gold standard for VitD measurement (46, 78). We did not measure PTH levels, nor the free (i.e., bioavailable, not bound with DBP) VitD form, the active form of VitD (1,25 (OH)2 VitD), other VitD metabolites or epimers (e.g., C-3 epimers), which could modify or more explain these results (63, 78). In addition, some data show that VACUETTE® tubes with a serum clot activator can interfere with immunoassays for 25 (OH) VitD measurements (123, 124), but there are no such data on the HPLC method with Vacutest Kima® tubes with a serum clot activator (125), and even though a bit higher values were observed in immunoassays with VACUETTE® tubes with a serum clot activator, they correlated well with the ones measured by LC-MS/MS (123, 124). Moreover, TANITA BIA segmental analysis is not that accurate and precise in assessing regional body composition as other methods (e.g., dual-energy X-ray absorptiometry, DXA; computerized tomography, CT; magnetic resonance imaging, MRI), particularly in some populations (126). However, the mentioned techniques are costly and cannot be easily applied in field settings, and there is still a fairly good estimation with an eight-contact electrode BIA system, as confirmed by some validity studies (34). Finally, we did not directly measure or precisely estimate the level of individual physical activity, since it was not initially planned. Nevertheless, we controlled for physical activity in the questionnaire. All the coal miners were asked about their self-reported physical activity levels and the specific jobs they perform during coal mining. All of them were involved in hewing coal, loading coal, or (to a much lesser extent) erecting roof supports, and were placed in the heavy occupational work physical activity level (PAL) category (31). There are some publications which describe physical activities and directly measure physical activity and energy expenditures during coal mining (25, 127), and there was no huge difference between hewing coal and loading coal in energy expenditure. Nevertheless, it would be of interest to directly measure or at least precisely estimate the individual level of physical activity, and to relate it to individual VitD status in coal miners, to support the presented hypotheses.
Coal miners are a population of workers with specific nutritional needs due to their heavy physical work and unfavorable working conditions: working in shifts, working underground, and working with chronic occupational exposure to coal mine dust, which has pro-oxidative, pro-inflammatory, and pro-cancerogenic properties (128–130). Therefore, in the view of the science of precision nutrition, measuring the levels of VitD (which has the important metabolic, antioxidant, and anti-inflammatory activities) is very important in this population of workers to achieve their optimal nutrition, to adjust their nutrition (and possible supplementation) and meet their specific nutritional needs (131).
Considering the unexpected findings of this study, which are not easy to explain, and the above-mentioned study limitations, more studies are warranted to confirm the results and further explore the topic of VitD status and cardiometabolic health among coal miners.
Conclusion
In this study, we have found surprisingly high levels of late summer serum 25 (OH) VitD in a population of Serbian coal miners, much higher compared with the same season VitD data from an urban-living Serbian general male population with similar anthropometric characteristics, and previously published data for coal miners from other countries. Furthermore, we have found unexpected positive correlations of serum 25 (OH) VitD levels with anthropometric and biochemical parameters indicative of obesity, metabolic syndrome, and fatty liver disease. The linear regression analysis identified that the most significant positive predictors of VitD levels were age, leg FM%, and triglyceride levels. Such unexpected findings require more exploration. Data on VitD levels in the population of coal miners are scarce, as well as data on their cardiometabolic health. More research is needed on the VitD status of coal miners (particularly in the winter period) and its relationship with their cardiometabolic status.
Data Availability Statement
The raw data supporting the conclusions of this article will be made available by the authors, without undue reservation.
Ethics Statement
The studies involving human participants were reviewed and approved by Institute of Occupational Health Niš Ethics Board. The patients/participants provided their written informed consent to participate in this study.
Author Contributions
IS wrote the manuscript and performed anthropometric measurements, nutritional interviews, software exploration of nutritional data, biochemical analyses, and all the statistical analyses. JJ organized and performed preventive medical examinations, clinical assessments of coal miners, and biochemical analyses. MZec and ZP performed VitD measurements by HPLC. JD-M performed biochemical analyses. MZek and JM were involved in the dietary assessment. MGu and MGl led the project under which the study was conducted. All authors contributed to the writing of the manuscript.
Funding
The authors acknowledge the financial support from the Ministry of Education, Science and Technological Development of the Republic of Serbia, project number III41030 (2011–2017) and ongoing contract number: 451-03-9/2021-14/200015.
Conflict of Interest
The authors declare that the research was conducted in the absence of any commercial or financial relationships that could be construed as a potential conflict of interest.
Publisher's Note
All claims expressed in this article are solely those of the authors and do not necessarily represent those of their affiliated organizations, or those of the publisher, the editors and the reviewers. Any product that may be evaluated in this article, or claim that may be made by its manufacturer, is not guaranteed or endorsed by the publisher.
Acknowledgments
The authors are grateful to Dr. Agnes Kadvan for their involvement in dietary assessments.
Supplementary Material
The Supplementary Material for this article can be found online at: https://www.frontiersin.org/articles/10.3389/fnut.2021.689214/full#supplementary-material
References
1. Wimalawansa SJ. Associations of Vitamin D with insulin resistance, obesity, Type 2 diabetes, and metabolic syndrome. J Steroid Biochem Mol Biol. (2018) 175:177–89. doi: 10.1016/j.jsbmb.2016.09.017
2. Durgarao Y, Manjrekar PA, Adhikari P, Chakrapani M, Rukmini MS. Comprehensive review on diabetes associated cardiovascular complications - the Vitamin D perspective. Cardiovasc Hematol Disord Drug Targets. (2019) 19:139–53. doi: 10.2174/1871529X19666190114155302
3. Vranić L, Mikolašević I, Milić S. Vitamin D deficiency: consequence or cause of obesity? Medicina. (2019) 55:541. doi: 10.3390/medicina55090541
4. de la Guía-Galipienso F, Martínez-Ferran M, Vallecillo N, Lavie CJ, Sanchis-Gomar F, Pareja-Galeano H. Vitamin D and cardiovascular health. Clin Nutr. (2020) 40:2946–57. doi: 10.1016/j.clnu.2020.12.025
5. Chin K, Appel LJ, Michos ED. Vitamin D, calcium, and cardiovascular disease: a“D”vantageous or “D”etrimental? An era of uncertainty. Curr Atheroscler Rep. (2017) 19:5. doi: 10.1007/s11883-017-0637-2
6. The Lancet. GBD 2017: a fragile world. Lancet. (2018) 392:1683. doi: 10.1016/S0140-6736(18)32858-7
7. GBD 2019 Risk Factors Collaborators. Global Burden of 87 Risk Factors in 204 Countries and Territories, 1990–2019: a systematic analysis for the global burden of disease study 2019. Lancet. (2020) 396:1223–49. doi: 10.1016/S0140-6736(20)30752-2
8. GBD 2019 Diseases and Injuries Collaborators. Global burden of 369 diseases and injuries in 204 countries and territories, 1990–2019: a systematic analysis for the global burden of disease study 2019. Lancet. (2020) 396:1204–22. doi: 10.1016/S0140-6736(20)30925-9
9. Cashman KD, Dowling KG, Škrabáková Z, Gonzalez-Gross M, Valtueña J, De Henauw S, et al. Vitamin D deficiency in europe: pandemic? Am J Clin Nutr. (2016) 103:1033–44. doi: 10.3945/ajcn.115.120873
10. Amrein K, Scherkl M, Hoffmann M, Neuwersch-Sommeregger S, Köstenberger M, Tmava Berisha A, et al. Vitamin D deficiency 2.0: an update on the current status worldwide. Eur J Clin Nutr. (2020) 74:1498–513. doi: 10.1038/s41430-020-0558-y
11. Palacios C, Gonzalez L. Is Vitamin D deficiency a major global public health problem? J Steroid Biochem Mol Biol. (2014) 144:138–45. doi: 10.1016/j.jsbmb.2013.11.003
12. van Schoor N, Lips P. Global overview of Vitamin D status. Endocrinol Metab Clin North Am. (2017) 46:845–70. doi: 10.1016/j.ecl.2017.07.002
13. Roth DE, Abrams SA, Aloia J, Bergeron G, Bourassa MW, Brown KH, et al. Global prevalence and disease burden of Vitamin D deficiency: a roadmap for action in low- and middle-income countries. Ann N Y Acad Sci. (2018) 1430:44–79. doi: 10.1111/nyas.13968
14. Kyriakaki A, Fragkoulis E. The Vitamin D paradox: high prevalence of deficiency in Sunny Athens (Greece). Ann Res Hosp. (2019) 3:13. doi: 10.21037/arh.2019.06.02
15. Manios Y, Moschonis G, Hulshof T, Bourhis AS, Hull GLJ, Dowling KG, et al. Prevalence of Vitamin D deficiency and insufficiency among schoolchildren in Greece: the role of sex, degree of urbanisation and seasonality. Br J Nutr. (2017) 118:550–8. doi: 10.1017/S0007114517002422
16. Coppeta L, Papa F, Magrini A. Are shiftwork and indoor work related to D3 vitamin deficiency? A systematic review of current evidences. J Environ Public Health. (2018) 2018:8468742. doi: 10.1155/2018/8468742
17. Sowah D, Fan X, Dennett L, Hagtvedt R, Straube S. Vitamin D levels and deficiency with different occupations: a systematic review. BMC Public Health. (2017) 17:519. doi: 10.1186/s12889-017-4436-z
18. Shuster S, Chadwick L, Afacan AS, Robertson MD. Serum 25-hydroxy Vitamin D in surface and underground coalminers. Br Med J. (1981) 283:106. doi: 10.1136/bmj.283.6284.106
19. Shuster S, Chadwick L, Afacan AS, Robertson MD. Serum 25-hydroxy Vitamin D in coalworkers and surface workers in winter. Br Med J. (1982) 284:386. doi: 10.1136/bmj.284.6313.386
20. Sarikaya S, Ozdolap S, Mungan AG, Gümüştaş S, Koç U, Güven B, et al. Effect of underground working on Vitamin D levels and bone mineral densities in coal miners: a controlled study. J Int Med Res. (2006) 34:362–6. doi: 10.1177/147323000603400404
21. Dash S, Gupta S, Epari V, Patra PY. Association of Vitamin D levels in coal miners: a case-control study. Indian J Community Med. (2020) 45:181–3. doi: 10.4103/ijcm.IJCM_269_19
22. Prasad SK, Bhattacharjee A, Bandyopadhyay P, Pal S, Syamal AK, Mukherjee S. Erythrocyte functional status and lipid profile of coal mine workers of West Bengal, India. Prog Health Sci. (2014) 4:14–21.
23. Liang J, Tian SS, Qiao N, Wang C, Huang JJ, Sun CM, et al. Relationship between physical activity patterns and metabolic syndrome among male coal miners of Shanxi Province in China. Int J Sport Nutr Exerc Metab. (2017) 27:50–8. doi: 10.1123/ijsnem.2015-0320
24. Fan Y, Huang JJ, Sun CM, Qiao N, Zhang HX, Wang H, et al. Prevalence of dyslipidaemia and risk factors in Chinese coal miners: a cross-sectional survey study. Lipids Health Dis. (2017) 16:161. doi: 10.1186/s12944-017-0548-9
25. Bilici S, Saglam F, Beyhan Y, Barut-Uyar B, Dikmen D, Goktas Z, et al. Energy expenditure and nutritional status of coal miners: a cross-sectional study. Arch Environ Occup Health. (2016) 71:293–9. doi: 10.1080/19338244.2015.1095152
26. Dos Santos M, Penteado JO, Soares MCF, Muccillo-Baisch AL, Da Silva-Júnior FMR. Association between DNA damage, dietary patterns, nutritional status, and non-communicable diseases in coal miners. Environ Sci Pollut Res Int. (2019) 26:15600–7. doi: 10.1007/s11356-019-04922-8
27. The Public Company for Underground Coal Exploitation Resavica. Program Poslovanja JP PEU Resavica za 2017 Godinu [Business Program of PE PEU Resavica for 2017]. (2017) Serbian. Available online at: https://www.jppeu.rs/informator.html (accessed May 27, 2021).
28. Pantovic A, Zec M, Zekovic M, Obrenovic R, Stankovic S, Glibetic M. Vitamin D is inversely related to obesity: cross-sectional study in a small cohort of serbian adults. J Am Coll Nutr. (2019) 38:405–14. doi: 10.1080/07315724.2018.1538828
29. Charan J, Biswas T. How to calculate sample size for different study designs in medical research? Indian J Psychol Med. (2013) 35:121–6. doi: 10.4103/0253-7176.116232
30. Djekic-Ivankovic M, Weiler HA, Nikolic M, Kadvan A, Gurinovic M, Mandic LM, et al. Validity of an FFQ assessing the Vitamin D intake of young serbian women living in a region without food fortification: the method of triads model. Public Health Nutr. (2016) 19:437–45. doi: 10.1017/S136898001500138X
31. Energy and Protein Requirements. Report of a Joint FAO/WHO/UNU Expert Consultation. World Health Organ Tech Rep Ser. (1985) 724:1–206.
32. European Food Safety Authority. Guidance on the EU menu methodology. EFSA J. (2014) 12:3944. doi: 10.2903/j.efsa.2014.3944
33. World Health Organization. Waist Circumference and Waist-Hip Ratio: Report of a WHO Expert Consultation; Dec 8–11, 2008; Geneva. Geneva: World Health Organization (2011). 39.p. Available online at: https://www.who.int/publications/i/item/9789241501491 (accessed March 30, 2021).
34. Pietrobelli A, Rubiano F, St-Onge MP, Heymsfield SB. New bioimpedance analysis system: improved phenotyping with whole-body analysis. Eur J Clin Nutr. (2004) 58:1479–84. doi: 10.1038/sj.ejcn.1601993
35. Heymsfield SB. Algorithm Development for Estimating Visceral Fat Rating. Tanita Institute Contract Study. New York, NY: Columbia University College of Physicians and Surgeons (2004).
36. World Health Organization. Obesity: Preventing and Managing the Global Epidemic. WHO Technical Report Series, no. 894. Geneva: World Health Organization (1998). 252 p. Available online at: https://www.who.int/nutrition/publications/obesity/WHO_TRS_894/en/ (accessed March 30, 2021).
37. Gallagher D, Heymsfield SB, Heo M, Jebb SA, Murgatroyd PR, Sakamoto Y. Healthy percentage body fat ranges: an approach for developing guidelines based on body mass index. Am J Clin Nutr. (2000) 72:694–701. doi: 10.1093/ajcn/72.3.694
38. Chobanian AV, Bakris GL, Black HR, Cushman WC, Green LA, Izzo JL Jr, et al. Seventh report of the Joint National Committee on Prevention, Detection, Evaluation, and Treatment of High Blood Pressure. Hypertension. (2003) 42:1206–52. doi: 10.1161/01.HYP.0000107251.49515.c2
39. American Diabetes Association. 2. classification and diagnosis of diabetes. Diabetes Care. (2016) 39(Suppl. 1):S13–22. doi: 10.2337/dc16-S005
40. Expert Panel on Detection Evaluation and Treatment of High Blood Cholesterol in Adults. Executive summary of the third report of the National Cholesterol Education Program (NCEP) expert panel on detection, evaluation, and treatment of high blood cholesterol in adults (Adult Treatment Panel III). JAMA. (2001) 285:2486–97. doi: 10.1001/jama.285.19.2486
41. Wen J, Zhong Y, Kuang C, Liao J, Chen Z, Yang Q. lipoprotein ratios are better than conventional lipid parameters in predicting arterial stiffness in young men. J Clin Hypertens. (2017) 19:771–6. doi: 10.1111/jch.13038
42. Lou Y, Li X, Cao L, Qin P, Shi J, Zhang Y, et al. LDL-Cholesterol to HDL-cholesterol ratio discordance with lipid parameters and carotid intima-media thickness: a cohort study in China. Lipids Health Dis. (2020) 19:141. doi: 10.1186/s12944-020-01324-5
43. Grundy SM, Cleeman JI, Daniels SR, Donato KA, Eckel RH, Franklin BA, et al. Diagnosis and management of the metabolic syndrome: an American Heart Association/National Heart, Lung, and Blood Institute Scientific Statement. Circulation. (2005) 112:2735–52. doi: 10.1161/CIRCULATIONAHA.105.169404
44. Agborsangaya C, Toriola AT, Grankvist K, Surcel HM, Holl K, Parkkila S, et al. The effects of storage time and sampling season on the stability of serum 25-hydroxy Vitamin D and androstenedione. Nutr Cancer. (2010) 62:51–7. doi: 10.1080/01635580903191460
45. Hollis BW. Measuring 25-Hydroxyvitamin D in a clinical environment: challenges and needs. Am J Clin Nutr. (2008) 88:507S−10S. doi: 10.1093/ajcn/88.2.507S
46. Institute of Medicine (US) Committee to Review Dietary Reference Intakes for Vitamin D Calcium, Ross AC, Taylor CL, Yaktine AL, Del Valle HB (editors). Dietary Reference Intakes for Calcium Vitamin D. Washington, DC: National Academies Press (US) (2011). 662 p.
47. Holick MF, Binkley NC, Bischoff-Ferrari HA, Gordon CM, Hanley DA, Heaney RP, et al. Evaluation, treatment, and prevention of Vitamin D deficiency: an endocrine society clinical practice guideline. J Clin Endocrinol Metab. (2011) 96:1911–30. doi: 10.1210/jc.2011-0385
48. EFSA Panel on Dietetic Products Nutrition Allergies. Scientific opinion on dietary reference values for Vitamin D. EFSA J. (2016) 14:4547. doi: 10.2903/j.efsa.2016.4484
49. Rusińska A, Płudowski P, Walczak M, Borszewska-Kornacka MK, Bossowski A, Chlebna-Sokół D, et al. Vitamin D supplementation guidelines for general population and groups at risk of Vitamin D deficiency in poland-recommendations of the polish society of pediatric endocrinology and diabetes and the expert panel with participation of national specialist consultants and representatives of scientific societies-2018 update. Front Endocrinol. (2018) 9:246. doi: 10.3389/fendo.2018.00246
50. Gavrieli A, Naska A, Berry R, Roe M, Harvey L, Finglas P, et al. Dietary monitoring tools for risk assessment. EFSA Support Public. (2014) 11:287. doi: 10.2903/sp.efsa.2014.EN-607
51. Gurinović M, Milešević J, Kadvan A, Nikolić M, Zeković M, Djekić-Ivanković M, et al. Development, features and application of DIET ASSESS & PLAN (DAP) software in supporting public health nutrition research in Central Eastern European Countries (CEEC). Food Chem. (2018) 238:186–94. doi: 10.1016/j.foodchem.2016.09.114
52. Gurinović M, Milešević J, Novaković R, Kadvan A, Djekić-Ivanković M, Šatalić Z, et al. Improving nutrition surveillance and public health research in Central and Eastern Europe/Balkan countries using the balkan food platform and dietary tools. Food Chem. (2016) 193:173–80. doi: 10.1016/j.foodchem.2015.03.103
53. Nikolić M, Milešević J, Zeković M, Gurinović M, Glibetić M. The development and validation of food atlas for portion size estimation in the Balkan region. Front Nutr. (2018) 5:78. doi: 10.3389/fnut.2018.00078
54. Gurinović M, Milešević J, Kadvan A, Djekić-Ivanković M, Debeljak-Martačić J, Takić M, et al. Establishment and advances in the online Serbian food and recipe data base harmonized with EuroFIR™ standards. Food Chem. (2016) 193:30–8. doi: 10.1016/j.foodchem.2015.01.107
55. Hadizadeh F, Faghihimani E, Adibi P. Nonalcoholic fatty liver disease: diagnostic biomarkers. World J Gastrointest Pathophysiol. (2017) 8:11–26. doi: 10.4291/wjgp.v8.i2.11
56. Sanyal D, Mukherjee P, Raychaudhuri M, Ghosh S, Mukherjee S, Chowdhury S. Profile of liver enzymes in non-alcoholic fatty liver disease in patients with impaired glucose tolerance and newly detected untreated Type 2 diabetes. Indian J Endocrinol Metab. (2015) 19:597–601. doi: 10.4103/2230-8210.163172
57. Sattar N, Forrest E, Preiss D. Non-alcoholic fatty liver disease. BMJ. (2014) 349:g4596. doi: 10.1136/bmj.g4596
58. Vankhanen VV, Pivneva TI. [Physiologic Energy Requirements of Miners Working in Deep Coal Mines]. Vopr Pitan. (1991) 4:16–9.
59. Cimini FA, Barchetta I, Carotti S, Bertoccini L, Baroni MG, Vespasiani-Gentilucci U, et al. Relationship between adipose tissue dysfunction, Vitamin D deficiency and the pathogenesis of non-alcoholic fatty liver disease. World J Gastroenterol. (2017) 23:3407–17. doi: 10.3748/wjg.v23.i19.3407
60. Hengist A, Perkin O, Gonzalez JT, Betts JA, Hewison M, Manolopoulos KN, et al. Mobilising Vitamin D from adipose tissue: the potential impact of exercise. Nutr Bull. (2019) 44:25–35. doi: 10.1111/nbu.12369
61. Rybchyn MS, Abboud M, Puglisi DA, Gordon-Thomson C, Brennan-Speranza TC, Mason RS, et al. Skeletal muscle and the maintenance of Vitamin D status. Nutrients. (2020) 12:3270. doi: 10.3390/nu12113270
62. Mason RS, Rybchyn MS, Abboud M, Brennan-Speranza TC, Fraser DR. The role of skeletal muscle in maintaining Vitamin D status in winter. Curr Dev Nutr. (2019) 3:nzz087. doi: 10.1093/cdn/nzz087
63. Mieszkowski J, Stankiewicz B, Kochanowicz A, Niespodziński B, Kowalik T, Zmijewski M, et al. Ultra-marathon-induced increase in serum levels of Vitamin D metabolites: a double-blind randomized controlled trial. Nutrients. (2020) 12:3629. doi: 10.3390/nu12123629
64. Sun X, Cao ZB, Taniguchi H, Tanisawa K, Higuchi M. Effect of an acute bout of endurance exercise on serum 25(OH)D concentrations in young adults. J Clin Endocrinol Metab. (2017) 102:3937–44. doi: 10.1210/jc.2017-00146
65. Sun X, Cao ZB, Tanisawa K, Taniguchi H, Kubo T, Higuchi M. Effects of chronic endurance exercise training on serum 25(OH)D concentrations in elderly Japanese men. Endocrine. (2018) 59:330–7. doi: 10.1007/s12020-017-1478-z
66. Skaaby T, Husemoen LL, Thuesen BH, Pisinger C, Hannemann A, Jørgensen T, et al. Longitudinal associations between lifestyle and Vitamin D: a general population study with repeated Vitamin D measurements. Endocrine. (2016) 51:342–50. doi: 10.1007/s12020-015-0641-7
67. Fernandes MR, Barreto WDR Junior. Association between physical activity and Vitamin D: a narrative literature review. Rev Assoc Med Bras. (2017) 63:550–6. doi: 10.1590/1806-9282.63.06.550
68. Wamberg L, Christiansen T, Paulsen SK, Fisker S, Rask P, Rejnmark L, et al. Expression of Vitamin D-metabolizing enzymes in human adipose tissue – the effect of obesity and diet-induced weight loss. Int J Obes. (2013) 37:651–7. doi: 10.1038/ijo.2012.112
69. Tynan RJ, Considine R, Wiggers J, Lewin TJ, James C, Inder K, et al. Alcohol consumption in the Australian coal mining industry. Occup Environ Med. (2017) 74:259–67. doi: 10.1136/oemed-2016-103602
70. Bush DM, Lipari RN. Substance Use and Substance Use Disorder by Industry. The CBHSQ Report. Rockville, MD: Substance Abuse and Mental Health Services Administration (US). (2015) 18 p. Available online at: https://www.samhsa.gov/data/report/substance-use-and-substance-use-disorder-industry (accessed March 30, 2021).
71. Larose TL, Chen Y, Camargo CA Jr, Langhammer A, Romundstad P, Mai XM. Factors associated with Vitamin D Deficiency in a norwegian population: the HUNT study. J Epidemiol Community Health. (2014) 68:165–70. doi: 10.1136/jech-2013-202587
72. Petrenya N, Lamberg-Allardt C, Melhus M, Broderstad AR, Brustad M. Vitamin D status in a multi-ethnic population of Northern Norway: the SAMINOR 2 clinical survey. Public Health Nutr. (2020) 23:1186–200. doi: 10.1017/S1368980018003816
73. Cougnard-Grégoire A, Merle BM, Korobelnik JF, Rougier MB, Delyfer MN, Féart C, et al. Vitamin D deficiency in community-dwelling elderly is not associated with age-related macular degeneration. J Nutr. (2015) 145:1865–72. doi: 10.3945/jn.115.214387
74. Santos A, Amaral TF, Guerra RS, Sousa AS, Álvares L, Moreira P, et al. Vitamin D status and associated factors among Portuguese older adults: results from the nutrition UP 65 cross-sectional study. BMJ Open. (2017) 7:e016123. doi: 10.1136/bmjopen-2017-016123
75. Turner RT, Aloia RC, Segel LD, Hannon KS, Bell NH. Chronic alcohol treatment results in disturbed vitamin d metabolism and skeletal abnormalities in rats. Alcohol Clin Exp Res. (1988) 12:159–62. doi: 10.1111/j.1530-0277.1988.tb00152.x
76. Laitinen K, Lamberg-Allardt C, Tunninen R, Karonen SL, Tähtelä R, Ylikahri R, et al. Transient hypoparathyroidism during acute alcohol intoxication. N Engl J Med. (1991) 324:721–7. doi: 10.1056/NEJM199103143241103
77. Laitinen K, Tähtelä R, Välimäki M. The dose-dependency of alcohol-induced hypoparathyroidism, hypercalciuria, and hypermagnesuria. Bone Miner. (1992) 19:75–83. doi: 10.1016/0169-6009(92)90845-5
78. Ramasamy I. Vitamin D metabolism and guidelines for Vitamin D supplementation. Clin Biochem Rev. (2020) 41:103–26. doi: 10.33176/AACB-20-00006
79. Godang K, Lundstam K, Mollerup C, Fougner F, Pernow Y, Nordenström J, et al. The SIPH study group. the effect of surgery on fat mass, lipid and glucose metabolism in mild primary hyperparathyroidism. Endocr Connect. (2018) 7:941–8. doi: 10.1530/EC-18-0259
80. Jorde R, Grimnes G. Vitamin D and metabolic health with special reference to the effect of Vitamin D on serum lipids. Prog Lipid Res. (2011) 50:303–12. doi: 10.1016/j.plipres.2011.05.001
81. Lupton JR, Faridi KF, Martin SS, Sharma S, Kulkarni K, Jones SR, et al. Deficient serum 25-Hydroxyvitamin D is associated with an atherogenic lipid profile: the Very Large Database of Lipids (VLDL-3) study. J Clin Lipidol. (2016) 10:72–81.e1. doi: 10.1016/j.jacl.2015.09.006
82. Skaaby T, Husemoen LL, Borglykke A, Jørgensen T, Thuesen BH, Pisinger C, et al. Vitamin D status, liver enzymes, and incident liver disease and mortality: a general population study. Endocrine. (2014) 47:213–20. doi: 10.1007/s12020-013-0107-8
83. Paschou SA, Kosmopoulos M, Nikas IP, Spartalis M, Kassi E, Goulis DG, et al. The impact of obesity on the association between Vitamin D deficiency and cardiovascular disease. Nutrients. (2019) 11:2458. doi: 10.3390/nu11102458
84. Pazmino L, Esparza W, Aladro-Gonzalvo AR, León E. Impact of work and recreational physical activity on prediabetes condition among U.S. adults: NHANES 2015-2016. Int J Environ Res Public Health. (2021) 18:1378. doi: 10.3390/ijerph18041378
85. Figueiró TH, Arins GCB, Santos CESD, Cembranel F, Medeiros PA, d'Orsi E, et al. Association of objectively measured sedentary behavior and physical activity with cardiometabolic risk markers in older adults. PLoS ONE. (2019) 14:e0210861. doi: 10.1371/journal.pone.0210861
86. Huang JH, Li RH, Huang SL, Sia HK, Lee SS, Wang WH, et al. Relationships between different types of physical activity and metabolic syndrome among taiwanese workers. Sci Rep. (2017) 7:13735. doi: 10.1038/s41598-017-13872-5
87. Wang Y, Xu D. Effects of aerobic exercise on lipids and lipoproteins. Lipids Health Dis. (2017) 16:132. doi: 10.1186/s12944-017-0515-5
88. Manolopoulos KN, Karpe F, Frayn KN. Gluteofemoral body fat as a determinant of metabolic health. Int J Obes. (2010) 34:949–59. doi: 10.1038/ijo.2009.286
89. Thompson D, Karpe F, Lafontan M, Frayn K. Physical activity and exercise in the regulation of human adipose tissue physiology. Physiol Rev. (2012) 92:157–91. doi: 10.1152/physrev.00012.2011
90. Schwartz RS, Shuman WP, Larson V, Cain KC, Fellingham GW, Beard JC, et al. The effect of intensive endurance exercise training on body fat distribution in young and older men. Metabolism. (1991) 40:545–51. doi: 10.1016/0026-0495(91)90239-S
91. Carrelli A, Bucovsky M, Horst R, Cremers S, Zhang C, Bessler M, et al. Vitamin D storage in adipose tissue of obese and normal weight women. J Bone Miner Res. (2017) 32:237–42. doi: 10.1002/jbmr.2979
92. Bhatt SP, Misra A, Pandey RM, Upadhyay AD, Gulati S, Singh N. Vitamin D supplementation in overweight/obese Asian Indian women with prediabetes reduces glycemic measures and truncal subcutaneous fat: a 78 weeks randomized placebo-controlled trial (PREVENT-WIN Trial). Sci Rep. (2020) 10:220. doi: 10.1038/s41598-019-56904-y
93. vinh quốc Lu′o′ng K, Hoàng Nguyê~n LT. The beneficial role of Vitamin d in obesity: possible genetic and cell signaling mechanisms. Nutr J. (2013) 12:89. doi: 10.1186/1475-2891-12-89
94. Nimitphong H, Park E, Lee MJ. Vitamin D regulation of adipogenesis and adipose tissue functions. Nutr Res Pract. (2020) 14:553–67. doi: 10.4162/nrp.2020.14.6.553
95. Migliaccio S, Di Nisio A, Mele C, Scappaticcio L, Savastano S, Colao A, Obesity Programs of Nutrition Education Research and Assessment (OPERA) Group. Obesity and Hypovitaminosis D: causality or casualty? Int J Obes Suppl. (2019) 9:20–31. doi: 10.1038/s41367-019-0010-8
96. Cipriani C, Pepe J, Piemonte S, Colangelo L, Cilli M, Minisola S. Vitamin D and its relationship with obesity and muscle. Int J Endocrinol. (2014) 2014:841248. doi: 10.1155/2014/841248
97. George JA, Norris SA, Toman M, Snyman T, Crowther NJ. Visceral adiposity is a predictor of parathyroid hormone levels in healthy adults. J Endocrinol Invest. (2016) 39:447–53. doi: 10.1007/s40618-015-0400-x
98. Norenstedt S, Pernow Y, Brismar K, Sääf M, Ekip A, Granath F, et al. Primary hyperparathyroidism and metabolic risk factors, impact of parathyroidectomy and Vitamin D supplementation, and results of a randomized double-blind study. Eur J Endocrinol. (2013) 169:795–804. doi: 10.1530/EJE-13-0547
99. Nelson JA, Alsayed M, Milas M. The role of parathyroidectomy in treating hypertension and other cardiac manifestations of primary hyperparathyroidism. Gland Surg. (2020) 9:136–41. doi: 10.21037/gs.2019.12.12
100. Hanon EA, Sturgeon CM, Lamb EJ. Sampling and storage conditions influencing the measurement of parathyroid hormone in blood samples: a systematic review. Clin Chem Lab Med. (2013) 51:1925–41. doi: 10.1515/cclm-2013-0315
101. Sneve M, Figenschau Y, Jorde R. Supplementation with cholecalciferol does not result in weight reduction in overweight and obese subjects. Eur J Endocrinol. (2008) 159:675–84. doi: 10.1530/EJE-08-0339
102. Morrison A, Hokanson JE. The independent relationship between triglycerides and coronary heart disease. Vasc Health Risk Manag. (2009) 5:89–95. doi: 10.2147/VHRM.S4311
103. Miller M, Langenberg P, Havas S. Impact of Lowering Triglycerides On Raising HDL-C in hypertriglyceridemic and non-hypertriglyceridemic subjects. Int J Cardiol. (2007) 119:192–5. doi: 10.1016/j.ijcard.2006.07.132
104. Pilz S, Gaksch M, Kienreich K, Grübler M, Verheyen N, Fahrleitner-Pammer A, Treiber G, et al. Effects of Vitamin D on blood pressure and cardiovascular risk factors: a randomized controlled trial. Hypertension. (2015) 65:1195–201. doi: 10.1161/HYPERTENSIONAHA.115.05319
105. Challoumas D. Vitamin D supplementation and lipid profile: what does the best available evidence show? Atherosclerosis. (2014) 235:130–9. doi: 10.1016/j.atherosclerosis.2014.04.024
106. AlAnouti F, Abboud M, Papandreou D, Mahboub N, Haidar S, Rizk R. Effects of Vitamin D supplementation on lipid profile in adults with the metabolic syndrome: a systematic review and meta-analysis of randomized controlled trials. Nutrients. (2020) 12:3352. doi: 10.3390/nu12113352
107. Jorde R, Grimnes G. Vitamin D and lipids: do we really need more studies? Circulation. (2012) 126:252–4. doi: 10.1161/CIRCULATIONAHA.112.119693
108. Wang H, Xia N, Yang Y, Peng DQ. Influence of Vitamin D supplementation on plasma lipid profiles: a meta-analysis of randomized controlled trials. Lipids Health Dis. (2012) 11:42. doi: 10.1186/1476-511X-11-42
109. Yin X, Yan L, Lu Y, Jiang Q, Pu Y, Sun Q. Correction of Hypovitaminosis D does not improve the metabolic syndrome risk profile in a chinese population: a randomized controlled trial for 1 year. Asia Pac J Clin Nutr. (2016) 25:71–7. doi: 10.6133/apjcn.2016.25.1.06
110. Salekzamani S, Mehralizadeh H, Ghezel A, Salekzamani Y, Jafarabadi MA, Bavil AS, et al. Effect of high-dose Vitamin D supplementation on cardiometabolic risk factors in subjects with metabolic syndrome: a randomized controlled double-blind clinical trial. J Endocrinol Invest. (2016) 39:1303–13. doi: 10.1007/s40618-016-0507-8
111. Sarac I. The Effect of Rimonabant and Gender on Lipid Kinetics in Obesity: Metabolic Studies “In Vivo” Using Stable Isotopes. Saarbrücken: LAP Lambert Academic Publishing. (2016) 392 p.
112. Magkos F, Mohammed BS, Patterson BW, Mittendorfer B. Free fatty acid kinetics in the late phase of postexercise recovery: importance of resting fatty acid metabolism and exercise-induced energy deficit. Metabolism. (2009) 58:1248–55. doi: 10.1016/j.metabol.2009.03.023
113. Lundsgaard AM, Fritzen AM, Kiens B. The importance of fatty acids as nutrients during post-exercise recovery. Nutrients. (2020) 12:280. doi: 10.3390/nu12020280
114. Maraki MI, Sidossis LS. The latest on the effect of prior exercise on postprandial lipaemia. Sports Med. (2013) 43:463–81. doi: 10.1007/s40279-013-0046-9
115. Zemánková K, Makoveichuk E, Vlasáková Z, Olivecrona G, Kovár J. Acute alcohol consumption downregulates lipoprotein lipase activity in vivo. Metabolism. (2015) 64:1592–6. doi: 10.1016/j.metabol.2015.08.016
116. Burton FL, Malkova D, Caslake MJ, Gill JM. Energy replacement attenuates the effects of prior moderate exercise on postprandial metabolism in overweight/obese men. Int J Obes. (2008) 32:481–9. doi: 10.1038/sj.ijo.0803754
117. Trombold JR, Christmas KM, Machin DR, Van Pelt DW, Chou TH, Kim IY, et al. Postexercise macronutrient intake and subsequent postprandial triglyceride metabolism. Med Sci Sports Exerc. (2014) 46:2099–106. doi: 10.1249/MSS.0000000000000333
118. Sanchis-Gomar F, Lippi G. Physical activity – an important preanalytical variable. Biochem Med. (2014) 24:68–79. doi: 10.11613/BM.2014.009
119. Baxmann AC, Ahmed MS, Marques NC, Menon VB, Pereira AB, Kirsztajn GM, et al. Influence of muscle mass and physical activity on serum and urinary creatinine and serum cystatin C. Clin J Am Soc Nephrol. (2008) 3:348–54. doi: 10.2215/CJN.02870707
120. Alon DB, Chaimovitz C, Dvilansky A, Lugassy G, Douvdevani A, Shany S, et al. Novel role of 1,25(OH)(2)D(3) in induction of erythroid progenitor cell proliferation. Exp Hematol. (2002) 30:403–9. doi: 10.1016/S0301-472X(02)00789-0
121. Lang E, Jilani K, Bissinger R, Rexhepaj R, Zelenak C, Lupescu A, et al. Vitamin D-rich diet in mice modulates erythrocyte survival. Kidney Blood Press Res. (2015) 40:403–12. doi: 10.1159/000368517
122. Konstam MA, Tu'meh S, Wynne J, Beck JR, Kozlowski J, Holman BL. Effect of exercise on erythrocyte count and blood activity concentration after Technetium-99m in vivo red blood cell labeling. Circulation. (1982) 66:638–42. doi: 10.1161/01.CIR.66.3.638
123. Yu S, Cheng X, Fang H, Zhang R, Han J, Qin X, et al. 25OHD analogues and vacuum blood collection tubes dramatically affect the accuracy of automated immunoassays. Sci Rep. (2015) 5:14636. doi: 10.1038/srep14636
124. Yu S, Zhou W, Cheng X, Fang H, Zhang R, Cheng Q, et al. Blood collection tubes and storage temperature should be evaluated when using the siemens ADVIA Centaur XP for measuring 25-Hydroxyvitamin D. PLoS ONE. (2016) 11:e0166327. doi: 10.1371/journal.pone.0166327
125. Borai A, Bahijri S, Livingstone C, Nawajha M, Bawazeer A, Baarmah Z, et al. Assessment of becton dickinson plain and serum separator tubes in measurement of 25-Hydroxyvitamin D3 (25OHD3) by HPLC and immunoassay methods. J Clin Lab Anal. (2016) 30:32–5. doi: 10.1002/jcla.21805
126. Wang JG, Zhang Y, Chen HE, Li Y, Cheng XG, Xu L, et al. Comparison of two bioelectrical impedance analysis devices with dual energy X-ray absorptiometry and magnetic resonance imaging in the estimation of body composition. J Strength Cond Res. (2013) 27:236–43. doi: 10.1519/JSC.0b013e31824f2040
127. Humphreys PW, Lind AR. The energy expenditure of coalminers at work. Br J Ind Med. (1962) 19:264–75. doi: 10.1136/oem.19.4.264
128. Donoghue AM. Occupational health hazards in mining: an overview. Occup Med. (2004) 54:283–9. doi: 10.1093/occmed/kqh072
129. Department of Health and Human Services Centers for Disease Control and Prevention National Institute for Occupational Safety and Health. Current Intelligence Bulletin 64: Coal Mine Dust Exposures and Associated Health Outcomes - A Review of Information Published Since 1995. DHHS (NIOSH) Publication No. 2011–172 (2011). 56 p. Available online at: https://www.cdc.gov/niosh/docs/2011-172/ (accessed March 30, 2021).
130. León-Mejía G, Sosa MQ, Rohr P, Kvitko K, Henriques JAP, da Silva J. Occupational exposure to coal, genotoxicity, and cancer risk. In: Larramendy ML, Soloneski S, editors. Environmental Health Risk - Hazardous Factors to Living Species. London: IntechOpen (2016). p. 191–209. doi: 10.5772/62486
Keywords: coal miners, Vitamin D, physical activity, cardiometabolic health, metabolic syndrome, obesity, lipids
Citation: Šarac I, Jovanović J, Zec M, Pavlović Z, Debeljak-Martačić J, Zeković M, Milešević J, Gurinović M and Glibetić M (2021) Vitamin D Status and Its Correlation With Anthropometric and Biochemical Indicators of Cardiometabolic Risk in Serbian Underground Coal Miners in 2016. Front. Nutr. 8:689214. doi: 10.3389/fnut.2021.689214
Received: 08 April 2021; Accepted: 19 July 2021;
Published: 19 August 2021.
Edited by:
Thea Magrone, University of Bari Aldo Moro, ItalyReviewed by:
Majid Hajifaraji, National Nutrition and Food Technology Research Institute, IranSandhya Gupta, Siksha O Anusandhan University, India
Copyright © 2021 Šarac, Jovanović, Zec, Pavlović, Debeljak-Martačić, Zeković, Milešević, Gurinović and Glibetić. This is an open-access article distributed under the terms of the Creative Commons Attribution License (CC BY). The use, distribution or reproduction in other forums is permitted, provided the original author(s) and the copyright owner(s) are credited and that the original publication in this journal is cited, in accordance with accepted academic practice. No use, distribution or reproduction is permitted which does not comply with these terms.
*Correspondence: Ivana Šarac, aXZhbmFzYXJhY0B5YWhvby5jb20=