 Yue Wang1†Xiaoting Xu1†
 Yuanfeng Hao1Yelun Zhang2Yuping Liu2Zongjun Pu3Yubing Tian1
 Dengan Xu1
 Xianchun Xia1Zhonghu He1,4*
 Yong Zhang1*
- 1National Wheat Improvement Centre, Institute of Crop Sciences, Chinese Academy of Agricultural Sciences, Beijing, China
- 2Hebei Laboratory of Crop Genetics and Breeding, Institute of Cereal and Oil Crops, Hebei Academy of Agricultural and Forestry Sciences, Shijiazhuang, China
- 3Institute of Crop Sciences, Sichuan Academy of Agricultural Sciences, Chengdu, China
- 4International Maize and Wheat Improvement Center (CIMMYT) China Office, Chinese Academy of Agricultural Sciences, Beijing, China
Deficiency of micronutrient elements, such as zinc (Zn) and iron (Fe), is called “hidden hunger,” and bio-fortification is the most effective way to overcome the problem. In this study, a high-density Affymetrix 50K single-nucleotide polymorphism (SNP) array was used to map quantitative trait loci (QTL) for grain Zn (GZn) and grain Fe (GFe) concentrations in 254 recombinant inbred lines (RILs) from a cross Jingdong 8/Bainong AK58 in nine environments. There was a wide range of variation in GZn and GFe concentrations among the RILs, with the largest effect contributed by the line × environment interaction, followed by line and environmental effects. The broad sense heritabilities of GZn and GFe were 0.36 ± 0.03 and 0.39 ± 0.03, respectively. Seven QTL for GZn on chromosomes 1DS, 2AS, 3BS, 4DS, 6AS, 6DL, and 7BL accounted for 2.2–25.1% of the phenotypic variances, and four QTL for GFe on chromosomes 3BL, 4DS, 6AS, and 7BL explained 2.3–30.4% of the phenotypic variances. QTL on chromosomes 4DS, 6AS, and 7BL might have pleiotropic effects on both GZn and GFe that were validated on a germplasm panel. Closely linked SNP markers were converted to high-throughput KASP markers, providing valuable tools for selection of improved Zn and Fe bio-fortification in breeding.
Introduction
Wheat provides the starch, protein, and mineral nutrition needs for 35–40% of the world population (1). Mineral nutrition is crucial for a healthy diet. Over 17% of people suffer from malnutrition worldwide due to lack of mineral nutrition and more than 100,000 children under the age of five die from zinc (Zn) deficiency annually (2–4). The CIMMYT Harvest-Plus program initiated in the early 21st century aimed to address the “hidden hunger” issue by increasing micronutrient concentrations in staple food grains by plant breeding (5). Zn and Fe deficiency were identified as major causes of malnutrition, especially in underdeveloped regions where cereal grains make up most of the food (6).
Zn is a crucial cofactor in many enzymes and regulatory proteins, such as carbonic anhydrase, alkaline phosphatase, and DNA polymerase enzyme synthesis (7). Zn deficiency, first reported in 1961, affects the immune system, taste perception, site, and sexual function (4). Fe deficiency in humans most commonly leads to nutritional anemia in women and children (8). Therefore, it is very important to improve the nutritional quality of wheat by enhancing the Zn (GZn) and Fe (GFe) concentrations in grain (9, 10).
Bio-fortification in wheat breeding demands identification of genetic resources with high GZn and GFe (9). Wide ranges in variation in GZn and GFe have been reported in bread wheat (11–13) and its cultivated and wild relatives (12, 14, 15). Quantitative trait locus (QTL) mapping was used to identify genetic loci affecting GZn and GFe in biparental mapping populations, including recombinant inbred lines (RILs) (16–18). Genome-wide association studies (GWAS) with high-density single-nucleotide polymorphism (SNP) arrays were also used; for example, Alomari et al. (19) performed a GWAS for GZn concentration in 369 European wheats using the 90K and 35K SNP arrays and detected 40 marker–trait associations on chromosomes 2A, 3A, 3B, 4A, 4D, 5A, 5B, 5D, 6D, 7A, 7B, and 7D and 10 candidate genes on chromosomes 3B and 5A. With wide application of molecular markers, such as SSR, DArT, and SNPs, increasing numbers of QTLs for GZn and GFe were detected, including 35 and 32 QTL for GZn and GFe in the A genome, 37 and 30 in the B genome, and 15 and 12 in the D genome, respectively (Supplementary Table 1). The GZn QTL in homoeologous groups 1 to 7 were 9, 10, 13, 11, 13, 12, and 19, respectively, whereas the corresponding numbers of GFe QTL were 6, 17, 10, 8, 15, 7, and 11. QTL pleiotropic for GZn and GFe were identified in homoeologous group 3, 4, 5, and 7 chromosomes.
Cultivar Jingdong 8, with high yield and resistance to stripe rust, leaf rust, and powdery mildew, was released in the early 1990s in the China Northern Winter Wheat Region. It was used widely as a parent in breeding and was verified to have high GZn and GFe levels across environments (13). Bainong AK58, a high yielding cultivar in the Southern Yellow-Huai Valley Winter Wheat Region, has wide adaptability and good resistance to stripe rust, powdery mildew, and lodging, but has lower GZn and GFe. The main goals of the present study were to (1) identify QTL for GZn and GFe in the Jingdong 8/Bainong AK58 RIL population using inclusive composite interval mapping, and (2) develop and validate breeder-friendly markers for marker-assisted selection (MAS) for Zn and Fe biofortification in wheat breeding programs.
Materials and Methods
Plant Materials
Two hundred fifty-four F6 RILs developed from Jingdong 8/Bainong AK58 cross were used for QTL mapping of GZn and GFe concentrations. A germplasm panel, including 145 cultivars/lines with a wide range of variation in GZn and GFe from the Chinese wheat germplasm bank (13), were used for validation of QTL for GZn and GFe identified in the RIL population.
Field Trials and Phenotyping
The field trials were conducted at the wheat breeding station of the Institute of Crop Sciences (ICS, CAAS) located at Gaoyi (37°33′N, 114°26′E) and Shijiazhuang (37°27′N, 113°30′E) in Hebei province and Beijing (39°56′N, 116°20′E) during 2016 to 2019 cropping seasons. The parents and RILs were planted in randomized complete blocks with two replications in each environment. Each plot comprised a 1-m row with an inter-row spacing of 20 cm, and a parental check was sown every 30 plots. Standard agronomic practices were applied at each location, along with a soil application of 25 kg/ha ZnSO4·7H2O in all fields except Beijing.
Grain samples were hand-harvested and cleaned to avoid potential contamination of mineral elements. Micronutrient analysis of grain samples collected from the 2016–2017 cropping season was performed at the Institute of Quality Standards and Testing Technology for Agro-products of CAAS using inductively coupled plasma atomic emission spectrometry (ICP-AES, OPTIMA 3300 DV) after samples were digested in a microwave system with HNO3-H2O2 solution (20). For grain samples from the 2017–2018 and 2018–2019 cropping seasons and the germplasm panel, a “bench-top,” nondestructive, energy-dispersive X-ray fluorescence spectrometry (EDXRF) instrument (model X-Supreme 8000, Oxford Instruments plc, Chengdu) was used to measure GZn and GFe, following the standard method for high-throughput screening of micronutrients in whole wheat grain (21).
Statistical Analysis
Analysis of variance (ANOVA) was performed by PROC MIXED with method type3 and all effects were treated as fixed in SAS 9.4 software (SAS Institute, Cary, NC). Variance and covariance components for genotype and genotype by environment interaction effects were estimated using PROC MIXED, assuming all effects as random. A similar model was also performed by PROC MIXED with genotype effect as fixed, while environment, replication nested in environment, and interactions involving environment as random, to estimate best linear unbiased estimate (BLUE). Broad-sense heritabilities (Hb2) on the basis of BLUE value were estimated using the following equation and standard errors were calculated following Holland et al. (22):
where represents the variance of genotypes, and represent the variances of genotype × environment interaction and error, and e and r represent environments and number of replicates per environment, respectively. Phenotypic and genotypic correlations and their standard errors were estimated after Becker (23). Student's t test was performed by PROC TTEST.
SNP Genotyping and QTL Analysis
Genomic DNA extracted from fresh seedling leaves of RILs and parents by CTAB method (24) were used for genotyping by the wheat 50K SNP Array. The wheat 50K SNP Array was developed in collaboration by CAAS and Capital-Bio, Beijing, China (https://www.capitalbiotech.com/). Linkage analysis was performed with JoinMap v4.0 using the regression mapping algorithm (25). QTL analysis was performed by inclusive composite interval mapping with the ICIM-ADD function using QTL IciMapping v4.1 (http://www.isbreeding.net). Phenotypic values of RILs averaged from two replicates in each environment and BLUE value across nine environments were used for analyses. QTL detection was done using a logarithm of odds (LOD) threshold of 2.5. Pleiotropic QTL were analyzed using the module JZmapqtl of multi-trait composite interval mapping (MCIM) in Windows QTL Cartographer v2.5 (26). QTL pyramids were plotted using ggplot2 in R (27). Physical maps for the positional comparisons of GZn and GFe QTL with previous reports were exhibited using MapChart v2.3 (28).
Conversion of SNPs to KASP Markers
Kompetitive Allele Specific PCR (KASP) markers were developed from SNPs tightly linked with the targeted QTL, each including two competitive allele-specific forward primers and one common reverse primer. Each forward primer incorporated an additional tail sequence that corresponds to only one of the two universal fluorescence resonance energy transfers. Primers were designed from information in the PolyMarker website (http://polymaker.tgac.ac.uk/). PCR procedures and conditions followed Chandra et al. (29). Gel-free fluorescence signal scanning and allele separation were conducted by microplate reader (Multiscan Spectrum BioTek, Synegy/H1) with Klustercaller 2.24.0.11 software (LGC, Hoddesdon, UK) (30).
Results
Phenotypic Evaluation
ANOVA showed that GZn and GFe were significantly influenced by lines, environments, and line by environment interaction effects, with line by environment interaction effects contributing the highest variation, followed by line and environment effects (Table 1). The broad-sense heritabilities of GZn and GFe were 0.36 ± 0.03 and 0.39 ± 0.03, respectively. Jingdong 8 accumulated significantly higher GZn and GFe than Bainong AK58. Wide-ranging continuous variation among the RILs suggests polygenic inheritance (Table 2, Figure 1). Significant and positive correlations of GZn (r = 0.25–0.67, P < 0.01) and GFe (r = 0.26–0.70, P < 0.01) were observed across the nine environments (Table 3). Additionally, positive phenotypic and genotypic correlations between GZn and GFe (r = 0.78 ± 0.01 and 0.81 ± 0.03, P < 0.001) (Figure 2), indicated that GZn and GFe were, to some degree, simultaneously accumulated.
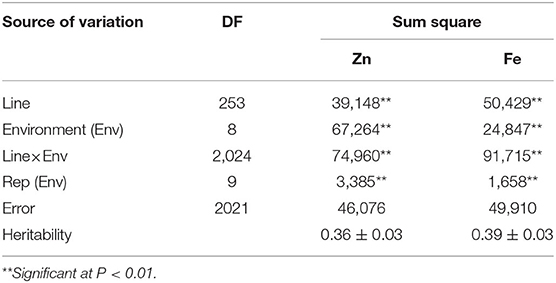
Table 1. Analysis of variance of GZn and GFe in 254 RILs derived from the cross Jingdong 8/Bainong AK58 grown in nine environments.
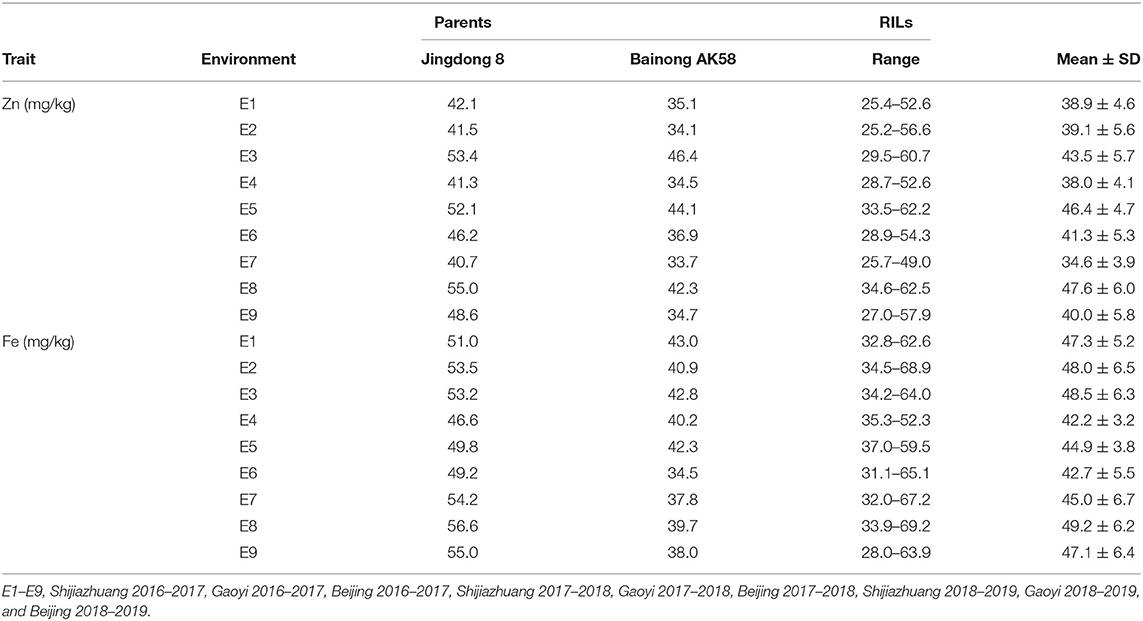
Table 2. Mean and range of GZn and GFe (mg/kg) in the Jingdong 8/Bainong AK58 RIL population among nine environments.
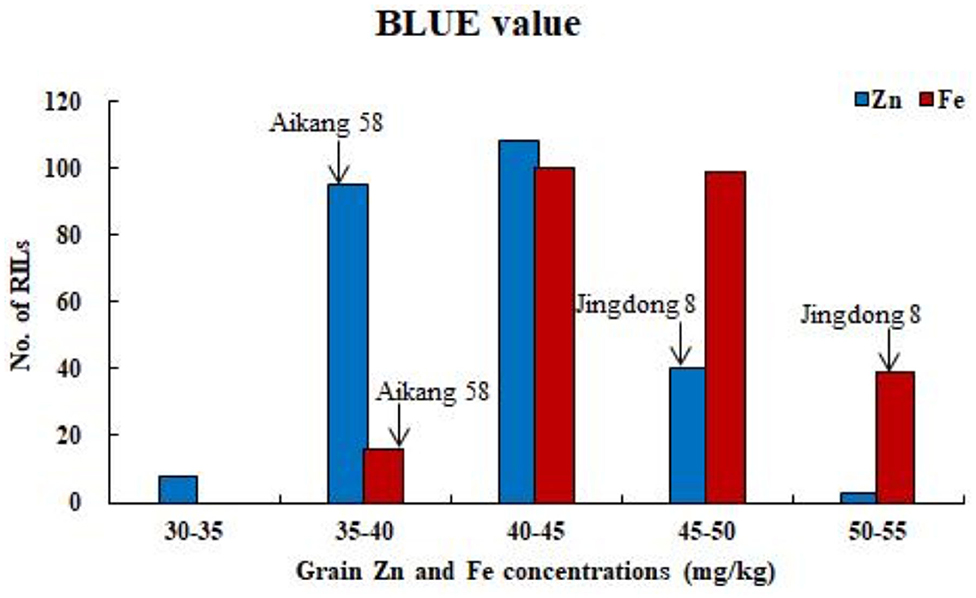
Figure 1. Frequency distributions of GZn and GFe based on BLUE value across nine environments for 254 RILs in the Jingdong 8/Bainong AK58 population.
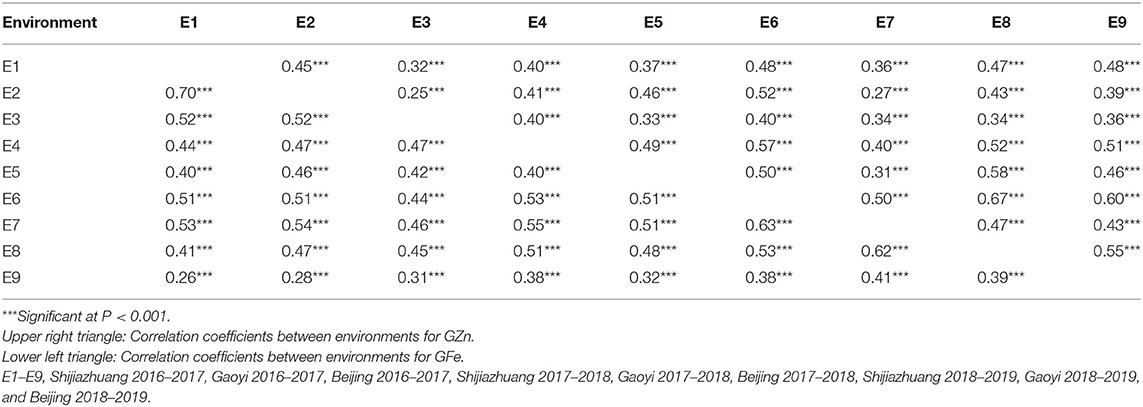
Table 3. Pearson correlation coefficients of GZn and GFe in the Jingdong 8/Bainong AK58 RIL population among nine environments.
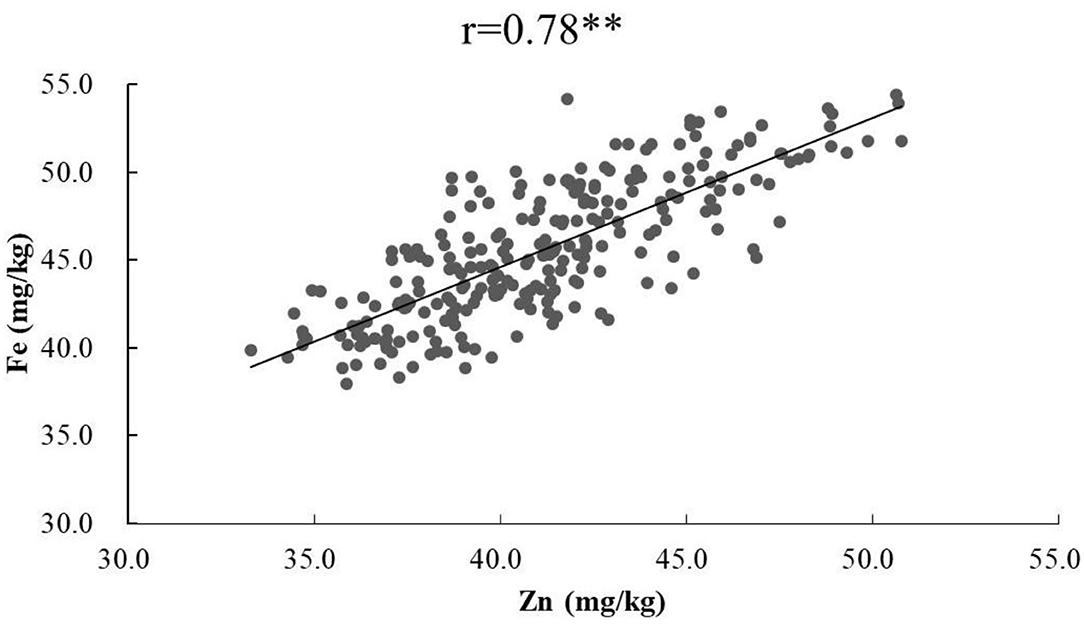
Figure 2. Phenotypic correlation of GZn with GFe based on BLUEs across nine environments in the Jingdong 8/Bainong AK58 RIL population.
Linkage Map Construction
Among 54,680 SNP markers in the 50K SNP array, 20,060 were polymorphic after removal of markers that were monomorphic, absent in more than 20% of assays, and minor allele frequency was <30%. A high-density linkage map spanning 3423 cM and including all 21 chromosomes was constructed using 3328 representative SNP markers of each bin. The average chromosome length was 163 cM, ranging from 116.72 cM (1B) to 237.40 cM (5A) (Supplementary Table 2).
QTL Mapping of GZn and GFe using ICIM and MCIM
Seven QTL for GZn were mapped on chromosomes 1DS, 2AS, 3BS, 4DS, 6AS, 6DL, and 7BL, explaining 2.2–25.1% of the phenotypic variances (Table 4, Supplementary Table 3, and Figure 3), with five favorable alleles coming from Jingdong 8, and with the other two, i.e., QZn.caas-1DS and QZn.caas-3BS, coming from Bainong AK58. Four QTL for GFe were detected on chromosomes 3BL, 4DS, 6AS, and 7BL, explaining 2.3–30.4% of the phenotypic variances (Table 4, Supplemenatry Table 3, and Figure 3), with all superior alleles coming from Jingdong 8. Among these QTL, three were identified for both GZn and GFe at the same or overlapping location on chromosomes 4DS, 6AS, and 7BL.
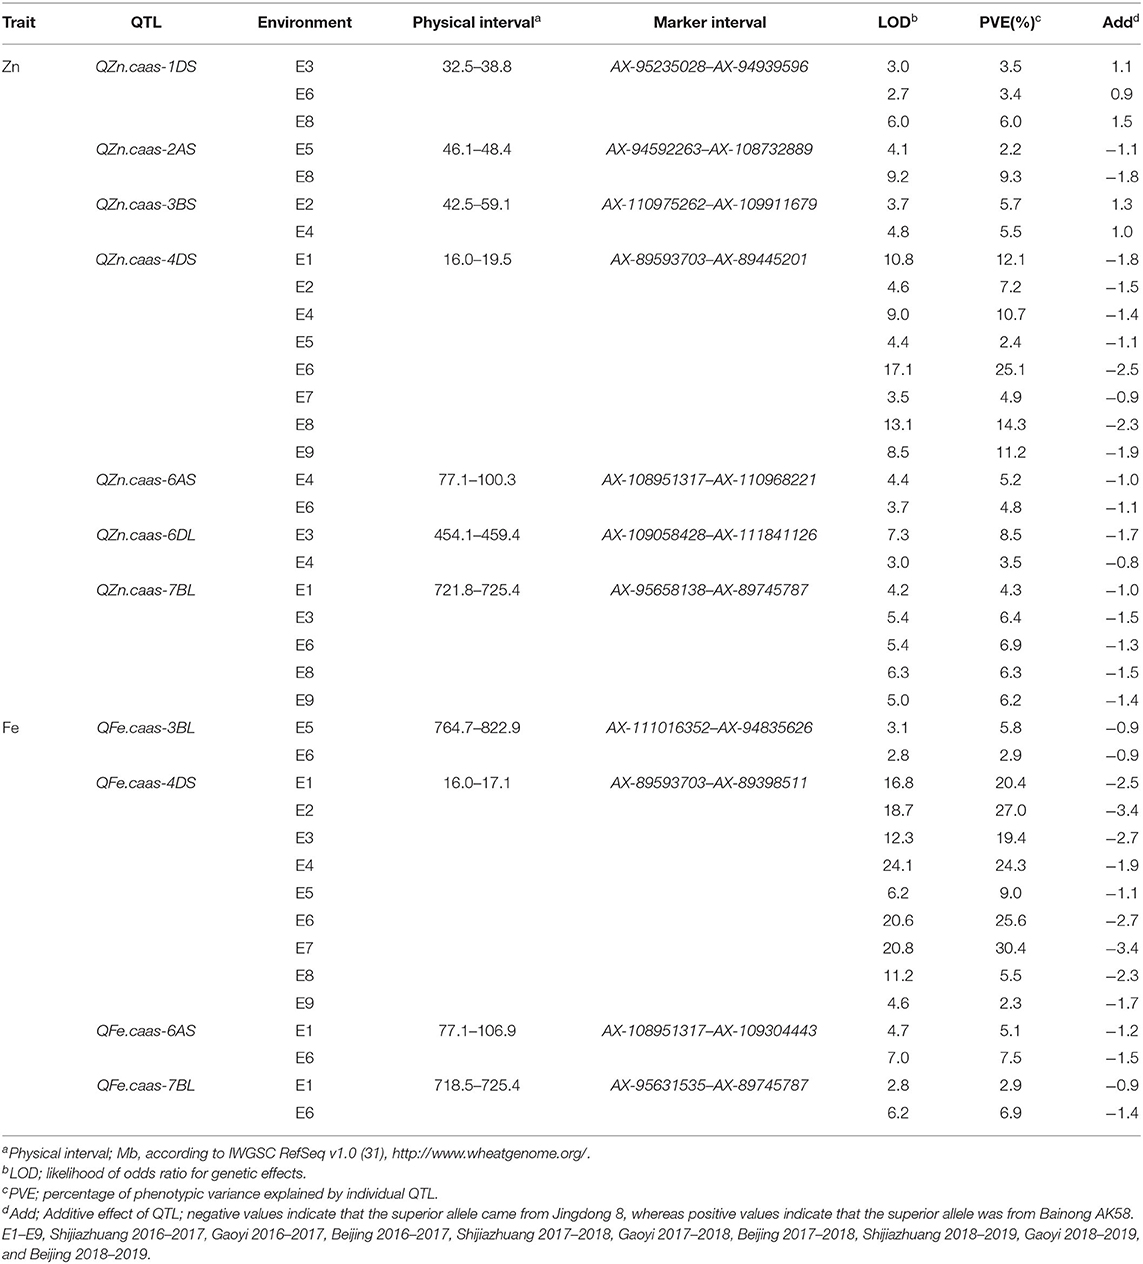
Table 4. QTL for GZn and GFe identified by inclusive composite interval mapping in the Jingdong 8/Bainong AK58 RIL population.
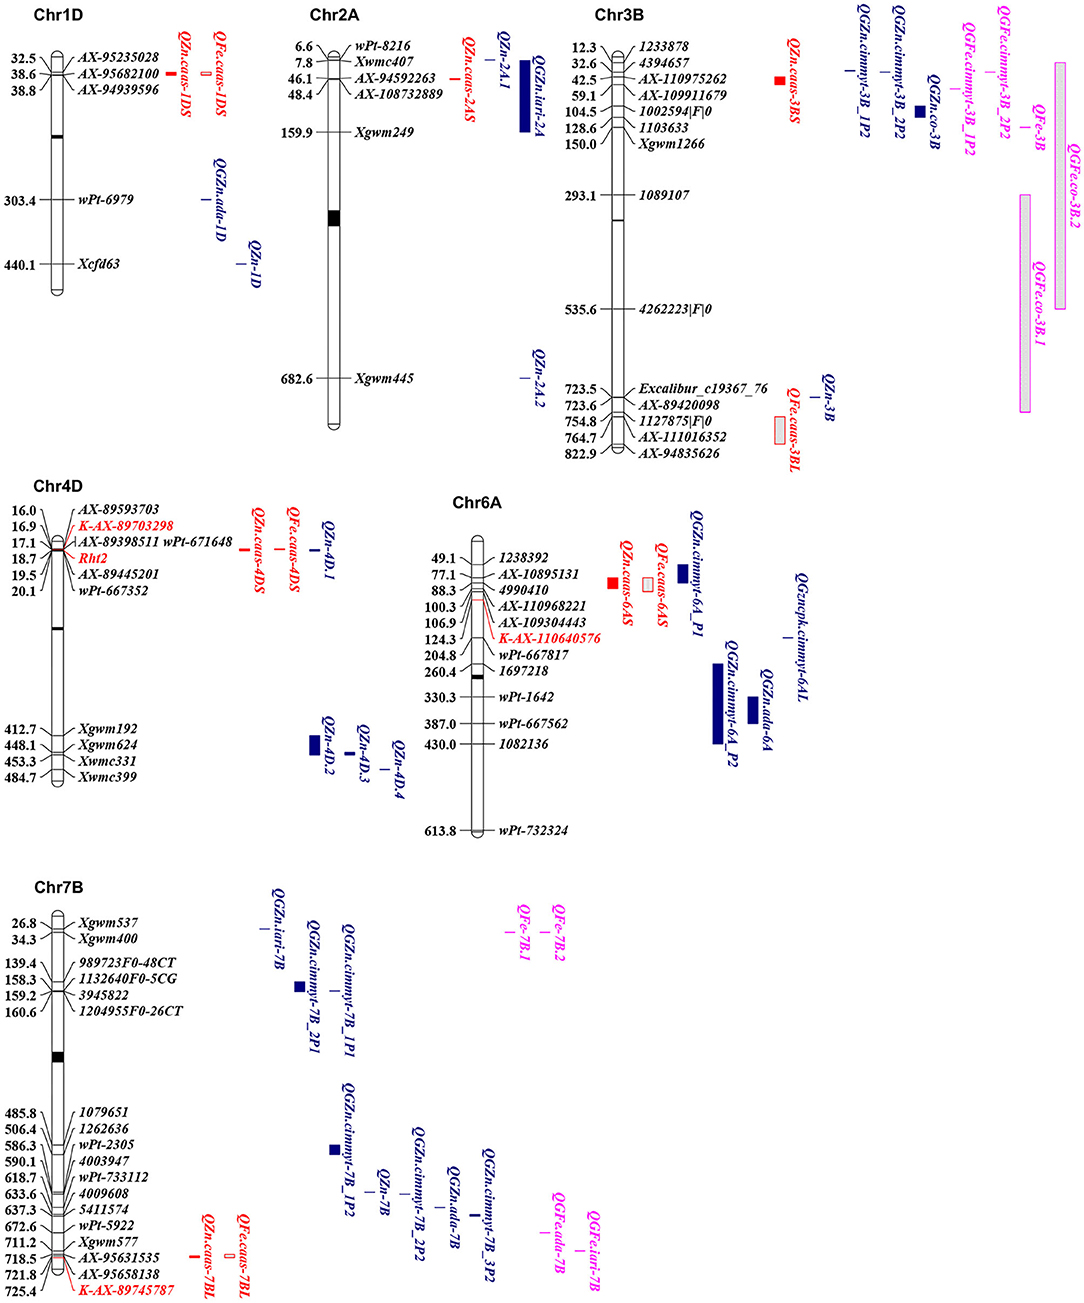
Figure 3. Physical maps for the positional comparisons of GZn and GFe QTL reported on chromosomes 1DS, 2AS, 3BL, 4DS, 6AS, and 7BL with those identified in the present study. QTL linked markers are shown on the right, physical positions are shown on the left, and centromere is shown in the middle (black bar). KASP markers developed in the present study were shown in red. QTL for GZn and GFe in the present study were in red; QTL for GZn in previous studies were in blue; QTL for GFe in previous studies were in purple.
Three chromosomal intervals were detected using MCIM including 4DS, 6AS, and 7BL, corresponding to co-localized QTL for GZn and GFe by ICIM-ADD (Table 5). Two intervals on chromosomes 4DS and 6AS were detected in most environments for GZn and GFe, while the one on chromosome 7BL was found in most environments for GZn but only one environment for GFe.
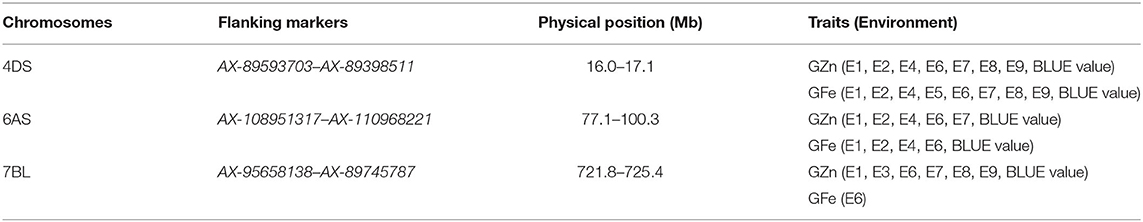
Table 5. Chromosomal intervals for GZn and GFe identified by multi-trait composite interval mapping (MCIM).
QTL Pyramids and Validation
It indicated that superior alleles of pleiotropic QTL on 4DS, 6AS, and 7BL were all from Jingdong 8. Accumulation effect of the three co-localization QTL for GZn and GFe was calculated based on the closely linked markers. The average concentration of GZn increased from 37.79 to 44.43 mg/kg and that of GFe increased from 41.02 to 50.37 mg/kg, with lines containing zero to three favorable alleles (Supplementary Figure 1).
Flanking SNPs closely linked to the QTL on chromosomes 4DS and 7BL and a SNP near QTL region of 6AS were converted to KASP markers and validated in the germplasm panel (Tables 6, 7). Cultivars with the same superior allele as Jingdong 8 had significantly higher GZn and GFe than those with the inferior allele from Bainong AK58 for all QTL, except for QFe.caas-6AS. The difference between the superior and inferior allele of the QTL on chromosomes 4DS, 6AS, and 7BL was 1.7, 2.8, and 3.5 mg/kg for GZn and 1.4, 1.0, and 4.7 mg/kg for GFe, respectively (Table 7).
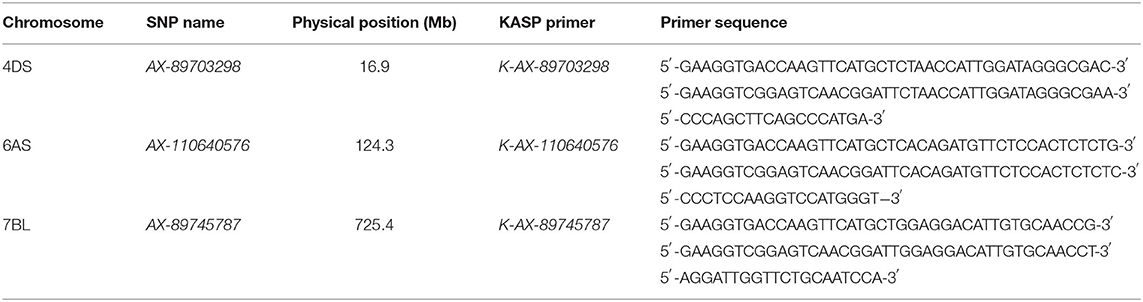
Table 6. Kompetitive allele specific PCR (KASP) markers converted from single-nucleotide polymorphisms (SNPs) tightly linked to identified QTL on three chromosomes.
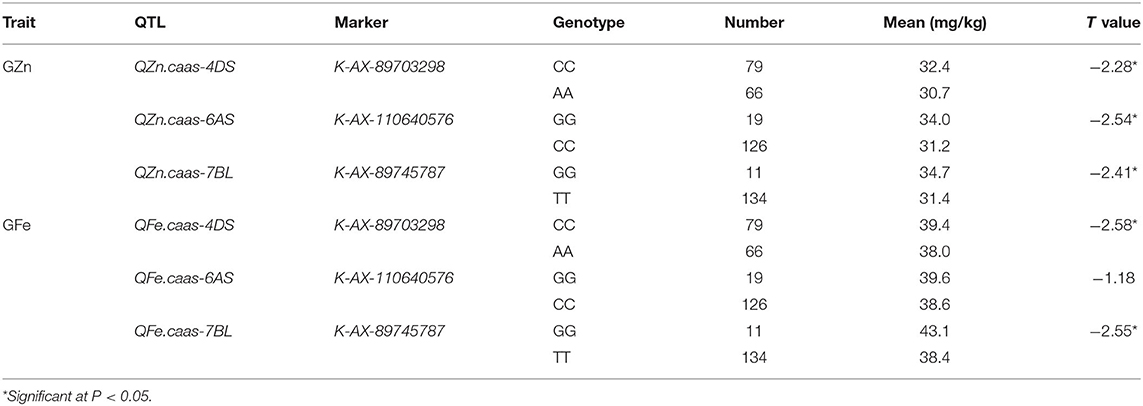
Table 7. Mean values of GZn and GFe for genotype classes in the germplasm panel.
Discussion
Comparisons With Previous Reports
In this study, QTL for GZn and GFe were mapped on chromosomes 1D, 2A, 3B, 4D, 6A, 6D, and 7B, and on chromosomes 3B, 4D, 6A, and 7B, respectively. Previously identified QTL are summarized in Supplementary Table 1 and partly shown in Figure 3. In addition to consensus maps, the IWGSC RefSeq v1.0 Chinese Spring reference sequence (31) was used for comparisons of QTL identified in different studies.
QZn.caas-1DS
QZn.caas-1DS, flanked by SNP markers AX-95235028 and AX-94939596 at 32.5–38.8 Mb, was detected in three environments. Velu et al. (18) identified QGZn.ada-1D linked with a DArT marker wPt-6979 at 303.4 Mb. Gorafi et al. (32) detected a QTL linked with SSR marker Xcfd63 at physical position 440 Mb. The present QTL appears to be new.
QZn.caas-2AS
QZn.caas-2AS, flanked by AX-94592263 and AX-108732889 at physical positions of 46.1 and 48.4 Mb, was identified in two environments. Peleg et al. (33) identified QZn-2A.1 and QZn-2A.2 linked with wPt-8216 and Xgwm445 at 6.6 and 682.6 Mb, respectively. Krishnappa et al. (34) mapped QGZn.iari-2A flanking by Xwmc407 and Xgwm249 at physical position 28.2 and 159.9 Mb, respectively. QZn.caas-2AS detected in the present study was located within the region of QGZn.iari-2A; therefore, these two QTL may be the same.
QZn.caas-3BS
QZn.caas-3BS, flanked by AX-110975262 and AX-109911679 at physical positions of 42.5 and 59.1 Mb, was detected in two environments. Crespo-Herrera et al. (17) identified two QTL for GZn on this chromosome. QGZn.cimmyt-3B_2P2 was at the physical position 32.6 Mb linked with DArT markers 4394657, and QGZn.cimmyt-3B_1P2 flanked by 3533713 and 1007339 is much more near the distal end of 3BS than QGZn.cimmyt-3B_2P2 on the basis of the genetic map, although both markers were not on chromosome 3B with the result of blast. Furthermore, Liu et al. (35) mapped QGZn.co-3B flanked by DArT markers 1002594|F|0 and 1103633 at physical positions of 104.5 and 128.6 Mb, respectively. Alomari et al. (19) identified a locus for GZn on chromosome 3BL, linked with AX-89420098 at 723.5 Mb. Thus, the previous QTL were around 10 Mb from QZn.caas-3BS, indicating that QZn.caas-3BS is likely a new QTL.
QFe.caas-3BL
QFe.caas-3BL, flanked by AX-111016352 and AX-94835626 at physical positions of 764.7 and 822.9 Mb, was detected in two environments. Crespo-Herrera et al. (17) identified two QTL for GFe that were at the similar position as QTL for GZn as mentioned previously, both of which were on the short arm of chromosome 3B. Peleg et al. (33) mapped a QTL on chromosome 3B, closely linked with Xgwm1266 at physical position 150 Mb. Liu et al. (35) identified QGFe.co-3B.1 and QGFe.co-3B.2 flanked by DArT markers 1089107 and 1127875|F|0, 1233878-4262223|F|0 at physical positions 37.2–754.8 and 12.3–536.6 Mb, respectively. These five QTL were at least 10 Mb distant from QFe.caas-3BL. Therefore, QFe.caas-3BL is likely a new QTL for GFe.
QZn.caas-4DS and QFe.caas-4DS
QZn.caas-4DS and QFe.caas-4DS, flanked by AX-89593703 and AX-89445201 at physical positions of 16.0 and 19.5 Mb were detected in eight and nine environments, respectively. Pu et al. (36) identified a QTL for GZn at the same position, flanked by wPt-671648 and wPt-667352 located between 17.1 and 20.1 Mb on chromosome 4D, with reduced height gene Rht2 (Rht-D1b) located in this region. Using a limited number of isogenic lines, Graham et al. (37) found that lower GZn and GFe in wheat was associated with reduced height genes. Velu et al. (38) verified this association using nine bread wheat (Triticum aestivum) and six durum (T. turgidum) isogenic line pairs differing at the Rht1 (Rht-B1) locus and one bread wheat pair differing at the Rht2 locus, indicating that the presence of reduced height genes decreased GZn by 1.9 to 10.0 ppm and GFe by 1.0 to 14.4 ppm. In this study, Bainong AK58 carried Rht2 (Rht-D1b), while Jingdong 8 had rht2 (Rht-D1a) (39). A gene-specific KASP marker K-AX-86170701 was identified for Rht2 (40), and lines with allele from Bainong AK58 had significantly lower GZn and GFe than that with allele from Jingdong 8 (Supplementary Figure 2). Therefore, it was possible that the lower concentrations of Zn and Fe in Bainong AK58 was associated with the Rht2 allele.
QZn.caas-6AS and QFe.caas-6AS
QZn.caas-6AS and QFe.caas-6AS, flanked by AX-108951317 and AX-110968221 at physical positions of 77.1 and 106.9 Mb, were detected in four environments. No QTL for GFe was detected on chromosome 6AS previously, while two QTL for GZn were reported. Crespo-Herrera et al. (17) identified QGZn.cimmyt-6A_P1, linked with 1238392 and 4990410 at physical positions of 49.1 and 88.2 Mb. Hao et al. (16) mapped QGZn.cimmyt-6AL at 204.8 Mb with nearest marker wPt-667817. The present QTL was somewhat near the QGZn.cimmyt-6A_P1, indicating that they might be the same.
QZn.caas-6DL
QZn.caas-6DL, flanked by AX-109058428 and AX-11184112 at physical positions of 454.1 and 459.4 Mb, was detected in two environments. It is likely a new one since no previous QTL for GZn was mapped on this chromosome.
QZn.caas-7BL and QFe.caas-7BL
Markers AX-95631535 and AX-89745787 at positions 718.5 and 725.4 Mb flanking QZn.caas-7BL and QFe.caas-7BL are distally located on chromosome 7BL. Several QTL were previously identified on this chromosome. Krishnappa et al. (34) mapped QGZn.iari-7B with closest marker Xgwm537 at 26.8 Mb. Peleg et al. (33) detected QZn-7B linked with wPt-2305 at 586.3 Mb. Crespo-Herrera et al. (17) identified five QTL, including QGZn.cimmyt-7B_2P1, QGZn.cimmyt-7B_1P1, QGZn.cimmyt-7B_1P2, QGZn.cimmyt-7B_2P2, and QGZn.cimmyt-7B_3P2 at physical positions of 139.4–160.6, 158.3–159.2, 485.8–506.4, 590.1, and 633.6–637.3 Mb, respectively. Velu et al. (18) reported QGZn.ada-7B, which was located at around 618.7 Mb with closely linked marker wPt-733112. All these eight QTL were well proximal (>80 Mb) from the QTL in this study, indicating that QZn.caas-7BL was reported for the first time. In addition, four QTL for GFe were mapped on chromosome 7B, among which two of them were at the same physical position of 34.3 Mb (QFe-7B.1 and QFe-7B.2), and the other two were at 672.6 Mb (QGFe.ada-7B) and 711.2 Mb (QGFe.iari-7B), respectively (18, 28, 29, 41). QGFe.iari-7B and QFe.caas-7BL might be the same, since their distance is <10 Mb.
Pleiotropic Effects of QTL
The co-localization QTL for GZn and GFe on chromosomes 4DS, 6AS, and 7BL might be pleiotropic QTL based on the same or overlapping region detected using MCIM, in agreement with the significant positive phenotypic and genotypic correlations (r = 0.78 ± 0.01 and 0.81 ± 0.03, P <0.01) between GZn and GFe. Gorafi et al. (32) identified a significant and positive phenotypic correlation between GZn and GFe (r = 0.78) and a pleiotropic QTL on chromosome 5D; significant and positive correlations between GZn and GFe were also found in other studies (11, 42). It has been reported that some transporters, chelators, and genes regulated GZn and GFe simultaneously in a high frequency (10, 43). These findings indicated that Zn and Fe could be improved simultaneously in breeding programs targeting mineral biofortification.
Potential Implication in Wheat Breeding
MAS has been applied in crop breeding for more than two decades. Therefore, it would be effective for traits that were controlled by low numbers of major QTL (37). The phenotypic analysis on GZn and GFe was time-consuming and laborious, indicating that identification of molecular markers linked to GZn and GFe would be of interest for improvement of nutritional quality in wheat. In the present study, pleiotropic QTL on chromosomes 4D, 6A, and 7B were detected in multiple environments. SNP markers linked to some of these QTL were converted to KASP markers, and the QTL were verified in a germplasm panel, indicating potential application in wheat breeding programs.
Data Availability Statement
The original contributions presented in the study are included in the article and/or Supplementary Material, further inquiries can be directed to the corresponding authors.
Author Contributions
YoZ and ZH conceived the idea. YW and XXu conducted the experiments, analyzed the data, and prepared the manuscript. YeZ, YL, ZP, YT, and DX contributed to mapping population development, phenotyping and statistical analysis. XXi and YH assisted in writing and revising the manuscript. All authors contributed to the article and approved the submitted version.
Funding
This study was supported by the Agricultural Science and Technology Innovation Program of CAAS (CAAS-XTCX20190025-2, CAAS-ZDRW202002, and CAAS-S2021ZD04).
Conflict of Interest
The authors declare that the research was conducted in the absence of any commercial or financial relationships that could be construed as a potential conflict of interest.
Acknowledgments
The authors are very grateful to Prof. R.A. McIntosh, Plant Breeding Institute, University of Sydney, Australia, for reviewing this manuscript.
Supplementary Material
The Supplementary Material for this article can be found online at: https://www.frontiersin.org/articles/10.3389/fnut.2021.680391/full#supplementary-material
References
1. Sharma S, Chunduri V, Kumar A, Kumar R, Khare P, Kondepudi KK, et al. Anthocyanin bio-fortified colored wheat: nutritional and functional characterization. PLoS ONE. (2018) 13:e0194367. doi: 10.1371/journal.pone.0194367
2. Shah D, Sachdev HPS. Zinc deficiency in pregnancy and fetal outcome. Nutr Rev. (2006) 64:15–30. doi: 10.1111/j.1753-4887.2006.tb00169.x
3. Wessells KR, Brown KH. Estimating the global prevalence of zinc deficiency: results based on zinc availability in national food supplies and the prevalence of stunting. PLoS ONE. (2012) 7:e50568. doi: 10.1371/journal.pone.0050568
4. Black RE, Victora CG, Walker SP, Bhutta ZA, Christian P, de Onis M, et al. Maternal and child undernutrition and overweight in low-income and middle-income countries. Lancet. (2013) 382:427–51. doi: 10.1016/S0140-6736(13)60937-X
5. Bouis HE, Welch RM. Biofortification—A sustainable agricultural strategy for reducing micronutrient malnutrition in the global south. Crop Sci. (2010) 50:S20–32. doi: 10.2135/cropsci2009.09.0531
6. Sands DC, Morris CE, Dratz EA, Pilgeram AL. Elevating optimal human nutrition to a central goal of plant breeding and production of plant-based foods. Plant Sci. (2009) 177:377–89. doi: 10.1016/j.plantsci.2009.07.011
7. Deshpande J, Joshi M, Giri P. Zinc: the trace element of major importance in human nutrition and health. Int J Med Sci. (2013) 2:1–6. doi: 10.5455/ijmsph.2013.2.1-6
8. Stoltzfus RJ. Defining iron-deficiency anemia in public health terms: a time for reflection. J Nutr. (2001) 131:565S−7. doi: 10.1093/jn/131.2.565S
9. Crespo-Herrera LA, Velu G, Singh RP. Quantitative trait loci mapping reveals pleiotropic effect for grain iron and zinc concentrations in wheat. Ann Appl Biol. (2016) 169:27–35. doi: 10.1111/aab.12276
10. Tong J, Sun M, Wang Y, Zhang Y, Rasheed A, Li M, et al. Dissection of molecular processes and genetic architecture underlying iron and zinc homeostasis for biofortification: from model plants to common wheat. Int J Mol. Sci. (2020) 21:9280. doi: 10.3390/ijms21239280
11. Morgounov A, Gómez-Becerra HF, Abugalieva A, Dzhunusova M, Yessimbekova M, Muminjanov H, et al. Iron and zinc grain density in common wheat grown in Central Asia. Euphytica. (2007) 155:193–203. doi: 10.1007/s10681-006-9321-2
12. Tiwari VK, Rawat N, Chhuneja P, Neelam K, Aggarwal R, Randhawa GS, et al. Mapping of quantitative trait loci for grain iron and zinc concentration in diploid A genome wheat. J Hered. (2009) 100:771–6. doi: 10.1093/jhered/esp030
13. Zhang Y, Song Q, Yan J, Tang J, Zhao R, Zhang Y, et al. Mineral element concentrations in grains of Chinese wheat cultivars. Euphytica. (2010) 174:303–13. doi: 10.1007/s10681-009-0082-6
14. Srinivasa J, Arun B, Mishra VK, Singh GP, Velu G, Babu R, et al. Zinc and iron concentration QTL mapped in a Triticum spelta×T. aestivum cross. Theor Appl Genet. (2014) 127:1643–51. doi: 10.1007/s00122-014-2327-6
15. Velu G, Ortiz-Monasterio I, Cakmak I, Hao Y, Singh RP. Biofortification strategies to increase grain zinc and iron concentrations in wheat. J Cereal Sci. (2014) 59:365–72. doi: 10.1016/j.jcs.2013.09.001
16. Hao Y, Velu G, Peña RJ, Singh S, Singh RP. Genetic loci associated with high grain zinc concentration and pleiotropic effect on kernel weight in wheat (Triticum aestivum L.). Mol Breeding. (2014) 34:1893–902. doi: 10.1007/s11032-014-0147-7
17. Crespo-Herrera LA, Govindan V, Stangoulis J, Hao Y, Singh RP. QTL Mapping of grain Zn and Fe concentrations in two hexaploid wheat RIL populations with ample transgressive segregation. Front Plant Sci. (2017) 8:1800. doi: 10.3389/fpls.2017.01800
18. Velu G, Tutus Y, Gomez-Becerra HF, Hao Y, Demir L, Kara R, et al. QTL mapping for grain zinc and iron concentrations and zinc efficiency in a tetraploid and hexaploid wheat mapping populations. Plant Soil. (2017) 411:81–99. doi: 10.1007/s11104-016-3025-8
19. Alomari DZ, Eggert K, von Wirén N, Alqudah AM, Polley A, Plieske J, et al. Identifying candidate genes for enhancing grain Zn concentration in wheat. Front Plant Sci. (2018) 9:1313. doi: 10.3389/fpls.2018.01313
20. Zarcinas BA, Cartwright B, Spouncer LR. Nitric acid digestion and multi-element analysis of plant material by inductively coupled plasma spectrometry. Soil Sci Plant Anal. (1987) 18:131–46. doi: 10.1080/00103628709367806
21. Paltridge NG, Milham PJ, Ortiz-Monasterio JI, Velu G, Yasmin Z, Palmer LJ, et al. Energy-dispersive X-ray fluorescence spectrometry as a tool for zinc, iron and selenium analysis in whole grain wheat. Plant Soil. (2012) 361:261–9. doi: 10.1007/s11104-012-1423-0
22. Holland JB, Nyquist WE, Cervantes-Matinez CT. Estimating and interpreting heritability for plant breeding: an update. Plant Breed Rev. (2003) 22:9–111. doi: 10.1002/9780470650202.ch2
24. Doyle J, Doyle JL. A rapid DNA isolation procedure from small quantities of fresh leaf tissues. Phytochem Bull. (1987) 19:11–5.
25. Stam P (1993) Construction of integrated genetic linkage maps by means of a new computer package: join Map. Plant J. (1993) 3:739–744. doi: 10.1111/j.1365-313X.1993.00739.x
26. Jiang CJ, Zeng ZB. Multiple trait analysis of genetic mapping for quantitative trait loci. Genetics. (1995) 140:1111–27. doi: 10.1093/genetics/140.3.1111
28. Voorrips RE. MapChart: software for the graphical presentation of linkage maps and QTLs. J Hered. (2002) 93:77–78. doi: 10.1093/jhered/93.1.77
29. Chandra S, Singh D, Pathak J, Kumari S, Kumar M, Poddar R, et al. SNP discovery from next-generation transcriptome sequencing data and their validation using KASP assay in wheat (Triticum aestivum L.). Mol Breeding. (2017) 37:92. doi: 10.1007/s11032-017-0696-7
30. Jia A, Ren Y, Gao F, Yin G, Liu J, Guo L, et al. Mapping and validation of a new QTL for adult-plant resistance to powdery mildew in Chinese elite bread wheat line Zhou8425B. Theor Appl Genet. (2018) 131:1063–71. doi: 10.1007/s00122-018-3058-x
31. Appels R, Eversole K, Stein N, Feuillet C, Keller B, Rogers J, et al. Shifting the limits in wheat research and breeding using a fully annotated reference genome. Science. (2018) 361:eaar7191. doi: 10.1126/science.aar7191
32. Gorafi YSA, Ishii T, Kim J-S, Elbashir AAE, Tsujimoto H. Genetic variation and association mapping of grain iron and zinc contents in synthetic hexaploid wheat germplasm. Plant Genet Resour. (2018) 16:9–17. doi: 10.1017/S1479262116000265
33. Peleg Z, Cakmak I, Ozturk L, Yazici A, Jun Y, Budak H, et al. Quantitative trait loci conferring grain mineral nutrient concentrations in durum wheat × wild emmer wheat RIL population. Theor Appl Genet. (2009) 119:353–69. doi: 10.1007/s00122-009-1044-z
34. Krishnappa G, Singh AM, Chaudhary S, Ahlawat AK, Singh SK, Shukla RB, et al. Molecular mapping of the grain iron and zinc concentration, protein content and thousand kernel weight in wheat (Triticum aestivum L.). PLoS ONE. (2017) 12:e0174972. doi: 10.1371/journal.pone.0174972
35. Liu J, Wu B, Singh RP, Velu G. QTL mapping for micronutrients concentration and yield component traits in a hexaploid wheat mapping population. J Cereal Sci. (2019) 88:57–64. doi: 10.1016/j.jcs.2019.05.008
36. Pu ZE, Yu M, He QY, Chen GY, Wang JR, Liu YX, et al. Quantitative trait loci associated with micronutrient concentrations in two recombinant inbred wheat lines. J Integr Agric. (2014) 13:2322–9. doi: 10.1016/S2095-3119(13)60640-1
37. Graham R, Senadhira D, Beebe S, Iglesias C, Monasterio I. Breeding for micronutrient density in edible portions of staple food crops: conventional approaches. Field Crops Res. (1999) 60:57–80. doi: 10.1016/S0378-4290(98)00133-6
38. Velu G, Singh RP, Huerta J, Guzmán C. Genetic impact of Rht dwarfing genes on grain micronutrients concentration in wheat. Field Crops Res. (2017) 214:373–7. doi: 10.1016/j.fcr.2017.09.030
39. Li X, Xia X, Xiao Y, He Z, Wang D, Trethowan R, et al. QTL mapping for plant height and yield components in common wheat under water-limited and full irrigation environments. Crop Pasture Sci. (2015) 66:660–70. doi: 10.1071/CP14236
40. Rasheed A, Wen W, Gao F, Zhai S, Jin H, Liu J, et al. Development and validation of KASP assays for genes underpinning key economic traits in bread wheat. Theor Appl Genet. (2016) 129:1843–60. doi: 10.1007/s00122-016-2743-x
41. Shi RL, Tong YP, Jing RL, Zhang FS, Zou CQ. Characterization of quantitative trait loci for grain minerals in hexaploid wheat (Triticum aestivum L.). J Integr Agric. (2013) 12:1512–21. doi: 10.1016/S2095-3119(13)60559-6
42. Zhao FJ, Su YH, Dunham SJ, Rakszegi M, Bedo Z, McGrath SP, et al. Variation in mineral micronutrient concentrations in grain of wheat lines of diverse origin. J Cereal Sci. (2009) 49:290–5. doi: 10.1016/j.jcs.2008.11.007
Keywords: Triticum aestivum, mineral biofortification, quantitative trait locus, 50K SNP array, KASP marker
Citation: Wang Y, Xu X, Hao Y, Zhang Y, Liu Y, Pu Z, Tian Y, Xu D, Xia X, He Z and Zhang Y (2021) QTL Mapping for Grain Zinc and Iron Concentrations in Bread Wheat. Front. Nutr. 8:680391. doi: 10.3389/fnut.2021.680391
Received: 14 March 2021; Accepted: 20 April 2021;
Published: 09 June 2021.
Edited by:
Velu Govindan, International Maize and Wheat Improvement Center, MexicoReviewed by:
Peipei Zhang, Agricultural University of Hebei, ChinaRaja Khanal, Agriculture and Agri-Food Canada, Canada
Copyright © 2021 Wang, Xu, Hao, Zhang, Liu, Pu, Tian, Xu, Xia, He and Zhang. This is an open-access article distributed under the terms of the Creative Commons Attribution License (CC BY). The use, distribution or reproduction in other forums is permitted, provided the original author(s) and the copyright owner(s) are credited and that the original publication in this journal is cited, in accordance with accepted academic practice. No use, distribution or reproduction is permitted which does not comply with these terms.
*Correspondence: Zhonghu He, aGV6aG9uZ2h1MDJAY2Fhcy5jbg==; Yong Zhang, emhhbmd5b25nMDVAY2Fhcy5jbg==
†These authors have contributed equally to this work