
94% of researchers rate our articles as excellent or good
Learn more about the work of our research integrity team to safeguard the quality of each article we publish.
Find out more
ORIGINAL RESEARCH article
Front. Nutr., 15 June 2021
Sec. Nutrition and Food Science Technology
Volume 8 - 2021 | https://doi.org/10.3389/fnut.2021.669444
This article is part of the Research TopicWheat Biofortification to Alleviate Global MalnutritionView all 11 articles
 Gopalareddy Krishnappa1,2
 Nagenahalli Dharmegowda Rathan1
 Deepmala Sehgal3
 Arvind Kumar Ahlawat1
 Santosh Kumar Singh1†
 Sumit Kumar Singh1
 Ram Bihari Shukla1
 Jai Prakash Jaiswal4
 Ishwar Singh Solanki5
 Gyanendra Pratap Singh1†
 Anju Mahendru Singh1*
Micronutrient and protein malnutrition is recognized among the major global health issues. Genetic biofortification is a cost-effective and sustainable strategy to tackle malnutrition. Genomic regions governing grain iron concentration (GFeC), grain zinc concentration (GZnC), grain protein content (GPC), and thousand kernel weight (TKW) were investigated in a set of 163 recombinant inbred lines (RILs) derived from a cross between cultivated wheat variety WH542 and a synthetic derivative (Triticum dicoccon PI94624/Aegilops tauschii [409]//BCN). The RIL population was genotyped using 100 simple-sequence repeat (SSR) and 736 single nucleotide polymorphism (SNP) markers and phenotyped in six environments. The constructed genetic map had a total genetic length of 7,057 cM. A total of 21 novel quantitative trait loci (QTL) were identified in 13 chromosomes representing all three genomes of wheat. The trait-wise highest number of QTL was identified for GPC (10 QTL), followed by GZnC (six QTL), GFeC (three QTL), and TKW (two QTL). Four novel stable QTL (QGFe.iari-7D.1, QGFe.iari-7D.2, QGPC.iari-7D.2, and QTkw.iari-7D) were identified in two or more environments. Two novel pleiotropic genomic regions falling between Xgwm350–AX-94958668 and Xwmc550–Xgwm350 in chromosome 7D harboring co-localized QTL governing two or more traits were also identified. The identified novel QTL, particularly stable and co-localized QTL, will be validated to estimate their effects on different genetic backgrounds for subsequent use in marker-assisted selection (MAS). Best QTL combinations were identified by the estimation of additive effects of the stable QTL for GFeC, GZnC, and GPC. A total of 11 RILs (eight for GZnC and three for GPC) having favorable QTL combinations identified in this study can be used as potential donors to develop bread wheat varieties with enhanced micronutrients and protein.
Wheat (Triticum spp.) is a major staple cereal crop contributing about 20% calories to the diet and at least 30% of Fe and Zn intake worldwide. Even though it has the highest levels of micronutrients among the three major cereals viz., wheat, rice, and maize, most wheat-based diets fail to deliver the required quantity of essential nutrients, such as iron and zinc. Malnutrition due to insufficient intake of micronutrients, such as iron and zinc, has been recognized as one of the major global health issues affecting nearly three billion people across the globe. The intensity of the risk is high in nations dominated by cereal-based diets (1). Around 25% of the global population is affected by anemia because of Fe deficiency (2), and the leading risk groups for this global public health concern are children 0–5 years of age, and pregnant and lactating women. Anemic complex due to severe iron deficiency leads to several life-threatening diseases, namely, chronic kidney and heart failure, and inflammatory bowel disease (3).
Zinc is an essential element for a wide range of biochemical and immunological functions, and acute zinc deficiency leads to major health difficulties, such as altered growth and development, immunity, pregnancy, and neurobehavioral adversities (4). Estimates indicate that around 17% of the global population suffers from zinc deficiency-related diseases (5). Grain protein quantity and quality determine both the nutritional and end-product quality of wheat. Lack of secondary immunity due to protein energy malnutrition (PEM) is one of the common causes of several infections in humans. Acute PEM in children is clinically defined as marasmus (chronic wasting) or kwashiorkor (edema and anemia) (6). Chronic PEM in children results in impaired cognitive development (7). Micronutrient malnutrition and PEM are leading risk factors for health loss in developing countries, with pregnant women and young children forming the most vulnerable groups (8).
Micronutrient and protein malnutrition can be overcome by consuming nutrient-rich diverse diet and/or by supplementation and fortification. However, the majority of populations in which the malnutrition problem is alarming may not be able to afford either of the two options, particularly the remote rural poor (9). Moreover, these interventions are not sustainable. Enhancing the nutritive levels of crop plants by conventional and molecular breeding approaches, termed as “biofortification,” has been recognized as a cost-effective and sustainable approach to reduce global protein and micronutrient malnutrition. Currently, the development of biofortified crop varieties in many countries has gained momentum, particularly after reaching self-sufficiency in food grains.
Grain mineral density depends on a plethora of physiological and biochemical processes, such as mineral absorption, translocation, redistribution, and remobilization to the sink, which makes micronutrient accumulation in grain a complex trait (10). Therefore, breeding programs need to be re-oriented to broaden the genetic base using wild relatives and landraces, and dissecting the genetic basis of these nutritional quality traits (11). Landraces are one of the most important sources of wheat biofortification with high levels of micronutrients (12). Conventional breeding approaches have been successfully used to incorporate higher grain zinc content into elite breeding materials by crossing high-yielding elite wheat lines with A tauschii-based synthetic hexaploid wheats or Triticum spelta accessions (13). Substitution lines of the 6B chromosome obtained from Triticum dicoccoides are one of the most common genetic resources to improve zinc concentration in wheat (14). The Gpc-B1 locus mapped on the short arm of the 6B chromosome, derived from T dicoccoides, has a pleiotropic effect on zinc and iron in addition to grain protein (15). An NAC transcription factor (NAM-B1) encoded by Gpc-B1 is responsible for the increase in zinc as well as iron levels, possibly by stimulating leaf senescence, and thus remobilization of zinc and iron from flag leaves into seeds (16). Synthetic wheat derived from Ae. tauschii contains higher grain zinc and can act as a valuable genetic resource to increase the grain zinc levels of cultivated wheat (17).
Genetic dissection of complex nutritional traits is important for their improvement through marker-assisted selection (MAS). Identification of tightly linked molecular markers to the genomic regions governing the traits would help in the improvement of otherwise difficult to breed complex traits like protein and micronutrients. Reports have indicated significant effects of the environment and genotype-by-environment interaction (GEI) in the expression of PC and TKW (18–23), iron, and zinc (19, 24, 25). Molecular mapping of polygenic traits by identifying quantitative trait loci (QTL) harboring genes for protein, micronutrient, and TKW would allow plant breeders to more efficiently develop biofortified cultivars.
QTL have been identified for grain iron (19, 26–38), grain zinc (13, 19, 27–33, 35–41), grain protein content (19, 27, 31, 35, 36, 42–50), and thousand kernel weight (19, 27, 29, 45, 51–54). However, most investigations on mapping nutritional quality have exploited low-density maps, which have resulted in large interval QTL that have rarely been exploited in breeding.
Previous mapping of the same RIL population was carried out with 136 polymorphic SSR markers, which led to the identification of 16 QTL for four traits (55). The linkage map was coarse because of low marker frequency per chromosome ranging from 6 (1A and 2A) to 11 markers per chromosome (7B). Also, no QTL were mapped on the D genome because of low marker coverage. In this study, a 35K SNP chip was used for genotyping the RIL population, and a combined dataset of SSR and SNP markers was used to identify QTL for nutritional traits.
A set of 286 RILs from a cross between Indian bread wheat variety WH 542 and a synthetic derivative (T. dicoccon PI94624/Ae. tauschii [409]//BCN) received from CIMMYT (International Maize and Wheat Improvement Center), Mexico, was used in the earlier mapping study with SSR markers (55). A subset of 163 randomly selected RILs from this population was used for this investigation.
The details of field experimentation, sample collection, and phenotyping have been described in detail in the earlier study (55). The phenotypic data for GFeC, GZnC, GPC, and TKW recorded for the earlier study were converted into the best linear unbiased predictors (BLUPs) and used in this study. Phenotypic correlations among traits, heritability, and ANOVA were conducted using the MetaRv6.0 (Multi Environment Trial Analysis with R) software. BLUPs of each RIL obtained for an individual year and combined across years were used further in QTL analysis. Phenotypic data of all the six environments are presented as Supplementary Table 1.
RILs and parental genomic DNA were extracted from the leaves of 21-day-old seedlings by following the CTAB method of Murray and Thompson (56).
The 163 RILs and parental lines were genotyped using Axiom Wheat Breeder's Genotyping Array (Affymetrix, Santa Clara, CA, United States) with 35,143 SNPs (https://www.cerealsdb.uk.net).
A total of 714 SSR markers (57, 58) were used for the parental polymorphism survey. These selected 714 SSRs cover all the chromosome arms of the bread wheat genome. Polymorphic markers and genotypic data are presented as Supplementary Table 2.
Monomorphic markers between the two parents and markers with more than 30% missing data and minor allele frequency ≤ 5 and ≥95% were eliminated. Furthermore, markers that showed significant segregation distortion (p < 0.0001) from the expected 1:1 ratio and redundant markers were discarded using bin function in QTL ICIM Mapping v4.2. Finally, a high-quality filtered set of 836 informative markers (736 SNPs + 100 SSRs) was utilized for the QTL analysis.
Both linkage and QTL analysis were conducted with the IciMapping v4.2 software (http://www.isbreeding.net). The chromosome location of SNP inferred by BLAST of the sequences and previously mapped SSR markers (55) was used as the anchoring information. A LOD threshold of 3 was specified for grouping the markers. After all the markers were correctly grouped, they were ordered using the k-Optimality algorithm. Then, Rippling was done to fine-tune the ordered chromosomes in the linkage groups using a 5 cM window size. ICIM-ADD method was employed, which conducts inclusive composite interval mapping for identifying QTL. Missing phenotypic data were considered as deletion during QTL mapping and a relaxed threshold LOD score of 2.5 was specified for declaring significant QTL.
An in silico search of candidate genes was performed in the Ensemble Plants database (http://plants.ensembl.org/index.html) of the bread wheat genome with the Basic Local Alignment Search Tool (BLAST) using default parameters. The sequences of the markers present within the peak of the QTL and the flanking markers were used to conduct the search.
The heritability and variance components of GFeC, GZnC, GPC, and TKW in a RIL population are presented in Table 1. Parents were contrasting for all the studied traits and P2 was superior over P1 with 43, 31, 26, and 23%, respectively, for GFeC, GZnC, GPC, and TKW. Environment-wise heritability ranged from 0.54 (GFeC at GBPUA&T_Y1) to 0.96 (TKW at ICAR-IARI_Y2 and GBPUA&T_Y2) across the traits. The lowest pooled heritability was observed for GZnC (0.77), whereas, highest pooled heritability was recorded for TKW (0.91). Trait heritability corroborates the variance components; GZnC (6.87%) and TKW (4.57%) recorded the highest and lowest CV, respectively. The genotypic variance was highly significant for all the studied traits across the environments. The environment-wise pooled mean is also represented graphically in Figure 1. All the studied traits exhibited a near-normal distribution (Figure 2). Genetic correlation coefficients among GFeC, GZnC, GPC, and TKW are presented in Table 2. All the associations among the studied traits are positive and significant, except, between TKW and GPC in the Pusa Bihar_Y1 (rg = −0.03) and Pusa Bihar_Y2 environments (0.1) (Table 2).
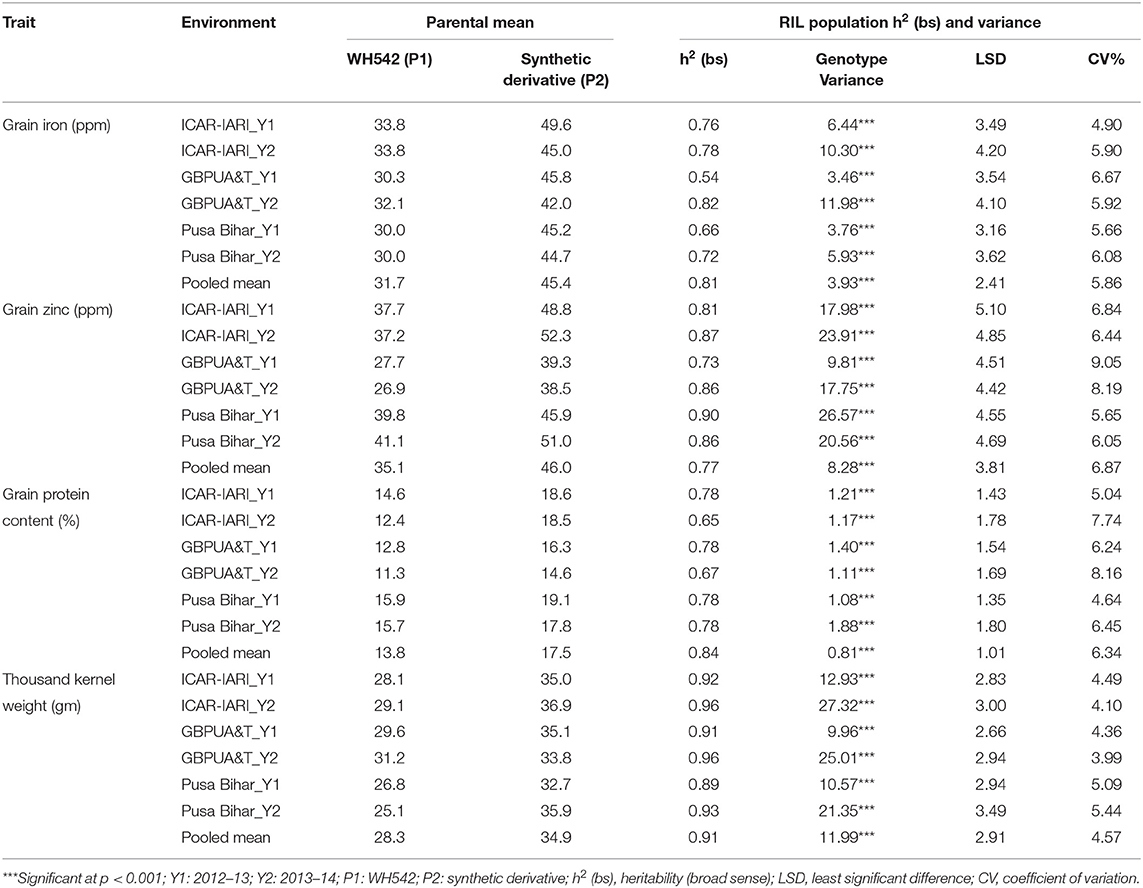
Table 1. Heritability and variance components of grain iron, zinc, protein, and thousand kernel weight in RIL population grown across three locations for 2 years.
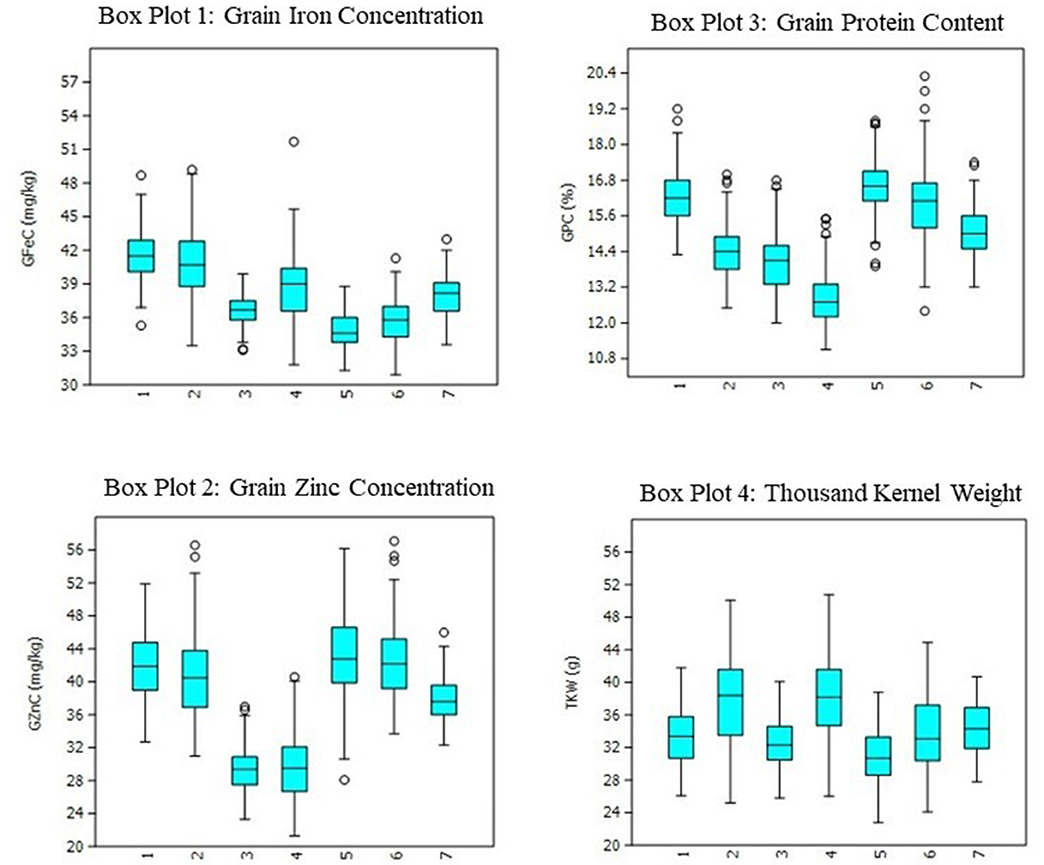
Figure 1. Boxplots for grain iron, zinc, protein, and thousand kernel weight in RIL population grown across three locations for 2 years. 1: ICAR-IARI_Y1; 2: ICAR-IARI_Y2; 3: GBPUA&T_Y1; 4: GBPUA&T_Y2: 5: Pusa Bihar_Y1; 6: Pusa Bihar_Y2; 7: Pooled mean.
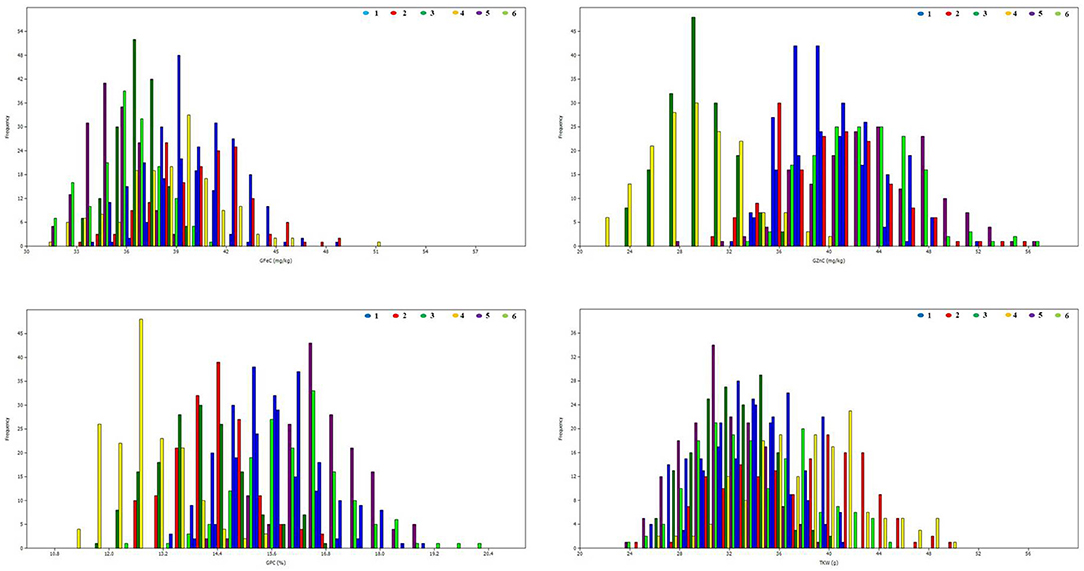
Figure 2. Frequency distributions for grain iron, zinc, protein, and thousand kernel weight in RIL population grown across three locations for 2 years. 1: ICAR-IARI_2012–13; 2: ICAR-IARI_2013–14; 3: GBPUA&T_2012–13; 4: GBPUA&T_2013–14: 5: Pusa Bihar_2012–13; 6: Pusa Bihar_2013–14.
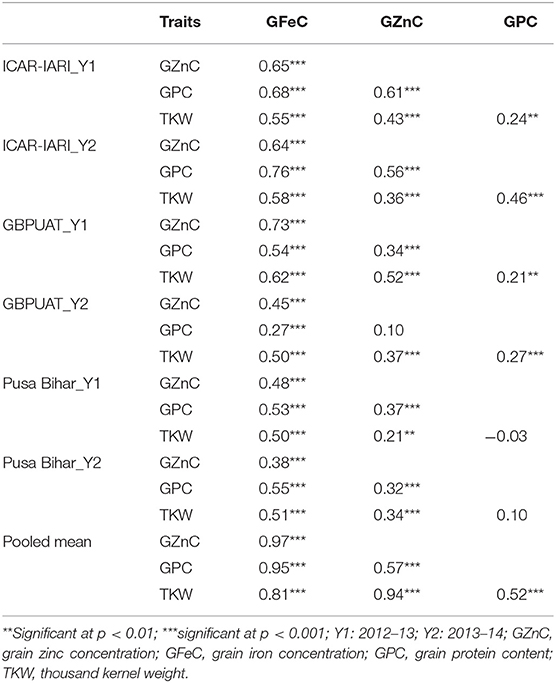
Table 2. Genetic correlation coefficients among grain iron, zinc, protein, and thousand kernel weight in RIL population grown across three locations for 2 years.
The total genetic length of the linkage map was 7,057 cM, and it contained 736 SNPs and 100 SSRs. The chromosome and genome-wise distribution of markers is presented in Table 3. The B genome had the highest number of mapped markers (361) followed by the A (265) and D genomes (210). Chromosome-wise distribution of the markers ranged between 17 (6A chromosome) to 81 (7A chromosome).
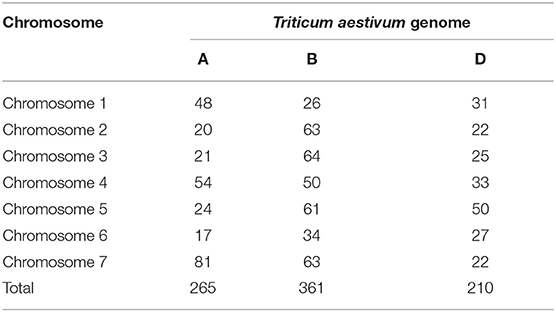
Table 3. Number of markers grouped by each wheat chromosome and genome in the RIL mapping population.
The mapped QTL across the locations and years are presented in Table 4, and the linkage map with the identified QTL position is depicted in Figure 3. A total of 21 QTL were identified in 13 chromosomes representing all three genomes of wheat. Two, five, and 14 QTL were mapped on the A, B, and D genomes, respectively. Chromosome 7D represented the maximum number of seven QTL. A total of 21 QTL were mapped between 16 flanked regions (Table 4); the maximum number of four QTL was identified between flanking markers Xgwm350–AX-94958668, followed by three QTL between Xwmc550–Xgwm350 in the7D chromosome. Trait-wise highest QTL were identified for GPC (10 QTL), followed by GZnC (six QTL), GFeC (three QTL), and TKW (two QTL). QTL for GFeC were mapped in chromosomes 6D and 7D; for GZnC in chromosomes 3B, 1D, 2D, and 7D; for GPC in chromosomes 1A,7A, 5B, 6B, 3D, 4D, 5D, and 7D and for TKW in chromosomes 1B and 7D.
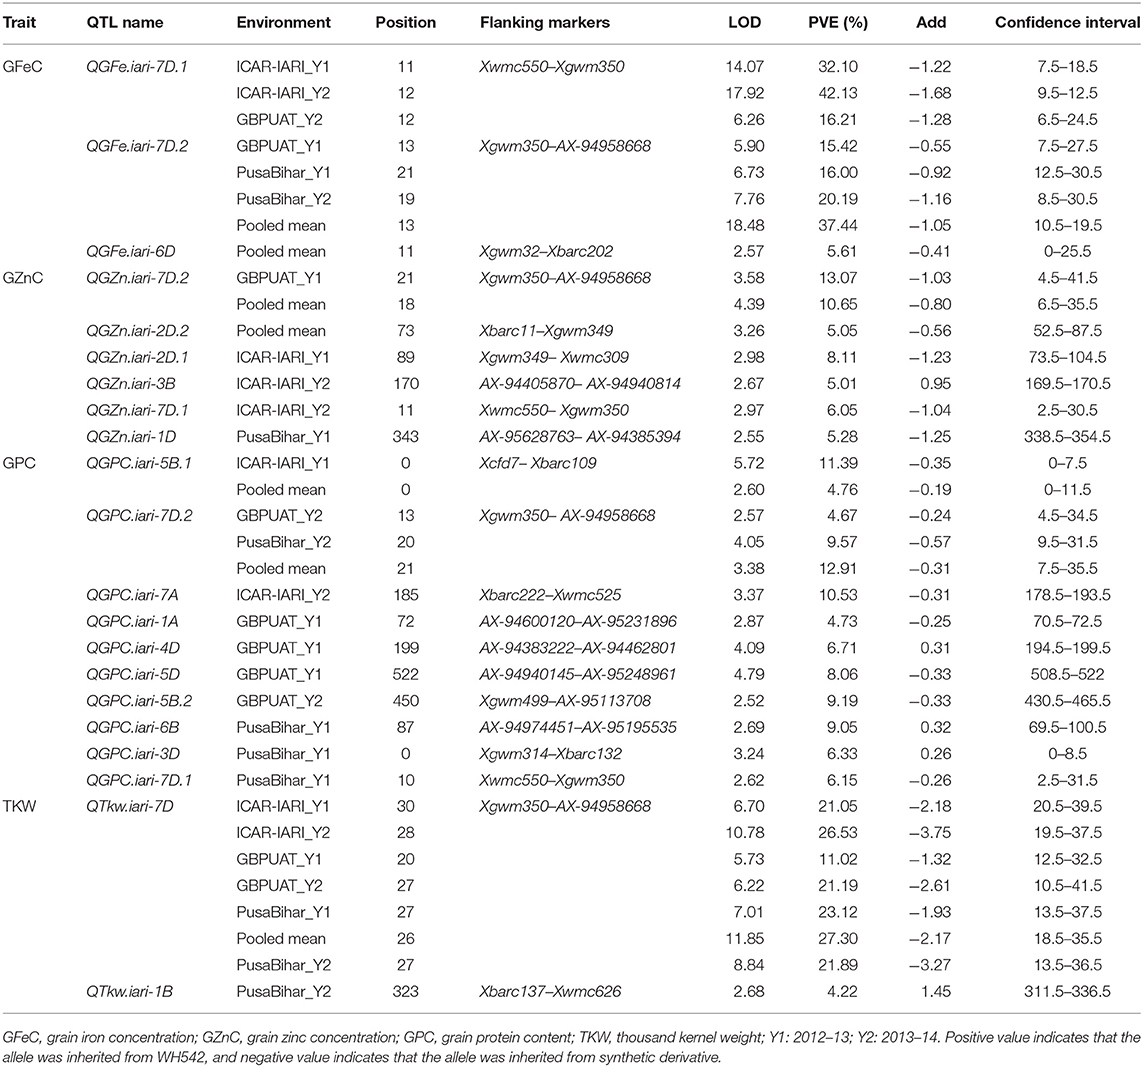
Table 4. QTL identified for grain iron, zinc, protein, and thousand kernel weight in RIL population grown across three locations for 2 years.
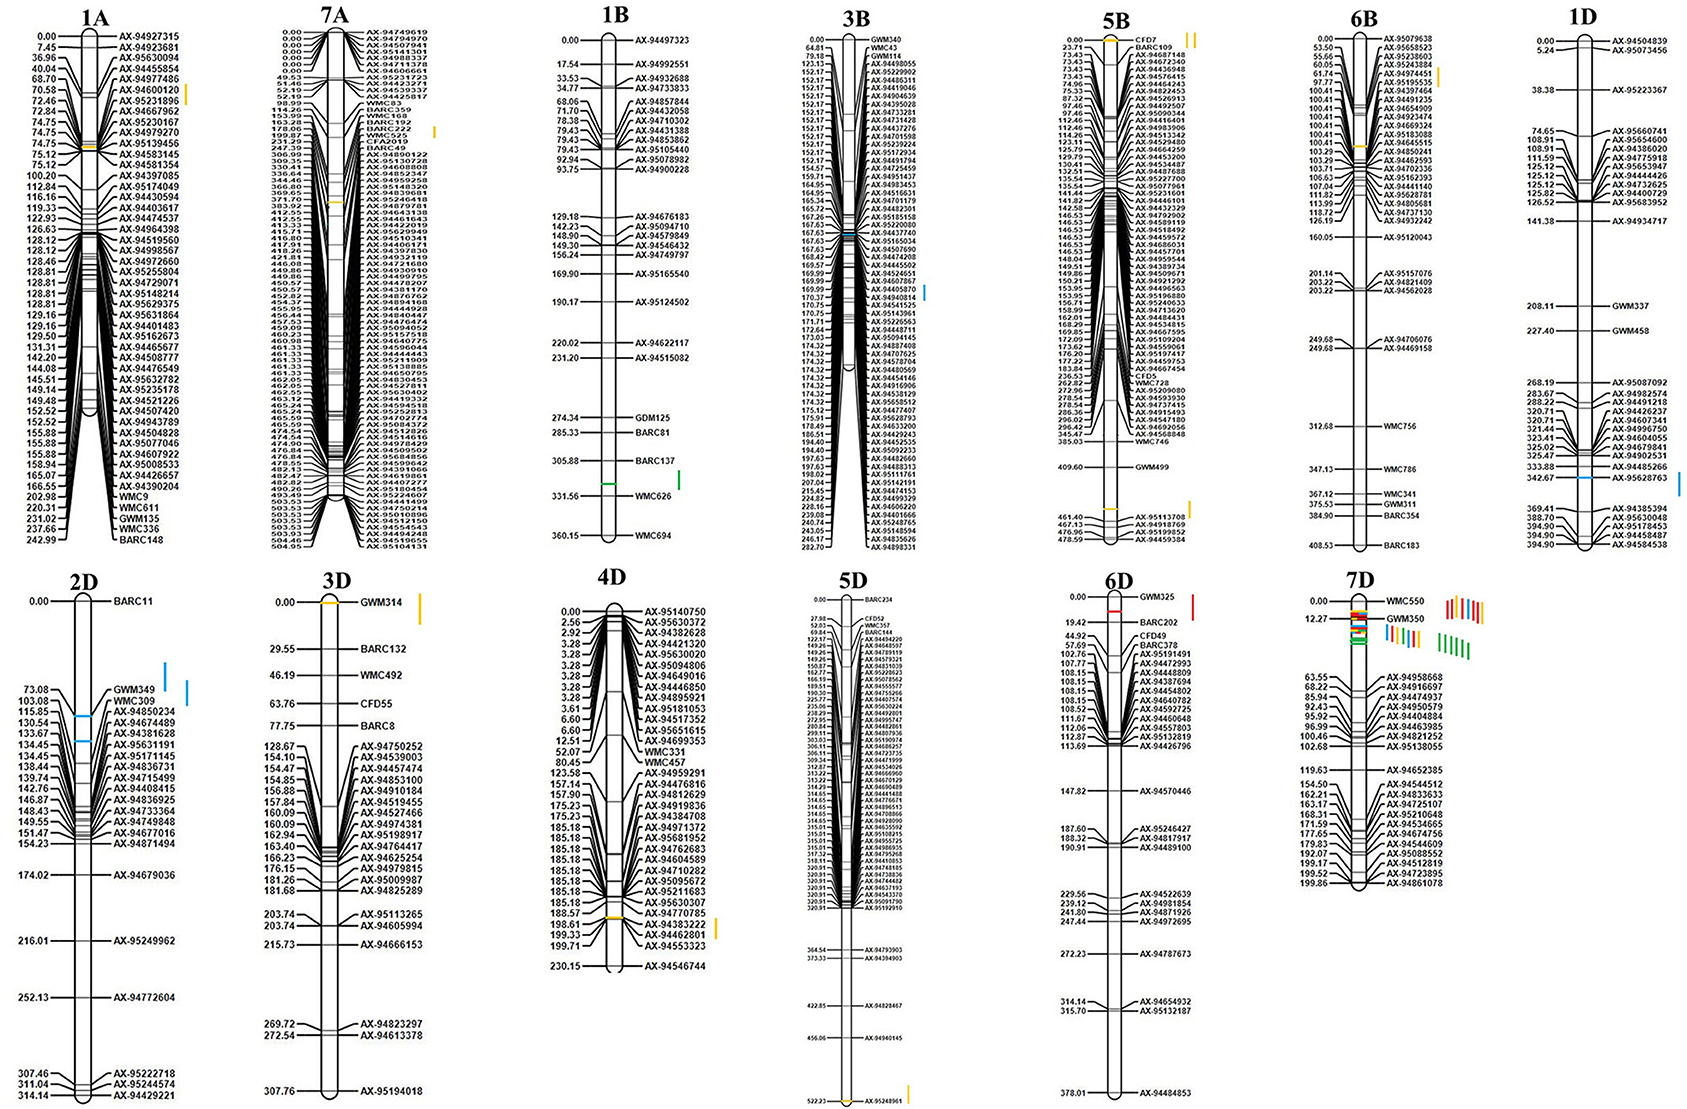
Figure 3. Genetic linkage map and QTL positions identified in A, B, and D genomes of RILs derived from WH 542 × synthetic derivative cross. Red color indicates QTLs for GFeC; Blue color indicates QTLs for GZnC; Yellow color indicates QTLs for grain GPC; Green color indicates QTLs for TKW.
Three QTL governing GFeC were identified and are presented in Table 4. QTL governing GFeC explained 16–42.13% of the phenotypic variance. QGFe.iari-7D.2, flanked between Xgwm350–AX-94958668, was mapped in three environments (GBPUAT_Y1, PusaBihar_Y1, and PusaBihar_Y2) as well as in pooled mean, and contributed 20.19% to the phenotypic variance, followed by QGFe.iari-7D.1 in three environments (ICAR-IARI_Y1, ICAR-IARI_Y2, and GBPUAT_Y2) and flanked between Xwmc550–Xgwm350. QGFe.iari-7D.1 explained 42.13% of the phenotypic variance. Another QTL, QGFe.iari-6D, flanked between Xgwm325–Xbarc202, was mapped for pooled mean although it explained only 5.61% of the phenotypic variance. A total of six QTL were identified for GZnC and are presented in Table 4. QTL governing GZnC explained 5.01–13.07% of phenotypic variance. QGZn.iari-7D.2, flanked between Xgwm350–AX-94958668, was identified in GBPUAT_Y1 along with pooled mean and explained 13.07% of the phenotypic variance. QGZn.iari-3B, flanked between AX-94405870–AX-94940814, was identified at ICAR-IARI_Y2 and explained 5.01% of the phenotypic variance. QGZn.iari-1D, flanked between AX-95628763–AX-94385394, was mapped at Pusa Bihar_Y1 and explained 5.28% of the phenotypic variance. QGZn.iari-2D.1 was identified in ICAR-IARI_Y1 with an explained phenotypic variance of 8.11% and flanked between Xgwm349–Xwmc309. QGZn.iari-2D.2, flanked between Xbarc11–Xgwm349, was mapped for pooled mean and explained only 5.05% of the phenotypic variance. QGZn.iari-7D.1, flanked between Xwmc550–Xgwm350, was mapped in ICAR-IARI_Y2 with 6.05% of the phenotypic variance.
Ten QTL governing GPC were identified and are presented in Table 4. QTL governing GPC explained 4.67% (QGPC.iari-7D.2 at GBPUAT_Y2) to 11.39% (QGPC.iari-5B.1 at ICAR-IARI_Y1). QGPC.iari-7D.2, flanked between Xgwm350–AX-94958668, was mapped in two environments (GBPUAT_Y2, Pusa Bihar_Y2) as well as pooled mean with 9.57% of the phenotypic variance, followed by QGPC.iari-5B.1 at ICAR-IARI_Y1 and pooled mean with 11.39% of the phenotypic variance and flanked between Xcfd7–Xbarc109. The remaining eight QTL, i.e., QGPC.iari-1A, QGPC.iari-7A, QGPC.iari-5B.2, QGPC.iari-6B, QGPC.iari-3D, QGPC.iari-4D, QGPC.iari-5D, and QGPC.iari-7D.1 were mapped in one environment each with an explained phenotypic variance of 4.73, 10.53, 9.19, 9.05, 6.33, 6.71, 8.06, and 6.15%, respectively. Two QTL governing the expression of TKW were identified in chromosomes 1B and 7D (Table 4). QTkw.iari-7D was identified at all the six tested environments and pooled means. It was flanked between Xgwm350–AX-94958668 and explained 26.53% of the phenotypic variance. Another QTL, QTkw.iari-1B, was mapped at Pusa Bihar_Y2 and flanked between Xbarc137–Xwmc626. This QTL explained 4.22% of the phenotypic variance.
The additive effects of the stable QTL were investigated for GFeC, GZnC, and GPC (Table 5). For the estimation of additive effects, we used all the novel and stable QTL identified in this study along with a stable genomic region identified in chromosome 2A in the previous study. For GFeC, QGFe.iari-7D.2 had the largest effect individually, and there is no significant increase by combining the additional QTL and this QTL was identified in 31RILs. For GZnC, the two QTL combinations, viz., QGZn.iari-2D.1 and QGZn.iari-7D.1, showed the highest average GZnC across the environments, and this combination was identified in eight RILs. For GPC, the four QTL combinations viz., QGPC.iari-2A, QGPC.iari-5B, QGPC.iari-7D.1, and QGPC.iari-7D.2 showed the highest average GPC across the environments, and this combination was identified in three RILs.
The in silico analysis identified many important candidate genes underlying 10 QTL, with the highest PVE and pleiotropic for GFeC, GZnC, GPC, and TKW (Table 6). A pleotropic genomic region on chromosome 2A in our previous study (55) was also considered. Most significantly, QTL QGZn.iari-2A, QGFe.iari-2A, QGpc.iari-2A, QGFe.iari-7D.2, QGZn.iari-7D.2, QGGpc.iari-7D.2, QTkw.iari-7D, QGFe.iari-7D.1, QGZn.iari-7D.1, and QGpc.iari-7D.1 were located in regions where genes coding for various transcription factors (TraesCS2A02G063800, TraesCS7D02G521500), transporters (TraesCS7D02G338100, TraesCS7D02G521400, and TraesCS7D02G338100), and signaling and catalytic molecules were present (TraesCS2A02G192400, TraesCS2A02G063900, TraesCS7D02G521700, TraesCS7D02G338400, and TraesCS7D02G521200) (Table 6).
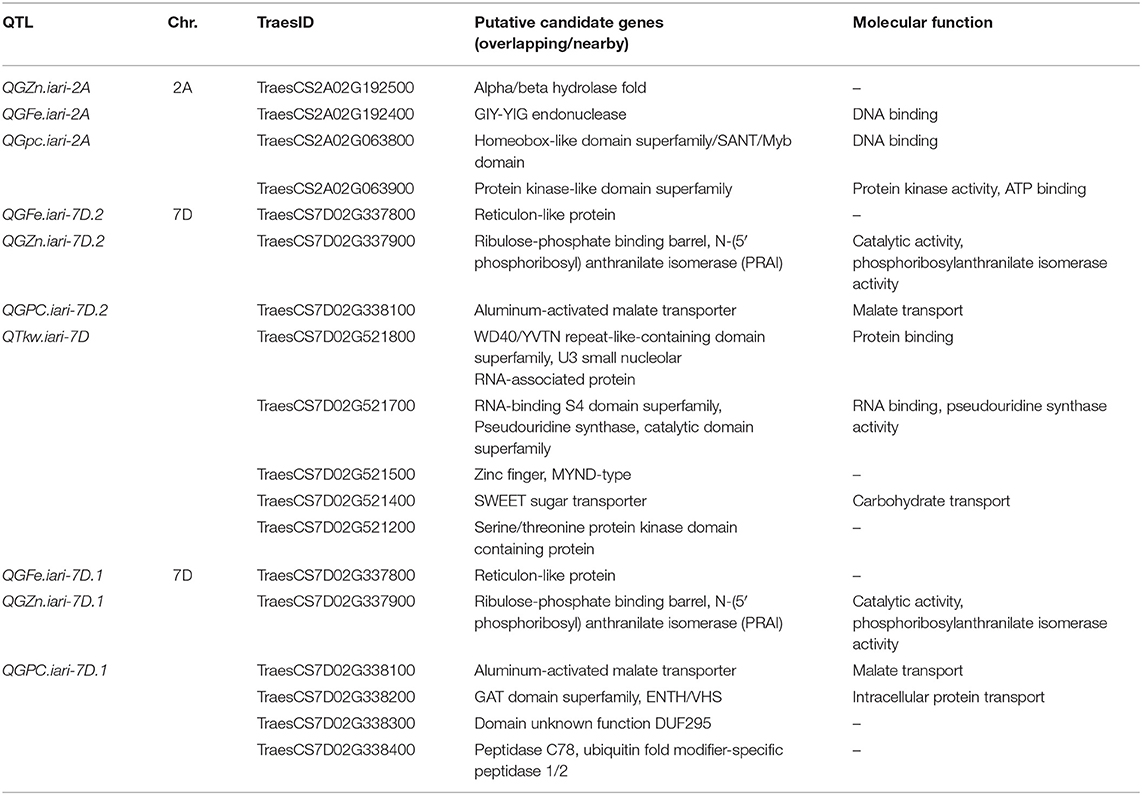
Table 6. Putative candidate genes for grain iron (GFeC), zinc (GZnC), protein (GPC), and thousand kernel weight in the RIL population.
Genetic biofortification is the most cost-effective and sustainable strategy to control malnutrition. Understanding the genetic basis of complex traits like micronutrients, protein, and thousand kernel weight by QTL mapping will help in devising appropriate breeding strategies through MAS. The expression of all the studied traits in this study is greatly affected by the environment and GEI. Similar results of greater magnitude of the environment and GEI have been reported in previous studies for PC and TKW (18–20) and also for iron and zinc (13, 19, 59). Among the studied traits, GZnC was the most variable, whereas, TKW was the most stable. The lowest and highest pooled heritability was observed for GZnC and TKW, respectively, and a reverse trend was observed for CV (GZnC: 6.87; TKW: 4.57). Although both location and year effects were visible for all the traits, the magnitude of the location effect was found to be more pronounced than the year effect (Figure 1). The positive and significant associations among GFeC, GZnC, GPC, and TKW found in this study have also been reported in earlier studies (27, 29). In most of the earlier studies, the associations between GPC and TKW were negative. In this study, the associations between GPC and TKW were significantly positive in four out of six studied environments and non-significant negative in the Pusa Bihar_Y1 environment (rg = −0.03), and non-significant positive in the Pusa Bihar_Y2 environment (rg = 0.1). Similar results of both positive and negative associations between GPC and TKW have also been reported in some earlier studies (19, 27, 45, 60). The lowest and highest pooled heritability of GZnC and TKW, respectively, is also congruent with earlier studies (28, 44).
The linkage map was constructed with 836 high-quality informative markers (736 SNPs + 100 SSRs) and utilized for the QTL analysis. In the previous study conducted on the same population, the SSR-based genetic map had a very low frequency of markers in the D genome (55). As a result, none of the QTL is localized in the D genome. The addition of SNPs improved D genome marker density and distribution, particularly in the 7D chromosome. Enrichment of genetic linkage map with SNPs greatly helped in the mining of novel genomic regions in the D genome. As a result, a maximum number of novel QTL were also identified in the D genome (14 QTL).
The D genome generally shows a low level of polymorphism in naturally occurring hexaploid bread wheat due to its well-known evolutionary history and low recombination during its post-evolution era (61, 62). For this reason, synthetic hexaploid wheats (SHWs) were created by crossing tetraploid durum wheats with multiple accessions of Ae. tauschii (the D genome donor), which increased the diversity of the D genome (63–65). Studies have shown that the D genome diversity of SHW is considerably greater than that of bread wheat (66, 67). In this study, since a synthetic parent was involved in the cross, D genome polymorphism improved significantly and 25.1% (210) of the markers mapped on the D genome (Table 3). A similar trend in marker distribution has been observed in earlier studies involving SHWs as one of the parents in creating mapping populations (30).
A total of 21 QTL were identified in 13 chromosomes representing all three genomes of wheat. Intriguingly, the alleles at most of the QTL responsible for increased GFeC, GZnC, GPC, and TKW were inherited from the synthetic derivative parent. Three QTL (QGFe.iari-6D, QGFe.iari-7D.1, and QGFe.iari-7D.2) governing GFeC were identified in chromosomes 6D and 7D. Also, in the earlier study, grain iron QTL have been identified in chromosome 7D (34) with different marker intervals, whereas QTL (QGFe.iari-6D) mapped on 6D in this study is novel and not reported by earlier studies. For grain zinc, a total of six QTL (QGZn.iari-2D.1, QGZn.iari-3B, QGZn.iari-7D.1, QGZn.iari-7D.2, QGZn.iari-1D, and QGZn.iari-2D.2) were identified. The localization of QTL for GZnC reported in earlier studies on 3B (30, 39), 1D (39), 2D (39), and 7D (30) in different mapping populations corroborate the involvement of these chromosomes.
For GPC, 10 QTL were identified and designated as QGPC.iari-5B.1, QGPC.iari-7A, QGPC.iari-1A, QGPC.iari-4D, QGPC.iari-5D, QGPC.iari-5B.2, QGPC.iari-7D.1, QGPC.iari-6B, QGPC.iari-3D, and QGPC.iari-7D.2. The association of genomic regions for GPC in chromosomes 1A (42, 68), 5B (36, 47), 6B (36, 42), 3D (45), and 5D (45, 47) was also reported in previous studies. Additionally, five novel QTL were identified in 7A (QGPC.iari-7A), 4D (QGPC.iari-4D), 5D (QGPC.iari-5D), and 7D (QGPC.iari-7D.1 and QGPC.iari-7D.2), which were missing in the earlier studies. Interestingly, one novel QTL (QGPC.iari-7D.2) was also found to be stable. There were two QTL (QTkw.iari-1B and QTkw.iari-7D) identified in chromosomes 1B and 7D governing TKW. The genomic regions associated with TKW in these two chromosomes have also been reported in the previous studies (40, 42).
In the earlier study, a total of 16 QTL were identified including four QTL for GFeC, five QTL for GZnC, two QTL for GPC, and five QTL for TKW. The QTL together explained 20, 32, 24.1, and 32.3% of the phenotypic variance, respectively, for GFeC, GZnC, GPC, and TKW. In contrast to the earlier study, where the D genome was completely missing, this study identified the majority of QTL from the D genome. This is due to fairly good marker coverage in all the three genomes in this study, unlike the earlier study, wherein, marker coverage in the D genome was very sparse. The total phenotypic variance explained for all the QTL for any given trait except TKW was higher in this study compared with the earlier studies. Similarly, for two traits, i.e., GFeC and TKW, the highest explained phenotypic variance for an individual QTL was higher compared with the earlier identified QTL. The highest explained phenotypic variance for an individual QTL was 42.13% for GFeC and 26.53% for TKW compared with the earlier identified QTL with 6.8 and 10.4%, respectively.
The environment and GEI play a key role in the expression of quantitative traits. Identification of stable genotypes with the high buffering ability and of QTL is of paramount importance to use in breeding programs. Genetic dissection of complex traits by the identification of stable QTL will complement varietal development by molecular breeding approaches. In this study, four stable QTL (QTkw.iari-7D, QGFe.iari-7D.2, QGFe.iari-7D.1, and QGPC.iari-7D.2) were identified in two or more environments. QTkw.iari-7D was identified in all the six tested environments and pooled mean, followed by QGFe.iari-7D.2 and QGFe.iari-7D.1, which were identified in three environments along with pooled mean. Stable QTL identified in more than two environments were also reported for GPC and TKW (42, 45), GPC (39, 47, 68), GFeC and GZnC (30), and GFeC (33, 37).
Identification of the best combination of QTL effects by estimation of additive effects of the stable QTL will provide an opportunity to utilize RILs with the best combination as donors. The best combination of QTL for all the three biofortification traits in RILs was identified. There is no additional advantage of additive QTL over the individual QTL effects in the expression of GFeC. However, the QTL combination of the two QTL combinations, viz., QGZn.iari-2D.1 and QGZn.iari-7D.1, showed the highest average GZnC across the environments, and this combination was identified in eight RILs. For GPC, the four QTL combinations, viz., QGPC.iari-2A, QGPC.iari-5B.1, QGPC.iari-7D.1, and QGPC.iari-7D.2 showed the highest average GPC across the environments, and this combination was identified in three RILs. Although numerically additive QTL effects for GZnC and GPC are higher than the individual QTL effect, statistically they are at par.
Genomic regions harboring co-located QTL for two or more traits were also identified. This information is helpful in the simultaneous improvement of multiple traits without many additional interventions. Two common genomic regions associated with different co-localized QTL governing two or more traits were identified in chromosome 7D where the genomic region flanked between Xgwm350–AX-94958668 was associated with the maximum number of four co-localized QTL (QGFe.iari-7D.2, QGZn.iari-7D.2, QGPC.iari-7D.2, and QTkw.iari-7D). Another region flanked between Xwmc550–Xgwm350 was also associated with three co-localized QTL (QGFe.iari-7D.1, QGZn.iari-7D.1, and QGPC.iari-7D.1). Some of the other studies (13, 15, 16, 37–40) have also identified such pleiotropic region(s) associated with two or more traits, namely, GFeC, GZnC, GPC, and TKW. High positive correlations observed in this study also strongly support the co-localization of genomic regions governing GFeC, GZnC, GPC, and TKW. Only few studies have reported the association of TKW in the same region as GPC or even with GZnC and GFeC (42, 44, 45, 68). All these studies reported a positive correlation for GPC and TKW. Considering the positive correlations obtained between TKW and GPC in all the environments, except Pusa Bihar_Y1, in this study, it was not surprising to find such pleiotropic QTL (in 2A and 7D chromosomes). The co-location of GFeC, GZnC, and GPC is well documented. For example, the Gpc-B1 locus derived from T dicoccoides is effective in improving GFeC, GZnC, and GPC by 18, 12, and 38%, respectively (15, 16).
The in silico BLAST search identified various potential candidate genes underlying QTL with high PV or pleiotropic QTL for GZnC, GFeC, GPC, and TKW (Table 6). Various QTL identified in chromosomes 2A and 7D were located in regions where gene coding for transcription factors, transporters, and kinase-like superfamilies was present. For example, the SANT domain (coded by TraesCS2A02G063800) is generally found in combination with domains of Zn finger type transcription factors, such as the C2H2-type and GATA-type transcription factors, the role of which has been suggested to be in Zn uptake and homeostasis in plants (69, 70). Members of serine-threonine/protein kinase-like superfamilies are known to catalyze phosphorylation processes, thus controlling growth and development, and some are known to activate Zn channels and transporters (71). The well-characterized serine/threonine-protein kinase encoding gene in maize (KNR6; kernel number per row: six) has been shown to determine the kernel number and ear length in maize (72). Since both maize and wheat are members of the Poaceae/Gramineae family, it would be interesting to further investigate the functional role of the serine/threonine-protein kinase genes identified here (coded by TraesCS7D02G521200 and TraesCS2A02G063900).
In the past decade, the role of various transporters has been shown in regulating mineral homeostasis in plants. These transporters play critical roles in the transport of small peptides, secondary amino acids, glutathione conjugates, and mineral uptake. Many of these transporters have proven to be involved in long-distance iron transport or signaling in Arabidopsis (73). In this regard, an important role of the aluminum-activated malate transporter (ALM1), in combination with a Zn finger-type transcription factor (STOP1), has been shown in regulating iron homeostasis in Arabidopsis (74). In both the stop1 and almt1 mutants, the accumulation of Fe in the root apex was found to be greatly reduced (75).
We earlier reported QTL for different biofortification traits, viz., grain zinc, iron, protein, and thousand kernel weight utilizing an SSR-based genetic map of 286 RIL population developed between a cultivated bread wheat variety and a synthetic derivative. In this study, we added 736 informative SNPs and analyzed a smaller subset of the same population for these traits. New QTL were identified in this study, and many of these were found located in the D genome. The co-localization of QTL for different traits was also observed. Chromosome 7D, in particular, harbored seven and three co-localized QTL at different positions. This indicates that at least some common pathways may be involved in the uptake or accumulation of the micronutrients. Several consistent QTL over two or more environments for different traits are identified in this study as well. Best QTL combinations in RILs have been identified through additive effects, and these combinations would be potential donors to be utilized in future breeding programs. Furthermore, the identification of pleiotropic regions for GZnC, GFeC, GPC, and TKW suggests the possibilities for genetic improvement of GZnC and GFeC without compromising grain yield and GPC. Further fine mapping to identify linked or functional markers is envisaged.
The datasets presented in this study can be found in online repositories. The names of the repository/repositories and accession number(s) can be found in the article/Supplementary Materials.
AS conceptualized the investigation. Field experimentation at Delhi location was conducted by AS, AA, GS, and SaS at Bihar location by IS and RS, at Pantnagar by JJ and GK. Genotyping was done by SuS and GK. Statistical analysis including QTL mapping was done by NDR and DS. Original draft was prepared by GK, AS, and NDR. Review and editing was done by AS, DS, and GK. All authors contributed to the article and approved the submitted version.
This work was a part outcome of a DBT funded project (BT/AGR/Wheat Bioforti/PH-II/2010) granted to AS. High zinc parent received and calibration of the XRF machine with glass based standards by HarvestPlus is duly acknowledged. Training received under ICAR-World bank funded NAHEP-CAAST project by NDR to analyze the molecular data is also acknowledged. Author's also acknowledge IFPRI/HarvestPlus funding support through grant no. 2020H6458.IIW.
The authors declare that the research was conducted in the absence of any commercial or financial relationships that could be construed as a potential conflict of interest.
The Supplementary Material for this article can be found online at: https://www.frontiersin.org/articles/10.3389/fnut.2021.669444/full#supplementary-material
1. Black RE, Victora CG, Walker SP, Bhutta ZA, Christian P, de Onis M, et al. Maternal and child undernutrition and overweight in low-income and middle-income countries. Lancet. (2013) 382:427–51. doi: 10.1016/S0140-6736(13)60937-X
2. de Benoist B, McLean E, Egli I, Cogswell M. Worldwide Prevalence of Anaemia 1993–2005: WHO Global Database on Anaemia. (2008). Available online at: http://www.who.int/nutrition/publications/micronutrients/anaemia_iron_deficiency/9789241596657/en/
3. Lopez A, Cacoub P, Macdougall IC, Peyrin-Biroulet L. Iron deficiency anaemia. Lancet. (2016) 387:907–16. doi: 10.1016/S0140-6736(15)60865-0
4. Holtz C, Brown KH. Assessment of the risk of zinc deficiency in populations and options for its control. Food Nutr Bull. (2004) 25:94–204. doi: 10.4067/S0717-75182010000200014
5. Wessells KR, Brown KH. Estimating the global prevalence of zinc deficiency: results based on zinc availability in national food supplies and the prevalence of stunting. PLoS ONE. (2012) 7:e50568. doi: 10.1371/journal.pone.0050568
6. Schaible UE, Kaufmann SHE. Malnutrition and infection: complex mechanisms and global impacts. PLoS Med. (2007) 4:e115. doi: 10.1371/journal.pmed.0040115
7. Kar BR, Rao SL, Chandramouli BA. Cognitive development in children with chronic protein energy malnutrition. Behav Brain Funct. (2008) 4:31. doi: 10.1186/1744-9081-4-31
8. Muller O, Krawinkel M. Malnutrition and health in developing countries. CMAJ. (2005) 173:279–86. doi: 10.1503/cmaj.050342
9. Pfeiffer WH, McClafferty B. HarvestPlus: breeding crops for better nutrition. Crop Sci. (2007) 47:88–105. doi: 10.2135/cropsci2007.09.0020IPBS
10. Grusak MA, Cakmak I. Methods to improve the crop-delivery of minerals to humans and livestock. In: Broadley MR, White PJ, editors. Plant Nutritional Genomics. Oxford: Blackwell Publishing Ltd. (2005). p. 265–6.
11. Cakmak I, Pfeiffer WH, Mcclafferty B. Biofortification of durum wheat with zinc and iron. Cereal Chem J. (2010) 87:10–20. doi: 10.1094/CCHEM-87-1-0010
12. Rasheed A, Jin H, Xiao Y, Zhang Y, Hao Y, Zhang Y, et al. Allelic effects and variations for key bread-making quality genes in bread wheat using high-throughput molecular markers. J Cereal Sci. (2019) 85:305–9. doi: 10.1016/j.jcs.2018.12.004
13. Velu G, Singh RP, Crespo-Herrera L, Juliana P, Dreisigacker S, Valluru R, et al. Genetic dissection of grain zinc concentration in spring wheat for mainstreaming biofortification in CIMMYT wheat breeding. Sci Rep. (2018) 8:13526. doi: 10.1038/s41598-018-31951-z
14. Cakmak I, Torun A, Millet E, Feldman M, Fahima T, Korol A, et al. Triticum dicoccoides: an important genetic resource for increasing zinc and iron concentration in modern cultivated wheat. Soil Sci Plant Nutr. (2004) 50:1047–54. doi: 10.1080/00380768.2004.10408573
15. Distelfeld A, Cakmak I, Peleg Z, Ozturk I, Yazici AM, Budak H, et al. Multiple QTL-effects of wheat Gpc-B1 locus on grain protein and micronutrient concentrations. Plant Physiol. (2007) 129:635–43. doi: 10.1111/j.1399-3054.2006.00841.x
16. Uauy C, Distelfeld A, Fahima T, Blechl A, Dubcovsky JA. NAC gene regulating senescence improves grain protein, zinc, and iron content in wheat. Science. (2006) 314:1298–301. doi: 10.1126/science.1133649
17. Calderini DF, Ortiz-Monasterio I. Are synthetic hexaploids a means of increasing grain element concentrations in wheat. Euphytica. (2003) 134:169–78. doi: 10.1023/B:EUPH.0000003849.10595.ac
18. Hernandez-Espinos N, Mondal S, Autrique E, Gonzalez-Santoyo H, Crossa J, Huerta-Espino J, et al. Milling, processing and end-use quality traits of CIMMYT spring bread wheat germplasm under drought and heat stress. Field Crops Res. (2018) 215:104–12. doi: 10.1016/j.fcr.2017.10.003
19. Kumar J, Saripalli G, Gahlaut V, Goel N, Meher PK, Mishra KK, et al. Genetics of Fe, Zn, b-carotene, GPC and yield traits in bread wheat (Triticum aestivum L.) using multi-locus and multi-traits GWAS. Euphytica. (2018) 214:219. doi: 10.1007/s10681-018-2284-2
20. Studnicki M, Wijata M, Sobczynski G, Samborski S, Gozdowski D, Rozbicki J. Effect of genotype, environment and crop management on yield and quality traits in spring wheat. J Cereal Sci. (2016) 72:30–7. doi: 10.1016/j.jcs.2016.09.012
21. Khazratkulova S, Sharma RC, Amanov A, Ziyadullaev Z, Amanovi O, Alikulov S, et al. Genotype × environment interaction and stability of grain yield and selected quality traits in winter wheat in Central Asia. Turk J Agric For. (2015) 39:920–9. doi: 10.3906/tar-1501-24
22. Rozbicki J, Ceglinska A, Gozdowski D, Jakubczak M, Cacak-Pietrzak G, Madry W, et al. Influence of the cultivar, environment and management on the grain yield and bread-making quality in winter wheat. J Cereal Sci. (2015) 61:126–32. doi: 10.1016/j.jcs.2014.11.001
23. Saleem N, Ahmad M, Wani SA, Vashnavi R, Dar ZA. Genotype-environment interaction and stability analysis in wheat (Triticum aestivum L.) for protein and gluten contents. Sci Res Essays. (2015) 10:260–5. doi: 10.5897/SRE2015.6180
24. Velu G, Singh RP, Huerta-Espino J, Pena RJ, Arun B, Mahendru-Singh A, et al. Performance of biofortified spring wheat genotypes in target environments for grain zinc and iron concentrations. Field Crops Res. (2012) 137:261–7. doi: 10.1016/j.fcr.2012.07.018
25. Erba D, Alyssa H, Jessica B, Andrea B. Environmental and genotypic influences on trace element and mineral concentrations in whole meal flour of einkorn (Triticum monococcum L. subsp. monococcum). J Cereal Sci. (2011) 54:250–4. doi: 10.1016/j.jcs.2011.06.011
26. Liu Y, Chen Y, Yang Y, Zhang Q, Fu B, Cai J, et al. A thorough screening based on QTL controlling zinc and copper accumulation in the grain of different wheat genotypes. Environ Sci Pollut Res. 28:15043–54. (2020). doi: 10.1007/s11356-020-11690-3
27. Liu J, Wu B, Singh RP, Velu G. QTL mapping for micronutrients concentration and yield component traits in a hexaploid wheat mapping population. J Cereal Sci. (2019) 88:57–64. doi: 10.1016/j.jcs.2019.05.008
28. Arora S, Cheema J, Poland J, Uauy C, Chhuneja P. Genome-wide association mapping of grain micronutrients concentration in Aegilops tauschii. Front Plant Sci. (2019) 10:54. doi: 10.3389/fpls.2019.00054
29. Velu G, Tutus Y, Gomez-Becerra HF, Hao Y, Demir L, Kara R, et al. QTL mapping for grain zinc and iron concentrations and zinc efficiency in a tetraploid and hexaploid wheat mapping populations. Plant Soil. (2017) 411:81–99. doi: 10.1007/s11104-016-3025-8
30. Crespo-Herrera LA, Govindan V, Stangoulis J, Hao Y, Singh RP. QTL mapping of grain Zn and Fe concentrations in two hexaploid wheat RIL populations with ample transgressive segregation. Front Plant Sci. (2017) 8:1800. doi: 10.3389/fpls.2017.01800
31. Tiwari C, Wallwork H, Arun B, Mishra VK, Velu G, Stangoulis J, et al. Molecular mapping of quantitative trait loci for zinc, iron and protein content in the grains of hexaploid wheat. Euphytica. (2016) 207:563–70. doi: 10.1007/s10681-015-1544-7
32. Pu Z-e, Ma YU, He Q-y, Chen G-y, Wang J-r, Liu Y-x, et al. Quantitative trait loci associated with micronutrient concentrations in two recombinant inbred wheat lines. J Integr Agric. (2014) 13:2322–9. doi: 10.1016/S2095-3119(13)60640-1
33. Srinivasa J, Arun B, Mishra VK, Singh GP, Velu G, Babu R, et al. Zinc and iron concentration QTL mapped in a Triticum spelta × T. aestivum cross. Theor Appl Genet. (2014) 127:1643–51. doi: 10.1007/s00122-014-2327-6
34. Roshanzamir H, Kordenaeej A, Bostani A. Mapping QTLs related to Zn and Fe concentrations in bread wheat (Triticum aestivum) grain using microsatellite markers. Iran J Genet Plant Breed. (2013) 2:551–6.
35. Xu Y, Diaoguo A, Dongcheng L, Aimin Z, Hongxing X, Bin L. Molecular mapping of QTLs for grain zinc, iron and protein concentration of wheat across two environments. Field Crops Res. (2012) 38:57–62. doi: 10.1016/j.fcr.2012.09.017
36. Peleg Z, Cakmack I, Ozturk L, Yazici A, Budak H, Korol AB, et al. Quantitative trait loci conferring grain mineral nutrient concentrations in durum wheat × wild emmer wheat RIL population. Theor Appl Genet. (2009) 119:353–69. doi: 10.1007/s00122-009-1044-z
37. Tiwari VK, Rawat N, Chhuneja P, Neelam K, Aggarwal R, Randhawa GS, et al. Mapping of quantitative trait loci for grain iron and zinc concentration in diploid A genome wheat. J Hered. (2009) 100:771–6. doi: 10.1093/jhered/esp030
38. Genc Y, Verbyla A, Torun A, Cakmak I, Willsmore K, Wallwork H, et al. Quantitative trait loci analysis of zinc efficiency and grain zinc concentration in wheat using whole genome average interval mapping. Plant Soil. (2009) 314:49–66. doi: 10.1007/s11104-008-9704-3
39. Zhou Z, Shi X, Zhao G, Qin M, Ibba MI, Wang Y, et al. Identification of novel genomic regions and superior alleles associated with Zn accumulation in wheat using a genome-wide association analysis method. Int J Mol Sci. (2020) 21:1928. doi: 10.3390/ijms21061928
40. Hao Y, Govindan V, Roberto J, Pen Sukhwinder S, Ravi PS. Genetic loci associated with high grain zinc concentration and pleiotropic effect on kernel weight in wheat (Triticum aestivum L.). Mol Breed. (2014) 34:1893–902. doi: 10.1007/s11032-014-0147-7
41. Shi R, Li H, Tong Y, Jing R, Zhang F, Zou C. Identification of quantitative trait locus of zinc and phosphorus density in wheat (Triticum aestivum L.) grain. Plant Soil. (2008) 306:95–104. doi: 10.1007/s11104-007-9483-2
42. Fatiukha A, Filler N, Lupo I, Lidzbarsky G, lymiuk V, Korol AB, et al. Grain protein content and thousand kernel weight QTLs identified in a durum × wild emmer wheat mapping population tested in five environments Theor Appl Genet. (2020) 133:119–31. doi: 10.1007/s00122-019-03444-8
43. Guo Y, Zhang G, Guo B, Qu C, Zhang M, Kong F, et al. QTL mapping for quality traits using a high-density genetic map of wheat. PLoS ONE. (2020) 15:e0230601. doi: 10.1371/journal.pone.0230601
44. Giancaspro A, Giove SL, Zacheo SA, Blanco A, Gadaleta A. Genetic variation for protein content and yield-related traits in a durum population derived from an inter-specific cross between hexaploid and tetraploid wheat cultivars. Front Plant Sci. (2019) 10:1509. doi: 10.3389/fpls.2019.01509
45. Goel S, Singh K, Singh B, Grewal S, Dwivedi N, Alqarawi AA, et al. Analysis of genetic control and QTL mapping of essential wheat grain quality traits in a recombinant inbred population. PLoS ONE. (2019) 14:e0200669. doi: 10.1371/journal.pone.0200669
46. Marcotuli I, Gadaleta A, Mangini G, Signorile AM, Zacheo SA, Blanco A, et al. Development of a high-density SNP-based linkage map and detection of QTL for β-glucans, protein content, grain yield per spike and heading time in durum wheat. Int J Mol Sci. (2017) 18:1329. doi: 10.3390/ijms18061329
47. Mahjourimajd S, Taylor J, Rengel Z, Khabaz-Saberi H, Kuchel H, Okamoto M, et al. The genetic control of grain protein content under variable nitrogen supply in an Australian wheat mapping population. PLoS ONE. (2016) 11:e0159371. doi: 10.1371/journal.pone.0159371
48. Sun X, Wu K, Zhao Y, Qian Z, Kong F, Guo Y, et al. Molecular genetic analysis of grain protein content and tour whiteness degree using RILs in common wheat. J Genet. (2016) 95:317–24. doi: 10.1007/s12041-016-0639-9
49. Elangovan M, Dholakia BB, Rai R, Lagu MD, Tiwari R, Gupta RK, et al. Mapping QTL associated with agronomic traits in bread wheat (Triticum aestivum L.). J Wheat Res. (2011) 3:14–23.
50. Sun XC, Marza F, Ma HX, Carver BF, Bai GH. Mapping quantitative trait loci for quality factors in an inter-class cross of US and Chinese wheat. Theor Appl Genet. (2010) 120:1041–51. doi: 10.1007/s00122-009-1232-x
51. Zhang H, Chen J, Li R, Deng Z, Zhang K, Liu B, et al. Conditional QTL mapping of three yield components in common wheat (Triticum aestivum L.). Crop J. (2016) 4:220–8. doi: 10.1016/j.cj.2016.01.007
52. Wei L, Bai S, Li J, Hou X, Wang X, Li H, et al. QTL positioning of thousand wheat grain weight in qaidam basin. Open J Genet. (2014) 4:239–44. doi: 10.4236/ojgen.2014.43024
53. Mergoum M, Harilal VE, Simsek S, Alamri MS, Schatz BG, Kianian SF, et al. Agronomic and quality QTL mapping in spring wheat. J Plant Breed Genet. (2013) 1:19−33.
54. Nezhad KZ, Weber WE, Roder MS, Sharma S, Lohwasser U, Meyer RC, et al. QTL analysis for thousand-grain weight under terminal drought stress in bread wheat (Triticum aestivum L.). Euphytica. (2012) 186:127–38. doi: 10.1007/s10681-011-0559-y
55. Krishnappa G, Singh AM, Chaudhary S, Ahlawat AK, Singh SK, Shukla RB, et al. Molecular mapping of the grain iron and zinc concentration, protein content and thousand kernel weight in wheat (Triticum aestivum L.). PLoS ONE. (2017) 12:e0174972. doi: 10.1371/journal.pone.0174972
56. Murray MG, Thompson WF. Rapid isolation of high molecular weight plant DNA. Nucleic Acids Res. (1980) 8:4321–5. doi: 10.1093/nar/8.19.4321
57. Roder MS, Korzun V, Wendehake K, Plaschke J, Tixer M-H, Leroy P, et al. A microsatellite map of wheat. Genetics. (1998) 149:2007–23. doi: 10.1093/genetics/149.4.2007
58. Somers DJ, Isaac P, Edwards K. A high-density microsatellite consensus map for bread wheat (Triticum aestivum L.). Theor Appl Genet. (2004) 109:1105–14. doi: 10.1007/s00122-004-1740-7
59. Khokhar JS, Sareen S, Tyagi BS, Singh G, Wilson L, King IP, et al. Variation in grain Zn concentration, and the grain ionome, in field-grown Indian wheat. PLoS ONE. (2018) 13:e0192026. doi: 10.1371/journal.pone.0192026
60. Terasawa Y, Ito M, Tabiki T, Nagasawa K, Hatta K, Nishio Z. Mapping of a major QTL associated with protein content on chromosome 2B in hard red winter wheat (Triticum aestivum L.). Breed Sci. (2016) 66:471–80. doi: 10.1270/jsbbs.16026
61. Chao S, Zhang W, Akhunov E, Sherman J, Ma Y, Luo M-C, et al. Analysis of gene-derived SNP marker polymorphismin US wheat (Triticum aestivum L.) cultivars. Mol Breed. (2009) 23:23–33. doi: 10.1007/s11032-008-9210-6
62. Caldwell KS, Dvorak J, Lagudah ES, Akhunov E, Luo MC, Wolters P, et al. Sequence polymorphism in poly-ploid wheat and their D-genome diploid ancestor. Genetics. (2004) 167:941–7. doi: 10.1534/genetics.103.016303
63. Masood R, Ali N, Jamil M, Bibi K, Rudd JC, Mujeeb-Kazi A. Novel genetic diversity of the Alien D-genome synthetic hexaploid wheat (2n=6x=42, AABBDD) germplasm for various phenology traits. Pak J Bot. (2016) 48:2017–24.
64. Deynze AEV, Dubcovsky J, Gill KS, Nelson JC, Sorrells ME, Dvorak J, et al. Molecular-genetic maps for group 1 chromosomes of Triticeae species and their relation to chromosomes in rice and oat. Genome. (1995) 38:45–59. doi: 10.1139/g95-006
65. Rosyara U, Kishii M, Payne T, Sansaloni C-P, Singh RP, Braun H-J, et al. Genetic contribution of synthetic hexaploid wheat to CIMMYT's spring bread wheat breeding germplasm. Sci Rep. (2019) 9:12355. doi: 10.1038/s41598-019-47936-5
66. Bhatta M, Morgounov A, Belamkar V, Poland J, Baenziger PS. Unlocking the novel genetic diversity and population structure of Synthetic Hexaploid wheat. BMC Genomics. (2018) 19:591. doi: 10.1186/s12864-018-4969-2
67. Zhang P, Dreisigacker S, Melchinger AE, Reif JC, MujeebKazi A, Ginkel M-V, et al. Quantifying novel sequence variation and selective advantage in synthetic hexaploid wheats and their backcross-derived lines using SSR markers. Mol. Breed. (2005) 15:1–10. doi: 10.1007/s11032-004-1167-5
68. Cui F, Fan X, Chen M, Zhang N, Zhao C, Zhang W, et al. QTL detection for wheat kernel size and quality and the responses of these traits to low nitrogen stress. Theor Appl Genet. (2016) 129:469–84. doi: 10.1007/s00122-015-2641-7
69. Milner MJ, Pence NS, Liu J, Kochian LV. Identification of a novel pathway involving a GATA transcription factor in yeast and possibly in plant Zn uptake and homeostasis. J Integr Plant Biol. (2014) 56:271–80. doi: 10.1111/jipb.12169
70. Lyons TJ, Gasch AP, Gaither LA, Botstein D, Brown PO, Eide DJ. Genome-wide characterization of the Zap1p zinc-responsive regulon in yeast. Proc Natl Acad Sci USA. (2000) 97:7957–62. doi: 10.1073/pnas.97.14.7957
71. Thingholm TE, Ronnstrand L, Rosenberg PA. Why and how to investigate the role of protein phosphorylation in ZIP and ZnT zinc transporter activity and regulation. Cell Mol Life Sci. (2020) 77:3085–102. doi: 10.1007/s00018-020-03473-3
72. Jia H, Li M, Li W, Liu L, Jian Y, Yang Z, et al. A serine/threonine protein kinase encoding gene KERNEL NUMBER PER ROW6 regulates maize grain yield. Nat. Commun. (2020) 11:988. doi: 10.1038/s41467-020-14746-7
73. Stacey MG, Patel A, McClain WE, Mathieu M, Remley M, Rogers EE, et al. The Arabidopsis AtOPT3 protein functions in metal homeostasis and movement of iron to developing seeds. Plant Physiol. (2008) 146:589–601. doi: 10.1104/pp.107.108183
74. Wang X, Wang Z, Zheng Z, Dong J, Song L, Sui L, et al. Genetic dissection of Fe-dependent signaling in root developmental responses to phosphate deficiency. Plant Physiol. (2019) 179:300–16. doi: 10.1104/pp.18.00907
Keywords: biofortification, QTLs, malnutrition, SNPs, SSRs, mapping
Citation: Krishnappa G, Rathan ND, Sehgal D, Ahlawat AK, Singh SK, Singh SK, Shukla RB, Jaiswal JP, Solanki IS, Singh GP and Singh AM (2021) Identification of Novel Genomic Regions for Biofortification Traits Using an SNP Marker-Enriched Linkage Map in Wheat (Triticum aestivum L.). Front. Nutr. 8:669444. doi: 10.3389/fnut.2021.669444
Received: 18 February 2021; Accepted: 19 May 2021;
Published: 15 June 2021.
Edited by:
Victor Taleon, International Food Policy Research Institute, United StatesReviewed by:
Shailender Kumar Verma, Central University of Himachal Pradesh, IndiaCopyright © 2021 Krishnappa, Rathan, Sehgal, Ahlawat, Singh, Singh, Shukla, Jaiswal, Solanki, Singh and Singh. This is an open-access article distributed under the terms of the Creative Commons Attribution License (CC BY). The use, distribution or reproduction in other forums is permitted, provided the original author(s) and the copyright owner(s) are credited and that the original publication in this journal is cited, in accordance with accepted academic practice. No use, distribution or reproduction is permitted which does not comply with these terms.
*Correspondence: Anju Mahendru Singh, YW5qdS5zaW5naEBpY2FyLmdvdi5pbg==
†Present address: Santosh Kumar Singh, Department of Microbiology, Biochemistry & Immunology, Morehouse School of Medicine, Atlanta, GA, United States
Gyanendra Pratap Singh, ICAR-Indian Institute of Wheat and Barley Research, Karnal, India
Disclaimer: All claims expressed in this article are solely those of the authors and do not necessarily represent those of their affiliated organizations, or those of the publisher, the editors and the reviewers. Any product that may be evaluated in this article or claim that may be made by its manufacturer is not guaranteed or endorsed by the publisher.
Research integrity at Frontiers

Learn more about the work of our research integrity team to safeguard the quality of each article we publish.