 C. Araya
 C. Corvalán1
 G. Cediel
 L. S. Taillie
 M. Reyes
- 1Institute of Nutrition and Food Technology (INTA), University of Chile, Santiago, Chile
- 2Escuela de Nutrición y Dietética, Facultad de Salud, Universidad Santo Tomás, Santiago, Chile
- 3Department of Nutrition, University of São Paulo, São Paulo, Brazil
- 4School of Nutrition and Dietetics, University of Antioquia, Medellín, Colombia
- 5Department of Nutrition, Carolina Population Center, Gillings School of Global Public Health, University of North Carolina, Chapel Hill, NC, United States
Introduction: In adults, intake of ultra-processed foods (UPF) has been linked with poor diets and adverse health outcomes. In young children, evidence is scarcer but suggests a higher dietary share of UPF.
Objective: To quantify the intake of UPF and its association with the nutrient composition of the diet in a sample of preschoolers in Santiago, Chile.
Methods: Cross-sectional analysis of dietary data (24-h recall survey) from 960 preschoolers. Foods were categorized according to the extent and purpose of processing (NOVA classification) and participants were classified in quintiles of UPF intake. We explored the associations between UPF intake (% of the total energy) and intake of nutrients of concern for non-communicable disease development (carbohydrates, total sugars, fats, and sodium), and nutrients for promotion (proteins, polyunsaturated fats, iron, calcium, zinc, vitamins A, D, C, and B12, folate, and fiber) using multivariate regression after controlling for covariates.
Results: UPF constituted 49% of the total energy intake. Preschoolers with higher intake consumed more energy, saturated and monounsaturated fats, carbohydrates, total sugars, and vitamin D, compared to preschoolers in the lowest quintile of UPF intake. In contrast, UPF intake was negatively associated with the consumption of proteins, polyunsaturated fats, fiber, zinc, vitamin A, and sodium (p < 0.05).
Conclusion: In Chilean preschoolers, UPF was the primary source of energy intake. The dietary share of UPF was associated with the nutrient composition of the diet. Improving children's diet should consider not only promoting healthy food consumption but also limiting UPF consumption.
Introduction
Unhealthy diets—characterized by a low intake of whole grains, fruits, nuts and seeds, seafood, and legumes together with a high intake of sodium, trans fats, processed meats, and sugar-sweetened beverages, among other factors—account for 22% of deaths and 15% of disability-adjusted life years (DALYs) (1, 2).
Over the last few decades, in several countries, traditional foods have been replaced by ultra-processed foods (UPF); products manufactured industrially using processes and ingredients not commonly used in culinary preparations (3, 4). UPF consumption has been associated with a variety of markers of poor nutritional quality. A greater dietary share of UPF has been linked to diets promoting non-communicable diseases (NCD), characterized by a high content of energy and nutrients of concern such as sugars, saturated fats, trans fats, and sodium, as well as poor content of micronutrients and fiber among different populations (5–9). Different longitudinal studies among adults have shown an association between UPF consumption and the development of NCDs such as overweight/obesity, high blood pressure, and cancer (10–12). These conditions, in turn, are associated with greater risks of mortality (13).
Conversely, evidence of the link between UPF consumption and the nutrient composition of the diet or health impact among children is scarce (14–18). Studies on UPF consumption in children indicate that the intake of these products is higher than that in the general population (19, 20). Chile, a post-nutrition transitional country where approximately 75% of the adults and 50% of children aged 6–7 years are either overweight or obese (21–23), is no exception. In 2010, the National Dietary Survey showed a UPF consumption of 29% among the general population and 38% among children and adolescents (i.e., 2–19 years old) (20). In June 2016, the Chilean government implemented a set of regulations aimed at improving diets and preventing obesity, particularly in children (24, 25). Although the regulations were not directed to decrease UPF intake, the foods targeted were those with added sugars, fats, or sodium as part of their processing (25) and, therefore, encompassed most UPF. Understanding UPF intake among young children and its association with the intake of nutrients of concern for NCD development and nutrients for promotion prior to the implementation of the regulation is important for evaluating whether this set of policies may reduce UPF intake and lead to improvements in health. To address these objectives, we analyzed detailed dietary information collected from preschool children of middle to low socioeconomic status who participated in a longitudinal study in Santiago, Chile.
Materials and Methods
Participants and Setting
During the first semester of 2016, the mothers of preschoolers attending public schools of the Chilean National School Board Program (JUNAEB) were invited to participate in the study. These counties are primarily of middle to low socioeconomic status (26). The inclusion criteria for the children were as follows: an age of 4–6 years, born from a single pregnancy, without any gastrointestinal condition that could affect food intake or growth, and with a mother responsible for food purchases and childcare in the home. The participants were recruited via written and verbal announcements to the guardians of students enrolled in kindergarten and preschool. We evaluated 962 mother-child pairs who met the inclusion criteria, two of which were excluded due to lack of plausible anthropometric data or incomplete dietary survey data. Thus, the analyses included 960 mother-child pairs, with approximately 190 participants per group when the sample was divided into quintiles according to the distribution of UPF intake. This sample size allowed the detection of differences between the 1st and 5th quintiles of a 1/3 of the standard deviation (SD) of the outcome, which is in line with the differences detected in a secondary analysis of the National Dietary Survey from 2010, were a quintile of 20% of children and adolescents (aged 2–19 years) with the lowest UPF intake had an average added sugars intake of 8 ± 6% of the energy intake, compared to 16 ± 13% among children and adolescents in the highest quintile of UPF consumption (20). This study was approved by the Ethics Committee of the Institute of Nutrition and Food Technology (INTA) of the Universidad de Chile and by the Institutional Review Board of the University of North Carolina at Chapel Hill. All procedures complied with the principles of the Declaration of Helsinki. Informed consent was obtained from the mothers of all participants.
Study Description
Between April and August 2016, the participants were evaluated by trained dietitians at either INTA's outpatient clinic or the participants' homes. Anthropometric assessments were performed for preschoolers. Weight and height were collected following standardized procedures and standardized dietitians (intraclass correlation coefficient [ICC] > 0.75 for all measurements). The participants were measured while barefoot and wearing light clothing. Weight was collected using portable electronic scales (Seca 770 or 803, precision of 0.1 kg) and height with portable stadiometers (Seca 217, to the nearest 0.1 cm). The mothers were asked for the duration of their formal education.
Evaluation of Food and Nutrient Intakes
The mothers of the preschoolers completed a 24-h recall (24 h) survey to estimate all of the foods and beverages consumed by the child the previous day (weekday or weekend), including food consumed at the school or nursery. This survey was conducted according to the United States Department of Agriculture (USDA) Automated Multiple-Pass Method (27). To more accurately estimate the proportions of consumed foods, the photographic atlas of food proportions used in the National Dietary Survey was employed (28). The mothers were specifically asked about the use of table salt. All data were recorded and analyzed using the 24 h survey software which considered 4,644 foods and 873 recipes commonly consumed by the Chilean population (including those provided by the school feeding program), with standardized ingredients and quantities (29–31).
Energy and Nutritional Contents of the Foods
Given that a local database for the chemical and nutritional compositions of foods and beverages is not available for Chile, the energy and nutrient contents were assigned based on the USDA Food Composition Database, Release 28 (32). Foods from the USDA database were selected based on information provided by the Guide on the Nutritional Composition of Natural Foods and Common Chilean Preparations (33) as well as data declared as part of the nutritional information on packaged products (collected during 2015–2016 for packaged products available at supermarkets) (34). Most similar food (20% maximum variation) was selected based on the content of energy, macronutrient (i.e., proteins, carbohydrates, total fats), saturated fats, total sugars, and sodium. Information on other nutrients (i.e., other subtypes of fats, fiber, vitamins, and minerals) was not considered when selecting the most similar food from the USDA database.
Classification of Foods by the Degree of Processing
The 4,644 reported foods, including preparations (e.g., natural milk with sugar, cooked rice, and lentil stew, among others), were categorized into one of four groups and then into subgroups according to the NOVA classification system (35, 36) as follows:
- Group 1, Unprocessed or minimally processed food: natural foods altered by processes such as drying, freezing, pasteurization, among others that do not add substances such as salt, sugar, oil, or fats to the original food; comprising 13 subgroups (e.g., milk and plain yogurt; fruits; legumes; meat).
- Group 2, Processed culinary ingredients: substances obtained directly from group 1 foods or from nature by processes such as pressing, refining, and milling, among others; comprising five subgroups (e.g., plant oils, table sugar, table salt).
- Group 3, Processed foods: relatively simple products made by adding sugars, oil, salt, or other group 2 substances to group 1 foods, with the main purpose of increasing the durability of group 1 foods or to modify their sensory qualities; comprising five subgroups (e.g., breads [fresh, unpackaged]; cheese; vegetables, fruits, and other plant foods preserved in brine or syrup).
- Group 4, Ultra-processed foods: industrial formulations typically with five or more ingredients, including the formulations used in group 3 and additives as anti-oxidants, stabilizers, preservatives, as well as substances not commonly used in culinary preparations whose purpose is to imitate the sensory qualities of group 1 foods or of culinary preparations of these foods or to disguise the undesirable sensory qualities of the final products; comprising 21 subgroups (e.g., milk-based drinks; sandwiches and hamburgers on a bun [ready-to-eat/heat]; cakes, cookies, and pies).
Detailed descriptions of each subgroup are provided as Supplementary Material.
Nutritional Outcomes
The nutrient composition of the diet was assessed by the daily intake of energy, total carbohydrates, total sugars, fiber, total fats, fat subtypes (i.e., saturated, monounsaturated, polyunsaturated, and trans), proteins, iron, calcium, zinc, vitamins A, D, C, and B12, and folate. The contribution of every NOVA food group was also estimated. The intake was reported (mean and SD) in absolute terms [i.e., grams, milligrams, micrograms, or international units (IU)], considering energy intake (per 100 or 1,000 kcal) and relative to the total daily intake of the specific participant.
Covariates
Preschoolers' sex (male vs. female) and age were considered as covariates. Body mass index (BMI, weight [kg]/height [m2]) and age- and sex-specific z scores were calculated based on the World Health Organization's (WHO) 2006 growth standards for preschoolers <5 years and 2007 references for older preschoolers. The weight status categories were defined according to BMI z score as normal weight (−1 to <1), overweight (+1 to <2), and obese (≥2). Formal education of the mother was categorized as low (<8 years of schooling), medium (8–12 years), and high (>12 years). Finally, the day of the 24 h survey was also included (weekday vs. weekend) as a covariate.
Statistical Analysis
The participants were grouped into quintiles based on the amount of energy consumed from UPF. The general and anthropometric characteristics of children across quintiles of UPF intake were compared using chi-squared tests and one-way analysis of variance (ANOVA), with Bonferroni post-hoc correction. The associations between UPF consumption and the intake of energy and different nutrients were studied using linear regression models, considering quintiles of dietary share of UPF (set of indicator variables) as the predictor, and covariates relevant to the association (i.e., variation of the predictor's beta coefficient >10% when removed). Adjusted means and standard errors derived from the models are presented. The final models met all expected assumptions. P-values <0.05 were considered statistically different. All data were analyzed using Stata v13 (StataCorp, TX, USA).
Results
The sociodemographic characteristics of the sample are summarized in Table 1. Participants were on average 5 years of age and nearly half of the participants were overweight or obese, with an average BMI z score of 1. Most mothers had completed high school (52%) and <10% had a low level of education.
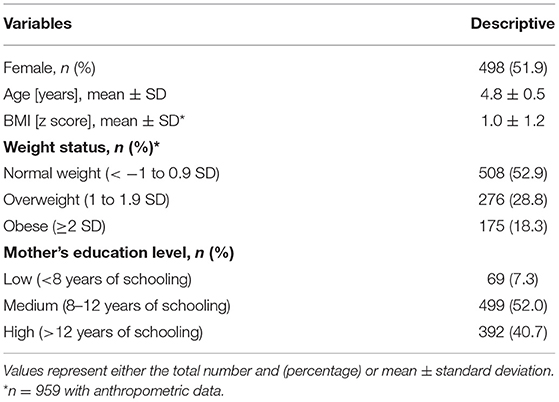
Table 1. Sociodemographic variables, weight status, and energy intake among the participants (n = 960).
Table 2 displays the intake of energy, macronutrients, micronutrients, and fiber by NOVA food groups. UPF accounted for 49% of the daily energy intake, whereas 32% of energy came from unprocessed or minimally processed foods, 10% from processed foods, and 8% from culinary ingredients. UPF was also the main dietary source of carbohydrates (53%), total sugars (76%), total fats (48%), saturated fats (55%), trans fats (49%), and sodium (39%). In contrast, the groups of minimally processed foods and culinary ingredients were the main sources of proteins (47% from group 1), fiber (51% from group 1), and polyunsaturated fats (43% from group 2).
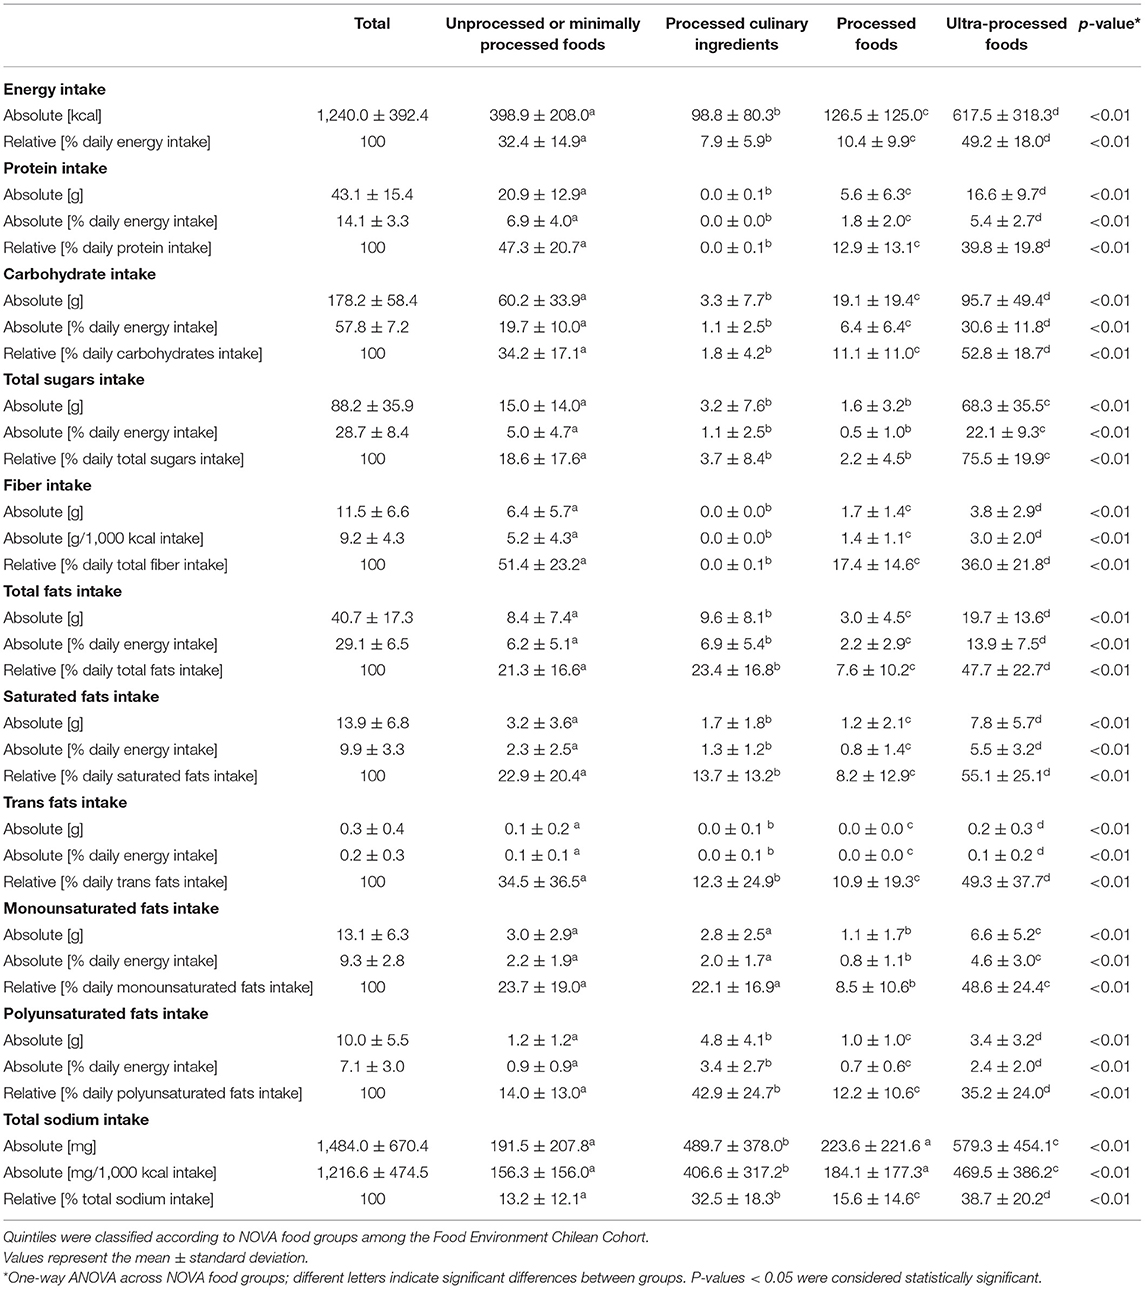
Table 2. Intake of energy and nutrients of concern by the participants (n = 960).
The details of the dietary share of energy, total sugars, saturated fats, and sodium of the different food subgroups within the UPF group are available in Figure 1 and Supplementary Tables 1–4. Within UPF, milk-based drinks were the primary source of energy (18%), total sugars (30%), saturated fats (24%), and sodium (13%). Cakes, cookies, and pies also contributed importantly to the UPF consumption of NCD-related nutrients: energy (7%), total sugars (7%), saturated fats (11%), and sodium (4%); as well as sweet snacks (energy (3%), total sugars (5%), saturated fats (5%), except in the case of sodium). Primary food sources of energy and total sugars also included nectar (4 and 10%, respectively) and desserts (3 and 6%, respectively), while sodium reconstituted meats (6%), sauces, dressing, and gravies (2%), and breakfast cereals (2%) also played a role. The details of the dietary shares of energy, total sugars, saturated fats, and sodium among subgroups of NOVA groups 1–3 are also displayed in Supplementary Tables 1–4.
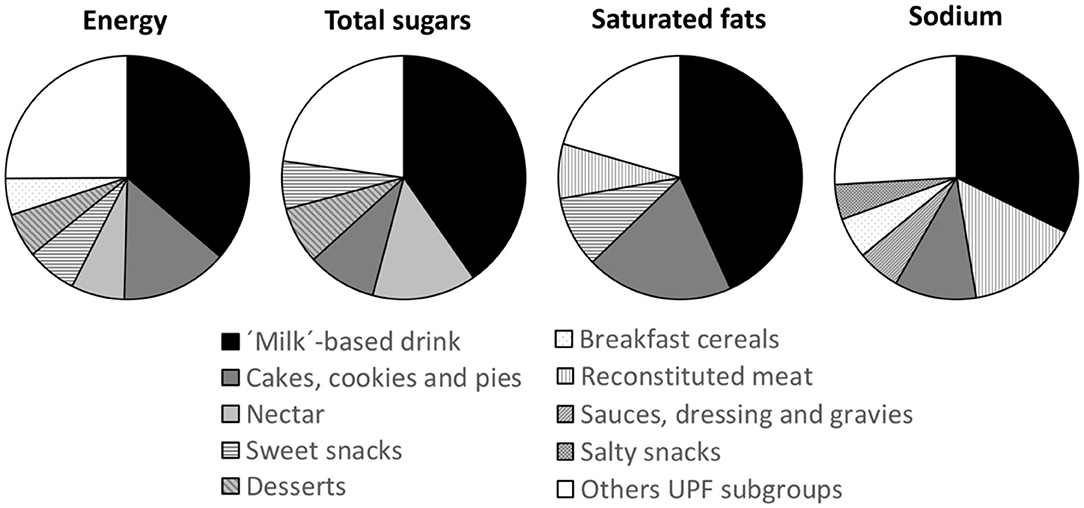
Figure 1. Main food groups contributing to the intake of energy, total sugars, saturated fats, and sodium among ultra-processed food (UPF). Only UPF subgroups contributing to 75% of the intake of energy, total sugars, saturated fats, and sodium are specified.
Preschoolers were classified into five groups according to UPF intake: the mean dietary share of UPF increased in every quintile, at 24% in quintile 1, 40% in quintile 2, 50% in quintile 3, 60% in quintile 4, and 74% in quintile 5. Table 3 shows the sociodemographic characteristics, weight status, and energy intake according to NOVA food groups across the quintiles of UPF consumption. No difference in sociodemographic or anthropometric characteristic was observed by UPF quintile (p > 0.05); however, as expected, the dietary shares of every NOVA group differed significantly. Children in the first quintile consumed an average of 61% of their energy from minimally processed foods and culinary ingredients, whereas, only 21% of energy intake among children in the fifth quintile came from groups 1 and 2.
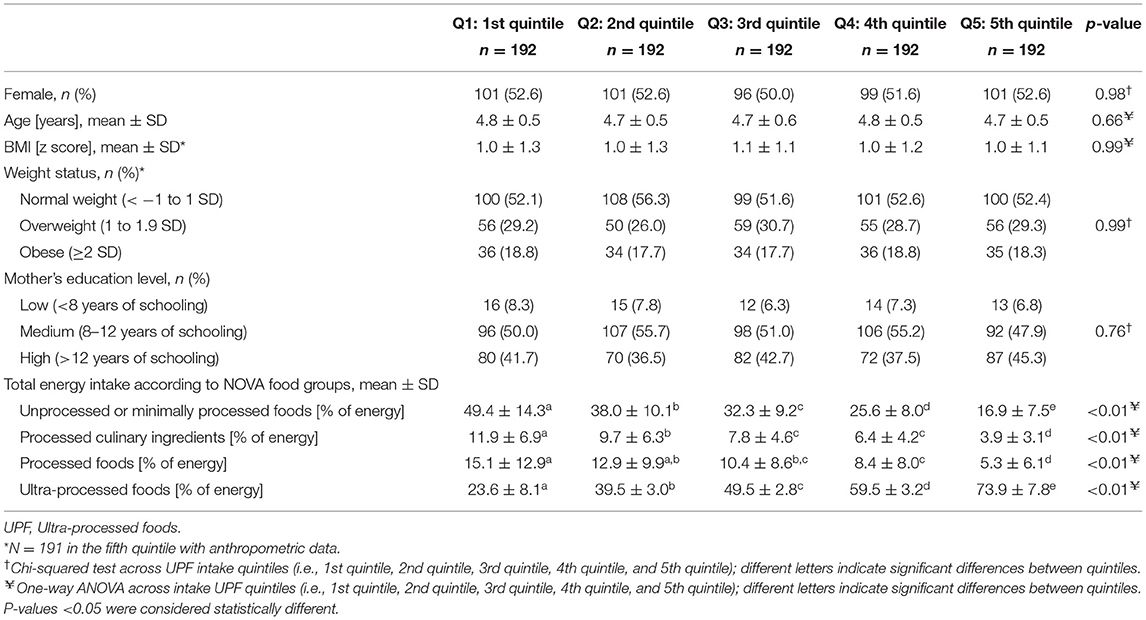
Table 3. Sociodemographic characteristics, weight status, and dietary share of NOVA food groups, by quintiles of UPF in the diet of the Food Environment Chilean Cohort (n = 960).
The adjusted intakes of energy and different nutrients by quintiles of UPF intake are presented in Table 4. Compared to the quintile with the lowest UPF intake, participants from other quintiles had significantly greater intakes of energy, saturated fats, monounsaturated fats, total carbohydrates, total sugars, and vitamin D. However, participants with a greater UPF dietary share had significantly lower intakes of proteins, polyunsaturated fats, fiber, sodium, zinc, vitamin A, and folate than the reference group (i.e., the first quintile). The intakes of total fats, iron, calcium, vitamin C, and vitamin B12 were not associated with UPF intake in this sample.
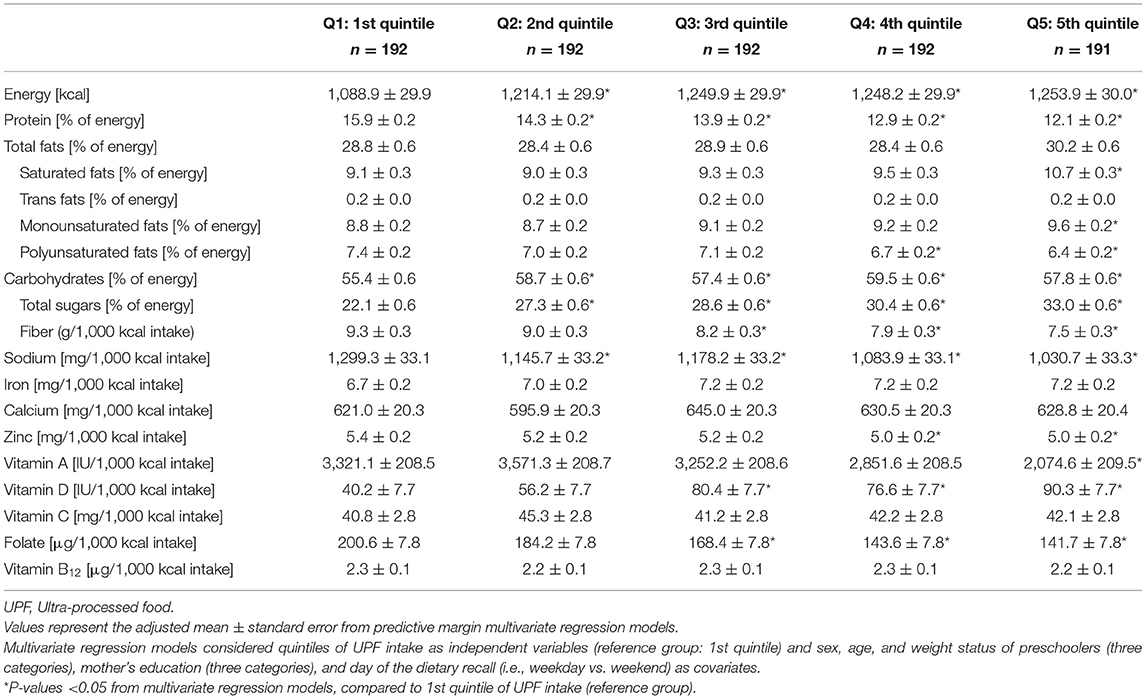
Table 4. Intake of energy, nutrients of concern, and nutrients for promotion by dietary contribution of UPF in the diet of the Food Environment Chilean Cohort (n = 959).
Discussion
The results of this study showed that UPF accounted for an important proportion of energy (~50%), total sugars (76%), saturated fats (55%), and sodium (~40%) intake among preschoolers from a longitudinal study in Santiago, Chile. UPF consumption was independently associated with the nutrient composition of the diet (i.e., greater intake of energy and nutrient of concern such as carbohydrates, total sugars, saturated and trans fats, and lower intake of nutrients for promotion, such as proteins, zinc, vitamin A, folate, and fiber.
Previous reports on the consumption of UPF in children are limited but in general, have shown a high dietary share of these products. In Belgium, the reported intake was 33% of daily energy for children and 29% for adolescents (2014–2015) (15); in Chile it was 38% for children aged 2–19 years (dietary data from 2010) (20), in Australia 53% (dietary data from 2011–2012) (9), 55% in Canada (dietary data from 2004) (6), and 65% in the United States of America (USA) (2009–2014) (14). Data from two Brazilian preschooler samples (the Pelotas cohort) showed a 36% energy intake from UPF among children between 2 and 6 years of age (dietary data from 2008) (37), reaching 40% among 6-year-old children (dietary data from 2004) (38). The age of participants, year of dietary collection, and the type of culinary culture may explain the differences in the dietary shares of UPF but overall, the data reflect the relevance that these type of foods have on the diet of children from countries facing advance stages of the nutrition transition.
Other studies in the general population have also reported an association between UPF intake and an unhealthier nutrient composition of diet. According to the 2010 Chilean National Dietary Survey, UPF consumption was positively associated with the intake of nutrients of concern, specifically energy density, free sugars, total fats, saturated fats, and trans fats, and negatively associated with the intake of potassium and fiber (8). Data derived from the 2004 Canadian dietary survey showed that UPF intake was associated with diets with greater energy density, carbohydrates, free sugars, total and saturated fats but lower contents of proteins, fiber, vitamins A, C, D, B6, and B12, niacin, thiamine, and riboflavin as well as zinc, iron, magnesium, calcium, phosphorus, and potassium (6). According to nationally representative surveys, children from the USA, Australia, and Chile reporting higher UPF intake showed greater intakes of free or added sugars (9, 14, 20), while those from Belgium not meeting the dietary goals for fruits and vegetables, sodium, saturated, and trans fats had higher UPF intake (15). Other studies in specific pediatric populations have reported the impact of UPF intake on the nutrient composition of their diet. Among adolescents from the Pelotas cohort, a greater UPF intake was associated with lower inadequacy of selenium and vitamin B1 (39), whereas the combined intake of processed and UPF was associated with lower intakes of vitamins A and E, zinc, proteins, polyunsaturated and trans fats, and fiber along with greater intake of total and saturated fats, cholesterol, sugars, calcium, and sodium in children aged 5–12 years from Colombia (40).
While most reports are consistent regarding the impact of UPF consumption on a greater intake of nutrients of concern (except for sodium) and lower consumption of fiber, the available information regarding micronutrient intake remains controversial. The latter could be explained by country-to-country differences in micronutrient fortification policies and the quality (e.g., dietary diversity) of diets based on food groups with a lower degree of processing (i.e., NOVA groups 1–3). We did observe a positive association between UPF and vitamin D, likely due to the fact that several of the main UPF food groups are fortified with vitamin D in the USA. Several authors have highlighted the risks associated with promoting the intake of vitamins in UPF foods and whether this should be a matter of concern and have more active monitoring (41). In the case of sodium intake, the discrepancies can be explained by the difficulty of assessing sodium intake (42) and by differences between countries on the other relevant dietary sources of sodium. For instance, in the current study, UPF was the main NOVA group contributor to sodium intake (39% daily intake); however, table salt and fresh bread accounted for 45% of daily sodium intake.
Given that the first years of life, including the preschool period, are relevant in establishing future food preferences (43, 44), high UPF consumption could translate into a notable future increase in UPF intake in the adult population. In turn, greater UPF intake could lead to overeating and weight gain (45) as well as the development of NCDs (10–12) and greater mortality (13). One method to shift this trend is to modify aspects of the food environment that facilitate the consumption of these products, such as availability, marketing, and price. The recent implementation of the Food Labeling and Marketing Law in Chile (24), in addition to other initiatives (25), may mark an important shift in these tendencies (46, 47). Newly implemented measures include increasing the price of sugar-sweetened beverages, the required use of warning labels when the content of nutrients of concern exceeds established values, the prohibition of selling or freely offering foods that exceed established cutoffs in schools, and restrictions on marketing directed toward children. While these measures are not specifically directed at UPF intake, there is an important overlap between these products and those subject to the new regulations (i.e., foods that, as part of processing, have added sodium, sugars, or saturated fats, which exceed established values) (24). This study serves as the basis for evaluating changes in UPF consumption by preschool-aged children and for assessing the nutrients of concern derived from UPF.
The present study has several limitations that are important to mention. The sample was limited to children from nurseries in low-middle-income neighborhoods in Southeast Santiago and may not represent preschool children from other socioeconomic backgrounds in Santiago or across Chile. Only one 24 h survey was used for the analysis, which does not represent usual dietary intake. Furthermore, given the lack of a Chilean database for the chemical composition of foods and beverages, the USDA database for chemical compositions was used. The foods recorded in the USDA database may present important differences in the contents of some nutrients as compared to foods available in Chile, particularly for packaged products (i.e., with some degree of processing). To minimize this limitation, foods listed by the USDA were selected according to the similarity of nutritional information (i.e., energy/calories, macronutrients, and nutrients of concern) provided by the Chilean table of food compositions and, in the case of packaged products, by the nutritional contents reported by manufacturers. As the selection of foods did not consider other nutrients or factors, the results regarding micronutrients and fiber should be interpreted based on this important limitation. This may be especially relevant for vitamin D, which is fortified among dairy products in the USA but not in Chile. Finally, we did not have any biomarker to more accurately assess the diet, which could be especially important for sodium intake. A strength of this study was that all information was collected by a team of trained professionals using standardized methods and supplemented by an atlas to estimate portions, with photographs of foods, and with locally relevant recipes, which supports the precision of the reported results; moreover, we also had access to the recipes used by the school feeding program.
In conclusion, in 4–6-year-old preschoolers from Santiago, Chile, UPF were an important source of energy and nutrients of concern such as total sugars, saturated fats, and sodium. Children with a greater dietary share of UPF had diets characterized by greater content of energy, saturated fats, carbohydrates, and total sugars, and a lower content of fiber, zinc, vitamin A, and folate. Early dietary behaviors might influence long-term dietary behaviors and health status and therefore, improving children's diet should be prioritized on the nutrition agenda. Our results highlight the need of implementing actions to decrease UPF consumption while promoting the consumption of minimally processed and traditionally prepared foods; specific actions targeting sodium might also be required for achieving healthier diets.
Data Availability Statement
The datasets presented in this article are not readily available because of funder's restrictions. Requests to access the datasets should be directed to bXJleWVzQGludGEudWNoaWxlLmNs.
Ethics Statement
The studies involving human participants were reviewed and approved by Ethics Committee of the Institute of Nutrition and Food Technology (INTA), University of Chile, and the Institutional Review Board of the University of North Carolina at Chapel Hill. Written informed consent to participate in this study was provided by the participants' legal guardian/next of kin.
Author Contributions
MR, CC, and LT contributed to the overall study conception and design, contributed to funding acquisition, study execution, and coordination. CA and GC classified the food and beverages according to the NOVA groups and subgroups. CA analyzed and interpreted the data with assistance from MR and CC and wrote the original draft of the manuscript, which the other co-authors reviewed and edited. MR has full access to all the data in the study and has final responsibility for the decision to submit for publication. All authors approved the final version of the manuscript before submission.
Funding
This work was supported by the Fondo Nacional de Desarrollo Cientifico y Tecnologico (FONDECYT 1161436, PI: CC and 1181370, PI: MR), the International Development Research Centre (IDRC, 108180, PI: CC), and Bloomberg Philanthropies (PI: B. Popkin).
Conflict of Interest
The authors declare that the research was conducted in the absence of any commercial or financial relationships that could be construed as a potential conflict of interest.
Acknowledgments
We thank the Center for Research in Food Environments and Prevention of Nutrition-related Chronic Diseases (CIAPEC) team at the Institute of Nutrition and Food Technology (INTA), University of Chile, for their assistance in data collection, and the Carolina Population Center for general support. We especially thank the participants of the Food Environment Chilean Cohort-FEChiC and their families for their continuous support of our work.
Supplementary Material
The Supplementary Material for this article can be found online at: https://www.frontiersin.org/articles/10.3389/fnut.2021.601526/full#supplementary-material
References
1. Institute for Health Metrics and Evaluation. The Global Burden of Disease: Generating Evidence, Guiding Policy – European Union and European Free Trade Association Regional Edition. (2013). Available online at: https://www.healthmetricsandevaluation.org (accessed June 06, 2020).
2. GBD 2017 Diet Collaborators. Health effects of dietary risks in 195 countries, 1990-2017: a systematic analysis for the Global Burden of Disease Study 2017. Lancet. (2019) 393:1958–72. doi: 10.1016/S0140-6736(19)30041-8
3. Monteiro CA, Cannon G, Moubarac JC, Levy RB, Louzada MLC, Jaime PC. The UN Decade of Nutrition, the NOVA food classification and the trouble with ultra-processing. Public Health Nutr. (2018) 21:5–17. doi: 10.1017/S1368980017000234
4. Monteiro CA, Moubarac J-C, Cannon G, Ng SW, Popkin B. Ultra-processed products are becoming dominant in the global food system. Obes Rev. (2013) 2:21–8. doi: 10.1111/obr.12107
5. Martínez Steele E, Baraldi LG, da Costa Louzada ML, Moubarac J-C, Mozaffarian D, Monteiro CA. Ultra-processed foods and added sugars in the US diet: evidence from a nationally representative cross-sectional study. BMJ Open. (2016) 6:e009892. doi: 10.1136/bmjopen-2015-009892
6. Moubarac J-C, Batal M, Louzada ML, Martinez Steele E, Monteiro CA. Consumption of ultra-processed foods predicts diet quality in Canada. Appetite. (2017) 108:512–20. doi: 10.1016/j.appet.2016.11.006
7. da Costa Louzada ML, Ricardo CZ, Steele EM, Levy RB, Cannon G, Monteiro CA. The share of ultra-processed foods determines the overall nutritional quality of diets in Brazil. Public Health Nutr. (2018) 21:94–102. doi: 10.1017/S1368980017001434
8. Cediel G, Reyes M, Corvalán C, Levy RB, Uauy R MC. Ultra-processed foods drive to unhealthy diets: evidence from Chile. Public Health Nutr. (2020) 1–10. doi: 10.1017/S1368980019004737. [Epub ahead of print].
9. Machado PP, Steele EM, da Costa Louzada ML, Levy RB, Rangan A, Woods J, et al. Ultra-processed food consumption drives excessive free sugar intake among all age groups in Australia. Eur J Nutr. (2020) 59:2783–92. doi: 10.1007/s00394-019-02125-y
10. de Deus Mendonça R, Lopes ACS, Pimenta AM, Gea A, Martinez-Gonzalez MA, Bes-Rastrollo M. Ultra-processed food consumption and the incidence of hypertension in a Mediterranean Cohort: The Seguimiento Universidad de Navarra Project. Am J Hypertens. (2017) 30:358–66. doi: 10.1093/ajh/hpw137
11. Fiolet T, Srour B, Sellem L, Kesse-Guyot E, Allès B, Méjean C, et al. Consumption of ultra-processed foods and cancer risk: results from NutriNet-Santé prospective cohort. BMJ. (2018) 360:k322. doi: 10.1136/bmj.k322
12. de Deus Mendonça R, Pimenta AM, Gea A, de la Fuente-Arrillaga C, Martinez-Gonzalez MA, Lopes ACS, et al. Ultraprocessed food consumption and risk of overweight and obesity: the University of Navarra Follow-Up (SUN) cohort study. Am J Clin Nutr. (2016) 104:1433–40. doi: 10.3945/ajcn.116.135004
13. Schnabel L, Kesse-Guyot E, Allès B, Touvier M, Srour B, Hercberg S, et al. Association between ultraprocessed food consumption and risk of mortality among middle-aged adults in France. JAMA Intern Med. (2019) 179:490–8. doi: 10.1001/jamainternmed.2018.7289
14. Neri D, Martinez-Steele E, Monteiro CA, Levy RB. Consumption of ultra-processed foods and its association with added sugar content in the diets of US children, NHANES 2009-2014. Pediatr Obes. (2019) 8:e020574. doi: 10.1111/ijpo.12563
15. Vandevijvere S, De Ridder K, Fiolet T, Bel S, Tafforeau J. Consumption of ultra-processed food products and diet quality among children, adolescents and adults in Belgium. Eur J Nutr. (2019) 58:3267–78. doi: 10.1007/s00394-018-1870-3
16. Costa CS, Rauber F, Leffa PS, Sangalli CN, Campagnolo PDB, Vitolo MR. Ultra-processed food consumption and its effects on anthropometric and glucose profile: A longitudinal study during childhood. Nutr Metab Cardiovasc Dis. (2019) 29:177–84. doi: 10.1016/j.numecd.2018.11.003
17. Rauber F, Campagnolo PDB, Hoffman DJ, Vitolo MR. Consumption of ultra-processed food products and its effects on children's lipid profiles: a longitudinal study. Nutr Metab Cardiovasc Dis. (2015) 25:116–22. doi: 10.1016/j.numecd.2014.08.001
18. Vedovato GM, Vilela S, Severo M, Rodrigues S, Lopes C, Oliveira A. Ultra-processed food consumption, appetitive traits and BMI in children: a prospective study. Br J Nutr. (2020) 1–10. doi: 10.1017/S0007114520003712. [Epub ahead of print].
19. Baraldi LG, Martinez Steele E, Canella DS, Monteiro CA. Consumption of ultra-processed foods and associated sociodemographic factors in the USA between 2007 and 2012: evidence from a nationally representative cross-sectional study. BMJ Open. (2018) 8:e020574. doi: 10.1136/bmjopen-2017-020574
20. Cediel G, Reyes M, da Costa Louzada ML, Martinez Steele E, Monteiro CA, Corvalán C, et al. Ultra-processed foods and added sugars in the Chilean diet (2010). Public Health Nutr. (2018) 21:125–33. doi: 10.1017/S1368980017001161
21. Ministerio de Salud, Chile. Encuesta Nacional De Salud 2016-2017 Primeros Resultados. Santiago (2017). Available online at: https://www.minsal.cl/wp-content/uploads/2017/11/ENS-2016-17_PRIMEROS-RESULTADOS.pdf (accessed March 20, 2020).
22. Junta Nacional de Auxilio Escolar y becas (JUNAEB), Chile. Informe Mapa Nutricional 2018. Santiago (2019). Available online at: www.juaneb.cl (accessed March 04, 2020).
23. Organization for Economic Co-operation and Development. OECD Reviews of Public Health: Chile. (2019). Available online at: https://www.oecd-ilibrary.org/social-issues-migration-health/oecd-reviews-of-public-health-chile_9789264309593-en (accessed December 09, 2020).
24. Ministerio de Salud. Subsecretaría de Salud Pública. Ley 20,606 Sobre Composición Nutricional de Los Alimentos y su Publicidad. Santiago: Ministerio de Salud (2012).
25. Corvalán C, Reyes M, Garmendia ML, Uauy R. Structural responses to the obesity and non-communicable diseases epidemic: update on the chilean law of food labelling and advertising. Obes Rev. (2019) 20:367–74. doi: 10.1111/obr.12802
26. Ministerio de Desarrollo Social. Encuesta de Caracterización Socioeconómica Nacional (CASEN) 2013. (2014). Available online at: https://observatorio.ministeriodesarrollosocial.gob.cl/casenmultidimensional/casen/casen_2013.php (accessed June 10, 2020).
27. United States Department of Agriculture. Automated Multiple-Pass Method. Agriculture Research Service (2008). Available online at: https://www.ars.usda.gov/northeast-area/beltsville-md-bhnrc/beltsville-human-nutrition-research-center/food-surveys-research-group/docs/ampm-usda-automated-multiple-pass-method/ (accessed March 06, 2020).
28. Ministerio de Salud, Facultad de Economía y Negocios y Facultad de Medicina Universidad de Chile. Atlas Fotográfico de Alimentos y Preparaciones Típicas Chilenas. Encuesta Nacional de Consumo Alimentario (ENCA) 2010. (2014). Available online at: https://www.minsal.cl/enca/ (accessed April 07, 2020).
29. Jensen ML, Corvalán C, Reyes M, Popkin BM, Taillie LS. Snacking patterns among Chilean children and adolescents: Is there potential for improvement? Public Health Nutr. (2019) 22:2803–12. doi: 10.1017/S1368980019000971
30. Essman M, Popkin BM, Corvalán C, Reyes M, Taillie LS. Sugar-sweetened beverage intake among chilean preschoolers and adolescents in 2016: a cross-sectional analysis. Nutrients. (2018) 10:1767. doi: 10.3390/nu10111767
31. Rebolledo N, Reyes M, Corvalán C, Popkin BM, Taillie LS. Dietary intake by food source and eating location in low- and middle-income chilean preschool children and adolescents from Southeast Santiago. Nutrients. (2019) 11:1695. doi: 10.3390/nu11071695
32. United States Department of Agriculture. National Nutrient Database for Standard Reference Release 28. Agriculture Research Service. Available online at: https://www.ars.usda.gov/northeast-area/beltsville (accessed March 06, 2020).
33. Gattás V. Guía de la Composición Nutricional de Alimentos Naturales, de la Industria y Preparaciones Chilenas Habituales. Santiago: Universidad de Chile-INTA (2011). p. 157.
34. Kanter R, Reyes M, Swinburn B, Vandevijvere S, Corvalán C. The food supply prior to the implementation of the Chilean Law of Food Labeling and Advertising. Nutrients. (2018) 11:52. doi: 10.3390/nu11010052
35. Monteiro CA, Cannon G, Levy R, Moubarac J-C, Jaime P, Martins AP, et al. NOVA. The star shines bright. World Nutrit. (2016) 7:28–38. Available online at: https://www.worldnutritionjournal.org/index.php/wn/article/view/5/4
36. Monteiro CA, Cannon G, Levy RB, Moubarac J-C, Louzada ML, Rauber F, et al. Ultra-processed foods: what they are and how to identify them. Public Health Nutr. (2019) 22:936–41. doi: 10.1017/S1368980018003762
37. Karnopp EVN, dos Santos Vaz J, Schafer AA, Muniz LC, de Souza R, de LV, dos Santos I, et al. Food consumption of children younger than 6 years according to the degree of food processing. J Pediatr (Rio J). (2017) 93:70–8. doi: 10.1016/j.jped.2016.04.007
38. Bielemann RM, Santos LP, dos Santos Costa C, Matijasevich A, Santos IS. Early feeding practices and consumption of ultraprocessed foods at 6 y of age: findings from the 2004 Pelotas (Brazil) Birth Cohort Study. Nutrition. (2018) 47:27–32. doi: 10.1016/j.nut.2017.09.012
39. de Arruda Falcão RCTM, de Oliveira Lyra C, de Morais CMM, Pinheiro LGB, Pedrosa LFC, Lima SCVC, et al. Processed and ultra-processed foods are associated with high prevalence of inadequate selenium intake and low prevalence of vitamin B1 and zinc inadequacy in adolescents from public schools in an urban area of northeastern Brazil. PLoS ONE. (2019) 14:e0224984. doi: 10.1371/journal.pone.0224984
40. Cornwell B, Villamor E, Mora-Plazas M, Marin C, Monteiro CA, Baylin A. Processed and ultra-processed foods are associated with lower-quality nutrient profiles in children from Colombia. Public Health Nutr. (2018) 21:142–7. doi: 10.1017/S1368980017000891
41. Sangalli CN, Rauber F, Vitolo MR. Low prevalence of inadequate micronutrient intake in young children in the south of Brazil: a new perspective. Br J Nutr. (2016) 116:890–6. doi: 10.1017/S0007114516002695
42. Mercado CI, Cogswell ME, Valderrama AL, Wang C-Y, Loria CM, Moshfegh AJ, et al. Difference between 24-h diet recall and urine excretion for assessing population sodium and potassium intake in adults aged 18-39 y. Am J Clin Nutr. (2015) 101:376–86. doi: 10.3945/ajcn.113.081604
43. Albuquerque G, Lopes C, Durão C, Severo M, Moreira P, Oliveira A. Dietary patterns at 4 years old: Association with appetite-related eating behaviours in 7 year-old children. Clin Nutr. (2018) 37:189–94. doi: 10.1016/j.clnu.2016.11.023
44. Lee HA, Hwang HJ, Oh SY, Park EA, Cho SJ, Kim HS, et al. Which diet-related behaviors in childhood influence a healthier dietary pattern? From the ewha birth and growth cohort. Nutrients. (2017) 9:4. doi: 10.3390/nu9010004
45. Hall KD, Ayuketah A, Brychta R, Cai H, Cassimatis T, Chen KY, et al. Ultra-processed diets cause excess calorie intake and weight gain: an inpatient randomized controlled trial of ad libitum food intake. Cell Metab. (2019) 30:67–77.e3. doi: 10.1016/j.cmet.2019.05.008
46. Taillie LS, Reyes M, Colchero MA, Popkin B, Corvalán C. An evaluation of Chile's law of food labeling and advertising on sugar-sweetened beverage purchases from 2015 to 2017: a before-and-after study. PLoS Med. (2020) 17:e1003015. doi: 10.1371/journal.pmed.1003015
47. Reyes M, Smith Taillie L, Popkin B, Kanter R, Vandevijvere S, Corvalán C. Changes in the amount of nutrient of packaged foods and beverages after the initial implementation of the Chilean Law of Food Labelling and Advertising: a non-experimental prospective study. PLoS Med. (2020) 17:e1003220. doi: 10.1371/journal.pmed.1003220
Keywords: ultra-processed foods, children, preschooler, diet, Chile
Citation: Araya C, Corvalán C, Cediel G, Taillie LS and Reyes M (2021) Ultra-Processed Food Consumption Among Chilean Preschoolers Is Associated With Diets Promoting Non-communicable Diseases. Front. Nutr. 8:601526. doi: 10.3389/fnut.2021.601526
Received: 01 September 2020; Accepted: 03 March 2021;
Published: 26 March 2021.
Edited by:
Joan Sabate, Loma Linda University, United StatesReviewed by:
Irina Uzhova, Institute of Technology, Sligo, IrelandRosa Casas Rodriguez, Institut de Recerca Biomèdica August Pi i Sunyer (IDIBAPS), Spain
Copyright © 2021 Araya, Corvalán, Cediel, Taillie and Reyes. This is an open-access article distributed under the terms of the Creative Commons Attribution License (CC BY). The use, distribution or reproduction in other forums is permitted, provided the original author(s) and the copyright owner(s) are credited and that the original publication in this journal is cited, in accordance with accepted academic practice. No use, distribution or reproduction is permitted which does not comply with these terms.
*Correspondence: M. Reyes, bXJleWVzQGludGEudWNoaWxlLmNs