 Huimin Zhao1
 Yongye Sun
94% of researchers rate our articles as excellent or good
Learn more about the work of our research integrity team to safeguard the quality of each article we publish.
Find out more
ORIGINAL RESEARCH article
Front. Nutr. , 19 November 2020
Sec. Nutrition and Metabolism
Volume 7 - 2020 | https://doi.org/10.3389/fnut.2020.593735
This article is part of the Research Topic Foods and Macronutrients In NAFLD: Associations, Effects and Mechanisms View all 7 articles
Background: Evidence on the association of non-alcoholic fatty liver disease (NAFLD), a public health concern, with dietary fiber intake is inconsistent.
Objective: To investigate the relationship between dietary fiber intake from different sources and NAFLD risk in US adults.
Methods: Data were collected from the 2007–2014 National Health and Nutrition Examination Survey. NAFLD was defined as a United States Fatty Liver Index ≥30, and dietary fiber intake was assessed through two 24-h dietary recall interviews. Logistic regression and restricted cubic spline models were used to explore the relationship of dietary intakes of total, cereal, fruit, and vegetable fiber with NAFLD risk.
Results: A total of 6,613 participants, aged more than 20 years, were included in this study. After adjusting for multiple confounding factors, the odds ratios and 95% confidence intervals of NAFLD for the highest quartile vs. lowest quartile intakes of total, cereal, fruit, and vegetable fiber were 0.12 (0.08–0.16), 0.25 (0.19–0.33), 0.41 (0.33–0.52), and 0.42 (0.32–0.56), respectively. In stratified analyses by sex and age, statistically significant negative associations of dietary intakes of total, cereal, fruit, and vegetable fiber with NAFLD risk were observed in all participants. Dose-response analysis indicated a non-linear correlation between NAFLD risk and dietary intake of total fiber, whereas the relationship was linear for cereal, fruit, and vegetable fiber intakes.
Conclusion: Total, cereal, fruit, and vegetable fiber intakes exhibit negative correlations with NAFLD risk in the general adult population in the United States.
Non-alcoholic fatty liver disease (NAFLD) is a clinicopathological syndrome characterized by excessive fat deposition in hepatocytes in the absence of definite liver-damaging factors, such as alcohol intake (1). NAFLD progresses from intracellular fat accumulation to liver fibrosis, cirrhosis, and, ultimately, liver failure (2–5). Growing evidence indicates that NAFLD is a multisystem disease that increases the risk of cardiovascular disease, type 2 diabetes, and other chronic diseases (6–8). NAFLD is an emerging health problem with high worldwide prevalence (9, 10); the estimated prevalence rate of approximately 30% among American adults (11). Because no effective medical treatment for NAFLD has been reported (12), identifying potential modifiable factors to control or prevent the development of NAFLD is necessary.
Several lifestyle and dietary factors, regarded as modifiable conditions, have been linked to NAFLD. Intakes of fried foods, refined grains, processed meat, and fructose-rich foods have been reported to increase the risk of NAFLD (13–15), whereas intakes of whole grains, legumes, probiotic dairy products, vegetables, and fruits have been shown to decrease the NAFLD risk (15–18). Some studies have confirmed that high intake of dietary fiber, which is found predominantly in cereals, fruits, and vegetables, was associated with decreased risk of type 2 diabetes, hypertension, hyperuricemia, cardiovascular disease, and cancer (19–25). Additionally, the relationship between dietary fiber intake and NAFLD has been reported. A cross-sectional study in the Netherlands demonstrated that dietary fiber intake was low among participants with a high fatty liver index (26). Another large cross-sectional study in China demonstrated the association of total dietary fiber intake with a low prevalence of newly diagnosed NAFLD (27). Furthermore, a case–control study in Iran demonstrated that dietary fiber intake in patients with NAFLD was lower than that in healthy controls (28). However, another cross-sectional study in Israel found no significant difference in dietary fiber intake between NAFLD and non-NAFLD groups (29), and a cross-sectional study in China revealed higher dietary fiber intake among participants with NAFLD than controls (30). Taken together, the results of studies investigating the association between dietary fiber intake and NAFLD are inconsistent.
Some of the above studies did not adjust for any confounders, so they could not reflect the true relationship between dietary fiber intake and NAFLD. Additionally, none of the studies investigated the dose-response relationship between dietary fiber intake and NAFLD or analyzed the dietary fiber intake presented in per kilogram (kg) of body weight or per kilocalorie (kcal) of energy intake. Therefore, we explored the associations of intakes of total fiber and cereal, fruit, and vegetable fiber with NAFLD risk in the general adult population in the United States by using data from the 2007–2014 National Health and Nutrition Examination Survey (NHANES).
We combined the publicly available data from four NHANES datasets, namely those of 2007–2008, 2009–2010, 2011–2012, and 2013–2014, for analysis (https://wwwn.cdc.gov/nchs/nhanes/Default.aspx). The 2007–2014 NHANES datasets included data on a total of 40,617 participants; however, our analysis was limited to 23,482 participants aged 20 years and older. We excluded participants with missing information to calculate the United States fatty liver index (USFLI; n = 13,728). Participants positive for hepatitis B surface antigen and hepatitis C virus antibodies (n = 200) were also excluded. Additionally, we excluded individuals with elevated alcohol intake (≥10 g/day for females and ≥20 g/day for males; n = 1,535). We also excluded pregnant women (n = 94), participants with unreliable or incomplete dietary recall (n = 1,224) and missing weight data (n = 8), and participants with average energy intake > mean + 3SD (4,261 kcal) or < mean – 3SD (0 kcal) (n = 80). Finally, our analysis included 6,613 individuals comprising 3,067 men and 3,546 women (Figure 1). The Review Board of the National Center for Health Statistics granted the approval for using the NHANES data, and all participants provided informed consent.
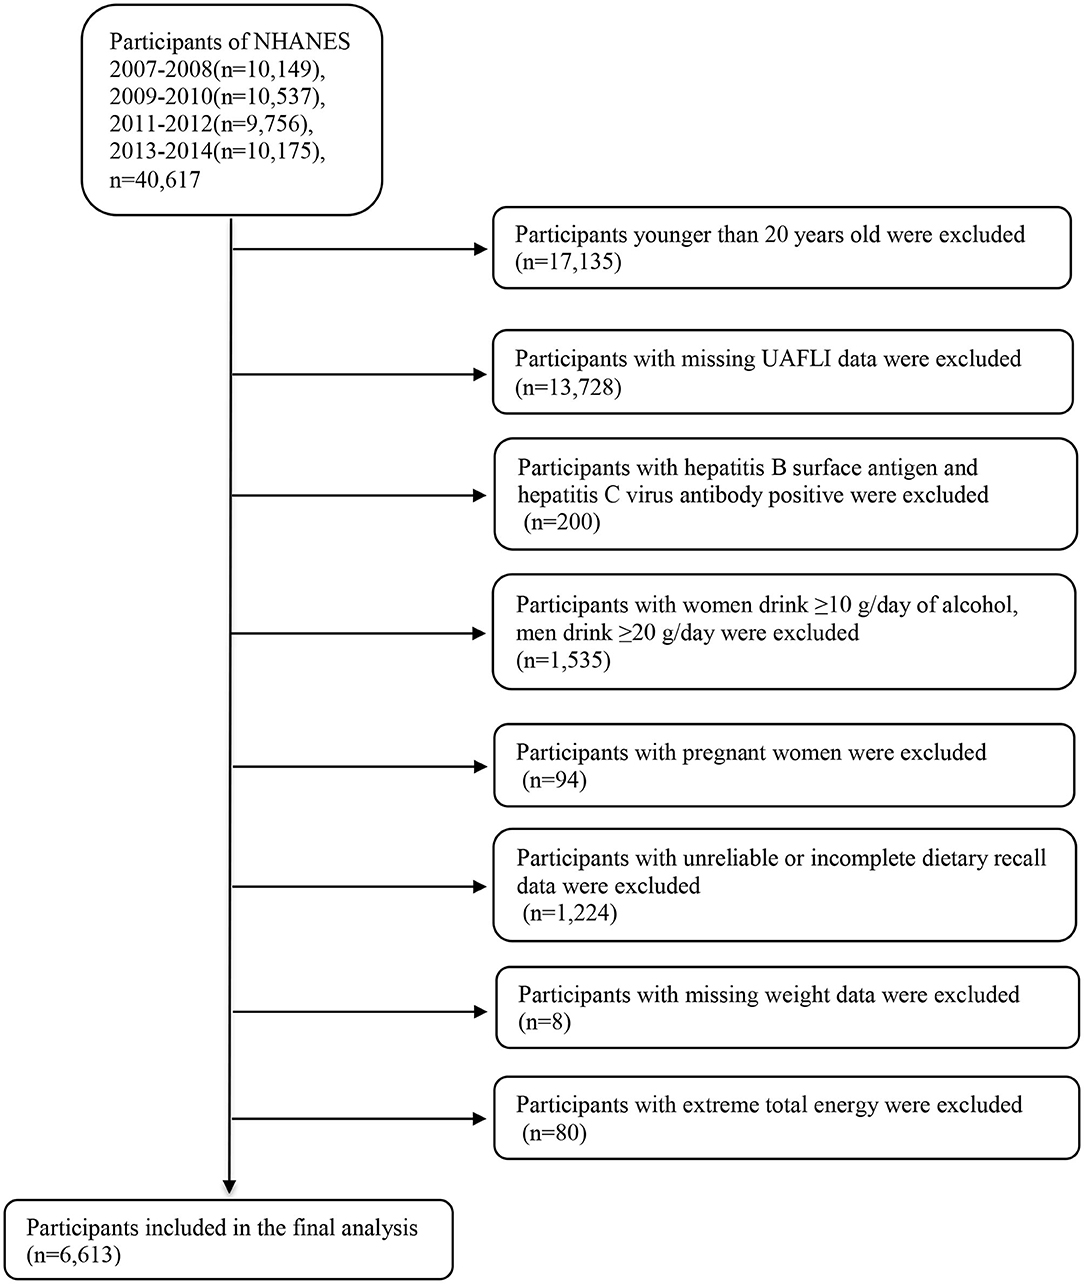
Figure 1. Flow chart of the selection process. NHANES, National Health and Nutrition Examination Survey.
We defined NAFLD on the basis of the USFLI. As described in previous articles, we calculated USFLI on the basis of race, age, gamma glutamyl transferase level, waist circumference, fasting insulin level, and fasting glucose level, and the cutoff value of 30 was used to define NAFLD (31). USFLI has been reported to be a reliable non-invasive NAFLD measurement and an independent predictor of overall and liver-related mortality (32–34).
Dietary fiber intake was assessed using two 24-h dietary recall interviews. The first interview was conducted at mobile examination center, and the second interview was performed after 3–10 days by telephone. (The specific measuring guides see the website: https://www.cdc.gov/nchs/nhanes/measuring_guides_dri/measuringguides.htm). Nutrient intakes were calculated on the basis of the United States Department of Agriculture Food and Nutrient Database for Dietary Studies (35). Average daily dietary fiber intakes were calculated and adjusted to body weight (22). Intakes of dietary fiber (mg/kg/day) were categorized according to quartiles.
Factors included in regression models to control the potential effects of confounding variables were the following: age (20–44 y, 45–59 y, 60–74 y, and ≥75 y), sex (male and female), race (Mexican-Americans, other Hispanics, non-Hispanic Whites, non-Hispanic Blacks, and other races), education level (under high school, high school, and above high school), annual household income (<$20,000, $20,000–$44,999, $45,000–$74,999, and ≥$75,000), smoking status (smoking at least 100 cigarettes in life or not), vigorous recreational activity (yes or no), diabetes (yes or no), hypertension (yes or no), average daily energy intake, levels of serum total cholesterol (TC) and uric acid (UA). Diabetes was defined as a fasting blood glucose level ≥7.0 mmol/L, 2-h plasma glucose level ≥11.1 mmol/L, use of diabetes pills or insulin, or self-reported diabetes diagnosis (36). Hypertension was defined as mean systolic blood pressure ≥130 mmHg, mean diastolic blood pressure ≥80 mmHg, use of prescription drugs for hypertension, or self-reported hypertension diagnosis (37).
Stata 15.0 was used for all statistical analyses. According to the NHANES analysis guidelines (38), new 8-year weights could be calculated by dividing the 2-year weights by four (the number of 2-year cycles). Main characteristics of participants are presented as mean ± standard deviation or median (interquartile ranges) for continuous variables and as frequencies (percentage) for categorical variables. Differences between participants with and without NAFLD were assessed using Student's t-test (for continuous variables with normal distribution) or non-parametric test (for non-normal distribution). Differences in categorical variables were evaluated using chi-square tests. Intakes of dietary fiber were categorized according to quartiles; quartile 1 was used as a reference category. The binary logistic regression model was used to analyze the relationship between NAFLD and intakes of total fiber and cereal, fruit, and vegetable fiber. Model 1 was adjusted for age and sex. Model 2 was further adjusted for race, educational level, smoking status, recreational activities, annual household income, hypertension, diabetes, average daily energy intake, and UA and TC levels. Stratified analysis was conducted by sex (male and female) and age (20–44 y and ≥45 y age groups) to determine the relationship between dietary fiber intake and NAFLD. Odds ratios (ORs) and 95% confidence intervals (CIs) were calculated from logistic regression analyses. Dose-response relationships were evaluated using a restricted cubic spline function with three knots located at the 5, 50, and 95th percentiles of the exposure distribution in the fully adjusted model. The non-linear p-value was calculated by testing the value of the quadratic zero spline coefficient. A two-tailed p-value <0.05 was considered statistically significant.
Table 1 presents the comparison of baseline characteristics between NAFLD and non-NAFLD groups according to sex. Of 6,613 subjects, the overall prevalence of NAFLD was 36.70% (41.93% for males and 32.09% for females). Irrespective of sex, the NAFLD group, compared with the non-NAFLD group, tended to be older, Mexican-American, and smokers. Moreover, the NAFLD group exhibited a higher number of participants with hypertension or diabetes, higher body mass index, and higher serum UA level, whereas the education level, income, vigorous recreational physical activity level, and total fiber intake and cereal, fruit, and vegetable fiber intakes were lower in the NAFLD group (all p < 0.05).
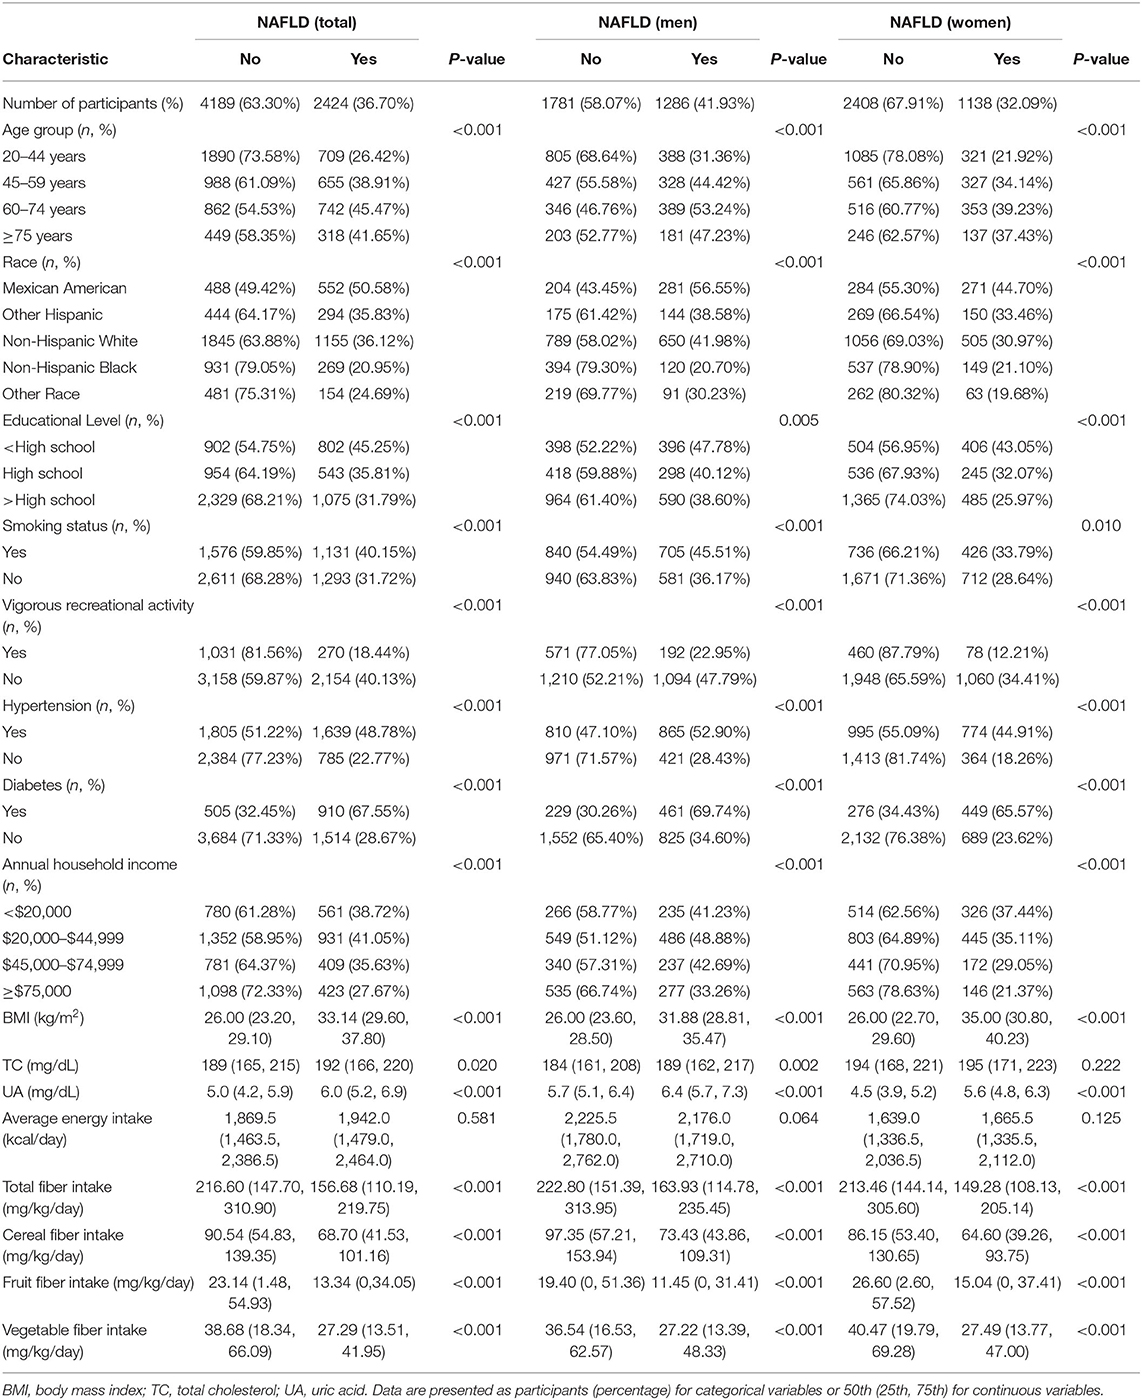
Table 1. Baseline characteristics of the participants by NAFLD, U.S. adult aged ≥20 years, NHANES 2007-2014.
Table 2 presents the weighted ORs (95% CIs) of NAFLD based on quartiles of total fiber and cereal, fruit, and vegetable fiber intakes. Univariate logistic regression analysis demonstrated the association of intakes of total fiber and cereal, fruit, and vegetable fiber with decreased NAFLD risk. Compared with the lowest quartile, the ORs (95% CI) of NAFLD for the highest quartile intake of total fiber, cereal fiber, fruit fiber, and vegetable fiber were 0.20 (0.16–0.25), 0.32 (0.26–0.40), 0.44 (0.36–0.53), and 0.41 (0.33–0.51), respectively. After adjusting for age and sex (model 1), the results were similar to the crude ORs (95% CIs). After further adjusting for race, education level, smoking status, vigorous recreational activities, hypertension, diabetes, income, average daily energy intake, UA level, and TC level (model 2), dietary fiber (various sources) intakes still exhibited a negative association with NAFLD risk. We further analyzed the associations of NAFLD with dietary fiber intakes as mg/kcal/day, and the inverse association between total fiber intake and NAFLD was still significant in all models (Supplementary Table 1).
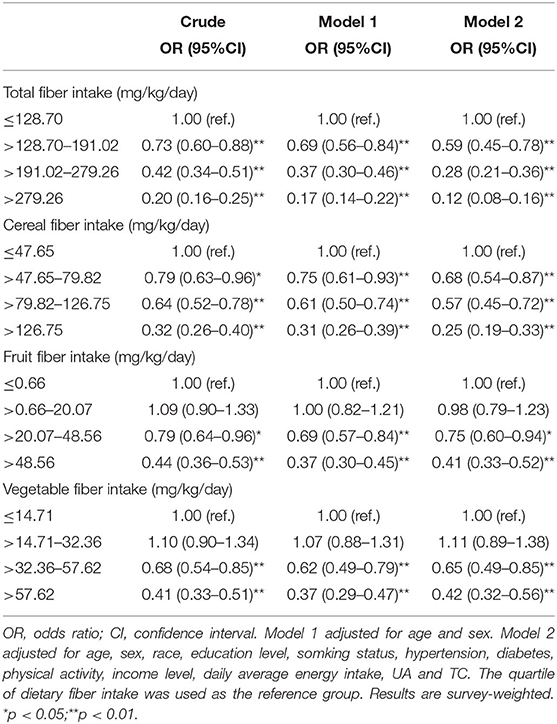
Table 2. Weighted ORs and 95% CIs for NAFLD according to the quartiles of dietary fiber intake.
Associations of dietary fiber intake with NAFLD in stratified analyses by age and sex are presented in Supplementary Table 2 and Supplementary Table 3, respectively. The inverse associations of total fiber and cereal, fruit, and vegetable fiber intakes with NAFLD were observed in all models, irrespective of sex. In model 2, the ORs (95% CI) of NAFLD in male participants for the highest vs. lowest quartile were 0.15 (0.10–0.24) for total fiber intake, 0.31 (0.22–0.43) for cereal fiber intake, 0.46 (0.34–0.61) for fruit fiber intake, and 0.52 (0.34–0.80) for vegetable fiber intake. The corresponding values in female participants were 0.08 (0.05–0.13), 0.20 (0.12–0.32), 0.36 (0.26–0.48), and 0.34 (0.23–0.49), respectively. Multivariate analysis (model 2) indicated that for participants aged <45 years, the ORs of the NAFLD group for quartile 4 of total fiber, cereal fiber, fruit fiber, and vegetable fiber intakes, compared with quartile 1, were 0.14 (0.08–0.24), 0.29 (0.19–0.46), 0.49 (0.33–0.72), and 0.44 (0.28–0.68), respectively. For participants aged more than 45 years, the corresponding values were 0.10 (0.07–0.15), 0.22 (0.16–0.31), 0.34 (0.25–0.47), and 0.41 (0.28–0.59), respectively.
Figure 2 illustrate the associations of total fiber and cereal, fruit, and vegetable fiber intakes with NAFLD in the restricted cubic spline model. The correlation between total fiber intake and NAFLD was non-linearly negative (for non-linearity, p < 0.01). With an increase in total fiber intake, the risk of NAFLD decreased and reached a plateau at approximately 293 mg/kg/day (OR = 0.08; 95% CI = 0.05–0.12). Cereal fiber, fruit fiber, and vegetable fiber intakes exhibited a linear inverse association with NAFLD risk (for non-linearity, p = 0.32, 0.90, and 0.65, respectively). In addition, when the intake reached 5 mg/kg/day (OR = 0.99; 95% CI = 0.98–0.99) for cereal fiber, 3 mg/kg/day (OR = 0.97; 95% CI = 0.94–0.99) for fruit fiber, and 2 mg/kg/day (OR = 0.97; 95% CI = 0.96–0.99) for vegetable fiber, all these sources of dietary fiber exhibited significant protective effects against NAFLD.
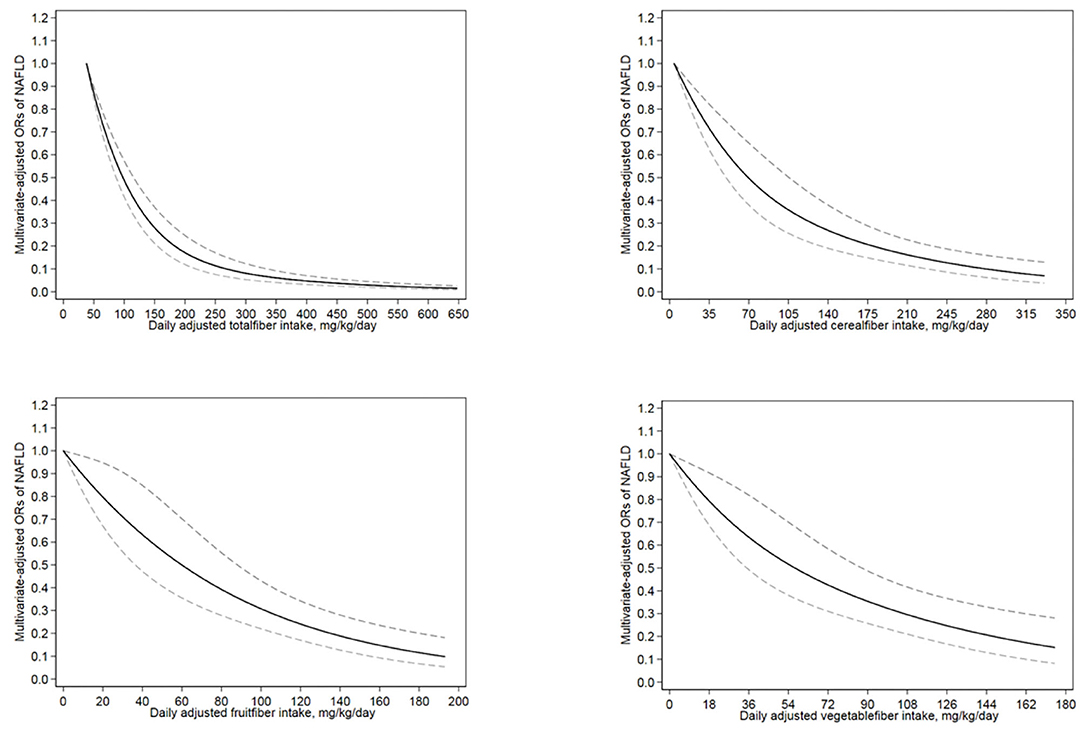
Figure 2. The restricted cubic spline model showed a dose-response relationship between total, cereal, fruit and vegetable dietary fiber intake per kilogram of body weight per day and NAFLD. The lowest level of total fiber intake (38 mg/kg/day), cereal fiber intake (4 mg/kg/day), fruit fiber intake (0 mg/kg/day) and vegetable fiber intake (0 mg/kg/day) were used as the reference group, respectively. Adjustments were made according to age, sex, race, education level, smoking status, income level, hypertension, diabetes, vigorous recreational activity, average energy intake, UA and TC. The solid line and the dotted line represent the estimated OR and the corresponding 95%CI, respectively. OR, odds ratio.
This nationally representative cross-sectional study demonstrated an inverse correlation between total dietary fiber intake (mg/kg/d) and NAFLD risk in the general adult population in the United States after adjusting for multiple potential confounding factors. In the analysis stratified by age (<45 y and ≥45 y groups) and sex (model 2), the inverse association between total fiber intake and NAFLD was still statistically significant. We further studied the relationship between dietary fiber intake from different sources and NAFLD risk. Our results indicated that dietary intakes of cereal, fruit, and vegetable fiber were negatively correlated with NAFLD risk.
We also found a non-linear relationship between total fiber intake and NAFLD risk; an increase in total fiber intake from 38 mg/kg/d to 117 mg/kg/d (Figure 2) decreased the risk of NAFLD by 60%. In addition, cereal, fruit, and vegetable fiber intakes exhibited linear inverse associations with NAFLD risk. To our knowledge, this is the first population-based study to explore the dose-response relationship between dietary intakes of fiber from different sources and NAFLD.
To date, several studies have examined the associations between dietary fiber intake and NAFLD. A cross-sectional study on Dutch adults (general population) demonstrated low consumption of dietary fiber among participants with high fatty liver index (26). Another study conducted in China demonstrated a negative association between total dietary fiber intake and NAFLD (27). A case–control study in Iran also showed lower dietary fiber intake in patients with NAFLD than among healthy controls (28). Thus, our finding indicating an inverse association between total dietary fiber intake and NAFLD is consistent with the findings of the aforementioned studies. However, a cross-sectional study in Israel found no significant difference in dietary fiber intake between NAFLD and control groups (29). Moreover, one cross-sectional study in China revealed higher dietary fiber intake in the NAFLD group than in the control group (30). Notably, neither of these two studies analyzed the relationship between dietary fiber intake and NAFLD risk after adjusting for confounding factors.
Although the biological mechanisms underlying the association between dietary fiber intake and NAFLD are poorly understood, some possible mechanisms for the negative correlation between dietary fiber intake and NAFLD have been proposed; specifically, key roles of insulin resistance, hepatic lipid metabolism, and intestinal floral changes in the pathophysiological process of NAFLD have been identified (39–42). Dietary fiber intake may delay gastric emptying and decrease postprandial blood glucose (39). In addition, studies have shown that dietary fiber may promote lipid excretion (40). Moreover, dietary fiber is fermented by intestinal microorganisms to produce short-chain fatty acids (propionic acid, butyric acid, etc.), which improve insulin sensitivity, and regulate hepatic lipid metabolism (41, 42).
This study has several strengths. First, we assessed the dose-response relationship between different sources of dietary fiber intake and NAFLD risk for the first time. Second, we used data from a large nationally representative survey, which increased the statistical power and reliability of the results. Third, we established a negative correlation between dietary fiber intake and NAFLD that was statistically significant even after adjusting for potential confounding factors.
Nevertheless, our research also has some limitations. First, our study was cross-sectional in design and could not determine the causal relationship between dietary fiber intake and NAFLD risk. Second, dietary data were calculated on the basis of two 24-h recall interviews that may have caused recall bias. Third, although the USFLI used to define NAFLD possessed a superior sensitivity (31), USFLI is unable to stage NAFLD, and the relationship between dietary fiber and NAFLD severity is unclear. Moreover, it should be emphasized that NAFLD in this study, was not clinically diagnosed and was merely estimated from indices. Further well-designed researches are needed in the future.
In conclusion, dietary intakes of total fiber and cereal, fruit, and vegetable fiber are negatively associated with NAFLD risk in the general adult population in the United States. General U.S. adults should be recommended to increase dietary fiber intake to prevent NAFLD. In addition, large prospective studies are needed to validate our findings.
The datasets generated for this study can be found in online repositories. The names of the repository/repositories and accession number(s) can be found below: https://www.cdc.gov/nchs/nhanes/.
Written informed consent was obtained from the individual(s) for the publication of any potentially identifiable images or data included in this article.
YS and AY designed the study. LM and YQ acquired the data. HZ and JC analyzed the data. HZ drafted the manuscript and YS critically revised the manuscript. All authors read and approved the final manuscript.
This study was supported by the Natural Science Foundation of China [Nos. 81703206 and 81973015], Danone nutrition research and education fund [DIC2019-09] and Science and Technology Program of Qingdao [No. 19-6-1-52-nsh].
The authors declare that the research was conducted in the absence of any commercial or financial relationships that could be construed as a potential conflict of interest.
The authors thank all of the people who participated in this study.
The Supplementary Material for this article can be found online at: https://www.frontiersin.org/articles/10.3389/fnut.2020.593735/full#supplementary-material
1. Chalasani N, Younossi Z, Lavine JE, Charlton M, Cusi K, Rinella M, et al. The diagnosis and management of nonalcoholic fatty liver disease: practice guidance from the American Association for the study of liver diseases. Hepatology. (2018) 67:328–57. doi: 10.1002/hep.29367
2. Bellentani S. The epidemiology of non-alcoholic fatty liver disease. Liver Int. (2017) 37:81–4. doi: 10.1111/liv.13299
3. Cao Y, Wang C, Liu J, Liu ZM, Ling WH, Chen YM. Greater serum carotenoid levels associated with lower prevalence of nonalcoholic fatty liver disease in Chinese adults. Sci Rep. (2015) 5:12951. doi: 10.1038/srep12951
4. Estes C, Anstee QM, Arias-Loste MT, Bantel H, Bellentani S, Caballeria J, et al. Modeling NAFLD disease burden in China, France, Germany, Italy, Japan, Spain, United Kingdom, and United States for the period 2016–2030. J Hepatol. (2018) 69:896–904. doi: 10.1016/j.jhep.2018.05.036
5. Wang XJ, Malhi H. Nonalcoholic fatty liver disease. Ann Intern Med. (2018) 169:Itc65–80. doi: 10.7326/AITC201811060
6. Byrne CD, Targher G. NAFLD: a multisystem disease. J Hepatol. (2015) 62:S47–64. doi: 10.1016/j.jhep.2014.12.012
7. Chacko KR, Reinus J. Extrahepatic complications of nonalcoholic fatty liver disease. Clin Liver Dis. (2016) 20:387–401. doi: 10.1016/j.cld.2015.10.004
8. Musso G, Gambino R, Cassader M, Pagano G. Meta-analysis: natural history of non-alcoholic fatty liver disease (NAFLD) and diagnostic accuracy of non-invasive tests for liver disease severity. Ann Med. (2011) 43:617–49. doi: 10.3109/07853890.2010.518623
9. Cohen JC, Horton JD, Hobbs HH. Human fatty liver disease: old questions and new insights. Science. (2011) 332:1519–23. doi: 10.1126/science.1204265
10. Younossi ZM, Koenig AB, Abdelatif D, Fazel Y, Henry L, Wymer M. Global epidemiology of nonalcoholic fatty liver disease-meta-analytic assessment of prevalence, incidence, and outcomes. Hepatology. (2016) 64:73–84. doi: 10.1002/hep.28431
11. Le MH, Devaki P, Ha NB, Jun DW, Te HS, Cheung RC, et al. Prevalence of non-alcoholic fatty liver disease and risk factors for advanced fibrosis and mortality in the United States. PLoS ONE. (2017) 12:e0173499. doi: 10.1371/journal.pone.0173499
12. Rinella ME, Loomba R, Caldwell SH, Kowdley K, Charlton M, Tetri B, et al. Controversies in the diagnosis and management of NAFLD and NASH. Gastroenterol Hepatol (N Y). (2014) 10:219–27.
13. Mollard RC, Senechal M, MacIntosh AC, Hay J, Wicklow BA, Wittmeier KD, et al. Dietary determinants of hepatic steatosis and visceral adiposity in overweight and obese youth at risk of type 2 diabetes. Am J Clin Nutr. (2014) 99:804–12. doi: 10.3945/ajcn.113.079277
14. Ouyang X, Cirillo P, Sautin Y, McCall S, Bruchette JL, Diehl AM, et al. Fructose consumption as a risk factor for non-alcoholic fatty liver disease. J Hepatol. (2008) 48:993–9. doi: 10.1016/j.jhep.2008.02.011
15. Shim P, Choi D, Park Y. Association of blood fatty acid composition and dietary pattern with the risk of non-alcoholic fatty liver disease in patients who underwent cholecystectomy. Ann Nutr Metab. (2017) 70:303–11. doi: 10.1159/000475605
16. Dorosti M, Jafary Heidarloo A, Bakhshimoghaddam F, Alizadeh M. Whole-grain consumption and its effects on hepatic steatosis and liver enzymes in patients with non-alcoholic fatty liver disease: a randomised controlled clinical trial. Br J Nutr. (2020) 123:328–36. doi: 10.1017/S0007114519002769
17. Koutnikova H, Genser B, Monteiro-Sepulveda M, Faurie JM, Rizkalla S, Schrezenmeir J, et al. Impact of bacterial probiotics on obesity, diabetes and non-alcoholic fatty liver disease related variables: a systematic review and meta-analysis of randomised controlled trials. BMJ Open. (2019) 9:e017995. doi: 10.1136/bmjopen-2017-017995
18. Maleki Z, Jazayeri S, Eslami O, Shidfar F, Hosseini AF, Agah S, et al. Effect of soy milk consumption on glycemic status, blood pressure, fibrinogen and malondialdehyde in patients with non-alcoholic fatty liver disease: a randomized controlled trial. Complement Ther Med. (2019) 44:44–50. doi: 10.1016/j.ctim.2019.02.020
19. Buil-Cosiales P, Martinez-Gonzalez MA, Ruiz-Canela M, Díez-Espino J, García-Arellano A, Toledo E. Consumption of fruit or fiber-fruit decreases the risk of cardiovascular disease in a mediterranean young cohort. Nutrients. (2017) 9:295. doi: 10.3390/nu9030295
20. Kranz S, Dodd KW, Juan WY, Johnson LK, Jahns L. Whole grains contribute only a small proportion of dietary fiber to the U.S. diet. Nutrients. (2017) 9:153. doi: 10.3390/nu9020153
21. Park Y, Hunter DJ, Spiegelman D, Bergkvist L, Berrino F, van den Brandt PA, et al. Dietary fiber intake and risk of colorectal cancer: a pooled analysis of prospective cohort studies. JAMA. (2005) 294:2849–57. doi: 10.1001/jama.294.22.2849
22. Sun B, Shi X, Wang T, Zhang D. Exploration of the association between dietary fiber intake and hypertension among U.S. adults using 2017 American College of Cardiology/American Heart Association Blood Pressure Guidelines: NHANES 2007(-)2014. Nutrients. (2018) 10:091. doi: 10.3390/nu10081091
23. Sun Y, Sun J, Zhang P, Zhong F, Cai J, Ma A. Association of dietary fiber intake with hyperuricemia in U.S. adults. Food Funct. (2019) 10:4932–40. doi: 10.1039/C8FO01917G
24. Weickert MO, Pfeiffer AF. Metabolic effects of dietary fiber consumption and prevention of diabetes. J Nutr. (2008) 138:439–42. doi: 10.1093/jn/138.3.439
25. Yao B, Fang H, Xu W, Yan Y, Xu H, Liu Y, et al. Dietary fiber intake and risk of type 2 diabetes: a dose-response analysis of prospective studies. Eur J Epidemiol. (2014) 29:79–88. doi: 10.1007/s10654-013-9876-x
26. Rietman A, Sluik D, Feskens EJM, Kok FJ, Mensink M. Associations between dietary factors and markers of NAFLD in a general Dutch adult population. Eur J Clin Nutr. (2018) 72:117–23. doi: 10.1038/ejcn.2017.148
27. Xia Y, Zhang S, Zhang Q, Liu L, Meng G, Wu H, et al. Insoluble dietary fibre intake is associated with lower prevalence of newly-diagnosed non-alcoholic fatty liver disease in Chinese men: a large population-based cross-sectional study. Nutr Metab (Lond). (2020) 17:4. doi: 10.1186/s12986-019-0420-1
28. Zolfaghari H, Askari G, Siassi F, Feizi A, Sotoudeh G. Intake of nutrients, fiber, and sugar in patients with nonalcoholic fatty liver disease in comparison to healthy individuals. Int J Prev Med. (2016) 7:98. doi: 10.4103/2008-7802.188083
29. Zelber-Sagi S, Nitzan-Kaluski D, Goldsmith R, Webb M, Blendis L, Halpern Z, et al. Long term nutritional intake and the risk for non-alcoholic fatty liver disease (NAFLD): a population based study. J Hepatol. (2007) 47:711–7. doi: 10.1016/j.jhep.2007.06.020
30. Yang Z, Wu J, Li X, Xie D, Wang Y, Yang T. Association between dietary iron intake and the prevalence of nonalcoholic fatty liver disease: a cross-sectional study. Medicine (Baltimore). (2019) 98:e17613. doi: 10.1097/MD.0000000000017613
31. Ruhl CE, Everhart JE. Fatty liver indices in the multiethnic United States National Health and Nutrition Examination Survey. Aliment Pharmacol Ther. (2015) 41:65–76. doi: 10.1111/apt.13012
32. Kim D, Kim W, Adejumo AC, Cholankeril G, Tighe SP, Wong RJ, et al. Race/ethnicity-based temporal changes in prevalence of NAFLD-related advanced fibrosis in the United States, 2005–2016. Hepatol Int. (2019) 13:205–13. doi: 10.1007/s12072-018-09926-z
33. Kim D, Yoo ER, Li AA, Tighe SP, Cholankeril G, Harrison SA, et al. Depression is associated with non-alcoholic fatty liver disease among adults in the United States. Aliment Pharmacol Ther. (2019) 50:590–8. doi: 10.1111/apt.15395
34. Meffert PJ, Baumeister SE, Lerch MM, Mayerle J, Kratzer W, Volzke H. Development, external validation, and comparative assessment of a new diagnostic score for hepatic steatosis. Am J Gastroenterol. (2014) 109:1404–14. doi: 10.1038/ajg.2014.155
35. Ahuja JK, Moshfegh AJ, Holden JM, Harris E. USDA food and nutrient databases provide the infrastructure for food and nutrition research, policy, and practice. J Nutr. (2013) 143:241s−9s. doi: 10.3945/jn.112.170043
36. Menke A, Casagrande S, Geiss L, Cowie CC. Prevalence of and trends in diabetes among adults in the United States, 1988–2012. JAMA. (2015) 314:1021–9. doi: 10.1001/jama.2015.10029
37. Whelton PK, Carey RM, Aronow WS, Casey DE, Jr., Collins KJ, Dennison Himmelfarb C, et al. 2017 ACC/AHA/AAPA/ABC/ACPM/AGS/APhA/ASH/ASPC/NMA/PCNA guideline for the prevention, detection, evaluation, and management of high blood pressure in adults: a report of the American College of Cardiology/American Heart Association Task Force on Clinical Practice Guidelines. J Am Coll Cardiol. (2018) 71:e127–248. doi: 10.1161/HYP.0000000000000077
38. Chen JDP, Clark J, Shin HC, Rammon JR, Burt VL. National health and nutrition examination survey: estimation procedures, 2011–2014. Vital Health Stat2. (2018) 177:1–26.
39. de Carvalho CM, de Paula TP, Viana LV, Machado VM, de Almeida JC, Azevedo MJ. Plasma glucose and insulin responses after consumption of breakfasts with different sources of soluble fiber in type 2 diabetes patients: a randomized crossover clinical trial. Am J Clin Nutr. (2017) 106:1238–45. doi: 10.3945/ajcn.117.157263
40. Kimm SY. The role of dietary fiber in the development and treatment of childhood obesity. Pediatrics. (1995) 96:1010–4.
41. Lundin EA, Zhang JX, Lairon D, Tidehag P, Aman P, Adlercreutz H, et al. Effects of meal frequency and high-fibre rye-bread diet on glucose and lipid metabolism and ileal excretion of energy and sterols in ileostomy subjects. Eur J Clin Nutr. (2004) 58:1410–9. doi: 10.1038/sj.ejcn.1601985
Keywords: Non-alcoholic fatty liver disease (NAFLD), dietary intake, cereal fiber, fruit fiber, vegetable fiber, dose-response, National Health and Nutrition Examination Survey (NHANES)
Citation: Zhao H, Yang A, Mao L, Quan Y, Cui J and Sun Y (2020) Association Between Dietary Fiber Intake and Non-alcoholic Fatty Liver Disease in Adults. Front. Nutr. 7:593735. doi: 10.3389/fnut.2020.593735
Received: 24 August 2020; Accepted: 28 October 2020;
Published: 19 November 2020.
Edited by:
Fredrik Rosqvist, Uppsala University, SwedenReviewed by:
Costas A. Anastasiou, Harokopio University, GreeceCopyright © 2020 Zhao, Yang, Mao, Quan, Cui and Sun. This is an open-access article distributed under the terms of the Creative Commons Attribution License (CC BY). The use, distribution or reproduction in other forums is permitted, provided the original author(s) and the copyright owner(s) are credited and that the original publication in this journal is cited, in accordance with accepted academic practice. No use, distribution or reproduction is permitted which does not comply with these terms.
*Correspondence: Yongye Sun, c3VubnlsZWFmQHFkdS5lZHUuY24=
Disclaimer: All claims expressed in this article are solely those of the authors and do not necessarily represent those of their affiliated organizations, or those of the publisher, the editors and the reviewers. Any product that may be evaluated in this article or claim that may be made by its manufacturer is not guaranteed or endorsed by the publisher.
Research integrity at Frontiers
Learn more about the work of our research integrity team to safeguard the quality of each article we publish.