 Xiuqin Fan
 Hongyang Yao1
 Ping Li
 Rui Wang
95% of researchers rate our articles as excellent or good
Learn more about the work of our research integrity team to safeguard the quality of each article we publish.
Find out more
ORIGINAL RESEARCH article
Front. Nutr. , 24 November 2020
Sec. Nutrition and Metabolism
Volume 7 - 2020 | https://doi.org/10.3389/fnut.2020.589771
Quantitative PCR (qPCR), the most accurate and sensitive technique for quantifying mRNA expression, and choice of appropriate reference genes for internal error controlling in qPCR are essential to understanding the molecular mechanisms that drive the obesity epidemic and its comorbidities. In this study, using the high-fat diet (HFD)-induced obese mouse model, we assessed the expression of 10 commonly used reference genes to validate gene-expression stability in adipose tissue, liver, and muscle across different time points (4, 8, 12, and 16 weeks after HFD feeding) during the process of obesity. The data were analyzed by the GeNorm, NormFinder, BestKeeper, and Delta-Ct method, and the results showed that the most stable reference genes were different for a specific organ or tissue in a specific time point; however, PPIA, RPLP0, and YWHAZ were the top three most stable reference genes in qPCR experiments on adipose, hepatic tissues, and muscles of mice in diet-induced obesity. In addition, the mostly used genes ACTB and GAPDH were more unstable in the fat and liver, the ACTB mRNA levels were increased in four adipose tissues, and the GAPDH mRNA levels were decreased in four adipose tissues and liver after HFD feeding. These results suggest that PPIA, RPLP0, or YWHAZ may be more appropriate to be used as reference gene than ACTB and GAPDH in the adipose tissue and liver of mice during the process of high-fat diet-induced obesity.
The rapidly increasing prevalence of obesity worldwide and its associated metabolic complications, such as non-alcoholic fatty liver, dyslipidemia, and type 2 diabetes, have become a threat for human health (1, 2). To investigate the underlying mechanisms, a variety of tools and techniques including metabolic, proteomic, transcriptomic, and novel DNA sequencing strategies have been employed, among which quantitative PCR (qPCR) and reverse transcription (RT)-qPCR are the most accurate and sensitive techniques for quantifying mRNA in biological samples and have become accessible to virtually all research labs (3–5). However, there remain a number of problems associated with qPCR use, including variability of sample preparation, extraction and storage, RNA isolation and purification, RT, poor choice of primers, and inappropriate reference targets (3–5). In 2009, the minimum information for the publication of quantitative real-time PCR experiments (MIQE) was published to provide the scientific community with a consistent workflow and key considerations to perform qPCR experiments (4). However, the MIQE standards have not been embraced more widely in practice.
Normalizing to a reference gene, whose expression has to be stable and independent of the experimental conditions, is a key step for internally controlling for error in qPCR (4–6). During the past decades, β-actin (ACTB), glyceraldehyde-3-phosphate dehydrogenase (GAPDH), 18S ribosomal RNA (18S), ribosomal protein large P0 (RPLP0), and TATA box-binding protein (TBP) have been used extensively as reference genes in physiological status and diseases including obesity (7–10). However, increasing evidence suggests that the expression of reference genes often varies considerably with differences in subjects, animal species, experimental models, disease conditions, tissue types, etc. (11, 12). Therefore, it is essential to validate potential reference genes to establish whether they are appropriate for a specific experimental purpose.
In recent years, several research groups have evaluated stability of reference genes for qPCR in human and mouse adipose tissue by different methods of mathematical algorithms (7, 13–17). However, consistent conclusions have not been reached owing to constant changes in fat accumulation of adipose tissue and associated cell size with the development of obesity, different analyzing methods used, etc.
Therefore, in this study, after reviewing the literature, a total of 10 commonly used reference genes involved in different biological functions, including ACTB, GAPDH, hypoxanthine phosphoribosyl transferase 1 (HPRT), 18S, RPLP0, beta-2-microglobulin (B2M), TBP, peptidylprolyl isomerase A (PPIA), ubiquitin C (UBC), and tyrosine 3-monooxygenase/tryptophan 5-monooxygenase activation protein, and zeta polypeptide (YWHAZ), were determined to analyze gene-expression stability in tissues (adipose tissue, liver, and muscle) associated with energy and fat metabolism across different time points during the development of obesity in mice, using the NormFinder (18), GeNorm (11), BestKeeper (19), and Delta-Ct method (20).
Three- to four-week-old male C57BL/6J mice were purchased from the SPF Laboratory Animal Technology Co., Ltd (Beijing), and were housed at the animal facilities in the National Institute of Occupational Health and Poison Control, China CDC, under a 12-h (h) light 12-h dark cycle with cycles of air ventilation and constant temperature (23°C), with free access to water and food. After 1 week of recovery from transportation, the mice were randomly divided into two groups (n = 32 in each group) and fed with a high-fat diet (HFD) (34.9% fat by wt., 60% kcal) (No. H10060) and a normal-fat diet (NFD) (4.3% fat by wt., 10% kcal) (No. H10010) (Beijing Huafukang Bioscience Co. Inc., Beijing, China) based on formulas of the high-fat diets for DIO mice (D12492) and the paired control diet (D12450B) (Research Diets, New Brunswick, NJ, USA). The fat in both of the diets was from soybean oil and lard oil, and the diet formula was shown in Supplementary Table 1. The diets were sterilized with γ-irradiation 25 kGy and stored at −20°C until use.
Mouse body weight was measured weekly, and food consumption was detected at 4, 8, 12, and 16 weeks after feeding with 7 consecutive days of records. At 4, 8, 12, and 16 weeks after feeding respectively, the 12-h fasted mice (n = 8 in each group) in a fasted state were euthanized by intraperitoneal injection of an overdose of Avertin (500 mg kg−1 of 2,2,2-tribromoethanol, T-4840-2, Sigma-Aldrich Chemie GmbH, Steinheim, Germany) to minimize suffering. After euthanization, the epididymal, perirenal, subcutaneous inguinal fat, subscapular brown adipose tissue, liver, and femoral muscle were immediately dissected free of the surrounding tissue, removed, wrapped in aluminum foil, and frozen in liquid N2 and then were transferred to −80°C until use.
Total RNA in tissues was prepared using the TRIzol Reagent kit (Invitrogen, Carlsbad, CA, USA). Briefly, 80 mg of epididymal, perirenal, or subcutaneous inguinal fat tissues and 20 mg of subscapular brown adipose tissue, liver, or femoral muscle were homogenized in 1 mL of TRIzol reagent. After centrifugation, RNA was extracted with chloroform and precipitated with isopropyl alcohol, then resuspended in 30-100 μL of DEPC-treated water, and finally its concentration and purity in each sample were determined by a DS-11 Spectrophotometer (DeNovix) (Supplementary Table 2). One microgram of extracted RNA in each sample was used for reverse-transcribed cDNA First-strand (cDNA) synthesis using the All-in-One First-Strand cDNA Synthesis SuperMix for qPCR (One-Step gDNA Removal) (TransGen Biotech, Beijing, China) according to the procedures provided by the manufacturer. The mRNA expression of targeted genes including ACTB, GAPDH, 18S, HPRT, RPLP0, B2M, TBP, PPIA, UBC, and YWHAZ was measured by real-time qPCR with a CFX96 Touch™ Real-Time PCR Detection System (Bio-Rad) using Top Green qPCR SuperMix (Trans Gen). The oligonucleotide primers for these target genes were from the PrimerBank (https://pga.mgh.harvard.edu/primerbank/), and the published papers (7, 21, 22) were tested for specificity using Primer-BLAST (https://www.ncbi.nlm.nih.gov/tools/primer-blast/index.cgi?LINK_LOC=BlastHome), showing all to be validated with over 90% efficiency in amplification (Table 1). Each reaction was performed in the final volume of 20 μL including 1 μL of cDNA and 200 nM of each primer, with the thermocycle program consisting of an initial hot start cycle at 95°C for 30 s, followed by 40 cycles at 95°C for 5 s, 60°C for 15 s, and 72°C for 10 s. The specificity of the amplification was analyzed by agarose gel electrophoresis (Supplementary Figure 1) and melting curves (Supplementary Figure 2).
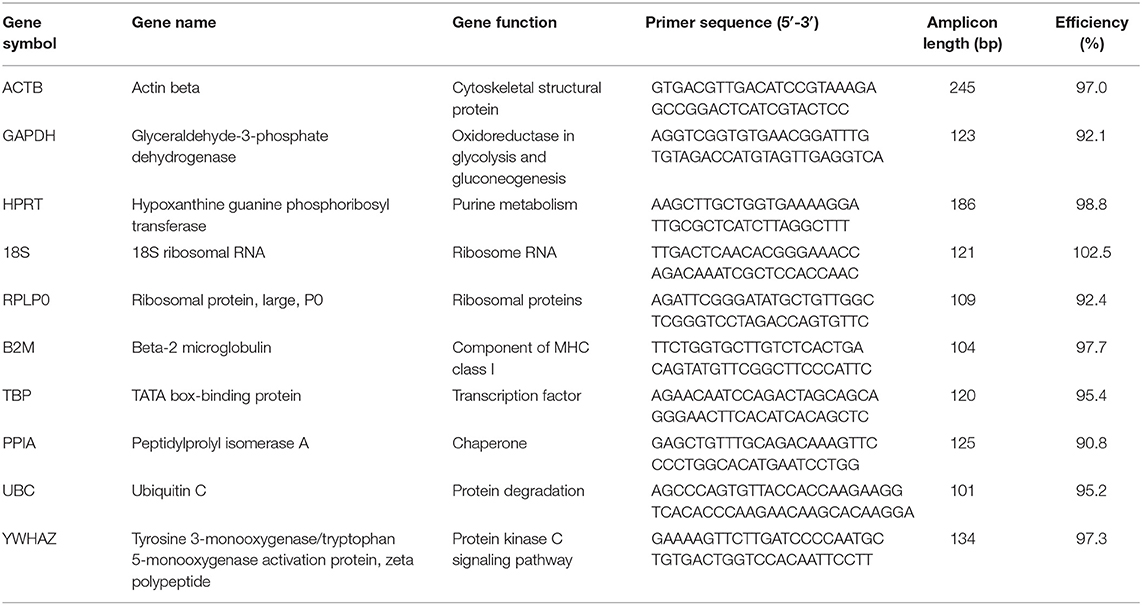
Table 1. Detail of primers used for each of the 10 evaluated reference genes.
Reference gene expression variability was evaluated by a combined analysis of Delta-Ct method, Normfinder, geNorm, and BestKeeper. The Ct (cycle threshold) is defined as the number of cycles required for the fluorescent signal to cross the threshold (i.e., exceeds background level). Ct levels are inversely proportional to the amount of target nucleic acid in the sample (i.e., the lower the Ct level the greater the amount of target nucleic acid in the sample). Ct is specific to the expression of one gene whereas Delta Ct shows the difference of expression between two genes. This Delta-Ct method generated “pair of genes” comparisons between each candidate reference genes and the other candidate reference genes within each sample and calculated the average standard deviation (SD) against the other candidate reference genes (20). The NormFinder algorithm directly and robustly estimates candidate normalization gene expression stability and ranks reference genes depending on the variation within the intra- and the inter-group. As Andersen mentioned in his report, the NormFinder procedure focuses on differences between sample subgroups, and the result is less affected by the correlated expression of the reference genes (18). In 2002, Vandesompele et al. have developed the software GeNorm that evaluates the most stable pair of reference genes by the M value, which is calculated from the arithmetic mean of pair-wise variations of each gene, a low M value represented stable gene expression (11). BestKeeper calculates the expression variability of reference genes based on the SD, and the coefficient of variance (CV) takes into account Ct values of candidate reference genes instead of relative quantities (19). The genes with the lowest SD and CV were treated as the most stable reference genes, and reference genes with SD > 1 were excluded (19). Following these four analyses, each candidate reference gene obtained a specific ranking value. A consensual analysis was finally performed by the calculation of the geometric mean of the four ranking values for each gene leading to a consensus variability score for each reference gene.
All statistical analyses were conducted by SPSS 21.0. The Kolmogorov–Smirnov test was used to evaluate whether the data is normally distributed. We used the unpaired t-test for the normally distributed data and the Mann–Whitney U-test for the non-normally distributed data to calculate the difference between the NFD group and the HFD group, where P < 0.05 was considered statistically significant.
As shown in Figure 1, mouse body weight was significantly increased in the HFD group with more calories to intake, compared to the NFD group after feeding for 4, 8, 12, or 16 weeks (P < 0.05).
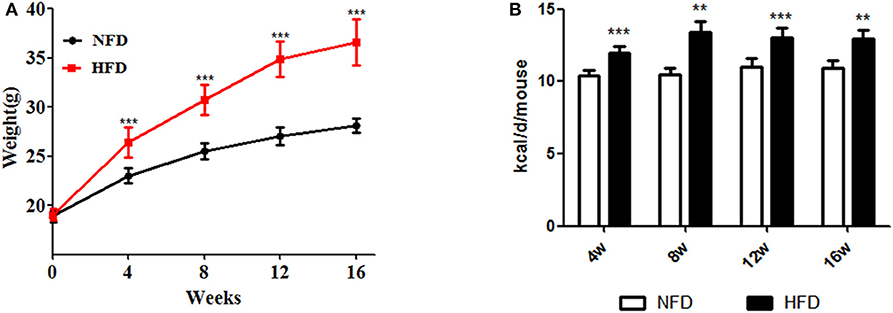
Figure 1. Changes in body weight and daily caloric intake during the development of obesity. Three- to four-week-old C57BL/6J male mice were fed a high-fat diet (HFD) for 4–16 weeks, with a normal-fat diet (NFD) as a control. (A) Body weight; (B) caloric intake. Data are shown as the means ± SD. **Compared to the NFD group, P < 0.01; ***compared to the NFD group, P < 0.005.
Figure 2 shows the profile and distribution of Ct values for the 10 candidate reference genes in different tissues. For each reference gene, similar expressional profiles were shown across samples in all types of tissues. However, a wide difference in expression levels was found among the 10 references, with the Ct values ranging from 8.47 ± 0.80 to 27.05 ± 1.02. The highest abundance gene was 18S RNA, which was significantly different from the others, whose abundance was in an increasing trend with B2M > GAPDH > PPIA > ACTB > RPLP0 > UBC > HPRT > YWHAZ > TBP. Meanwhile, some genes had a wide range in expression, e.g., B2M, GAPDH, ACTB, and UBC, indicating a higher variability, whereas others were in a narrow range, e.g., PPIA, RPLP0, and TBP, indicating more stably expressed.
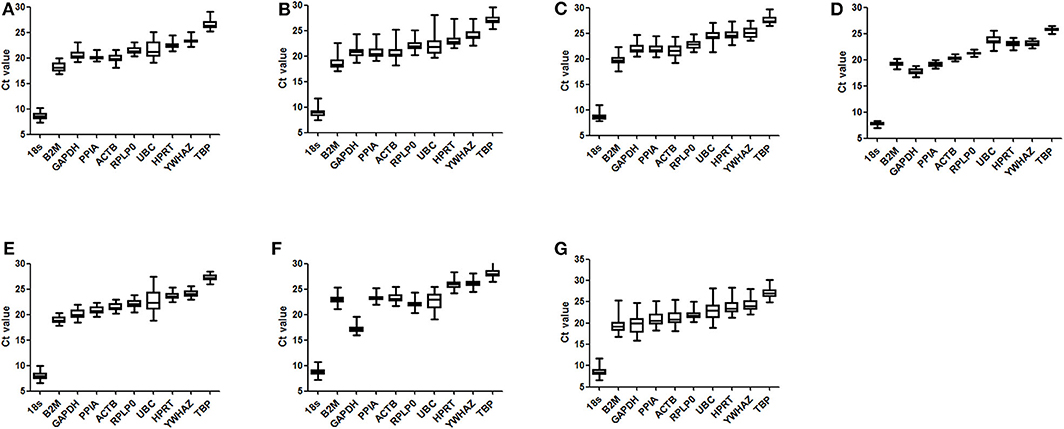
Figure 2. Distribution of Ct values for reference genes. Three- to four-week-old C57BL/6J male mice were fed a high-fat diet (HFD), with a normal-fat diet (NFD) as a control. At 4, 8, 12, and 16 weeks after feeding, mice were sacrificed respectively, and organs and tissues were dissected. The mRNA expression of reference genes was examined by RT-qPCR and their Ct values were analyzed by averaging the data in both groups of mice from the four time points. The boxes indicate the 25th and 75th percentiles, and the line across the box is the media, and whiskers correspond to the minimum and maximum values. (A) epididymal fat; (B) perirenal fat; (C) inguinal subcutaneous fat; (D) subscapular brown adipose tissue; (E) liver; (F) femoral muscle; (G) average for all types of tissues.
To determine the ranking of the reference genes in tissues at different time points, the 10 candidate genes were analyzed by the geNorm and NormFinder algorithms, the comparative Delta-Ct method, and the BestKeeper software tool and further were calculated to identify stably expressed genes between the NFD group and the HFD group.
In the epididymal fat, as shown in Table 2, the identified set of four reference genes included PPIA, YWHAZ, RPLP0, and 18S after 4 weeks' feeding intervention. The optimal set of reference genes after 8 weeks' feeding appeared to be RPLP0, HPRT, B2M, and PPIA. The genes RPLP0, PPIA, B2M, and YWHAZ were represented a good choice as reference genes after 12 weeks' feeding. After 16 weeks' feeding, the best four reference genes were RPLP0, PPIA, HPRT, and YWHAZ. Furthermore, to assess the overall stability of each gene during the development of obesity, the data at the four time points were included in the analysis, and the result showed that PPIA, RPLP0, and YWHAZ were more stable in expression. In the perirenal fat, the calculation of the geometric mean from the NormFinder, GeNorm, BestKeeper, and Delta-Ct indentified RPLP0, PPIA, YWHAZ, ACTB, 18S, B2M, and TBP as more stably expressed at 4, 8, 12, or 16 weeks. Still, PPIA, RPLP0, and YWHAZ were shown as more stably expressed genes if all four time points were included for analysis (Table 3). In the inguinal fat, PPIA, TBP, YWHAZ, HPRT, RPLP0, and B2M were identified as more stably expressed at 4, 8, 12, or 16 weeks, and the expression of PPIA TBP and RPLP0 was indicated more stable with data from all four points analyzed (Table 4). In brown adipose tissue, PPIA, TBP, RPLP0, YWHAZ, and HRPT were more stably expressed at 4, 8, 12, or 16 weeks, and similar to the inguinal fat, RPLP0, TBP, and PPIA represented the best set of reference genes with all four time points considered (Table 5).
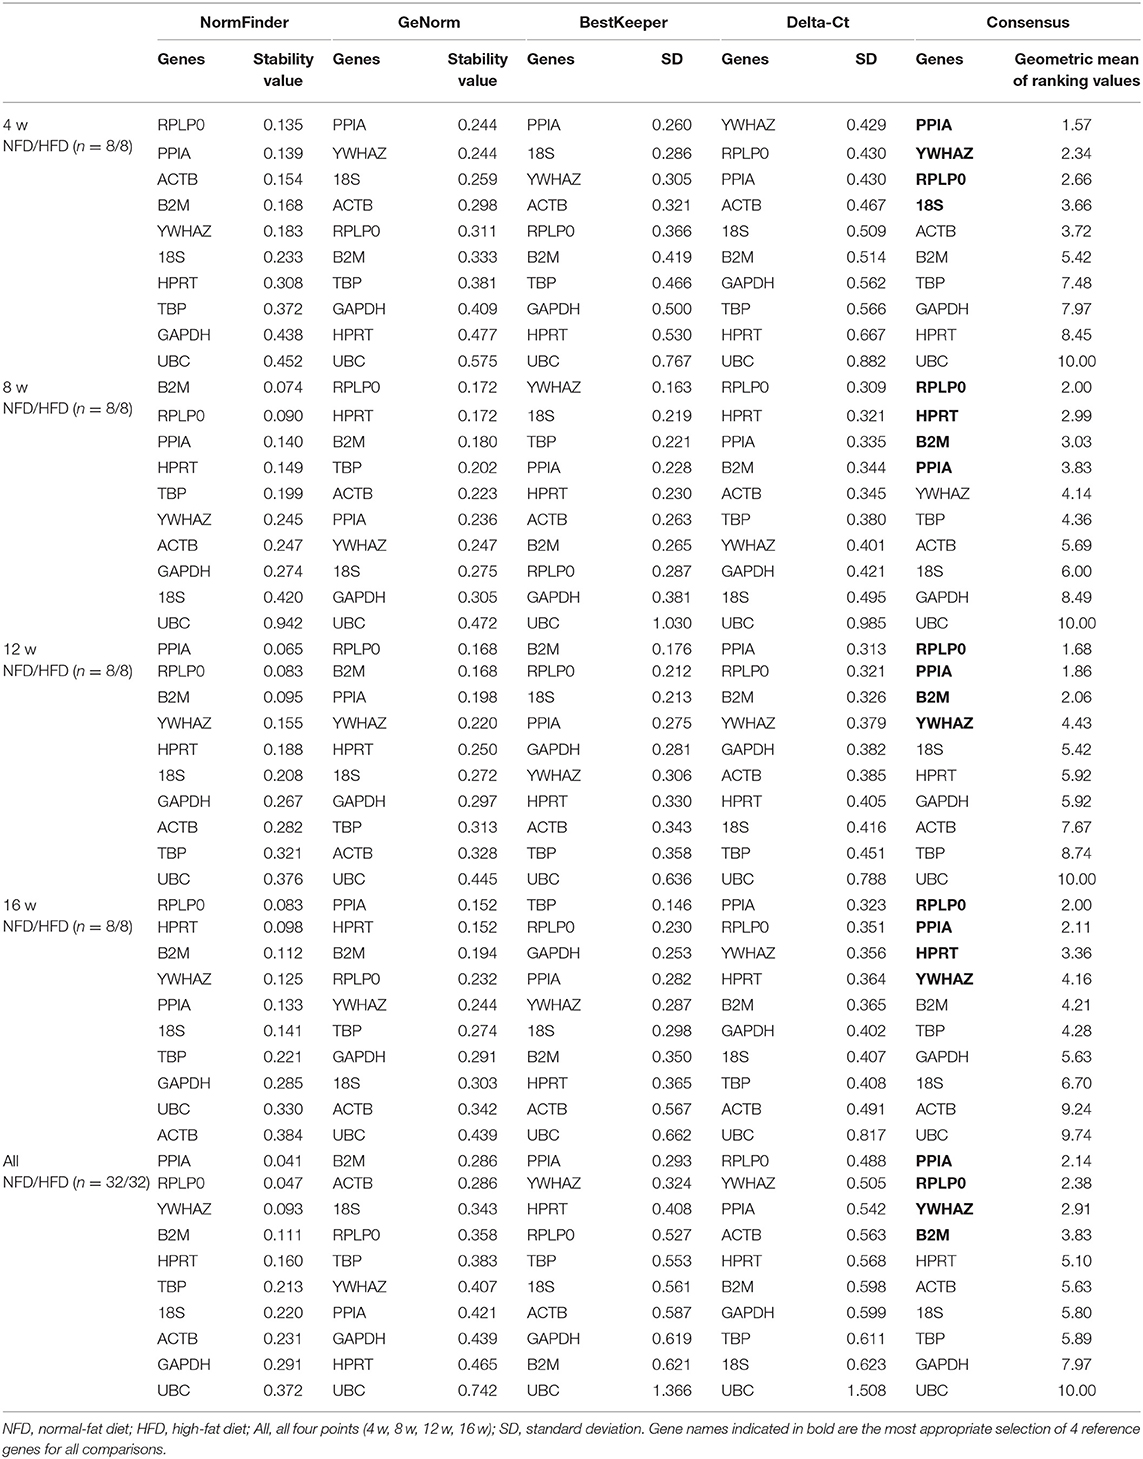
Table 2. Analysis of reference gene expression variability in the epididymal fat during the development of obesity.
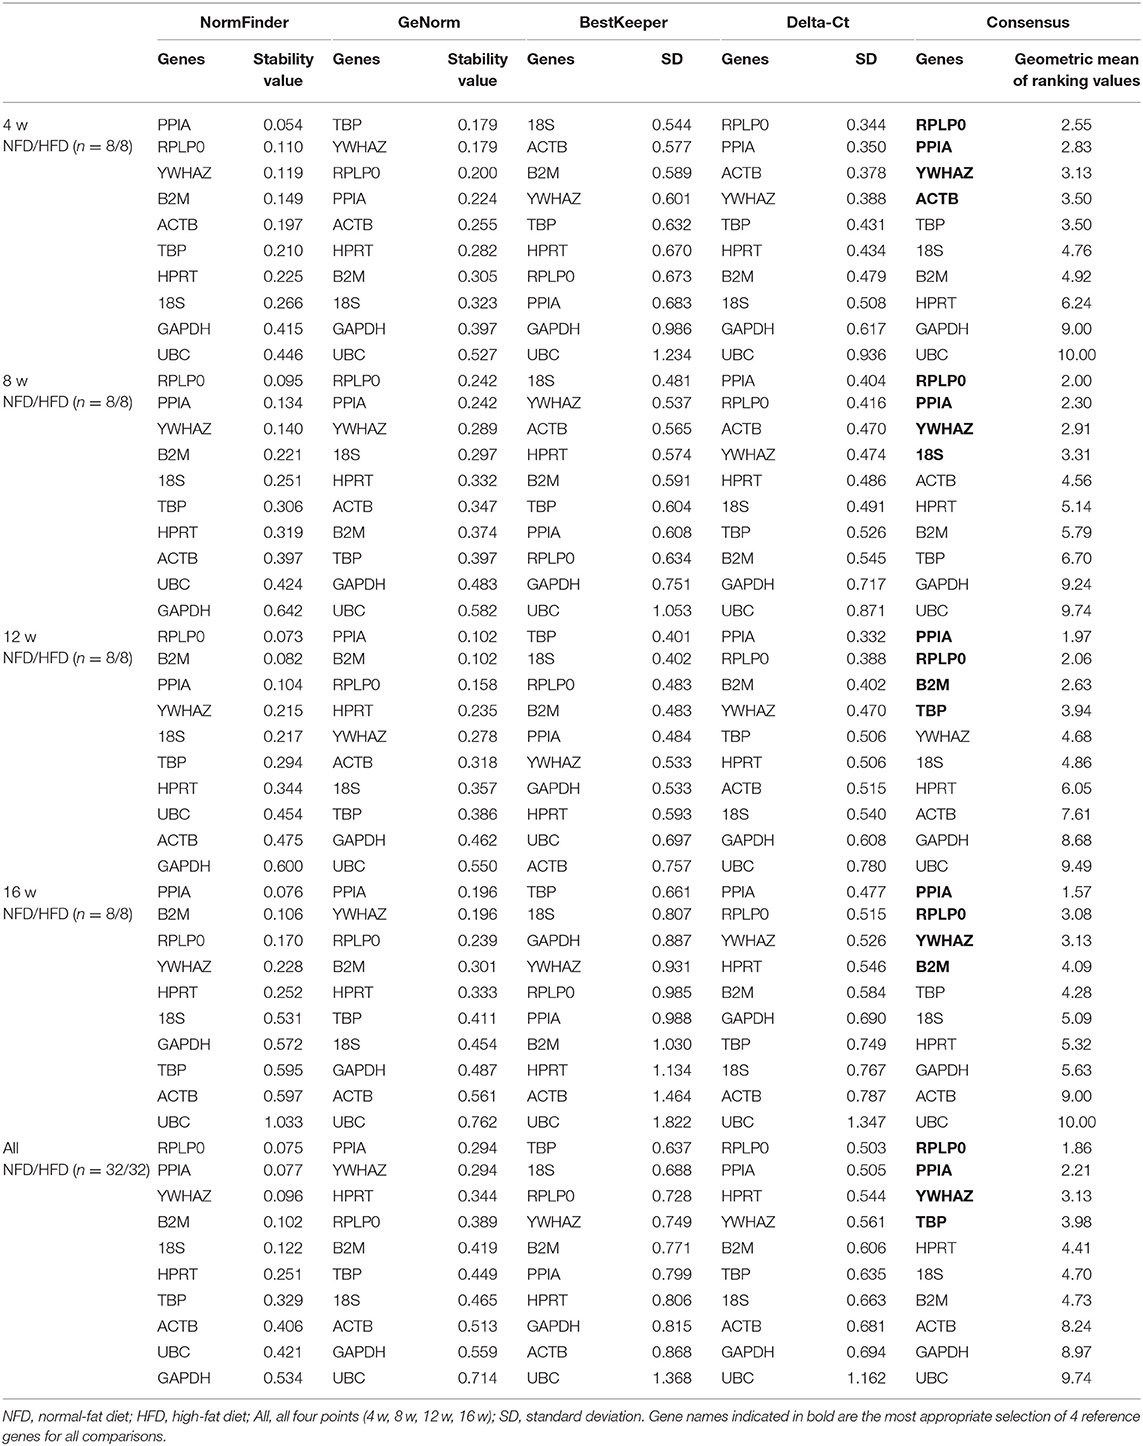
Table 3. Analysis of reference gene expression variability in the perirenal fat during the development of obesity.
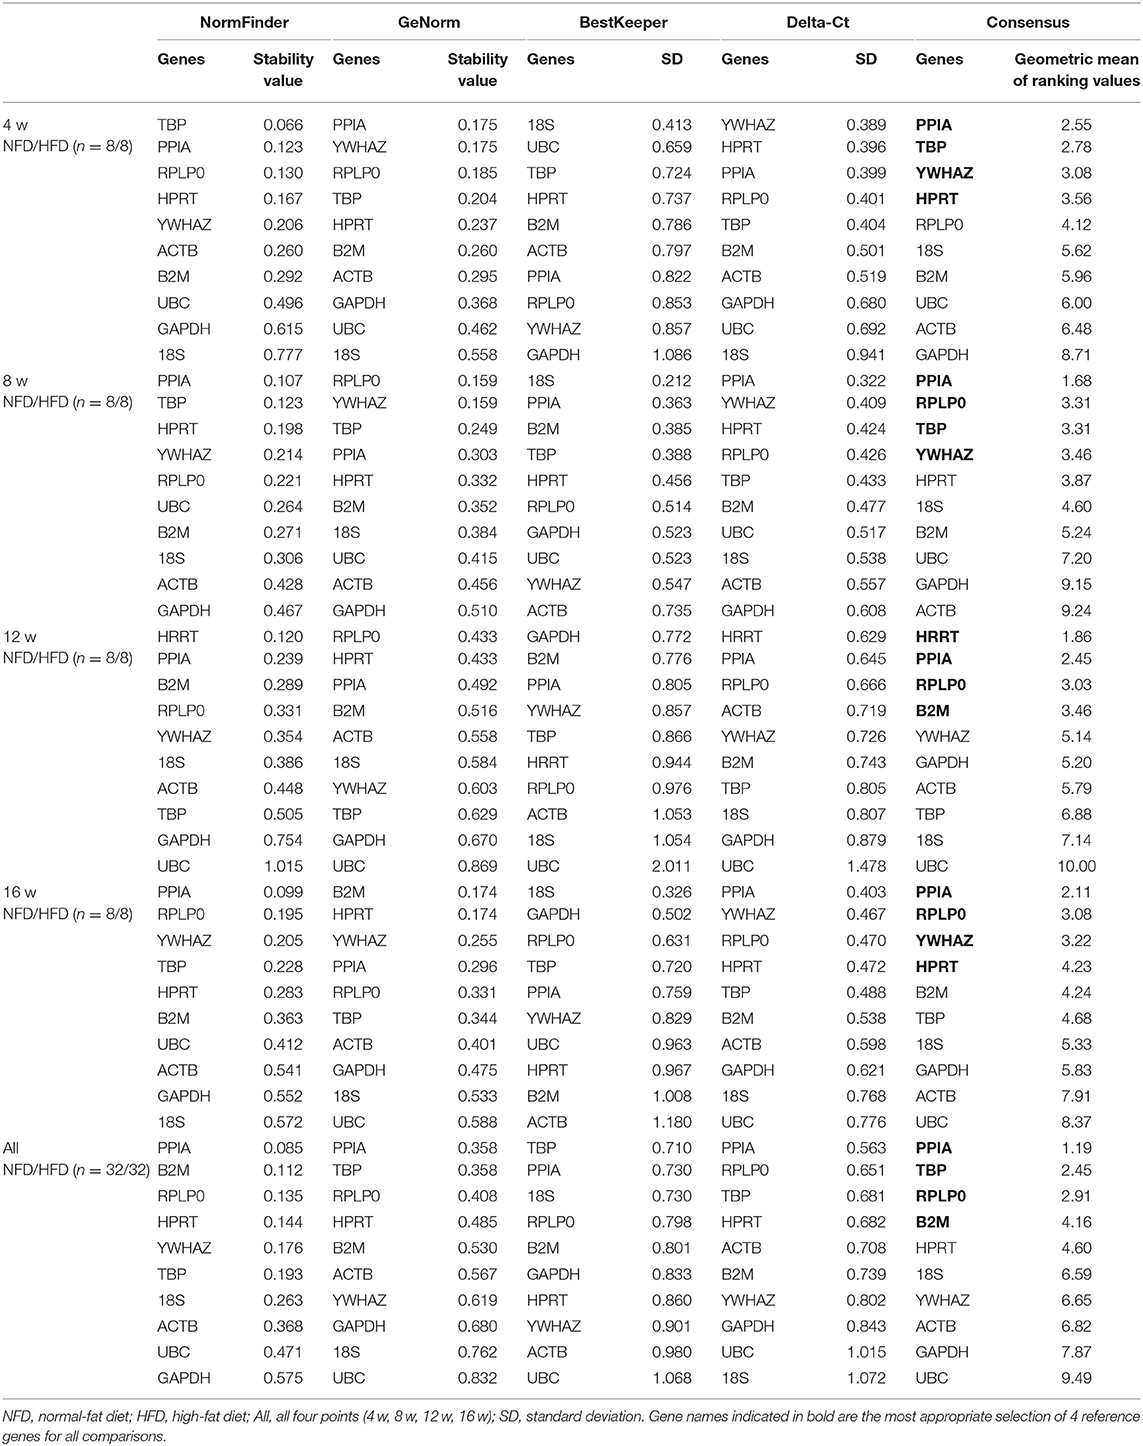
Table 4. Analysis of reference gene expression variability in the subcutaneous inguinal fat during the development of obesity.
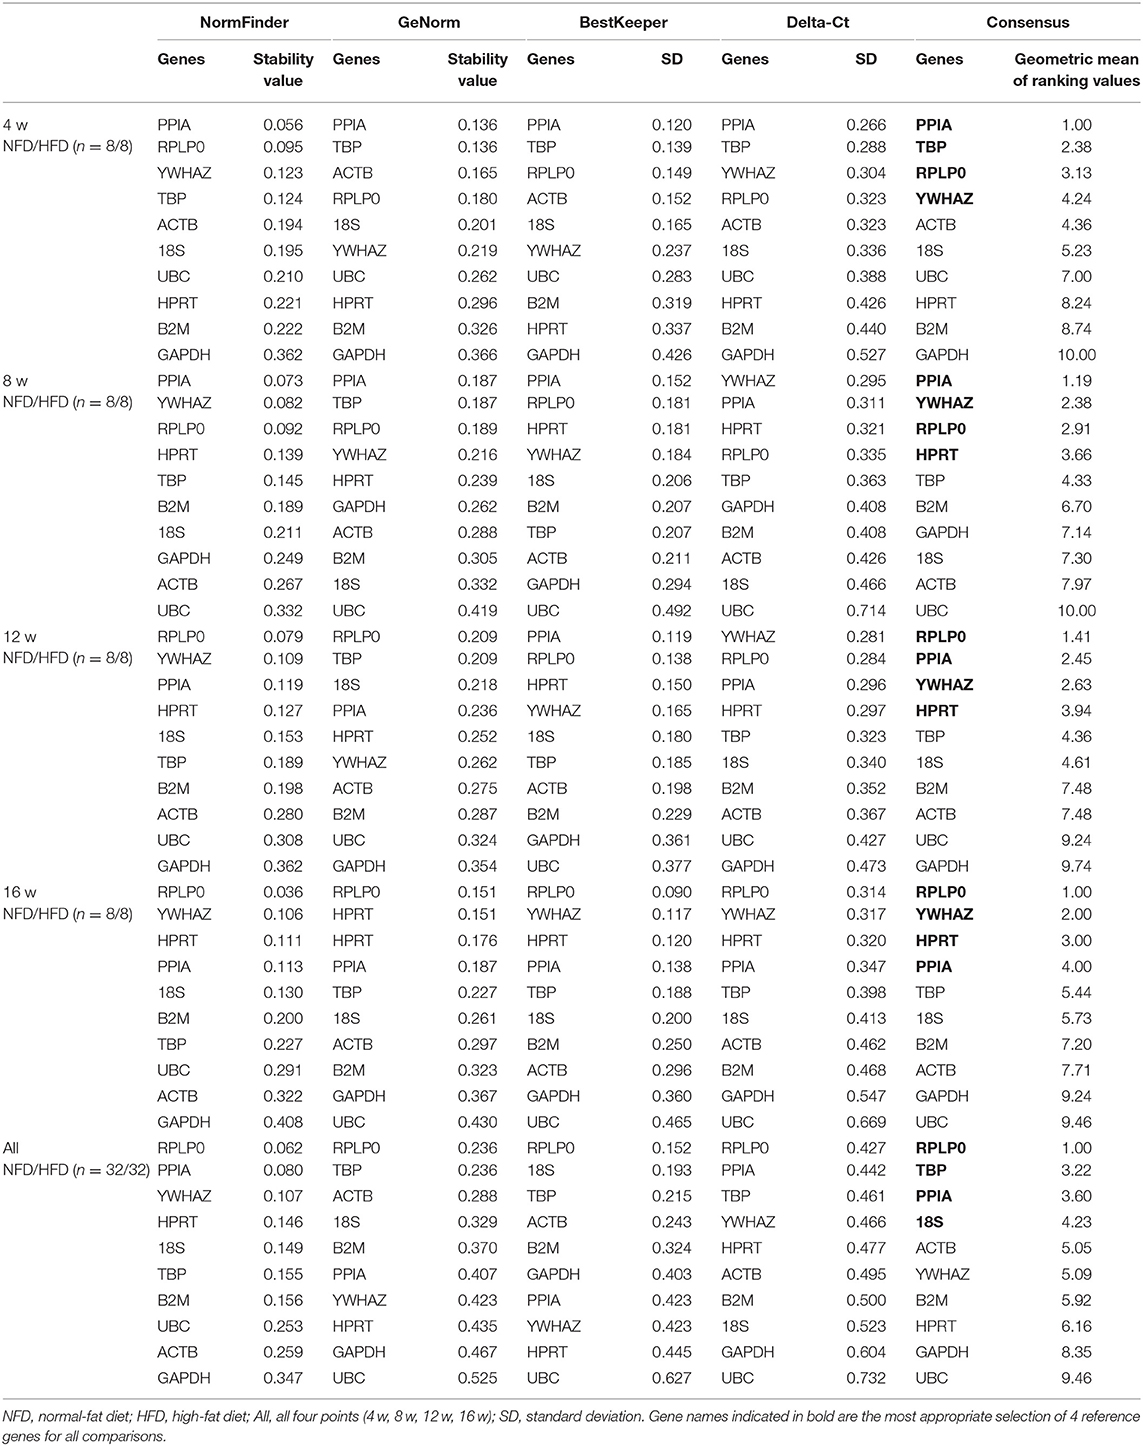
Table 5. Analysis of reference gene expression variability in the brown adipose tissue during the development of obesity.
In the liver, as shown in Table 6, the more stable reference genes were B2M, RPLP0, PPIA, and ACTB at 4 weeks, HRPT, PPIA, YWHAZ, and RPLP0 at 8 weeks, PPIA, RPLP0, HRPT, and TBP at 12 weeks, and YWHAZ, RPLP0, PPIA, and HRPT at 16 weeks. The expressions of HRPT, YWHAZ, and RPLP0 were identified to be more stable for all the four time points.
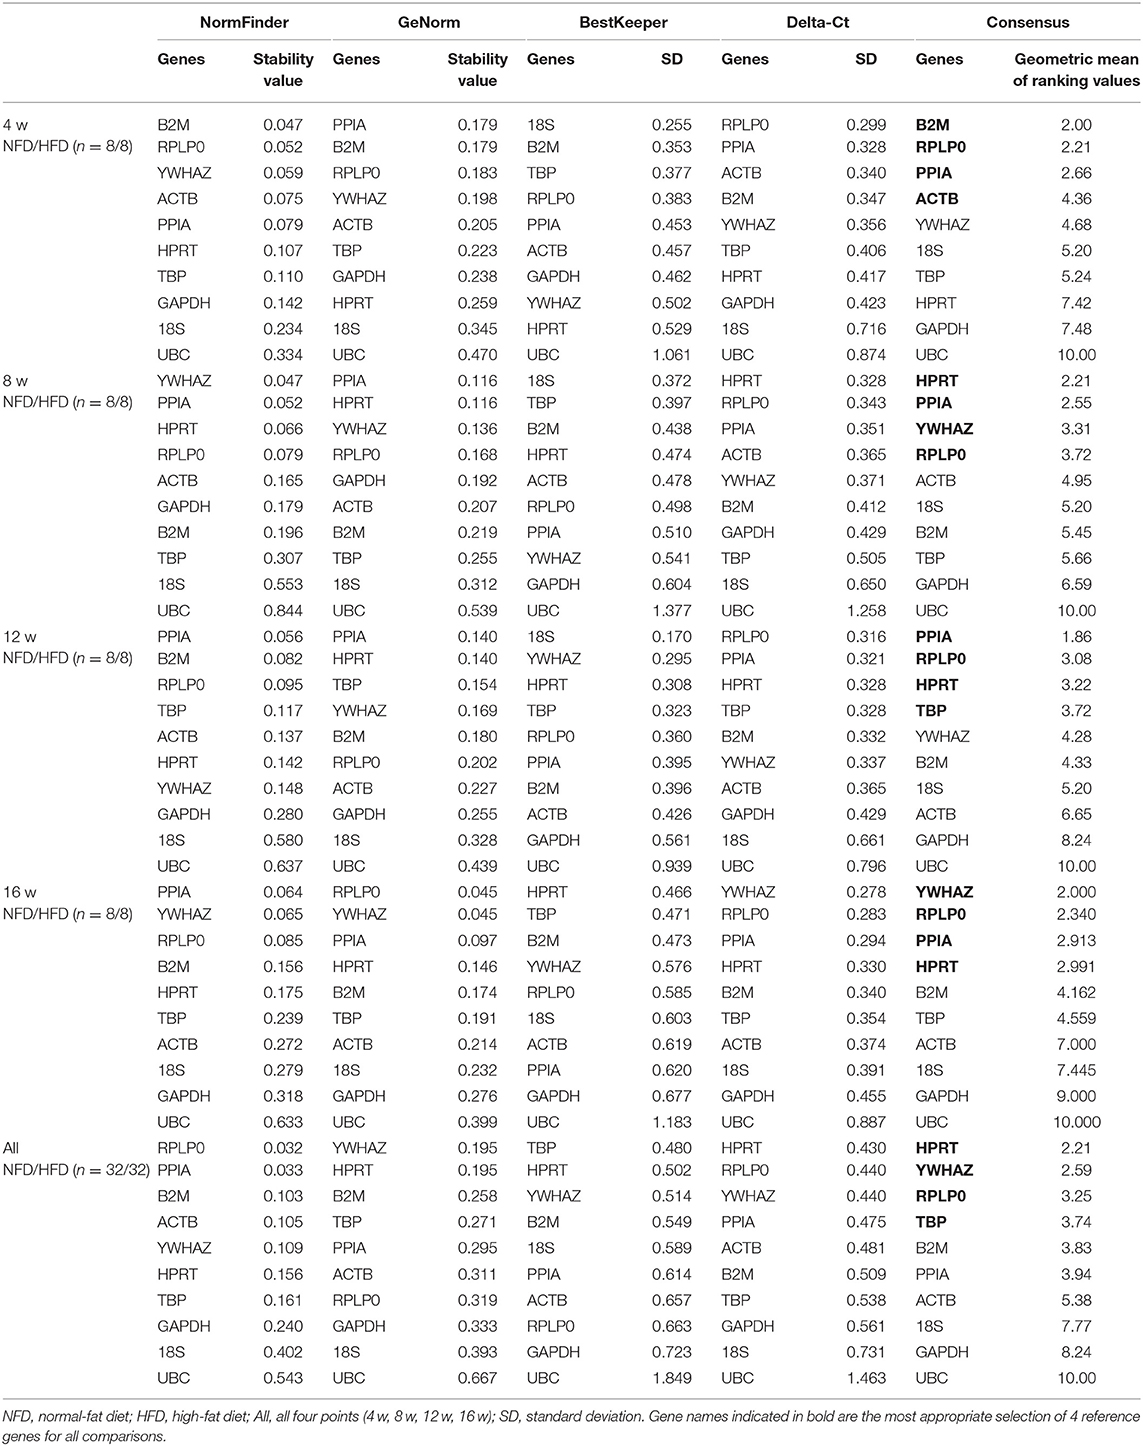
Table 6. Analysis of reference gene expression variability in the liver during the development of obesity.
In femoral muscle, as shown in Table 7, the more stable reference genes were RPLP0, HRPT, PPIA, and TBP at 4 weeks, HRPT, PPIA, YWHAZ, and GAPDH at 8 weeks, YWHAZ, TBP, PPIA, and HRPT at 12 weeks, and RPLP0, YWHAZ, B2M, and PPIA at 16 weeks. If all data from the four time points were analyzed, YWHAZ, RPLP0, and GAPDH were shown more stable in expression.
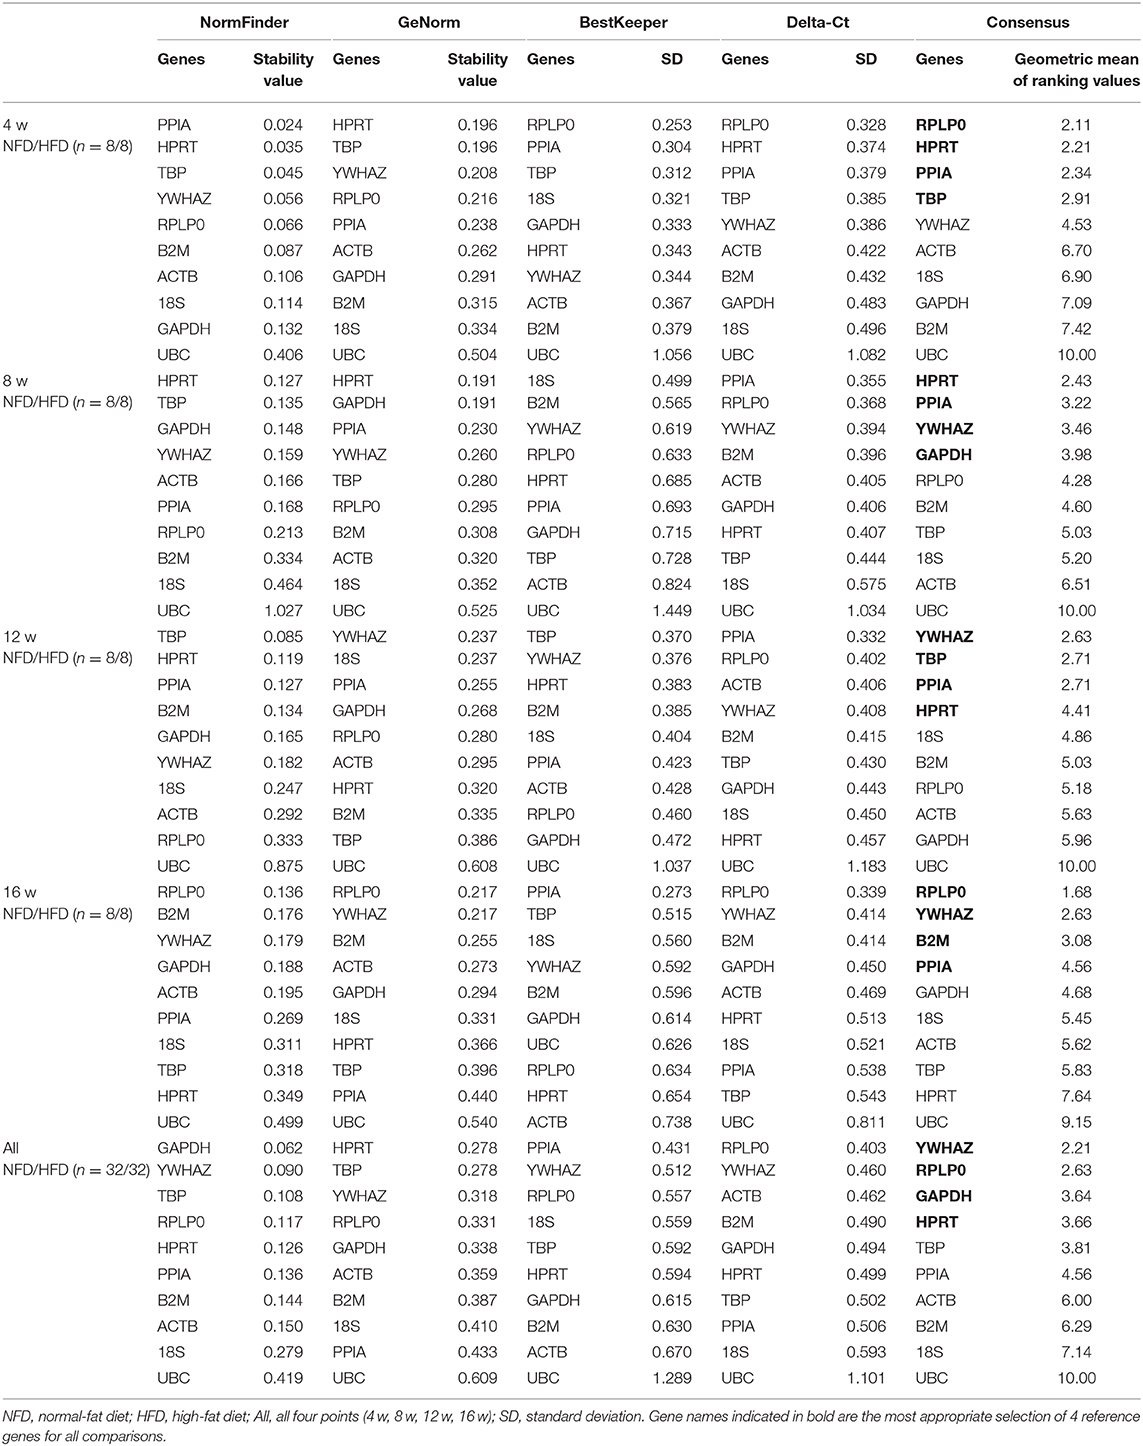
Table 7. Analysis of reference gene expression variability in the femoral muscle during the development of obesity.
As shown in Tables 2–7, UBC was the least stable gene in expression in all six types of tissues during the development of obesity, followed by GAPDH, ACTB, and 18S, which have been commonly used in the adipose tissue and hepatic tissue.
Furthermore, the candidate genes were examined by using the top two stable reference genes as internal standards, and similar results were shown that PPIA and RPLP0 in all four types of adipose tissue, HRPT, YWHAZ, and RPLP0 in the liver, and YWHAZ, RPLP0, and GAPDH in muscle were more stably expressed from 4 to 16 weeks. The more changeable expression was seen with UBC in all tissues, and ACTB and GAPDH in the four types of adipose tissue and the liver.
We found that HFD feeding increased the mRNA levels of ACTB in four types of adipose tissues at 4w, 8w, 12w, and 16w, and the differences became more significant with the development of obesity. The GAPDH mRNA levels were decreased in four types of adipose tissues and liver at 4w, 8w, 12w, and 16w after HFD feeding (Figure 3, Supplementary Tables 3–8). Significant changes were found in the TNFα (a positive control) expression with HFD feeding (Supplementary Figure 3).
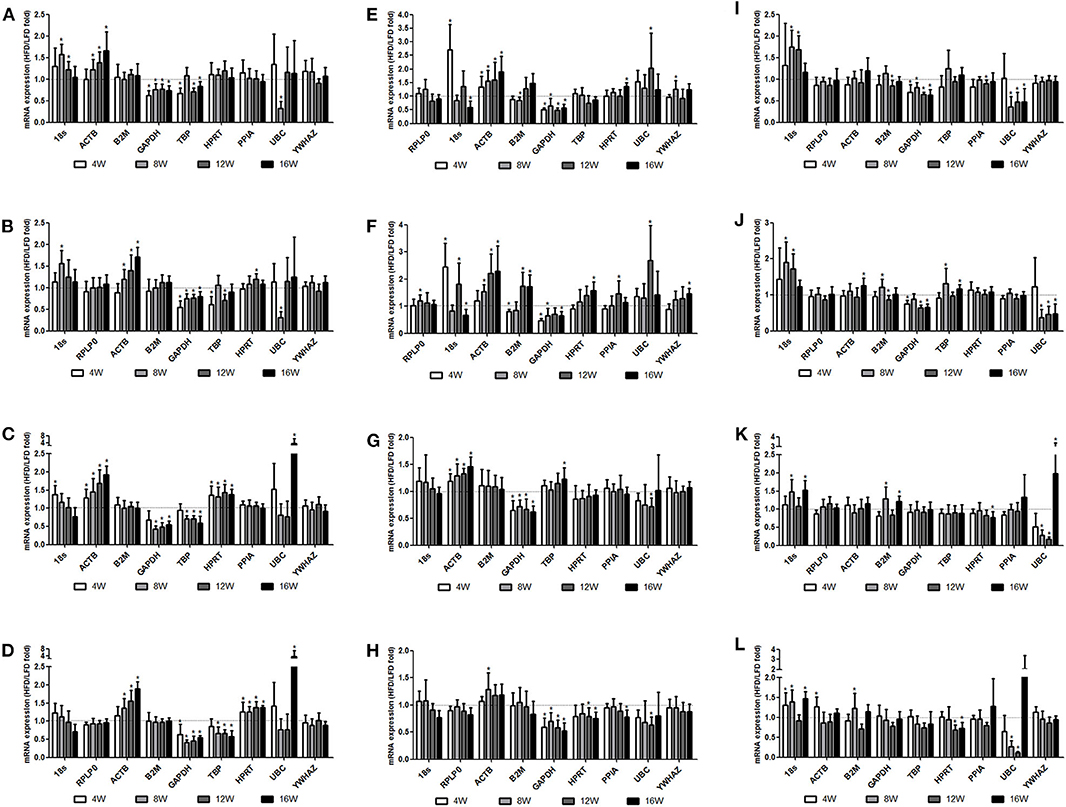
Figure 3. Changes in the mRNA expression of reference genes in tissues during the process of obesity. Three- to four-week-old C57BL/6J male mice were fed a high-fat diet (HFD), with a normal-fat diet (NFD) as a control. At 4, 8, 12, and 16 weeks after feeding, mice were sacrificed respectively, and organs and tissues were dissected. The mRNA expression of reference genes was examined by RT-qPCR. The relative expression of reference genes with the HFD feeding to the NFD feeding was determined with the top two candidate reference genes as the invariant internal control in each tissue, specifically normalized to RPLP0 (A) or PPIA (B) in the epididymal fat, RPLP0 (C) or PPIA (D) in the perirenal fat, PPIA (E) or TBP (F) in the subcutaneous inguinal fat, RPLP0 (G) or TBP (H) in the subscapular brown adipose tissue, HPRT (I) or YWHAZ (J) in the liver, and YWHAZ (K) or RPLP0 (L) in the femoral muscle. All data are presented as the means ± SD; n = 8 in either the HFD or the NFD group at each time points. *Significantly different from the NFD group (p < 0.05).
In this study, a detailed analysis of candidate reference genes in the fat (epididymal, perirenal, subcutaneous inguinal, and brown adipose tissue), liver, and femoral muscle at different time points (4, 8, 12, and 16 weeks), demonstrated a set of more stable reference genes, which were more suitable for use in energy and fat metabolism associated tissues in the HFD induced-obese mice. Although the four methods, which were applied for analysis of gene stability, use different analytical approaches, the results were similar in all groups. The most stable reference genes were slightly different for a specific organ or tissue in a specific time point during the process of obesity pathogenesis. Further analysis with combined time points indicated that the genes PPIA, RPLP0, and YWHAZ were ranked top three among the 10 reference genes in the epididymal fat and the perirenal fat and that PPIA, TBP, and RPLP0 were ranked top three in the inguinal fat and brown adipose tissue. In the liver, the top three more stably expressed genes were HRPT, YWHAZ, and RPLP0, and in the femoral muscle, YWHAZ, RPLP0, and GAPDH were identified as the top three genes.
Reference genes have been demonstrated to be variable in obesity by several studies. Being consistent with our findings, RPLP0 has been validated as one of the top-ranking reference genes in human and rat adipose tissue (16, 23). TBP and ATPF1 should be used as reference genes in qPCR experiments on the adipose tissue with metabolic disease (7). In the DIO mouse model, the most stable candidates are 18S and PPIA in the epididymal fat and HPRT1 and PPIA in the heart, whereas they are 18S and GAPDH in the epididymal fat and RPI7 and GAPDH in the heart in wild-type and db/db mice (15). There have been quantities of studies on HFD-induced obesity, especially in those metabolism-related tissues, such as adipose tissues, liver, and muscle (24, 25). For example, Zhang et al. (23) found that four frequently used reference genes have different expression stabilities in three types of adipose tissue from the control and high-fat diet rats. Perez and his colleagues assessed the relative stability of the 10 candidate reference genes in perigonadal adipose tissue from chow and high-fat high-sucrose-fed C57BL/6 mice (15). Our results are consistent with a previous study by Zhang et al., who validated that RPLP0 was the best reference gene in three types of rat adipose tissue (23). In another study, Gabrilsson and colleagues evaluated reference genes in human adipose tissue. They found that of the frequently used reference genes, RPLP0 was highest ranked (16). In this study, different reference genes were validated for each time point in liver (B2M for 4 w, HPRT for 8 w, PPIA for 12 w, YWHAZ for 16 w) and femoral muscle (HPRT for 8 w, YWHAZ for 12 w, PPIA for 4w, and 16 w).
The genes ACTB, GAPDH, and 18S have been mostly employed as the sole reference genes for qPCR data normalization (26–31). However, our results showed that they were more unstable genes in the adipose and hepatic tissues. In consistent with our findings, it has been reported that ACTB is one of the most unstable genes in mouse models of obesity and diabetes and that the ACTB expression in the hypothalamus and intestine from an obese rat model is markedly altered with changes in energy status (32). Also, the expressions of B2M, GAPDH, and ACTB are varied with types of adipose tissue, metabolic status, and different experimental conditions in mice (7, 33). Regarding the expression of GAPDH and ACTB in human tissues, the controversy exists. Some studies reported that GAPDH and ACTB are reported to be among the most stably expressed in the human samples (12, 13). Mehta et al. validated ACTB as a stable reference gene most suitable for gene expression studies of human visceral adipose tissue (13), and GAPDH, together with CYCA and RPL27, has been identified as the most stable genes in human epicardial fat depots of lean, overweight, and obese subjects (17), whereas others demonstrated that SDHA and HSPCB are ranked as the most stable candidates in human in the subcutaneous fat (15), and GAPDH and ACTB showed a significant variation in human adipose (16) and are less appropriate reference genes in human omental and subcutaneous adipose tissue from obesity and type 2 diabetes patients, because of the variational expression (34). Thus, the stability of expression of reference genes differs between species and between healthy/disordered tissue within one specie.
It is noteworthy that reference proteins, also called housekeeping proteins, are key internal controls serving to normalize the western blot or immunoblot data. In studies on obesity and other diseases, GAPDH, β-actin, or β-tubulin has been used extensively as housekeeping protein in determination of target protein expression. However, it has been previously reported that common housekeeping proteins are not always reliable loading controls (35, 36). Although a direct correlation between the levels of mRNA and that of protein exists due to the expressed mRNA translated into protein (37), many studies have demonstrated discrepancies between mRNA and protein levels, indicating that mRNA levels are not sufficient to predict protein levels in many scenarios (38–40). Therefore, the results from reference genes cannot be extrapolated to reference proteins. With regard to the more stable reference genes screened in the current study, their translated proteins as reference controls have been investigated by few studies. Kim et al. reported that among the seven housekeeping proteins (HPRT1, PPIA, GYS1, TBP, YWHAZ, GAPDH, and ACTB) in the rat cerebrum, cerebellum, cardiac ventricle, and atrium, psoas major muscle, femoral muscle, liver, spleen, kidney, and aorta tissues, HPRT1, PPIA, YWHAZ, and GAPDH are more stably expressed across tissues (41). Nonetheless, whether the corresponding proteins translated from more stably expressed genes PPIA, RPLP0, and YWHAZ are appropriate for references in protein studies of obesity, needs to be clarified in the future.
In conclusion, although the most stable reference gene was different among specific organs/tissues with the development of obesity, PPIA, RPLP0, or YWHAZ should be used as reference gene in qPCR experiments on adipose, hepatic tissues, and muscles of mice in diet-induced obesity and associated metabolic complications.
The original contributions presented in the study are included in the article/Supplementary Material, further inquiries can be directed to the corresponding author.
The animal study was reviewed and approved by Committee on the Ethics of Institute of Laboratory Animal Sciences, National Institute of Occupational Health and Poison Control of China.
XF participated in the study design, statistical analysis, and paper writing. HY carried out mouse feeding and the mRNA expression experiments. XL and QS participated in the mRNA expression experiments. LL, PL, RW, and TT participated in the statistical analysis. KQ conceived the study and participated in its design and coordination. The paper was written by XF and KQ. All authors reviewed and commented on the manuscript.
This work was supported by the National Natural Science Foundation of China (to XF, No. 81800750) and Research Funds of Profession Quota Budget from Beijing Municipal Science and Technology Commission (2019-bjsekyjs-lnd to KQ).
LL was employed by the company Zeesan Biotech.
The remaining authors declare that the research was conducted in the absence of any commercial or financial relationships that could be construed as a potential conflict of interest.
The Supplementary Material for this article can be found online at: https://www.frontiersin.org/articles/10.3389/fnut.2020.589771/full#supplementary-material
1. NCD Risk Factor Collaboration (NCD-RisC). Trends in adult body-mass index in 200 countries from 1975 to 2014: a pooled analysis of 1698 population-based measurement studies with 192 million participants. Lancet. (2016) 387:1377–96. doi: 10.1016/S0140-6736(16)30054-X
2. World Health Organization. Obesity and Overweight. (2020). Available online at: https://www.who.int/news-room/fact-sheets/detail/obesity-and-overweight (accessed 15 April, 2020).
3. Huggett J, Dheda K, Bustin S, Zumla A. Real-time RT-PCR normalisation; strategies and considerations. Genes Immun. (2005) 6:279–84. doi: 10.1038/sj.gene.6364190
4. Bustin SA, Benes V, Garson JA, Hellemans J, Huggett J, Kubista M, et al. The MIQE guidelines: minimum information for publication of quantitative real-time PCR experiments. Clin Chem. (2009) 55:611–22. doi: 10.1373/clinchem.2008.112797
5. Taylor SC, Mrkusich EM. The state of RT-quantitative PCR: firsthand observations of implementation of minimum information for the publication of quantitative real-time PCR experiments (MIQE). J Mol Microbiol Biotechnol. (2014) 24:46–52. doi: 10.1159/000356189
6. Green MR, Sambrook J. Analysis and normalization of real-time polymerase chain reaction (PCR) experimental data. Cold Spring Harb Protoc. (2018) 2018:769–7. doi: 10.1101/pdb.top095000
7. Almeida-Oliveira F, Leandro JGB, Ausina P, Sola-Penna M, Majerowicz D. Reference genes for quantitative PCR in the adipose tissue of mice with metabolic disease. Biomed Pharmacother. (2017) 88:948–55. doi: 10.1016/j.biopha.2017.01.091
8. Fang S, Suh JM, Reilly SM, Yu E, Osborn O, Lackey D, et al. Intestinal FXR agonism promotes adipose tissue browning and reduces obesity and insulin resistance. Nat Med. (2015) 21:159–65. doi: 10.1038/nm.3760
9. Pospisilik JA, Schramek D, Schnidar H, Cronin SJ, Nehme NT, Zhang X, et al. Drosophila genome-wide obesity screen reveals hedgehog as a determinant of brown versus white adipose cell fate. Cell. (2010) 140:148–60. doi: 10.1016/j.cell.2009.12.027
10. Sun L, Trajkovski M. MiR-27 orchestrates the transcriptional regulation of brown adipogenesis. Metabolism. (2014) 63:272–82. doi: 10.1016/j.metabol.2013.10.004
11. Vandesompele J, De Preter K, Pattyn F, Poppe B, Van Roy N, De Paepe A, et al. Accurate normalization of real-time quantitative RT-PCR data by geometric averaging of multiple internal control genes. Genome Biol. (2002) 3:RESEARCH0034. doi: 10.1186/gb-2002-3-7-research0034
12. van Rijn SJ, Riemers FM, van den Heuvel D, Wolfswinkel J, Hofland L, Meij BP, et al. Expression stability of reference genes for quantitative RT-PCR of healthy and diseased pituitary tissue samples varies between humans, mice, and dogs. Mol Neurobiol. (2014) 49:893–9. doi: 10.1007/s12035-013-8567-7
13. Mehta R, Birerdinc A, Hossain N, Afendy A, Chandhoke V, Younossi Z, et al. Validation of endogenous reference genes for qRT-PCR analysis of human visceral adipose samples. BMC Mol Biol. (2010) 11:39. doi: 10.1186/1471-2199-11-39
14. Taube M, Andersson-Assarsson JC, Lindberg K, Pereira MJ, Gäbel M, Svensson MK, et al. Evaluation of reference genes for gene expression studies in human brown adipose tissue. Adipocyte. (2015) 4:280–5. doi: 10.1080/21623945.2015.1039884
15. Perez LJ, Rios L, Trivedi P, D'Souza K, Cowie A, Nzirorera C, et al. Validation of optimal reference genes for quantitative real time PCR in muscle and adipose tissue for obesity and diabetes research. Sci Rep. (2017) 7:3612. doi: 10.1038/s41598-017-03730-9
16. Gabrielsson BG, Olofsson LE, Sjögren A, Jernås M, Elander A, Lönn M, et al. Evaluation of reference genes for studies of gene expression in human adipose tissue. Obes Res. (2005) 13:649–52. doi: 10.1038/oby.2005.72
17. Chechi K, Gelinas Y, Mathieu P, Deshaies Y, Richard D. Validation of reference genes for the relative quantification of gene expression in human epicardial adipose tissue. PLoS ONE. (2012) 7:e32265. doi: 10.1371/journal.pone.0032265
18. Andersen CL, Jensen JL, Ørntoft TF. Normalization of real-time quantitative reverse transcription-PCR data: a model-based variance estimation approach to identify genes suited for normalization, applied to bladder and colon cancer data sets. Cancer Res. (2004) 64:5245–50. doi: 10.1158/0008-5472.CAN-04-0496
19. Pfaffl MW, Tichopad A, Prgomet C, Neuvians TP. Determination of stable housekeeping genes, differentially regulated target genes and sample integrity: bestKeeper–Excel-based tool using pair-wise correlations. Biotechnol Lett. (2004) 26:509–15. doi: 10.1023/B:BILE.0000019559.84305.47
20. Silver N, Best S, Jiang J, Thein SL. Selection of housekeeping genes for gene expression studies in human reticulocytes using real-time PCR. BMC Mol Biol. (2006) 7:33. doi: 10.1186/1471-2199-7-33
21. Herman MA, Peroni OD, Villoria J, Schön MR, Abumrad NA, Blüher M, et al. A novel ChREBP isoform in adipose tissue regulates systemic glucose metabolism. Nature. (2012) 484:333–8. doi: 10.1038/nature10986
22. Fischer K, Ruiz HH, Jhun K, Finan B, Oberlin DJ, van der Heide V, et al. Alternatively activated macrophages do not synthesize catecholamines or contribute to adipose tissue adaptive thermogenesis. Nat Med. (2017) 23:623–30. doi: 10.1038/nm.4316
23. Zhang WX, Fan J, Ma J, Rao YS, Zhang L, Yan YE. Selection of suitable reference genes for quantitative real-time PCR normalization in three types of rat adipose tissue. Int J Mol Sci. (2016) 17:E968. doi: 10.3390/ijms17060968
24. Suárez-Zamorano N, Fabbiano S, Chevalier C, Stojanović O, Colin DJ, Stevanović A, et al. Microbiota depletion promotes browning of white adipose tissue and reduces obesity. Nat Med. (2015) 21:1497–501. doi: 10.1038/nm.3994
25. Lee HH, An SM, Ye BJ, Lee JH, Yoo EJ, Jeong GW, et al. TonEBP/NFAT5 promotes obesity and insulin resistance by epigenetic suppression of white adipose tissue beiging. Nat Commun. (2019) 10:3536. doi: 10.1038/s41467-019-11302-w
26. Yoon YI, Chung MY, Hwang JS, Han MS, Goo TW, Yun EY. Allomyrina dichotoma (Arthropoda: Insecta) larvae confer resistance to obesity in mice fed a high-fat diet. Nutrients. (2015) 7:1978–91. doi: 10.3390/nu7031978
27. Zhao M, Chen X. Eicosapentaenoic acid promotes thermogenic and fatty acid storage capacity in mouse subcutaneous adipocytes. Biochem Biophys Res Commun. (2014) 450:1446–51. doi: 10.1016/j.bbrc.2014.07.010
28. Berry DC, Jiang Y, Arpke RW, Close EL, Uchida A, Reading D, et al. Cellular aging contributes to failure of cold-induced beige adipocyte formation in old mice and humans. Cell Metab. (2017) 25:166–81. doi: 10.1016/j.cmet.2016.10.023
29. Shan B, Wang X, Wu Y, Xu C, Xia Z, Dai J, et al. The metabolic ER stress sensor IRE1α suppresses alternative activation of macrophages and impairs energy expenditure in obesity. Nat Immunol. (2017) 18:519–29. doi: 10.1038/ni.3709
30. Zhao P, Wong KI, Sun X, Reilly SM, Uhm M, Liao Z, et al. TBK1 at the crossroads of inflammation and energy homeostasis in adipose tissue. Cell. (2018) 172:731–43. doi: 10.1016/j.cell.2018.01.007
31. Brestoff JR, Kim BS, Saenz SA, Stine RR, Monticelli LA, Sonnenberg GF, et al. Group 2 innate lymphoid cells promote beiging of white adipose tissue and limit obesity. Nature. (2015) 519:242–6. doi: 10.1038/nature14115
32. Li B, Matter EK, Hoppert HT, Grayson BE, Seeley RJ, Sandoval DA. Identification of optimal reference genes for RT-qPCR in the rat hypothalamus and intestine for the study of obesity. Int J Obes. (2014) 38:192–7. doi: 10.1038/ijo.2013.86
33. Bustin SA. Absolute quantification of mRNA using real-time reverse transcription polymerase chain reaction assays. J Mol Endocrinol. (2000) 25:169–93. doi: 10.1677/jme.0.0250169
34. Catalán V, Gómez-Ambrosi J, Rotellar F, Silva C, Rodríguez A, Salvador J, et al. Validation of endogenous control genes in human adipose tissue: relevance to obesity and obesity-associated type 2 diabetes mellitus. Horm Metab Res. (2007) 39:495–500. doi: 10.1055/s-2007-982502
35. Araujo LCC, Bordin S, Carvalho CRO. Reference gene and protein expression levels in two different NAFLD mouse models. Gastroenterol Res Pract. (2020) 2020:1093235. doi: 10.1155/2020/1093235
36. Goasdoue K, Awabdy D, Bjorkman ST, Miller S. Standard loading controls are not reliable for Western blot quantification across brain development or in pathological conditions. Electrophoresis. (2016) 37:630–4. doi: 10.1002/elps.201500385
37. Li JJ, Biggin MD. Gene expression. Statistics requantitates the central dogma. Science. (2015) 347:1066–7. doi: 10.1126/science.aaa8332
38. Maier T, Güell M, Serrano L. Correlation of mRNA and protein in complex biological samples. FEBS Lett. (2009) 583:3966–73. doi: 10.1016/j.febslet.2009.10.036
39. Schwanhäusser B, Busse D, Li N, Dittmar G, Schuchhardt J, Wolf J, et al. Corrigendum: global quantification of mammalian gene expression control. Nature. (2013) 495:126–7. doi: 10.1038/nature11848
40. Vogel C, Marcotte EM. Insights into the regulation of protein abundance from proteomic and transcriptomic analyses. Nat Rev Genet. (2012) 13:227–32. doi: 10.1038/nrg3185
Keywords: reference genes, qPCR, obesity, mice, adipose tissue, liver
Citation: Fan X, Yao H, Liu X, Shi Q, Lv L, Li P, Wang R, Tang T and Qi K (2020) High-Fat Diet Alters the Expression of Reference Genes in Male Mice. Front. Nutr. 7:589771. doi: 10.3389/fnut.2020.589771
Received: 31 July 2020; Accepted: 19 October 2020;
Published: 24 November 2020.
Edited by:
Dongmin Liu, Virginia Tech, United StatesReviewed by:
Barbara Fielding, University of Surrey, United KingdomCopyright © 2020 Fan, Yao, Liu, Shi, Lv, Li, Wang, Tang and Qi. This is an open-access article distributed under the terms of the Creative Commons Attribution License (CC BY). The use, distribution or reproduction in other forums is permitted, provided the original author(s) and the copyright owner(s) are credited and that the original publication in this journal is cited, in accordance with accepted academic practice. No use, distribution or reproduction is permitted which does not comply with these terms.
*Correspondence: Kemin Qi, cWlrZW1pbkBiY2guY29tLmNu
Disclaimer: All claims expressed in this article are solely those of the authors and do not necessarily represent those of their affiliated organizations, or those of the publisher, the editors and the reviewers. Any product that may be evaluated in this article or claim that may be made by its manufacturer is not guaranteed or endorsed by the publisher.
Research integrity at Frontiers
Learn more about the work of our research integrity team to safeguard the quality of each article we publish.