
94% of researchers rate our articles as excellent or good
Learn more about the work of our research integrity team to safeguard the quality of each article we publish.
Find out more
ORIGINAL RESEARCH article
Front. Neurosci., 12 March 2025
Sec. Neurodegeneration
Volume 19 - 2025 | https://doi.org/10.3389/fnins.2025.1536818
This article is part of the Research TopicInnovative Approaches to Catalyze Preclinical and Clinical Research on Amyotrophic Lateral Sclerosis (ALS) and Related DisordersView all 6 articles
 Julia Meyer1
 Nayana Gaur2Janina von der Gablentz1Bernd Friedrich1Annekathrin Roediger3,4Julian Grosskreutz1,3,5
 Robert Steinbach3*
Introduction: Amyotrophic lateral sclerosis (ALS) is a progressive neurodegenerative disorder, characterized by tremendous clinical heterogeneity that necessitates reliable biomarkers for the trajectory of the disease. The potential of phosphorylated Neurofilament-Heavy-chain (pNfH) measured in cerebrospinal fluid (CSF) to mirror disease progressiveness has repeatedly been suggested but is not applicable as outcome on an individual patient-level. This potential was probably obfuscated before due to imprecise clinical measures of disease progression that assumed a linear decline of motoric function over time. The primary objective was therefore to study if disease aggressiveness, as quantified via the D50 model, would reveal more stable correlations with pNfH.
Methods: ELISA-quantified pNfH CSF levels of 108 patients with ALS were comparatively analyzed in relation to three different measures of disease progression speed via analyses of covariance, linear and non-linear regressions, respectively. These were (a) the D50, depicting a patient’s overall disease aggressiveness, (b) cFL, the calculated functional loss-rate as locally derived parameter of progression speed, and (c) DPR, the disease progression-rate as more commonly used linear approximation of points lost per month in the ALS functional rating scale since symptom onset.
Results: All analyses of covariance showed a significant main impact of the respective disease progression-speed parameter on pNfH, independent of disease phase, presence of frontotemporal dementia, analyzing laboratory, sex or clinical onset type, while only age revealed borderline additional influence. Notably, CSF pNfH concentration was independent of how far the disease had progressed, as neither disease phase nor a direct regression with the quantified disease accumulation at the time of lumbar puncture revealed a significant correlation. However, the parameter D50 quantifying aggressiveness showed the most significant impact on pNfH-levels, as compared to the cFL and even more evident in contrast to the DPR. This superiority of D50 was confirmed in direct linear and most evident in non-linear regressions with pNfH.
Conclusion: Overall disease aggressiveness in ALS, as quantified by D50, most robustly correlated with CSF pNfH-levels, independent of the time of collection during symptomatic disease. This opens perspectives to use CSF pNfH as a prognostic outcome measure for future therapeutic interventions in the sense of precision medicine.
Amyotrophic lateral sclerosis (ALS) is a neurodegenerative disease that pre-eminently affects the motoneuronal system and has a median survival time of 3 years after symptom onset. The age and site of onset, clinical spread and rate of functional decline all vary considerably among patients (Foster and Salajegheh, 2019; Feldman et al., 2022). In addition patients are often diagnosed with delay or even misdiagnosed (Paganoni et al., 2014; Behzadi et al., 2021). This considerable variability represents a significant challenge for both clinical management and the development of new therapies. Accordingly, a major focus in the field has been the validation of reliable biomarkers that can assist with diagnoses and/or monitor disease progression (Dreger et al., 2022; Sanchez-Tejerina et al., 2023). To date, therapeutic trials applied outcome measures that are derived from clinical observations, mainly the revised ALS Functional Rating Scale (ALSFRS-R) or long-term survival rates (Benatar et al., 2022). The recent example of the agent Tofersen underlines the importance of other outcome measures that were pivotal for its marketing authorization tailored to the minority of patients with ALS carrying a variant in the SOD1-gene. While the primary outcome measure of ALSFRS-R decline failed to reveal a significant effect in the respective phase 3 study, it was observed that Tofersen led to greater reductions in concentrations of SOD1 in cerebrospinal fluid (CSF), and of neurofilament light chains in plasma than placebo (Miller et al., 2022). This illustrates the potential of biomarkers to enhance the advancement of clinical trials. However, more research is necessary to identify and validate specific pharmacodynamic, prognostic, or predictive biomarkers in order to ensure that signals observed from these surrogates are indeed clinically meaningful (Kiernan et al., 2020).
Studying the central nervous system compartment CSF, neurofilaments are widely considered as promising biomarkers for various neurodegenerative and neuroinflammatory conditions, due to their neuronal specificity (Verber and Shaw, 2020; Abu-Rumeileh et al., 2022). Neurofilaments constitute part of the intermediate filament family, comprising light (NfL), middle and heavy chains of varying weights and are essential components of the axonal cytoskeleton (Gentil et al., 2015; Khalil et al., 2018; Hohmann and Dehghani, 2019). They are explicitly expressed during neuronal growth and maturation-, in large-myelinated neurons, which make them particularly interesting for research in motor neuron diseases (Bomont, 2021; Zecca et al., 2022). The neurofilament isoforms assemble and form compound-filaments which provide structural stability for the neurons. They are also involved in transport and docking of organelles (Yuan et al., 2017; Zucchi et al., 2020). The phosphorylation of neurofilament heavy chain tails occurs as post-translational modification and indicates the interaction with neighboring filaments that regulate their axonal transport rate (Gentil et al., 2015; Bomont, 2021). Amyotrophic lateral sclerosis is associated with significantly elevated CSF-levels of neurofilaments that are likely caused by the axonal damage, but may also be directly related to the pathophysiological process of this neurodegenerative disease (Khalil et al., 2018).
Studies comparing CSF levels of neurofilament light (NfL) vs. phosphorylated heavy chains (pNfH) have suggested that the two have different sensitivity and specificity for ALS (Poesen and Damme, 2018). Moreover, a former study by Menke et al. (2015) suggested that pNfH correlates better with clinical signs of lower motor neuron damage than NfL, that on the other side has been described to correlate with upper motor neuron dysfunction. During the progressing ALS disease, longitudinal studies revealed that pNfH CSF concentrations remain relatively stable, while some studies assessing NfL serially reported unstable levels (Lu et al., 2015; Steinacker et al., 2015; Poesen et al., 2017). This would qualify pNfH as the preferred candidate biomarker that may be assessed at any time during the symptomatic phase of the disease (Simonini et al., 2021; Dreger et al., 2022; Heckler and Venkataraman, 2022). In principle, recent studies supported that the level of CSF pNfH mirrors the rate of neuroaxonal breakdown as it correlated with survival (Steinacker et al., 2015; Simonini et al., 2021; Kläppe et al., 2024). Concerning the association with progression speed of the disease, the ALSFRS-R derived disease progression rate (DPR) was used as linear approximation of the speed of disease progression (Labra et al., 2016), but studying the association with CSF concentrations of pNfH yielded mixed results. Some authors described a significant correlation with the DPR in limited cohorts of patients with ALS (McCombe et al., 2015; Schaepdryver et al., 2018; Simonini et al., 2021; Benatar et al., 2024), while others failed to reveal such a correlation (Li et al., 2016).
A common reason for the controversial results of these previous studies may be the weakness of the clinical measure, as the DPR assumes a linear decline of ALSFRS-R sum scores in progressing disease. By contrast, previous large-scale observations showed that the rate of decline varies throughout the individual course of the disease and follows rather a curvilinear course (Proudfoot et al., 2016; Ramamoorthy et al., 2022). In addition, the calculation of a progression-rate based on a single score, is highly susceptible to the known intra-rater and inter-rater variability associated with ALSFRS-R scoring (Bakker et al., 2020).
The D50 model of ALS disease progression was developed in order to overcome such limitations of traditional clinical metrics. It has already proven to facilitate robust correlations with values originating from various biomarker signals (Gaur et al., 2023; Magen et al., 2021; Steinbach et al., 2021). Briefly, the model characterizes the progressive decline in motoneuronal capacity from full health to functional loss (Figure 1). It quantifies overall disease aggressiveness as the time taken to reach halved functionality (parameter D50) and further enables the calculation of individual disease covered/accumulation (e.g., in distinct phases) and of acute descriptors of local disease activity. Strengths of the D50 model in comparison to traditional disease metrics are that it takes into account the individual clinical course as a whole and reflects its typically curvilinear decline of disability more appropriate (Ramamoorthy et al., 2022). It thus enables unbiased comparisons of patients with vastly differing time courses of the disease in cross-sectional cohorts (so-called pseudo-longitudinal approach). Furthermore, it reduces noise inherent with ALSFRS-R assessment mentioned before, as it incorporates multiple serial measurement time-points per patient instead of a singular observation.

Figure 1. D50-modeling of disease progression in the ALS cohort (n = 108). (A) Based on consecutively assessed ALSFRS-R scores (dots), a sigmoidal functional decline curve is calculated. The value D50 depicts the individual time in months since symptom onset until halved functionality, indicating the overall disease aggressiveness of each individual patient. The curves represent three examples of patients with either high (in red), intermediate (in green), or low disease aggressiveness (in blue). Descriptors of local disease activity can be calculated for any given time point (here: day of lumbar puncture): (i) the calculated Functional Loss-rate (cFL) that measures the acute decay rate of points lost per month; (ii) the Calculated Functional State (cFS) that uses the same scale as the ALSFRS-R score. (B) Normalizing the D50-value onto 0.5 yields the relative D50 (rD50) which measures individual disease covered/accumulation, independent of disease aggressiveness and can be calculated for any given timepoint (here: day of lumbar puncture). Based on rD50, the disease course can be divided into distinct phases: (a) the early semi-stable Phase I (rD50 < 0.25), (b) the early progressive Phase II (0.25 ≤ rD50 < 0.50), and (c) the late progressive/stable Phases III/IV (rD50 ≥ 0.50). (C) Direct correlation of dx, the time constant of functional decline, and D50 is highly significant which explains why D50 alone can be used to describe the functional decline. (D) Illustrates the diversification of conservatively linear-approximated disease progression rates (DPR; points lost per month) per patient in relation to modeling parameters with only minor determination: DPR with dx (R2 = 0.23) and (E) DPR with cFL (R2 = 0.27).
In this study, we applied the D50 model to a heterogeneous cohort of patients with ALS to investigate if CSF pNfH concentrations would correlate with measures of disease progression speed independent of disease accumulation. We additionally hypothesized that CSF pNfH levels would capture patients’ overall disease aggressiveness (as measured by D50) better than parameters measuring local rate of progression. If confirmed, this would underscore the potential of pNfH as meaningful outcome measure thus reflecting overall disease aggressiveness of the symptomatic stages of the ALS disease, independent of the time of assessment (i.e., lumbar puncture).
All participants were recruited from the Neuromuscular Center at Jena University Hospital (Germany) between the years 2013 and 2020 and written informed consent was obtained prior to study initiation. All procedures were approved by the local ethics committee (Nr. 3,633–11/12) and were conducted in accordance with the Declaration of Helsinki and its later amendments. A total of 153 individuals diagnosed with motor neuron disease and available CSF samples were identified from the local specialized neuromuscular disease database (Steinbach et al., 2020). We only included patients who fulfilled the Gold Coast criteria for the diagnosis of ALS as assessed by a specialized physician (Shefner et al., 2020). To allow stringent D50 modeling and comparison with the traditional DPR, we only included individuals who met all of the following criteria: (a) ≥2 recorded ALSFRS-R scores available, (b) at least one score taken within 20 days before/after CSF sampling, (c) at least one score ≥ 35 and (d) at least one score ≤ 36. This led to the exclusion of 57 individuals and the final cohort included 108 patients with ALS (see also Figure 2 for an overview of the study procedures). According to patients’ reports of the first site of motoric function loss, the clinical onset was allocated to the bulbar or spinal (i.e., limbs) region. Furthermore, clinical phenotypes were classified as either classic, bulbar, pyramidal, flail arm, flail leg, respiratory or pure lower motor neuron as described by Chiò et al. (2011). The presence of comorbid frontotemporal dementia was assessed according to the Strong criteria (Strong et al., 2009, 2017).

Figure 2. Study flow of study procedures. Identification and selection of the study cohort is given, resulting in the final cohort of 108 patients with ALS and ELISA quantified concentrations of pNfH in CSF. Three different measures of disease progression speed were calculated: (i) D50 = overall disease aggressiveness, (ii) the calculated functional loss-rate (cFL) = locally derived parameter of progression speed and (c) the disease progression-rate (DPR) as linear approximation of ALSFRS-R points lost per month since symptom onset. Each of the progression speed parameters was comparatively analyzed in relation to CSF pNfH levels via analyses of covariance, linear and non-linear regressions.
Cerebrospinal fluid (CSF) samples were obtained via lumbar puncture at the Department of Neurology, Jena University Hospital following an in-house standard operating procedure. Accordingly, the CSF samples were subjected to centrifugation (5,000 × g, 10 min, 4°C), aliquoting, and cryopreservation at −80°C within 2 h after lumbar puncture until further use. The pNfH concentrations were determined using a commercially validated ELISA kit (Biovendor International, RD191138300R); assays were performed in accordance with manufacturer instructions at one of two European laboratories in Germany (n = 56) and Belgium (n = 52) that are accredited for these analyses. All samples were analyzed in duplicate, and the intra- and inter-assay coefficients of variation were both ≤10% and ≤20%, respectively.
The D50 Disease Progression Model provides a detailed framework to interpret any biomarker signal as it provides quantitative measures of disease aggressiveness that are distinct from parameters of disease accumulation (Poesen et al., 2017; Steinbach et al., 2020). Briefly, the model calculates an individual sigmoidal state transition from functional health to motor function loss, based on all available ALSFRS-R scores longitudinally collected on a regular basis for the individual patient (Figure 1A). The resulting sigmoidal curve can be characterized by two parameters: (a) D50, that represents the time in months since symptom onset until the time point of halved functionality, and (b) dx, that represents the time constant of functional decline, i.e., the steepness of the curve. Repeated observations showed that both parameters D50 and dx exhibit a direct intercorrelation in different cohorts (Poesen et al., 2017; Prell et al., 2019; Steinbach et al., 2020) as also confirmed for the patient sample of this study (R2 = 0.86, p < 0.001; Figure 1C). Therefore, the D50 value alone can be employed to describe the curve and thus provides a discrete descriptor of the overall disease aggressiveness of an individual patient. The patients of this study were thus categorized into three subgroups of (a) high (D50 < 20 months), (b) intermediate (20 ≤ D50 < 40 months), and (c) low (D50 ≥ 40 months) disease aggressiveness. The relative D50 (rD50) parameter is obtained by normalizing the patient’s real-time sigmoidal disease trajectory to D50. This results in an open-ended reference scale, with 0 representing symptom onset and 0.5 representing the time point at which functionality is halved (Figure 1B). The rD50 provides an individualized quantification of disease accumulation, independent of disease aggressiveness, that can be calculated for any given time-point and was calculated in this cohort for the day of lumbar puncture. Based on the observations of rD50 modeling, patients can be classified into one of three phases of similar disease progression patterns that they pass during the course of their disease: (a) the early semi-stable phase I (0 ≤ rD50 < 0.25), (b) the early progressive phase II (0.25 ≤ rD50 < 0.5), and (c) the late progressive and stable phase III/IV (0.5 ≤ rD50) (Figure 1B). Besides, the model also provides the opportunity to calculate descriptors of local disease activity, for any given time point, namely the calculated Functional State (cFS) and the calculated Functional Loss-rate (cFL). The latter was calculated in this study for the individual time of lumbar puncture as it provides a measure of the acute decay rate of points lost per month, thus the local steepness of the sigmoidal curve (Figure 1A). Patients were categorized into subgroups of (a) fast (cFL > 1), (b) intermediate (0.5 > cFL ≤ 1), and (c) slow (cFL ≤ 0.5) local loss-rate. For comparison purposes, the traditional DPR was also assessed, as linearly approximated based on the ALSFRS-R nearby the day of lumbar puncture and measured in points lost per month since symptom onset. Similar borders were applied for categorization of the cohort, i.e., (a) fast (DPR > 1), (b) intermediate (0.5 > DPR ≤ 1), and (c) slow (DPR ≤ 0.5).
The statistical analyses and graphical representation of the data were conducted using the R programming language and the RStudio open-source software program (Version 2023.06.1, Posit Software, PBC, Boston, MA, United States) used on macOS Sequoia 15. Normality was assessed using the Shapiro–Wilk test with a log-10 transformation applied to the following continuous variables to allow the application of parametric tests: pNfH concentration, D50, cFL and DPR.
To assess the differences in log[pNfH]-concentrations across distinct D50-derived ALS subgroups, namely low, intermediate, and high aggressiveness, a one-way analysis of covariance (ANCOVA) was conducted, employing the following covariates: age at LP, presence of FTD, sex, laboratory of pNfH measurement, clinical onset region and rD50-derived disease phase. In addition, the same methodology was applied using subgroups based on the cFL and DPR instead of the D50 subgroups. The ANCOVAs were followed by post hoc analyses with Wilcoxon-Rank-Sum-Testing.
Linear regression models were constructed for each of these three disease progression speed variables with log[pNfH] as dependent variable. For more in-depth analyses of these potential associations, non-linear regression models were applied using the goodness-of-fit (chemdeg package; Version 0.1.4) and gls-nls (Version 1.3.2) sub-programs in R. The non-linear regression in general gives information about the model used for correlation with data, with a mathematical function as non-linear (bent) output. Subsequently, a goodness-of-fit analysis was conducted, in order to assess how well the fitted curve predicts the real data. The Akaike Information Criterion (AIC) was employed to compare the relative merits of alternative models in order to identify the optimal fit for the data in question. A lower AIC-value indicates a better prediction. Additionally, the Root-Mean-Square Error (RMSE) was employed as a non-negative measure, offering a valuable metric for comparing forecasting errors across diverse predictive models. The RMSE provides an absolute measure of fit, where a lower RMSE value indicates a superior fit of the model, i.e., that the prediction is closer to the real values.
The demographic and clinical data of the participants, stratified by D50-derived disease aggressiveness subgroups, are presented in Table 1. No significant inter-subgroup differences were observed concerning sex or age. Notably, disease accumulation at the day of sampling, as measured via relative D50 (rD50), did not significantly differ between the three aggressiveness subgroups. Accordingly, the distribution of rD50-derived phases did not differ either, thus confirming independence of disease accumulation and aggressiveness in this cohort. Concerning the parameters cFL and DPR, we also found significant differences across the aggressiveness subgroups, indicating partial but not entire overlapping of these subgroups (see also Figure 3).
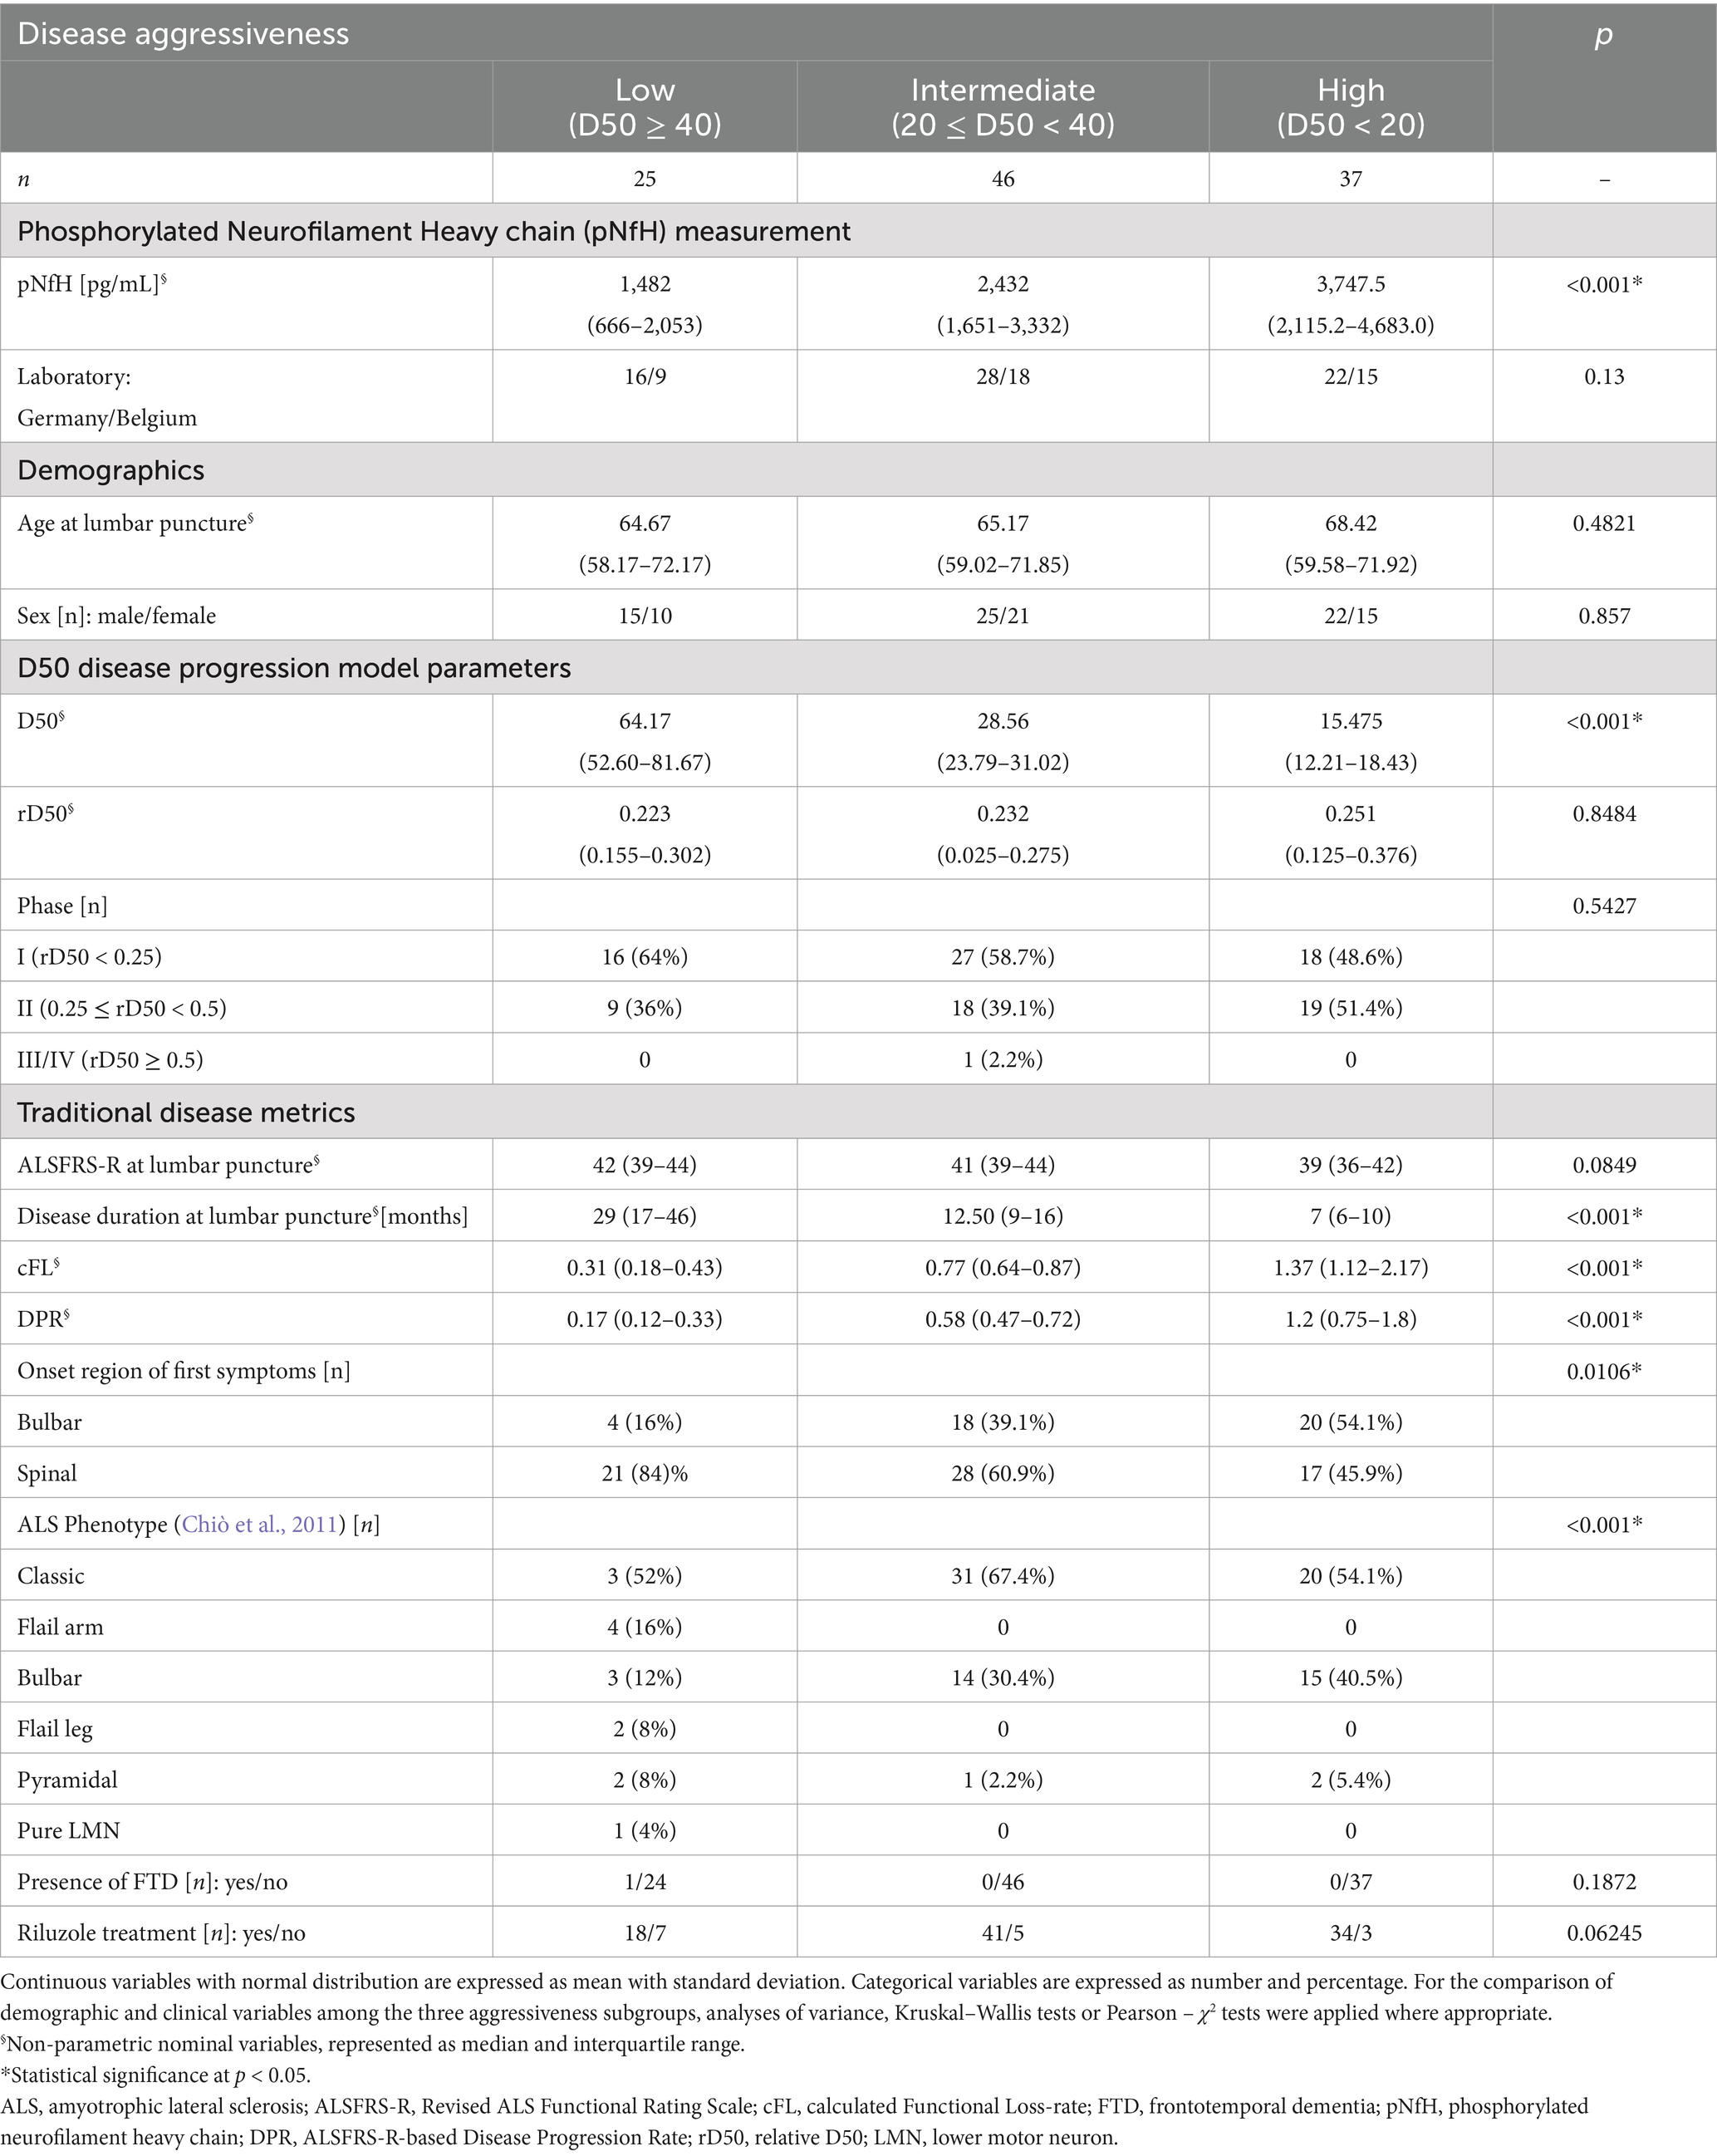
Table 1. Demographic and clinical data for Patients with ALS (n = 108).

Figure 3. Cerebrospinal fluid (CSF) pNfH concentrations in pg/ml compared between different ALS subgroups, each stratified by a disease progression speed variable show that (A) D50-derived subgroups are best discriminative. (B) cFL-derived subgroups are less discriminative and (C) DPR-derived subgroups even worse concerning pNfH levels. With significance levels from post hoc Wilcoxon-Rank-Sum-Testing: * = p < 0.05, ** = p < 0.01, *** = p < 0.001; NS, no significance; stratified into D50-derived disease aggressiveness with low (blue; D50 > 40 months), intermediate (green; 20 < D50 ≤ 40 months) and high aggressiveness (red; D50 < 20 months).
The ANCOVA demonstrated a highly statistically significant effect for CSF log[pNfH] concentrations across the three disease aggressiveness subgroups (p < 0.001, Table 2). In contrast, the ANCOVAs applying either the cFL or DPR as grouping variables, demonstrated higher but still significant p-values for this factor of 0.005 or 0.006, respectively, (>0.001) but notably also lower F-values (D50: 10.43; cFL: 5.58; DPR: 5.3). In accordance, the post hoc analyses indicated statistical significance only for the pairwise comparisons of the subgroups from both edges of the grouping, i.e., fast-vs.-slow cFL/DPR (p < 0.01) (Figure 3). It is of particular importance to note that the disease phase did not exert a significant effect on log[pNfH] concentrations in any of the ANCOVAs conducted. Accordingly, the linear regression of log[pNfH] and rD50 did not reveal a statistically significant correlation (Supplementary Figure 1). This indicates independence of pNfH levels from disease accumulation. Notably, almost all other covariates applied in the ANCOVAs did also not show any significant influence. Only the factor age at sampling was nearer to the significance threshold for the D50/cFL subgrouping (p = 0.09/0.08, Table 2), but decided the threshold for the ANCOVA applying DPR subgrouping thus indicating a significant age influence on log[pNfH] levels (p = 0.02, Table 2).
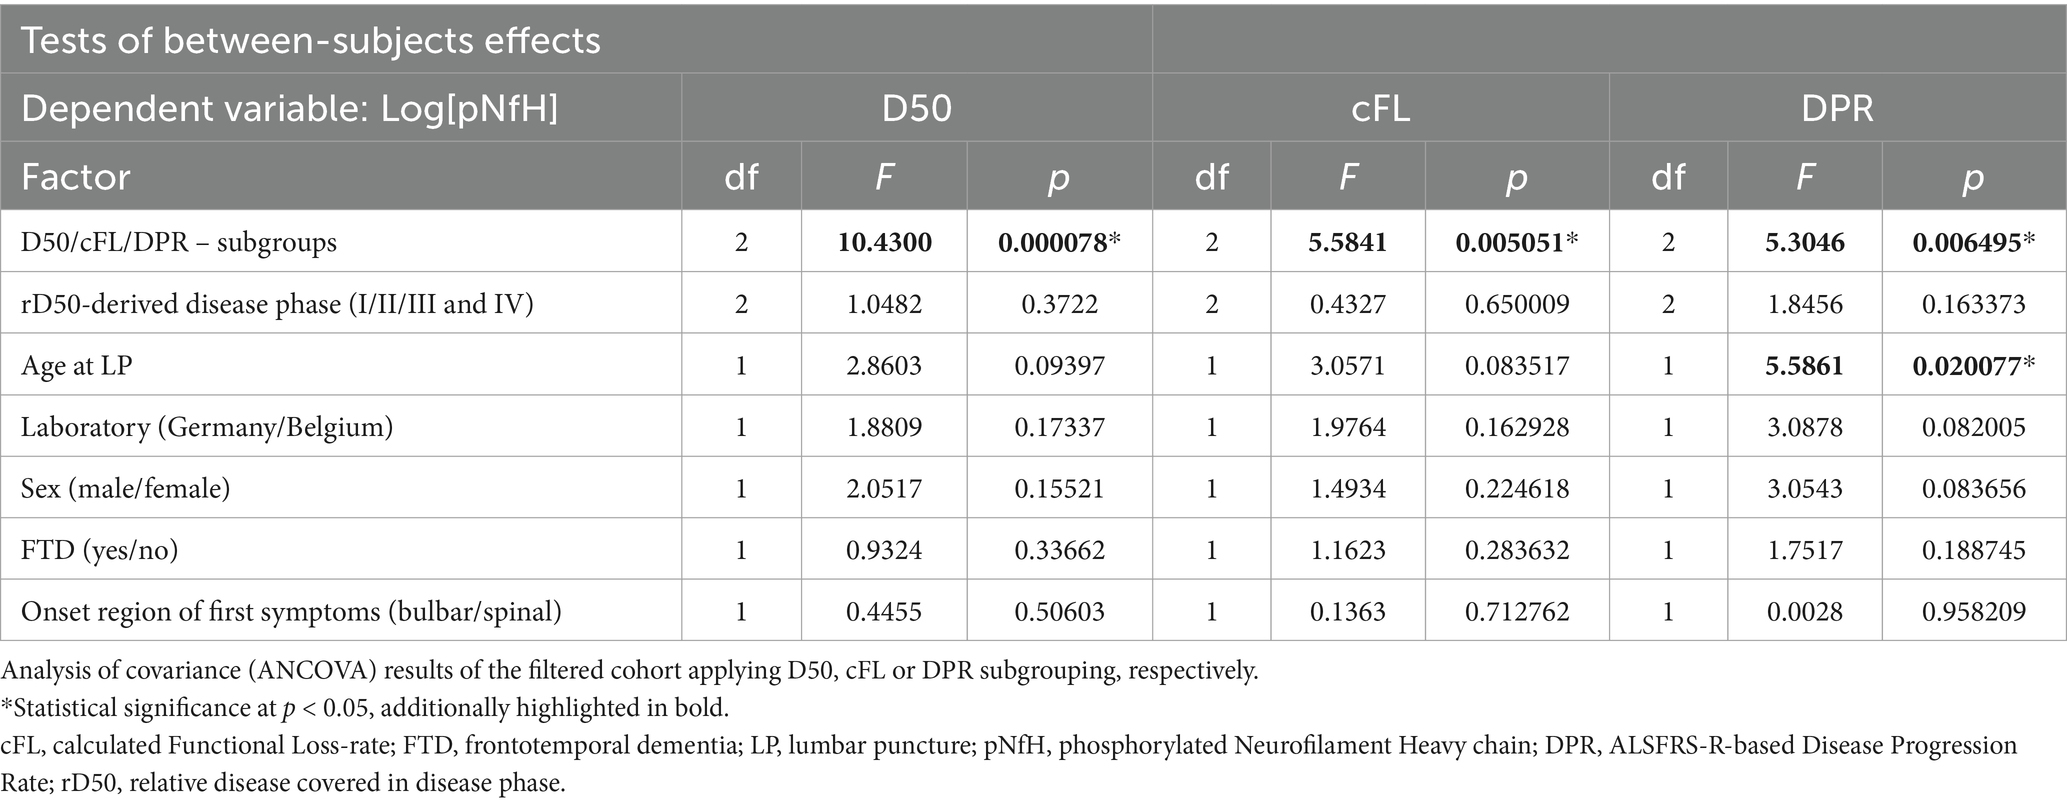
Table 2. Analysis of covariance (ANCOVA).
The pairwise comparisons of pNfH concentrations in-between the D50-derived disease aggressiveness subgroups revealed the most conclusive differences, i.e., p < 0.05 for high vs. intermediate subgroup, p < 0.01 concerning the low and intermediate subgroup, and p < 0.001 comparing the low with the high disease aggressiveness subgroup (Figure 3A). The subgroups defined by cFL were less discriminative concerning pairwise comparisons of pNfH-concentrations that were not significantly different between the slow and intermediate subgroup (Figure 3B). In DPR-defined subgroups pNfH performed even less discriminative especially for the extreme subgroup comparisons (slow vs. fast, p < 0.01) (Figure 3C).
The three linear regression analyses, each applying one of the parameters assessing disease progression speed, demonstrated all statistically significant correlations with log[pNfH] (p < 0.001; Figures 4A–C). However, the linear model using log[D50] exhibited the highest coefficient of determination (R2) of 0.25 and the lowest p-value (Figure 4A) while in comparison log[DPR] performed worst (R2 = 0.16; Figure 4C). As the association between CSF pNfH-concentrations and ALS progression speed parameters is apparently not linear, we additionally applied a non-linear regression model to further examine the correlation. This exhibited markedly disparate plots of correlation-curves with log[pNfH] across all three variables (Figures 4D–F). Log[pNfH] revealed a more shaped curve (Figure 4D), whereas the non-linear regression-curves for log[cFL] and log[DPR] demonstrated a clinched sigmoidal shape (Figures 4E,F). In accordance, the non-linear regression model applying log[D50] exhibited the most optimal goodness-of-fit measures, with an AIC of 20.418 and an RMSE of 0.259.

Figure 4. (A–C) Linear regressions of disease progression speed paramters with CSF pNfH showed the highest R2 of 0.25 and the lowest p-value for D50 in comparison to cFL and DPR. (D–F) Non-linear regressions also showed superiority for D50 with the best goodness-of-fit meassures (Akaike Information Criterion = 20.413 and Root Mean Square Error = 0.259).
In the present study, the principal aim was to examine which clinical parameter assessing disease progression speed is best correlated with pNfH-concentration in the CSF of patients with ALS. In principle, pNfH-levels were able to discriminate in-between subgroups as defined by all three disease speed parameters (D50, cFL, DPR) respectively (Table 2). However, post hoc analyses showed, that only the D50-parameter was able to significantly discriminate pairwise across all three aggressiveness subgroups, while this approach failed for the slowest subgrouping applying the other parameters (fast-vs.-slow cFL/DPR; Figure 3). The regression models (linear and non-linear) did also reveal superiority of the parameter D50 while DPR and cFL performed worse in correlation with pNfH-levels (Figure 4).
Some studies with limited cohorts investigated potential associations between pNfH levels in CSF and disease progression in ALS so far, applying the singular disease metric of the linearly approximated DPR (Steinacker et al., 2015, 2018; Li et al., 2016; Poesen et al., 2017; Schaepdryver et al., 2018; Thompson et al., 2019; Behzadi et al., 2021). Other studies reported correlations between CSF pNfH and progressiveness applying linear mixed models with more locally assessed disease progression rates (Huang et al., 2020) and another measured the time to generalization of clinical symptoms (Li et al., 2016). It was mentioned before that the high inter-patient variability observed in ALS disease progression necessitates the usage of a framework that can holistically interpret the progression of the disease and putative biomarkers. Therefore, the D50 model was applied in this study enabling a comprehensive analysis of a well-defined cross-sectional dataset. An important advantage of this progression-modeling is that it provides quantifications of disease aggressiveness (D50) separately from disease accumulation (rD50, phase). According to this pseudo-longitudinal approach, we were able to show that CSF pNfH levels remain stable throughout the symptomatic disease, because we did not find a significant effect of disease phase nor a direct correlation between rD50 and pNfH (Supplementary Figure 1). This is in line with previous real-longitudinal studies that also reported stability of pNfH-levels, however, owing to the invasive nature of CSF collection, only a limited number of patients had been examined via serial lumbar punctures before (Steinacker et al., 2015; Gendron et al., 2017; Poesen et al., 2017; Huang et al., 2020). The pseudo-longitudinal approach applied in this study further confirmed that CSF pNfH is strongly associated with patient’s disease aggressiveness, independent of how far the disease has progressed at the time of sampling. This would promote a broader inclusion of patients in therapeutic studies using pNfH as prognostic marker. However, it should be noted that the patients included here were in disease phases 1 or 2. Otherwise, biomarkers for patients who have already progressed to disease phase 3/4 are unlikely to be useful for upcoming interventional studies (Benatar et al., 2022). Notably, the only additional parameter that showed borderline influence on pNfH levels was age. Increasing neurofilament-levels with aging are known from former studies in cohorts of healthy individuals (Khalil et al., 2020; Witzel et al., 2024). However, the results of this study suggest that in the context of ALS the influence of age is of minor importance. It is remarkable that although ELISAs were performed in two different laboratories (Belgium and Germany) we found no significant impact of the factor analyzing laboratory on pNfH levels. A previous study testing the same samples in different laboratories in a “round-robin” comparison revealed low coefficients of variation for pNfH-CSF ELISAs, while those for CSF NfL tended to be relatively less reliably replicable (Gray et al., 2020). Although this should be interpreted with caution it might be that CSF pNfH is the better candidate if analyzed in inter-laboratory conditions, perhaps due to higher pre-analytical stability. This opens perspectives to use our approach in multi-center trials, if standards for biofluid collection and neurochemical laboratory analysis are considered (Oeckl et al., 2016; Benatar et al., 2020).
After all, it could be demonstrated that pNfH levels in CSF are more increased in ALS patients with higher disease aggressiveness, even after adjustment for interlaboratory variations, age, sex, presence of FTD, ALS onset region and disease phase. Applying grouping based on cFL and DPR, pNfH-levels were also partly discriminative in-between subgroups, but most noteworthy did not reveal any significant differences between slow and intermediate subgroups. This superiority of D50 in relation to pNfH is remarkable as this parameter is a time constant describing the overall course of the whole disease contrary to local, time-dependent decay-rates such as the cFL. This supports the concept that pNfH measured at any time during the disease may serve as outcome measure of an individual overall disease trajectory. As such, our data suggest that CSF pNfH might be a suitable biomarker for therapeutic responses, but further studies are needed to assess its potential as outcome measure in ALS, as replications in independent cohorts are necessary.
Therefore, one important advantage of the D50-model framework is that it can be applied retrospectively provided that serial ALSFRS-R assessments are available per patient. This opens perspectives for multi-center analyses including highly-frequent clinical (self-)assessments of patients from different sources (Maier et al., 2022; Meyer et al., 2023). However, thorough review and regular follow-up by personal trained in neuromuscular disease is necessary as is a specialized preferably milestone-based documentation of such data (Steinbach et al., 2020). Although the strong association between CSF pNfH and D50 demonstrated in this study is promising, it should be noted that it relies on observations on a group-level. For the development of a prognostic biomarker that is applicable on an individualized level it is likely that a combination of surrogates from different sources is needed, such as blood biomarkers or imaging (Dreger et al., 2022; Staffaroni et al., 2022).
Former comparative studies measuring pNfH in CSF as well as in blood demonstrated good accordance, but still the latter is often not analyzed in ALS cohorts on a regular basis (Boylan et al., 2013; Schaepdryver et al., 2018). A recent study suggested that blood-levels of pNfH may be less valuable than NfL in association with disease progression, however this could be attributed to inaccuracies of pNfH blood-assays that are still technically challenging (Sturmey and Malaspina, 2022; Benatar et al., 2024). Moreover, although blood-based biomarkers are easier assessable, this becomes less important in the context of repeatedly intrathecal-administered therapeutics such as Tofersen or other genetically-based agents currently under consideration for ALS (Boros et al., 2022; Wiesenfarth et al., 2024). In line with this, recent real-world studies of treatment with Tofersen in SOD1 ALS patients showed a marked decline of serum NfL as well as CSF pNfH mirroring clinical disease stabilization (Wiesenfarth et al., 2024; Smith et al., 2025).
It is important to note, that we were not able to provide similar comparative analyses of NfL levels (serum or CSF) in combination with the clinical parameters, mainly due to the retrospective nature of the study. A former analysis studying another cohort of patients with CSF NfL levels revealed that there is a strong correlation with D50, independent of rD50 (Dreger et al., 2021). In addition, since measurements of neurofilament blood-concentrations (most of all NfL) become increasingly available, this opens new perspectives for future large comparative studies for which the D50 model provides a suitable analysis framework.
Regarding the regression models across the different disease progression speed parameters, it is important to note that the non-linear regressions were most informative, again demonstrating a superiority of the parameter D50. This implies a recommendation for future studies to consider non-linear relations between potential biomarkers and clinical parameters.
This study is not without limitations. This is a monocentric study and replication of the results examining independent cohorts is necessary. In addition, comparative studies are needed, studying also NfL in CSF as well as serum concentrations of both neurofilaments in relation to the clinical parameters. In addition, verification through real longitudinal data is necessary to confirm if pNfH levels are stable throughout the disease course. Such future studies will require well-designed multi-center initiatives (Meyer et al., 2024) with implemented standard procedures of biofluid collection and laboratory analysis (Oeckl et al., 2016; Benatar et al., 2020). Furthermore, genetic profiles of the patients with ALS included were not available due to the retrospective nature of the study, which is why we could not examine possible implications of genetic subtypes on pNfH levels.
In conclusion, we were able to demonstrate that pNfH is a surrogate of overall ALS disease aggressiveness as quantified via D50 in a multi-variate and unbiased approach. The modeling thereby reduces noise associated with ALSFRS-R assessment and most important accounts for the non-linear clinical progression during the course of the disease (Proudfoot et al., 2016; Ramamoorthy et al., 2022). Future, independent multivariate studies are needed incorporating different analyte candidates with the principal aim of a composite outcome-measure and/or individually applicable prognostic biomarker, as urgently needed in the advent of precision therapy for ALS (Ashhurst et al., 2022).
The raw data supporting the conclusions of this article will be made available by the authors, without undue reservation.
The studies involving humans were approved by Universitätsklinikum Jena Ethik-Kommission Postfach 07740 Jena. The studies were conducted in accordance with the local legislation and institutional requirements. The participants provided their written informed consent to participate in this study.
JM: Formal analysis, Investigation, Methodology, Writing – original draft, Writing – review & editing, Software, Visualization. NG: Methodology, Writing – review & editing, Data curation, Validation. JGa: Writing – review & editing. BF: Writing – review & editing. AR: Writing – review & editing. JGr: Conceptualization, Funding acquisition, Methodology, Resources, Supervision, Writing – review & editing, Project administration. RS: Writing – review & editing, Conceptualization, Data curation, Formal analysis, Funding acquisition, Investigation, Methodology, Resources, Supervision, Validation, Writing – original draft.
The author(s) declare that financial support was received for the research, authorship, and/or publication of this article. This research was supported by the Bundesministerium für Bildung and Forschung (BMBF) in the framework of the E-RARE programme (PYRAMID), JPND (ONWebDUALS), the Motor Neurone Disease Association (MNDA), the Deutsche Gesellschaft für Muskelkranke (DGM) and the Deutsche Forschungsgemeinschaft (DFG). Julian Grosskreutz was also supported by the Boris Canessa foundation and the Cluster of Excellence Precision Medicine in Inflammation (DFG grant EXC 2167). Robert Steinbach was supported with an advanced clinician scientist programme (ACSP 14) by the Interdisciplinary Centre of Clinical Research of the Medical Faculty Jena. Nayana Gaur was supported by a doctoral scholarship (Landesgraduiertenstipendium, 2019 (Landesgraduiertenstipendium, −2022)) from the Graduate Academy of Friedrich Schiller University, Jena, Germany, and the state of Thuringia and is presently supported by a postdoctoral grant from the Estonian Research Council (SJD90, 2022–2024). We acknowledge support by the German Research Foundation Projekt-Nr. 512648189 and the Open Access Publication Fund of the Thueringer Universitaets- und Landesbibliothek Jena.
The authors declare that the research was conducted in the absence of any commercial or financial relationships that could be construed as a potential conflict of interest.
The authors declare that no Gen AI was used in the creation of this manuscript.
All claims expressed in this article are solely those of the authors and do not necessarily represent those of their affiliated organizations, or those of the publisher, the editors and the reviewers. Any product that may be evaluated in this article, or claim that may be made by its manufacturer, is not guaranteed or endorsed by the publisher.
The Supplementary material for this article can be found online at: https://www.frontiersin.org/articles/10.3389/fnins.2025.1536818/full#supplementary-material
Abu-Rumeileh, S., Abdelhak, A., Foschi, M., D’Anna, L., Russo, M., Steinacker, P., et al. (2022). The multifaceted role of neurofilament light chain protein in non-primary neurological diseases. Brain 146, 421–437. doi: 10.1093/brain/awac328
Ashhurst, J. F., Tu, S., Timmins, H. C., and Kiernan, M. C. (2022). Progress, development, and challenges in amyotrophic lateral sclerosis clinical trials. Expert. Rev. Neurother. 22, 905–913. doi: 10.1080/14737175.2022.2161893
Bakker, L. A., Schröder, C. D., Tan, H. H. G., Vugts, S. M. A. G., Van Eijk, R. P. A., Van Es, M. A., et al. (2020). Development and assessment of the inter-rater and intra-rater reproducibility of a self-administration version of the ALSFRS-R. J. Neurol. Neurosurg. Psychiatry 91, 75–81. doi: 10.1136/jnnp-2019-321138
Behzadi, A., Pujol-Calderón, F., Tjust, A. E., Wuolikainen, A., Höglund, K., Forsberg, K., et al. (2021). Neurofilaments can differentiate ALS subgroups and ALS from common diagnostic mimics. Sci. Rep. 11:22128. doi: 10.1038/s41598-021-01499-6
Benatar, M., Macklin, E. A., Malaspina, A., Rogers, M.-L., Hornstein, E., Lombardi, V., et al. (2024). Prognostic clinical and biological markers for amyotrophic lateral sclerosis disease progression: validation and implications for clinical trial design and analysis. EBioMedicine 108:105323. doi: 10.1016/j.ebiom.2024.105323
Benatar, M., Wuu, J., and Turner, M. R. (2022). Neurofilament light chain in drug development for amyotrophic lateral sclerosis: a critical appraisal. Brain 146, 2711–2716. doi: 10.1093/brain/awac394
Benatar, M., Zhang, L., Wang, L., Granit, V., Statland, J., Barohn, R., et al. (2020). Validation of serum neurofilaments as prognostic and potential pharmacodynamic biomarkers for ALS. Neurology 95, e59–e69. doi: 10.1212/WNL.0000000000009559
Bomont, P. (2021). The dazzling rise of neurofilaments: physiological functions and roles as biomarkers. Curr. Opin. Cell Biol. 68, 181–191. doi: 10.1016/j.ceb.2020.10.011
Boros, B. D., Schoch, K. M., Kreple, C. J., and Miller, T. M. (2022). Antisense oligonucleotides for the study and treatment of ALS. Neurotherapeutics 19, 1145–1158. doi: 10.1007/s13311-022-01247-2
Boylan, K. B., Glass, J. D., Crook, J. E., Yang, C., Thomas, C. S., Desaro, P., et al. (2013). Phosphorylated neurofilament heavy subunit (pNF-H) in peripheral blood and CSF as a potential prognostic biomarker in amyotrophic lateral sclerosis. J. Neurol. Neurosurg. Psychiatry 84, 467–472. doi: 10.1136/jnnp-2012-303768
Chiò, A., Calvo, A., Moglia, C., Mazzini, L., and Mora, G.Group*, P. study (2011). Phenotypic heterogeneity of amyotrophic lateral sclerosis: a population based study. J. Neurol. Neurosurg. Psychiatry 82, 740–746. doi: 10.1136/jnnp.2010.235952
Dreger, M., Steinbach, R., Gaur, N., Metzner, K., Stubendorff, B., Witte, O. W., et al. (2021). Cerebrospinal fluid Neurofilament light chain (NfL) predicts disease aggressiveness in amyotrophic lateral sclerosis: An application of the D50 disease progression model. Front. Neurosci. 15:651651. doi: 10.3389/fnins.2021.651651
Dreger, M., Steinbach, R., Otto, M., Turner, M. R., and Grosskreutz, J. (2022). Cerebrospinal fluid biomarkers of disease activity and progression in amyotrophic lateral sclerosis. J. Neurol. Neurosurg. Psychiatry 93, 422–435. doi: 10.1136/jnnp-2021-327503
Feldman, E. L., Goutman, S. A., Petri, S., Mazzini, L., Savelieff, M. G., Shaw, P. J., et al. (2022). Amyotrophic lateral sclerosis. Lancet 400, 1363–1380. doi: 10.1016/S0140-6736(22)01272-7
Foster, L. A., and Salajegheh, M. K. (2019). Motor neuron disease: pathophysiology, diagnosis, and management. Am. J. Med. 132, 32–37. doi: 10.1016/j.amjmed.2018.07.012
Gaur, N., Steinbach, R., Plaas, M., Witte, O. W., Brill, M. S., and Grosskreutz, J. (2023). Chitinase dysregulation predicts disease aggressiveness in ALS: insights from the D50 progression model. J. Neurol. Neurosurg. Psychiatry 94, 585–588. doi: 10.1136/jnnp-2022-330318
Gendron, T. F., Daughrity, L. M., Heckman, M. G., Diehl, N. N., Wuu, J., Miller, T. M., et al. (2017). Phosphorylated neurofilament heavy chain: a biomarker of survival for 72-associated amyotrophic lateral sclerosis. Ann. Neurol. 82, 139–146. doi: 10.1002/ana.24980
Gentil, B. J., Tibshirani, M., and Durham, H. D. (2015). Neurofilament dynamics and involvement in neurological disorders. Cell Tissue Res. 360, 609–620. doi: 10.1007/s00441-014-2082-7
Gray, E., Oeckl, P., Amador, M. D. M., Andreasson, U., An, J., Blennow, K., et al. (2020). A multi-center study of neurofilament assay reliability and inter-laboratory variability. Amyotrophic Lateral Scler Frontotemporal Degener 21, 452–458. doi: 10.1080/21678421.2020.1779300
Heckler, I., and Venkataraman, I. (2022). Phosphorylated neurofilament heavy chain: a potential diagnostic biomarker in amyotrophic lateral sclerosis. J. Neurophysiol. 127, 737–745. doi: 10.1152/jn.00398.2021
Hohmann, T., and Dehghani, F. (2019). The cytoskeleton—a complex interacting meshwork. Cells 8:362. doi: 10.3390/cells8040362
Huang, F., Zhu, Y., Hsiao-Nakamoto, J., Tang, X., Dugas, J. C., Moscovitch-Lopatin, M., et al. (2020). Longitudinal biomarkers in amyotrophic lateral sclerosis. Ann Clin Trans Neurol 7, 1103–1116. doi: 10.1002/acn3.51078
Khalil, M., Pirpamer, L., Hofer, E., Voortman, M. M., Barro, C., Leppert, D., et al. (2020). Serum neurofilament light levels in normal aging and their association with morphologic brain changes. Nat. Commun. 11:812. doi: 10.1038/s41467-020-14612-6
Khalil, M., Teunissen, C. E., Otto, M., Piehl, F., Sormani, M. P., Gattringer, T., et al. (2018). Neurofilaments as biomarkers in neurological disorders. Nat. Rev. Neurol. 14, 577–589. doi: 10.1038/s41582-018-0058-z
Kiernan, M. C., Vucic, S., Talbot, K., McDermott, C. J., Hardiman, O., Shefner, J. M., et al. (2020). Improving clinical trial outcomes in amyotrophic lateral sclerosis. Nat. Rev. Neurol. 17, 104–118. doi: 10.1038/s41582-020-00434-z
Kläppe, U., Sennfält, S., Lovik, A., Finn, A., Bofaisal, U., Zetterberg, H., et al. (2024). Neurodegenerative biomarkers outperform neuroinflammatory biomarkers in amyotrophic lateral sclerosis. Amyotrophic Lateral Scler Frontotemporal Degener 25, 150–161. doi: 10.1080/21678421.2023.2263874
Labra, J., Menon, P., Byth, K., Morrison, S., and Vucic, S. (2016). Rate of disease progression: a prognostic biomarker in ALS. J. Neurol. Neurosurg. Psychiatry 87, 628–632. doi: 10.1136/jnnp-2015-310998
Li, S., Ren, Y., Zhu, W., Yang, F., Zhang, X., and Huang, X. (2016). Phosphorylated neurofilament heavy chain levels in paired plasma and CSF of amyotrophic lateral sclerosis. J. Neurol. Sci. 367, 269–274. doi: 10.1016/j.jns.2016.05.062
Lu, C.-H., Macdonald-Wallis, C., Gray, E., Pearce, N., Petzold, A., Norgren, N., et al. (2015). Neurofilament light chain. Neurology 84, 2247–2257. doi: 10.1212/WNL.0000000000001642
Magen, I., Yacovzada, N. S., Yanowski, E., Coenen-Stass, A., Grosskreutz, J., Lu, C.-H., et al. (2021). Circulating miR-181 is a prognostic biomarker for amyotrophic lateral sclerosis. Nat. Neurosci. 24, 1534–1541. doi: 10.1038/s41593-021-00936-z
Maier, A., Boentert, M., Reilich, P., Witzel, S., Petri, S., Großkreutz, J., et al. (2022). ALSFRS-R-SE: an adapted, annotated, and self-explanatory version of the revised amyotrophic lateral sclerosis functional rating scale. Neurol. Res. Pract. 4:60. doi: 10.1186/s42466-022-00224-6
McCombe, P. A., Pfluger, C., Singh, P., Lim, C. Y. H., Airey, C., and Henderson, R. D. (2015). Serial measurements of phosphorylated neurofilament-heavy in the serum of subjects with amyotrophic lateral sclerosis. J. Neurol. Sci. 353, 122–129. doi: 10.1016/j.jns.2015.04.032
Menke, R. A. L., Gray, E., Lu, C.-H., Kuhle, J., Talbot, K., Malaspina, A., et al. (2015). CSF neurofilament light chain reflects corticospinal tract degeneration in ALS. Ann. Clin. Trans. Neurol. 2, 748–755. doi: 10.1002/acn3.212
Meyer, T., Dreger, M., Grehl, T., Weyen, U., Kettemann, D., Weydt, P., et al. (2024). Serum neurofilament light chain in distinct phenotypes of amyotrophic lateral sclerosis: a longitudinal, multicenter study. Eur. J. Neurol. 31:e16379. doi: 10.1111/ene.16379
Meyer, T., Spittel, S., Grehl, T., Weyen, U., Steinbach, R., Kettemann, D., et al. (2023). Remote digital assessment of amyotrophic lateral sclerosis functional rating scale – a multicenter observational study. Amyotrophic Lateral Scler Frontotemporal Degener. 24, 175–184. doi: 10.1080/21678421.2022.2104649
Miller, T. M., Cudkowicz, M. E., Genge, A., Shaw, P. J., Sobue, G., Bucelli, R. C., et al. (2022). Trial of antisense oligonucleotide Tofersen for SOD1 ALS. N. Engl. J. Med. 387, 1099–1110. doi: 10.1056/NEJMoa2204705
Oeckl, P., Jardel, C., Salachas, F., Lamari, F., Andersen, P. M., Bowser, R., et al. (2016). Multicenter validation of CSF neurofilaments as diagnostic biomarkers for ALS. Amyotrophic Later Scler Frontotemporal Degener. 17, 404–413. doi: 10.3109/21678421.2016.1167913
Paganoni, S., Macklin, E. A., Lee, A., Murphy, A., Chang, J., Zipf, A., et al. (2014). Diagnostic timelines and delays in diagnosing amyotrophic lateral sclerosis (ALS). Amyotrophic Lateral Scler. Frontotemporal Degener. 15, 453–456. doi: 10.3109/21678421.2014.903974
Poesen, K., and Damme, P. V. (2018). Diagnostic and prognostic performance of neurofilaments in ALS. Front. Neurol. 9:1167. doi: 10.3389/fneur.2018.01167
Poesen, K., De Schaepdryver, M., Stubendorff, B., Gille, B., Muckova, P., Wendler, S., et al. (2017). Neurofilament markers for ALS correlate with extent of upper and lower motor neuron disease. Neurology 88, 2302–2309. doi: 10.1212/WNL.0000000000004029
Prell, T., Steinbach, R., Witte, O. W., and Grosskreutz, J. (2019). Poor emotional well-being is associated with rapid progression in amyotrophic lateral sclerosis. eNeurologicalSci 16:100198. doi: 10.1016/j.ensci.2019.100198
Proudfoot, M., Jones, A., Talbot, K., Al-Chalabi, A., and Turner, M. R. (2016). The ALSFRS as an outcome measure in therapeutic trials and its relationship to symptom onset. Amyotroph Lateral Scler Frontotemporal Degener 17, 414–425. doi: 10.3109/21678421.2016.1140786
Ramamoorthy, D., Severson, K., Ghosh, S., Sachs, K., Answer, A. L. S., Baxi, E. G., et al. (2022). Identifying patterns in amyotrophic lateral sclerosis progression from sparse longitudinal data. Nat Comput Sci 2, 605–616. doi: 10.1038/s43588-022-00299-w
Sanchez-Tejerina, D., Llaurado, A., Sotoca, J., Lopez-Diego, V., Taboada, J. M. V., Salvado, M., et al. (2023). Biofluid biomarkers in the prognosis of amyotrophic lateral sclerosis: recent developments and therapeutic applications. Cells 12:1180. doi: 10.3390/cells12081180
Schaepdryver, M. D., Jeromin, A., Gille, B., Claeys, K. G., Herbst, V., Brix, B., et al. (2018). Comparison of elevated phosphorylated neurofilament heavy chains in serum and cerebrospinal fluid of patients with amyotrophic lateral sclerosis. J. Neurol. Neurosurg. Psychiatry 89, 367–373. doi: 10.1136/jnnp-2017-316605
Shefner, J. M., Al-Chalabi, A., Baker, M. R., Cui, L.-Y., de Carvalho, M., Eisen, A., et al. (2020). A proposal for new diagnostic criteria for ALS. Clin. Neurophysiol. 131, 1975–1978. doi: 10.1016/j.clinph.2020.04.005
Simonini, C., Zucchi, E., Bedin, R., Martinelli, I., Gianferrari, G., Fini, N., et al. (2021). CSF heavy Neurofilament may discriminate and predict motor neuron diseases with upper motor neuron involvement. Biomedicines 9:1623. doi: 10.3390/biomedicines9111623
Smith, S. E., McCoy-Gross, K., Malcolm, A., Oranski, J., Markway, J. W., Miller, T. M., et al. (2025). Tofersen treatment leads to sustained stabilization of disease in SOD1 ALS in a “real-world” setting. Ann. Clin. Transl. Neurol. 12, 311–319. doi: 10.1002/acn3.52264
Staffaroni, A. M., Quintana, M., Wendelberger, B., Heuer, H. W., Russell, L. L., Cobigo, Y., et al. (2022). Temporal order of clinical and biomarker changes in familial frontotemporal dementia. Nat. Med. 28, 2194–2206. doi: 10.1038/s41591-022-01942-9
Steinacker, P., Feneberg, E., Weishaupt, J., Brettschneider, J., Tumani, H., Andersen, P. M., et al. (2015). Neurofilaments in the diagnosis of motoneuron diseases: a prospective study on 455 patients. J. Neurol. Neurosurg. Psychiatry 87, 12–20. doi: 10.1136/jnnp-2015-311387
Steinacker, P., Verde, F., Fang, L., Feneberg, E., Oeckl, P., Roeber, S., et al. (2018). Chitotriosidase (CHIT1) is increased in microglia and macrophages in spinal cord of amyotrophic lateral sclerosis and cerebrospinal fluid levels correlate with disease severity and progression. J. Neurol. Neurosurg. Psychiatry 89, 239–247. doi: 10.1136/jnnp-2017-317138
Steinbach, R., Prell, T., Gaur, N., Stubendorff, B., Roediger, A., Ilse, B., et al. (2020). Triage of amyotrophic lateral sclerosis patients during the COVID-19 pandemic: An application of the D50 model. JCM 9:2873. doi: 10.3390/jcm9092873
Steinbach, R., Gaur, N., Roediger, A., Mayer, T. E., Witte, O. W., Prell, T., et al. (2021). Disease aggressiveness signatures of amyotrophic lateral sclerosis in white matter tracts revealed by the D50 disease progression model. Hum Brain Mapp. doi: 10.1002/hbm.25258
Strong, M. J., Abrahams, S., Goldstein, L. H., Woolley, S., Mclaughlin, P., Snowden, J., et al. (2017). Amyotrophic lateral sclerosis – frontotemporal spectrum disorder (ALS-FTSD): revised diagnostic criteria. Amyotrophic Lateral Scler. Frontotemporal Degener. 18, 153–174. doi: 10.1080/21678421.2016.1267768
Strong, M. J., Grace, G. M., Freedman, M., Lomen-Hoerth, C., Woolley, S., Goldstein, L. H., et al. (2009). Consensus criteria for the diagnosis of frontotemporal cognitive and behavioural syndromes in amyotrophic lateral sclerosis. Amyotroph. Lateral Scler. 10, 131–146. doi: 10.1080/17482960802654364
Sturmey, E., and Malaspina, A. (2022). Blood biomarkers in ALS: challenges, applications and novel frontiers. Acta Neurol. Scand. 146, 375–388. doi: 10.1111/ane.13698
Thompson, A. G., Gray, E., Bampton, A., Raciborska, D., Talbot, K., and Turner, M. R. (2019). CSF chitinase proteins in amyotrophic lateral sclerosis. J. Neurol. Neurosurg. Psychiatry 90, 1215–1220. doi: 10.1136/jnnp-2019-320442
Verber, N., and Shaw, P. J. (2020). Biomarkers in amyotrophic lateral sclerosis: a review of new developments. Curr. Opin. Neurol. 33, 662–668. doi: 10.1097/WCO.0000000000000854
Wiesenfarth, M., Dorst, J., Brenner, D., Elmas, Z., Parlak, Ö., Uzelac, Z., et al. (2024). Effects of tofersen treatment in patients with SOD1-ALS in a “real-world” setting – a 12-month multicenter cohort study from the German early access program. eClinicalMedicine 69:102495. doi: 10.1016/j.eclinm.2024.102495
Witzel, S., Huss, A., Nagel, G., Rosenbohm, A., Rothenbacher, D., Peter, R. S., et al. (2024). Population-based evidence for the use of serum neurofilaments as individual diagnostic and prognostic biomarkers in amyotrophic lateral sclerosis. Ann. Neurol. 96, 1040–1057. doi: 10.1002/ana.27054
Yuan, A., Rao, M. V., Veeranna,, and Nixon, R. A. (2017). Neurofilaments and neurofilament proteins in health and disease. Cold Spring Harb. Perspect. Biol. 9:a018309. doi: 10.1101/cshperspect.a018309
Zecca, C., Dell’Abate, M. T., Pasculli, G., Capozzo, R., Barone, R., Arima, S., et al. (2022). Role of plasma phosphorylated neurofilament heavy chain (pNfH) in amyotrophic lateral sclerosis. J Cellular Molecular Medi 26, 3608–3615. doi: 10.1111/jcmm.17232
Keywords: amyotrophic lateral sclerosis, neurofilament, disease aggressiveness, D50 model, ALS, progression rate, biomarkers
Citation: Meyer J, Gaur N, von der Gablentz J, Friedrich B, Roediger A, Grosskreutz J and Steinbach R (2025) Phosphorylated neurofilament heavy chain (pNfH) concentration in cerebrospinal fluid predicts overall disease aggressiveness (D50) in amyotrophic lateral sclerosis. Front. Neurosci. 19:1536818. doi: 10.3389/fnins.2025.1536818
Edited by:
Thibaut Burg, VIB & KU Leuven Center for Brain & Disease Research, BelgiumReviewed by:
Jessica Mandrioli, University of Modena and Reggio Emilia, ItalyCopyright © 2025 Meyer, Gaur, von der Gablentz, Friedrich, Roediger, Grosskreutz and Steinbach. This is an open-access article distributed under the terms of the Creative Commons Attribution License (CC BY). The use, distribution or reproduction in other forums is permitted, provided the original author(s) and the copyright owner(s) are credited and that the original publication in this journal is cited, in accordance with accepted academic practice. No use, distribution or reproduction is permitted which does not comply with these terms.
*Correspondence: Robert Steinbach, Um9iZXJ0LlN0ZWluYmFjaEBtZWQudW5pLWplbmEuZGU=
Disclaimer: All claims expressed in this article are solely those of the authors and do not necessarily represent those of their affiliated organizations, or those of the publisher, the editors and the reviewers. Any product that may be evaluated in this article or claim that may be made by its manufacturer is not guaranteed or endorsed by the publisher.
Research integrity at Frontiers
Learn more about the work of our research integrity team to safeguard the quality of each article we publish.