 Ying Zhou1,2†Lingyun Liu2†Shan Xu2
 Yongquan Ye3
 Ruiting Zhang2
 Minming Zhang2Jianzhong Sun2*
 Peiyu Huang2*
- 1Taizhou Central Hospital (Taizhou University Hospital), Taizhou, China
- 2The Second Affiliated Hospital, Zhejiang University School of Medicine, Hangzhou, China
- 3United Imaging, Houston, TX, United States
Purpose: To test the feasibility and consistency of a deep-learning (DL) accelerated QSM method for deep brain nuclei evaluation.
Methods: Participants were scanned with both parallel imaging (PI)-QSM and DL-QSM methods. The PI- and DL-QSM scans had identical imaging parameters other than acceleration factors (AF). The DL-QSM employed Poisson disk style under-sampling scheme and a previously developed cascaded CNN based reconstruction model, with acquisition time of 4:35, 3:15, and 2:11 for AF of 3, 4, and 5, respectively. For PI-QSM acquisition, the AF was 2 and the acquisition time was 6:46. The overall image similarity was assessed between PI- and DL-QSM images using the structural similarity index (SSIM) and peak signal-to-noise ratio (PSNR). QSM values from 7 deep brain nuclei were extracted and agreements between images with different Afs were assessed. Finally, the correlations between age and QSM values in the selected deep brain nuclei were evaluated.
Results: 59 participants were recruited. Compared to PI-QSM images, the mean SSIM of DL images were 0.87, 0.86, and 0.85 for AF of 3, 4, and 5. The mean PSNR were 44.56, 44.53, and 44.23. Susceptibility values from DL-QSM were highly consistent with routine PI-QSM images, with differences of less than 5% at the group level. Furthermore, the associations between age and QSM values could be consistently revealed.
Conclusion: DL-QSM could be used for measuring susceptibility values of deep brain nucleus. An AF up to 5 did not significantly impact the correlation between age and susceptibility in deep brain nuclei.
1 Introduction
Various substances in the human body, such as iron calcium, and lipids, can alter magnetic susceptibility (Deistung et al., 2017). Abnormal changes in their content are often associated with the progression of specific diseases. In recent years, Quantitative susceptibility mapping (QSM) has been widely applied in clinical disease research, including neurodegenerative diseases (Shahmaei et al., 2019; Guan et al., 2017), vascular diseases (Probst et al., 2021; Hong et al., 2023), neuroinflammation (Chen et al., 2014), and traumatic brain injury (Chary et al., 2021). For example, in Parkinson’s disease, QSM values in the substantia nigra can be used to differentiate between patients and controls (Shahmaei et al., 2019; Guan et al., 2017), and QSM images can assist in the preoperative localization of deep brain nuclei (Cong et al., 2020). In Alzheimer’s disease, QSM can reflect pathological iron deposition associated with amyloid protein (Gong et al., 2019).
In conventional and clinical research applications, susceptibility-weighted imaging mainly uses three-dimensional GRE sequences. To achieve a strong susceptibility effect, a relatively long echo time is required to establish phase contrast (usually >30 ms for a 3 T MRI scanner) in QSM imaging, and multiple echoes are typically acquired to compute susceptibility (Shahmaei et al., 2019; Guan et al., 2017; QSM Consensus Organization Committee et al., 2024). For visualizing fine anatomical structures (such as small venules and cortical structures) and small lesions (such as microbleeds) (Rotta et al., 2021), a high spatial resolution is also required (Shen et al., 2020). A recent consensus paper suggests using isotropic acquisition protocols to avoid partial volume effect (QSM Consensus Organization Committee et al., 2024). The combination of these various demands can significantly extend acquisition times, thereby reducing patient compliance.
In recent years, deep learning (DL) methods have gained widespread attention and application in the field of magnetic resonance imaging (MRI), being utilized in various directions such as accelerating image acquisition, reducing gadolinium dose (Gong et al., 2018), and improving image resolution (Avanzo et al., 2020; Johnson et al., 2023; Almansour et al., 2023). In terms of accelerating MRI acquisition, DL methods are primarily used to recover k-space information from undersampled k-space data or to directly reconstruct images (Han et al., 2020; Wang et al., 2021). They can also enhance image quality based on low-quality images reconstructed from undersampled data (Bash et al., 2021). Previously, Gao (Gao et al., 2021) et al. trained a Deep Complex Residual Network (DCRNet) using 7 T MRI data. They tested the model on several retrospectively under-sampled datasets and one prospectively under-sampled dataset, demonstrating substantially reduced artifacts and blurring compared to two iterative methods and one deep learning method. Similarly, Zhang (Zhang et al., 2023) et al. developed a framework, Learned Acquisition and Reconstruction Optimization (LARO), designed to accelerate multi-echo GRE pulse sequences for QSM. The authors optimized the k-space sampling pattern and employed a recurrent temporal feature fusion model to capture signal redundancies along echo times. Their methods were tested on prospectively under-sampled k-space datasets from 10 healthy subjects, achieving an acceleration factor of 8 while maintaining QSM quality. While these studies demonstrated the feasibility of applying DL methods to QSM acquisition, they primarily focused on methodology development. The generalizability and stability of DL-based QSM remain untested in larger sample sizes.
In this study, we aimed to test whether a DL-based reconstruction method could be used for accelerating QSM acquisition without significant impact on the measurement of susceptibility in deep brain nuclei. Specifically, we investigated the overall image similarity between PI and DL-QSM images using the structural similarity (SSIM) and peak signal-to-noise ratio (PSNR) indices. We tested the correlation and differences between different sets of QSM images. At last, we investigated whether the acceleration would affect the correlation analyses between age and nuclei QSM values.
2 Methods
2.1 Participants
The research protocol has been approved by the ethics committee of the Second Affiliated Hospital, Zhejiang University School of Medicine. We recruited healthy participants from nearby communities through online advertising. The inclusion criteria were (1) between age 18 ~ 70; (2) without history of neuropsychiatric diseases or severe systematic diseases that could affect the brain; and (3) passing the routine MR safety screening. The exclusion criteria were (1) unable to hold still in the scanner; (2) accidental findings of brain occupying lesions. All participants signed informed consent before enrollment. A total of 60 participants were enrolled, but one participant was excluded due to head motion and data corruption. For all participants, demographic and clinical information were recorded.
2.2 DL-based acceleration method
The DL-QSM method uses a cascaded CNN model, namely ReconNet3D (Ye et al., 2023), to perform k-space to image reconstruction with single-channel input and single-channel output capacity, i.e., data from each channel were independently reconstructed (Ye et al., 2023). The model has five 3D convolutional blocks and data consistency layers, and each convolutional block contains five convolutional layers. It was trained on 42 multi-flip-angle and multi-echo GRE brain scans (a total of 662 volumes of 3D data), acquired with fully sampled scans. The ground truth data were then retrospectively under-sampled using 3X and 5X Poisson-disk schemes (Akasaka et al., 2016) in both the phase-encoding and slice directions. These under-sampled data were used as inputs for model training. Additionally, another 5 multi-echo GRE brain scans (75 volumes of 3D echo data) were used for testing. For 3X and 5X under-sampled data, the testing results showed good agreement with the ground truth. The trained model was then tested with scans from both phantoms and human volunteers and demonstrated good reconstruction accuracy (Ye et al., 2023).
2.3 Imaging acquisition
MRI examinations were performed on a 3 T scanner (uMR790, United Imaging Healthcare, Shanghai, China) with a 32-channel head coil. QSM images were acquired using a traditional 3D multi-gradient-echo sequence equipped with both parallel imaging (PI) and DL method supporting 4 ~ 6 fold acceleration. The parameters were: TR = 30.2 ms, first TE = 3.3 ms, last TE = 25.0 ms, number of echoes = 8, echo spacing = 3.1 ms, flip angle = 15°, voxel size = 0.8 mm * 0.8 mm * 2 mm, covering the whole brain. All parameters were identical for both QSM scans except for acceleration factors. For the DL-QSM acquisition, the k-space was prospectively under-sampled using the Poisson disk scheme (Akasaka et al., 2016). The scan time of PI image was 6:46 with AF of 2, while the scan time of the DL-QSM scan was 4:35, 3:15, and 2:11 with AF of 3, 4, and 5, respectively. A 3D T1-weighted image was also acquired from each participant for registration and segmentation purposes. The parameters were: TR = 6.9 ms, TE = 2.9 ms, flip angle = 9°, TI = 1,000 ms, field of view (FOV) = 256 × 240 mm2, voxel size = 1 × 1 × 1 mm3, 208 sagittal slices.
2.4 Image processing
QSM reconstruction was performed by the built-in QSM reconstruction pipeline on the scanner (QSM Consensus Organization Committee et al., 2024; Ye et al., 2019). Specifically, the preliminary extraction of the field map employed the recently proposed Multi-Dimensional Integration (MDI) algorithm (Ye et al., 2022), which utilizes the signal channel dimensions of array coils to remove various unknown unrelated phases (such as the inherent phase of coil sensitivity) while obtaining the original field map containing magnetic susceptibility phase and background field phase. After obtaining the original field map, it underwent an exact phase unwrapping using the SPUN algorithm (Ye et al., 2019) based on region-growing with prioritized seed point screening, and then low-frequency background field components were removed using the vSHARP method (Wu et al., 2012), thereby obtaining a relative dipole field (RDF). Finally, an iterative L1-Norm based optimization calculation procedure was performed on the RDF field map to generate the QSM map. Dynamic Bayesian terms were incorporated during the optimization process to reduce artifacts and improve calculation accuracy and efficiency (Ye et al., 2019; Bilgic et al., 2014). To avoid motion-induced displacement of the head, all DL images were first co-registered to the PI images, using the FLIRT tool in the FMRIB Software Library (FSL, 6.0.11).
2.5 Image similarity assessment
To quantitatively assess the similarity between the PI and DL images, we calculated structural similarity index (SSIM) and peak signal-to-noise ratio (PSNR) using Matlab (R2019a). Both indices have been widely used to assess image reconstruction qualities in medical imaging (Knoll et al., 2020). SSIM measures nonlocal structural similarity, which considers luminance, contrast, and structure. SSIM ranges from 0 to 1, with a large value representing better consistency. The PSNR measures voxel-wise differences between the images. Typically, a PSNR higher than 40 dB suggests excellent image quality.
2.6 Extraction of susceptibility values
We used SEPIA,2 a versatile tool for QSM image processing (Chan and Marques, 2021), to extract susceptibility values from deep brain nuclei. Specifically, a brain structural atlas (Pauli et al., 2018) was registered to each participant’s magnitude image using ANTs registration.3 Both linear and non-linear registrations were used to achieve accurate alignment. Registration accuracy was visually checked. Then the registered atlas was used to extract QSM values from seven large and important deep brain structures (Figure 1, Putamen, Pu; Caudate, Ca; external globus pallidus, GPe; internal globus pallidus, GPi; Red nucleus, RN; substantia nigra pars compacta, SNc; nigra pars reticulata, SNr).
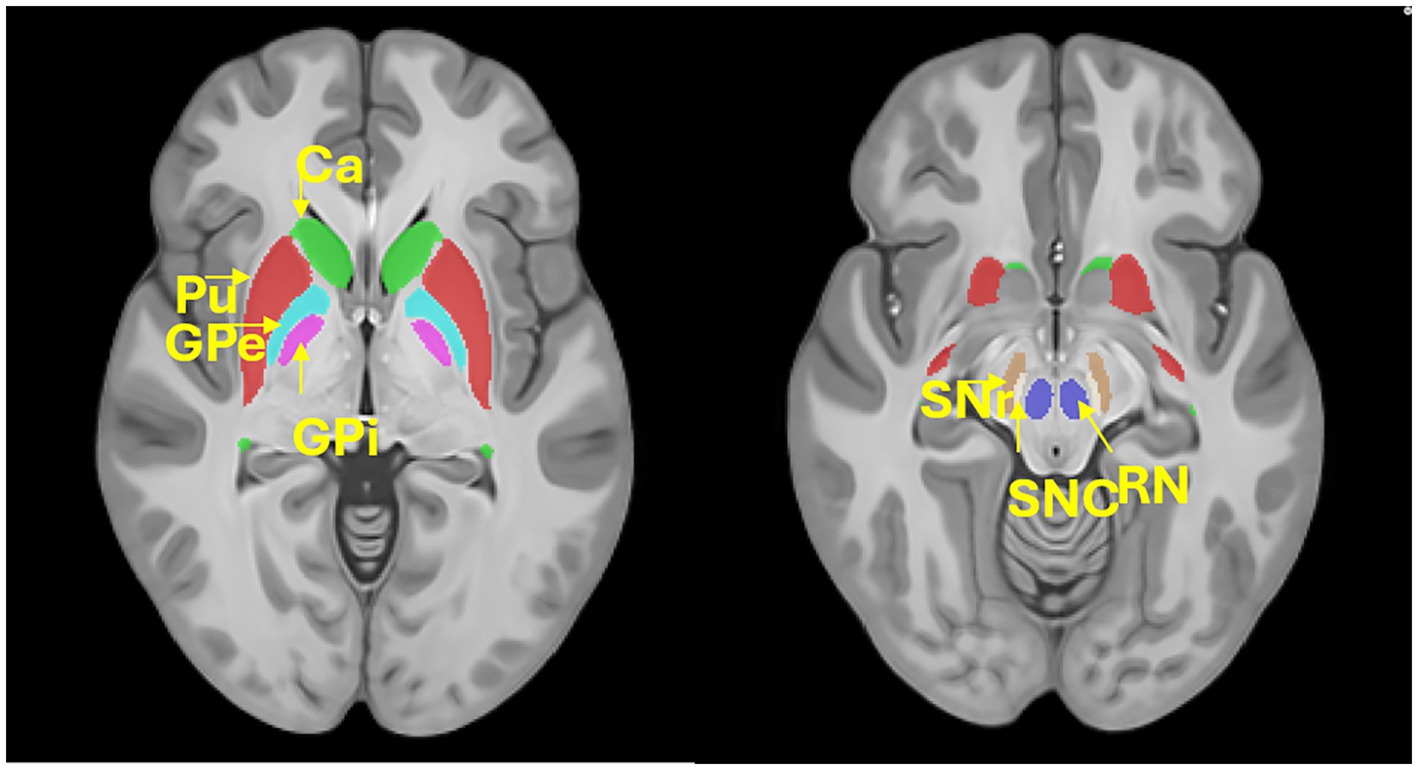
Figure 1. Location of the deep brain structures. Putamen, Pu; Caudate, Ca; external globus pallidus, GPe; internal globus pallidus, GPi; Red nucleus, RN; substantia nigra pars compacta, SNc; nigra pars reticulata, SNr.
2.7 Statistical analyses
We first examined the correlation between QSM values derived from different sets of images using Pearson’s correlation. Then we compared the difference between PI- and DL-QSM images using paired t-tests. The Bland–Altman plot was used to show difference between each pair of PI-DL values. Finally, we tested the association between age and susceptibility values in each deep brain nucleus to investigate whether acquisition acceleration might affect the results.
3 Results
A total of 59 participants were enrolled in this study (Table 1, mean age: 44.0 y/o; range: 18–75 y/o; male/female: 22/37). Using PI-QSM images as reference, the mean SSIM of DL-QSM images were 0.87 (min-max: 0.82–0.89), 0.86 (0.77–0.89), and 0.85 (0.81–0.89) for acceleration factors of 3, 4, and 5, and respective mean PSNR were 44.56 (37.31–52.12), 44.53 (37.42–53.10), and 44.23 (37.35–52.91).
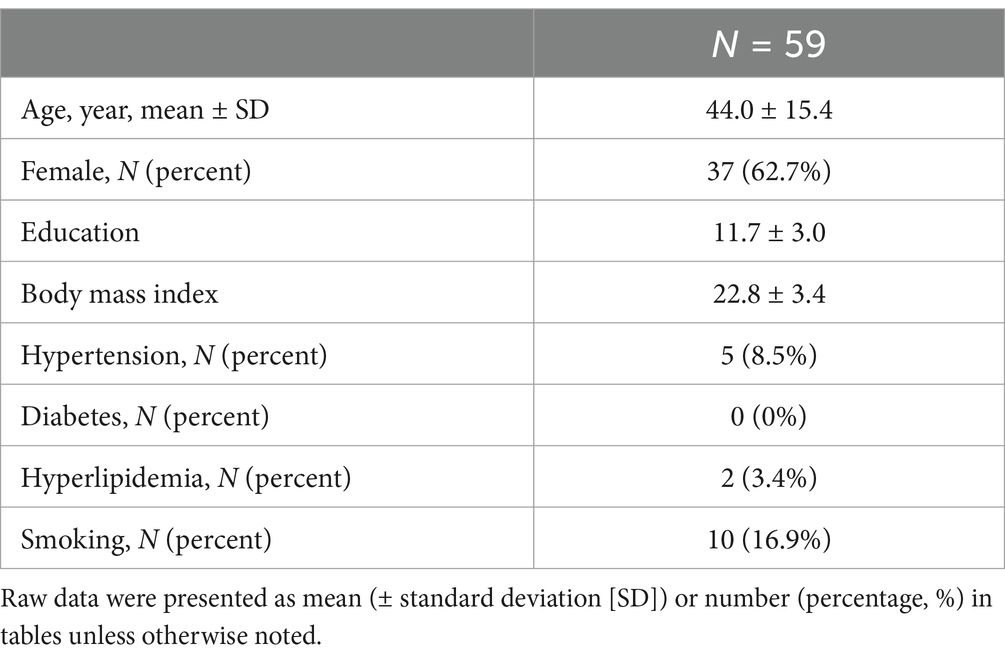
Table 1. Demographic information.
As shown in Figure 2, under different acceleration factors, DL-QSM exhibits a similar overall appearance compared to PI images. Figure 3 shows imaging details in the basal ganglia and brainstem regions. In general, the shape and local patterns of deep brain nuclei were mostly preserved, with a tendency toward smoother images under higher acceleration conditions.
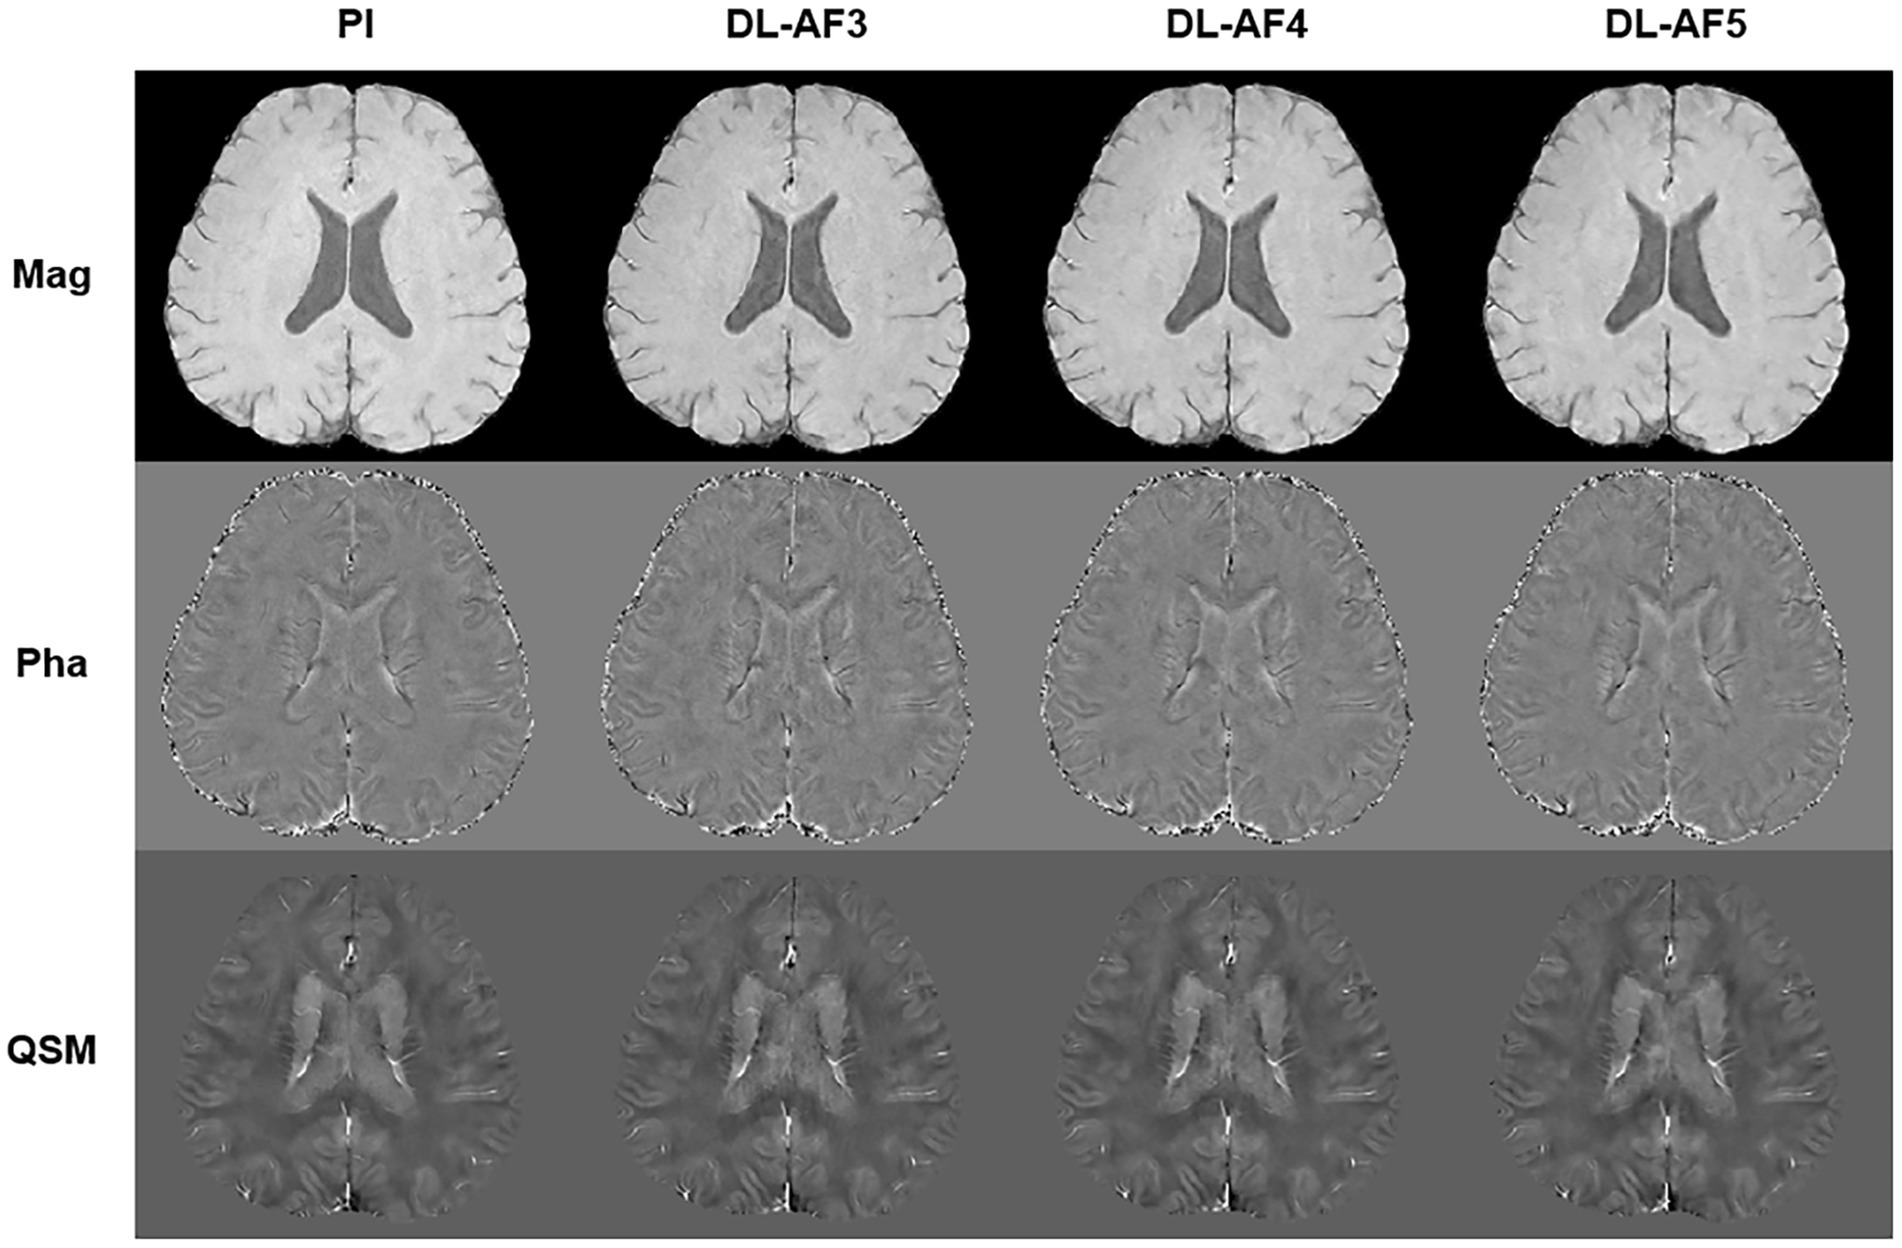
Figure 2. Demonstration of PI and DL images. AF, Acceleration factor; Mag, magnitude image; Pha, phase image; QSM, quantitative susceptibility mapping.
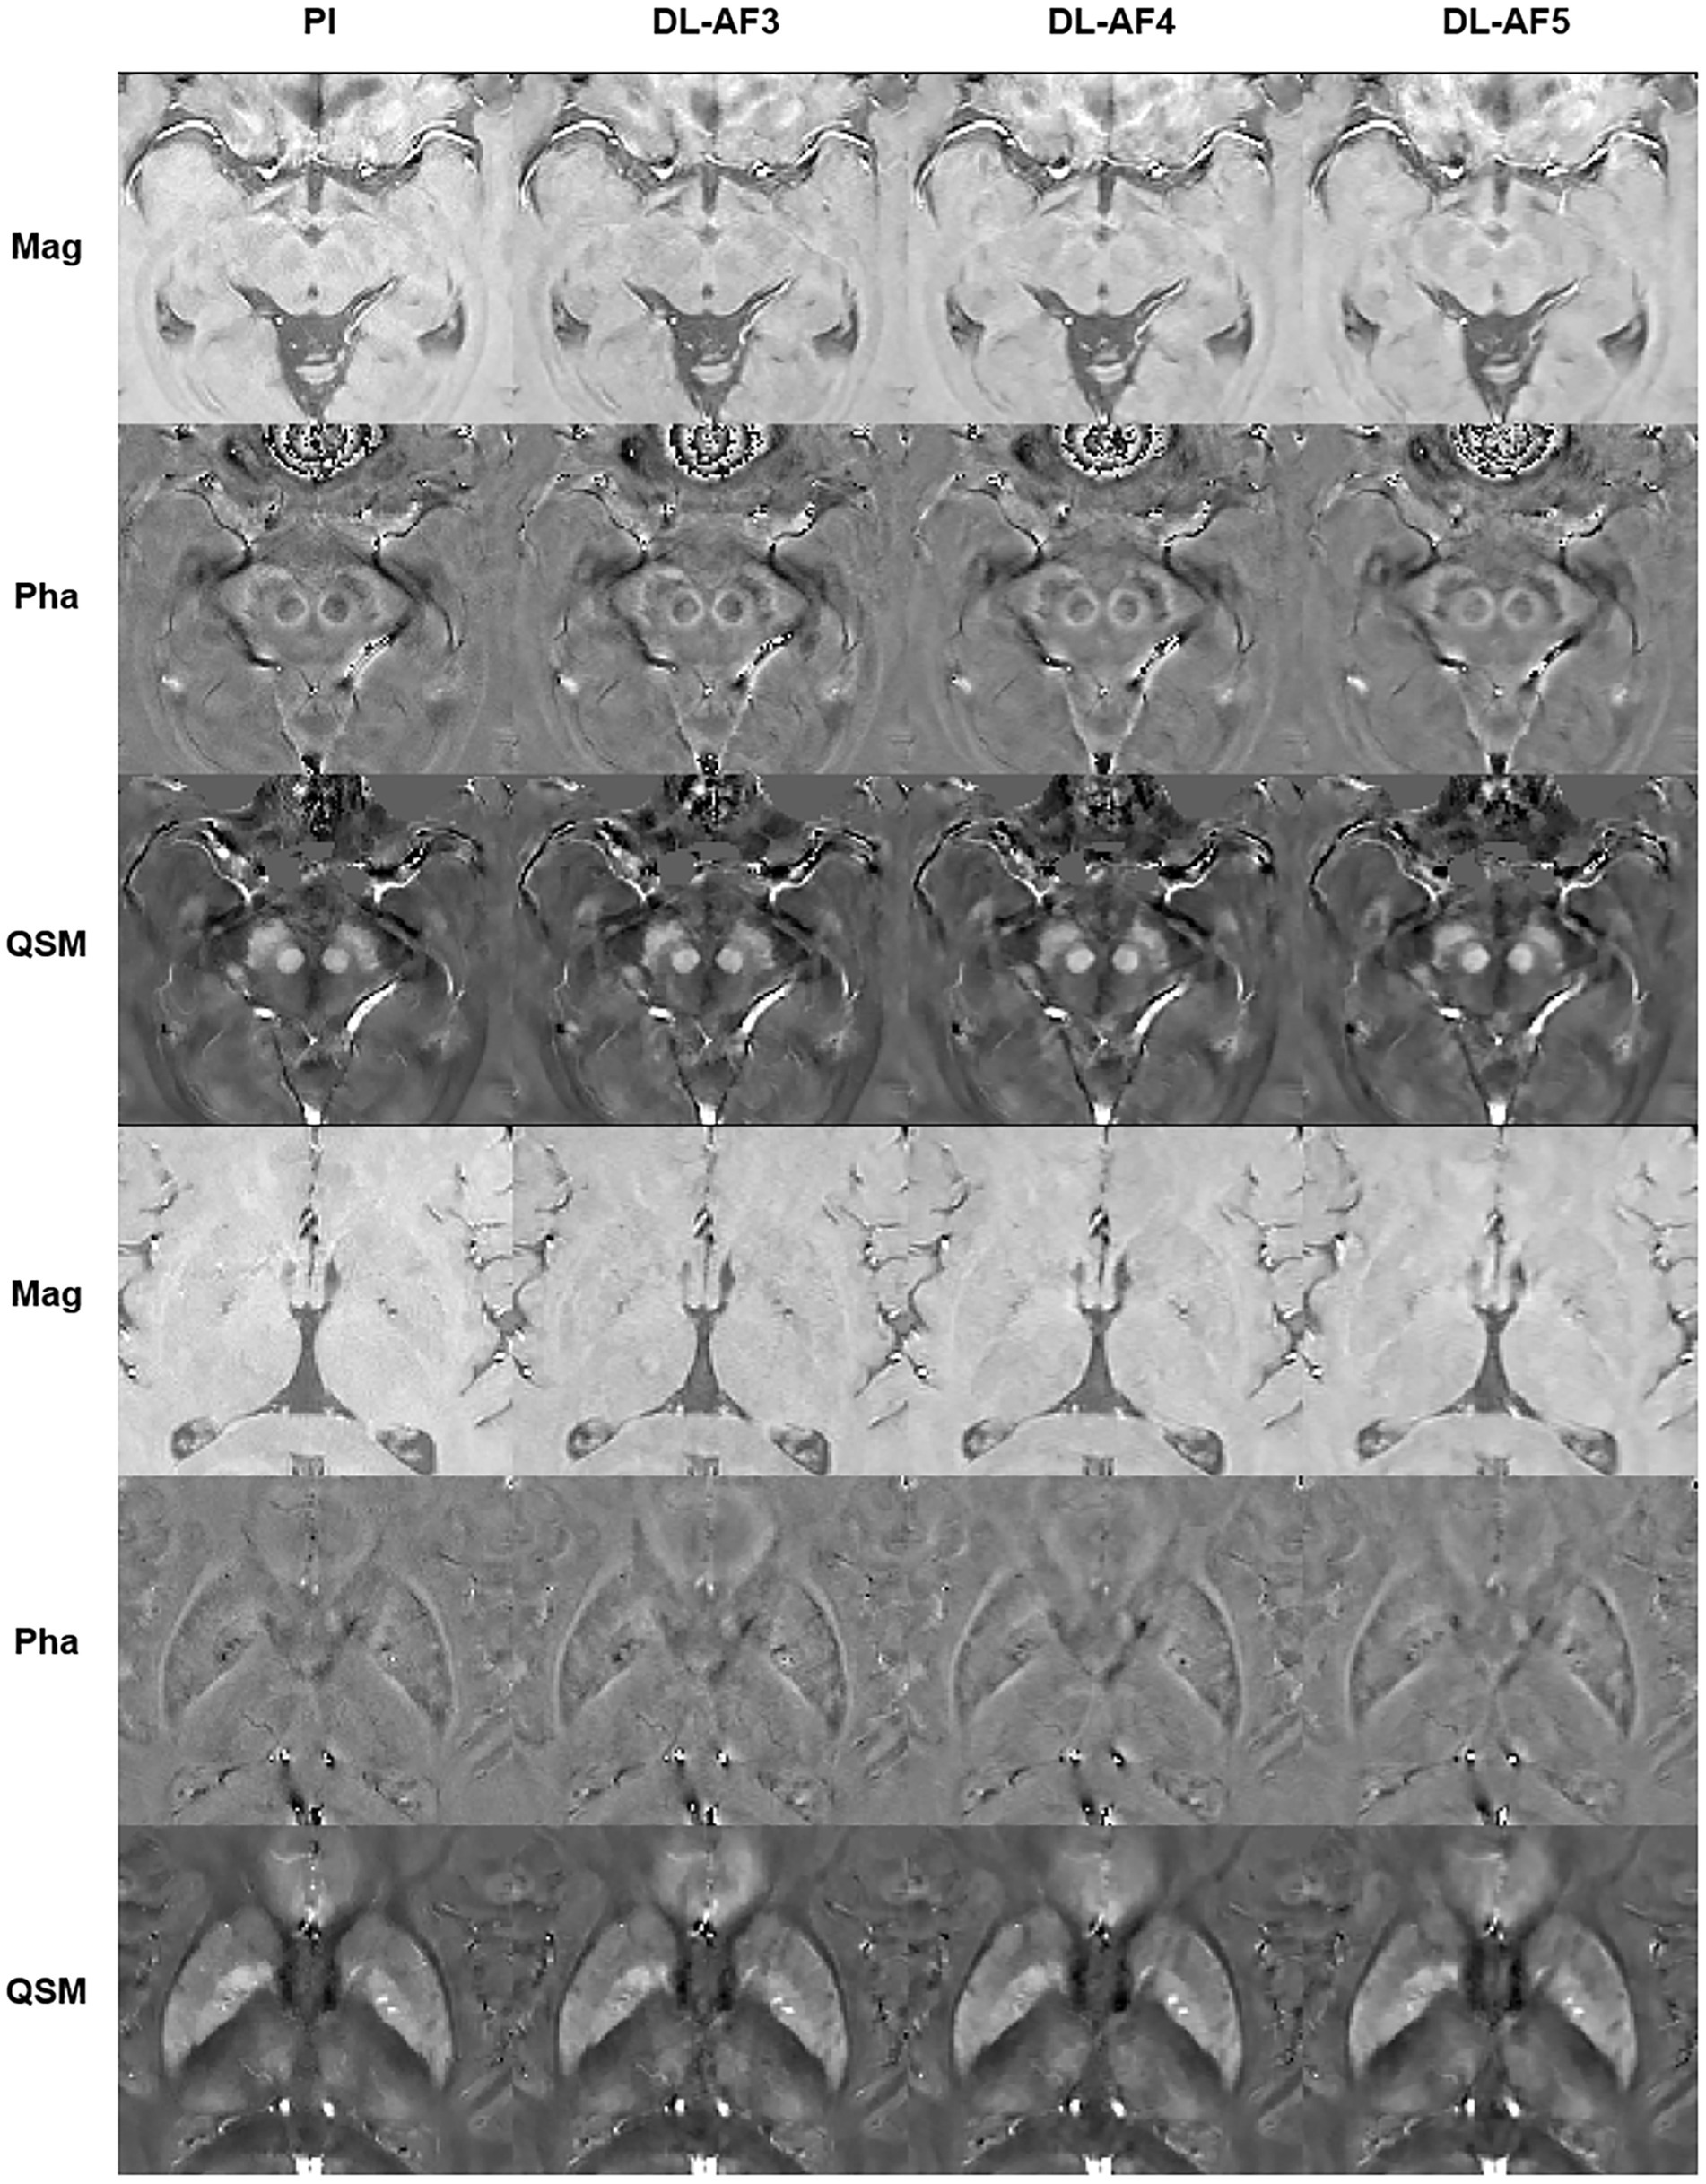
Figure 3. Demonstration of the imaging details in PI and DL images. AF, Acceleration factor; Mag, magnitude image; Pha, phase image; QSM, quantitative susceptibility mapping.
As shown in Table 2, the susceptibility values of the seven deep brain structures in each DL-QSM group have a very high correlation with the PI-QSM group (r > 0.95, p < 0.001). In the PI-QSM and DL-QSM-AF3 groups, the GPe showed the highest correlation (r = 0.994, p < 0.001), while the RN showed the lowest correlation (r = 0.963, p < 0.001). In the PI-QSM and DL-QSM-AF4 groups, the GPe also showed the highest correlation (r = 0.993, p < 0.001), while the SNr showed the lowest correlation (r = 0.950, p < 0.001). In the PI-QSM and DL-QSM-AF5 groups, the GPe again showed the highest correlation (r = 0.993, p < 0.001), while the Ca showed the lowest correlation (r = 0.950, p < 0.001). Overall, among the PI-QSM group and all DL-QSM groups, the GPe showed the highest susceptibility value correlation.
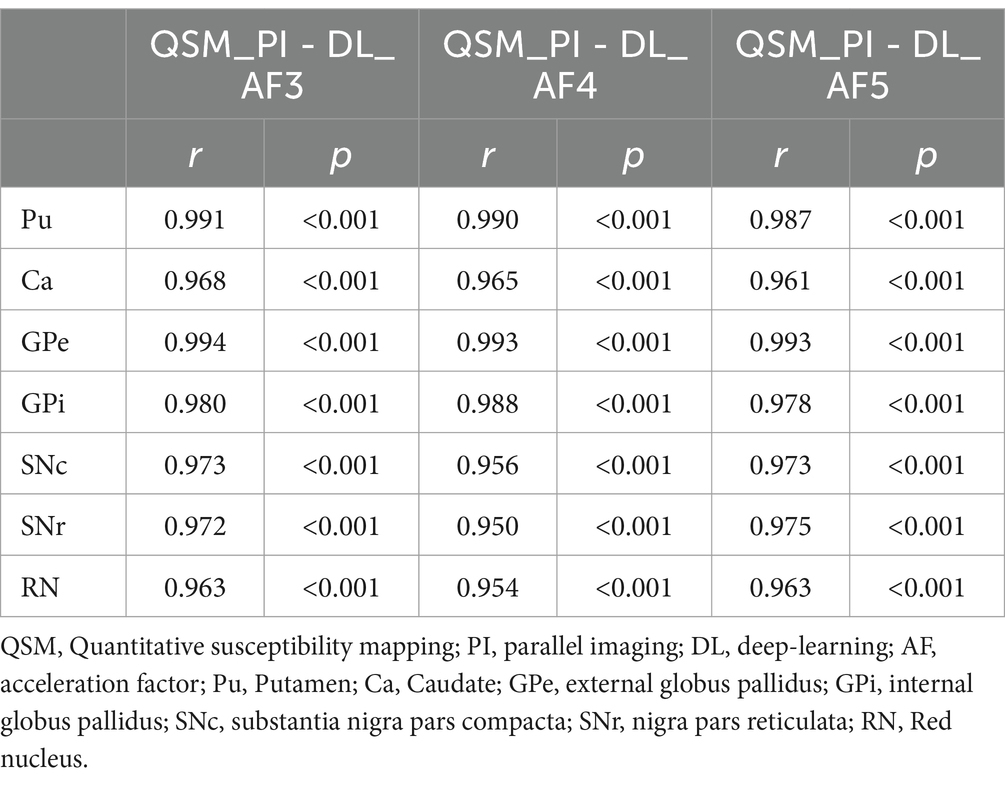
Table 2. Associations between susceptibility values derived from PI and DL images.
On the group level (Table 3), the region with the greatest susceptibility difference between the PI-QSM and DL-QSM-AF3 images is the SNr, with a mean difference of 4.19%; followed by the Ca, with a mean difference of 3.31%. The greatest difference between PI-QSM and DL-QSM-AF4 is in the Ca, at 2.98%; while the greatest difference between PI-QSM and DL-QSM-AF5 is in the Pu, at 3.15%. There was no systematic bias between the values from different image groups.

Table 3. Pair-wise comparison between PI and DL images.
As shown on the Bland–Altman plot (Figure 4), the differences between PI and DL-QSM images distributed evenly across different susceptibility levels. For putamen and caudate, differences between the PI and DL images were mostly less than 5 ppb. For other nuclei, the difference was higher, reaching over 10 ppb. When looking into the source of these discrepancies, we noticed the influence of smoothness on local patterns in the QSM images (Figure 5). In some cases, mild head motion and imaging artifacts might also contribute to the differences (Table 4).
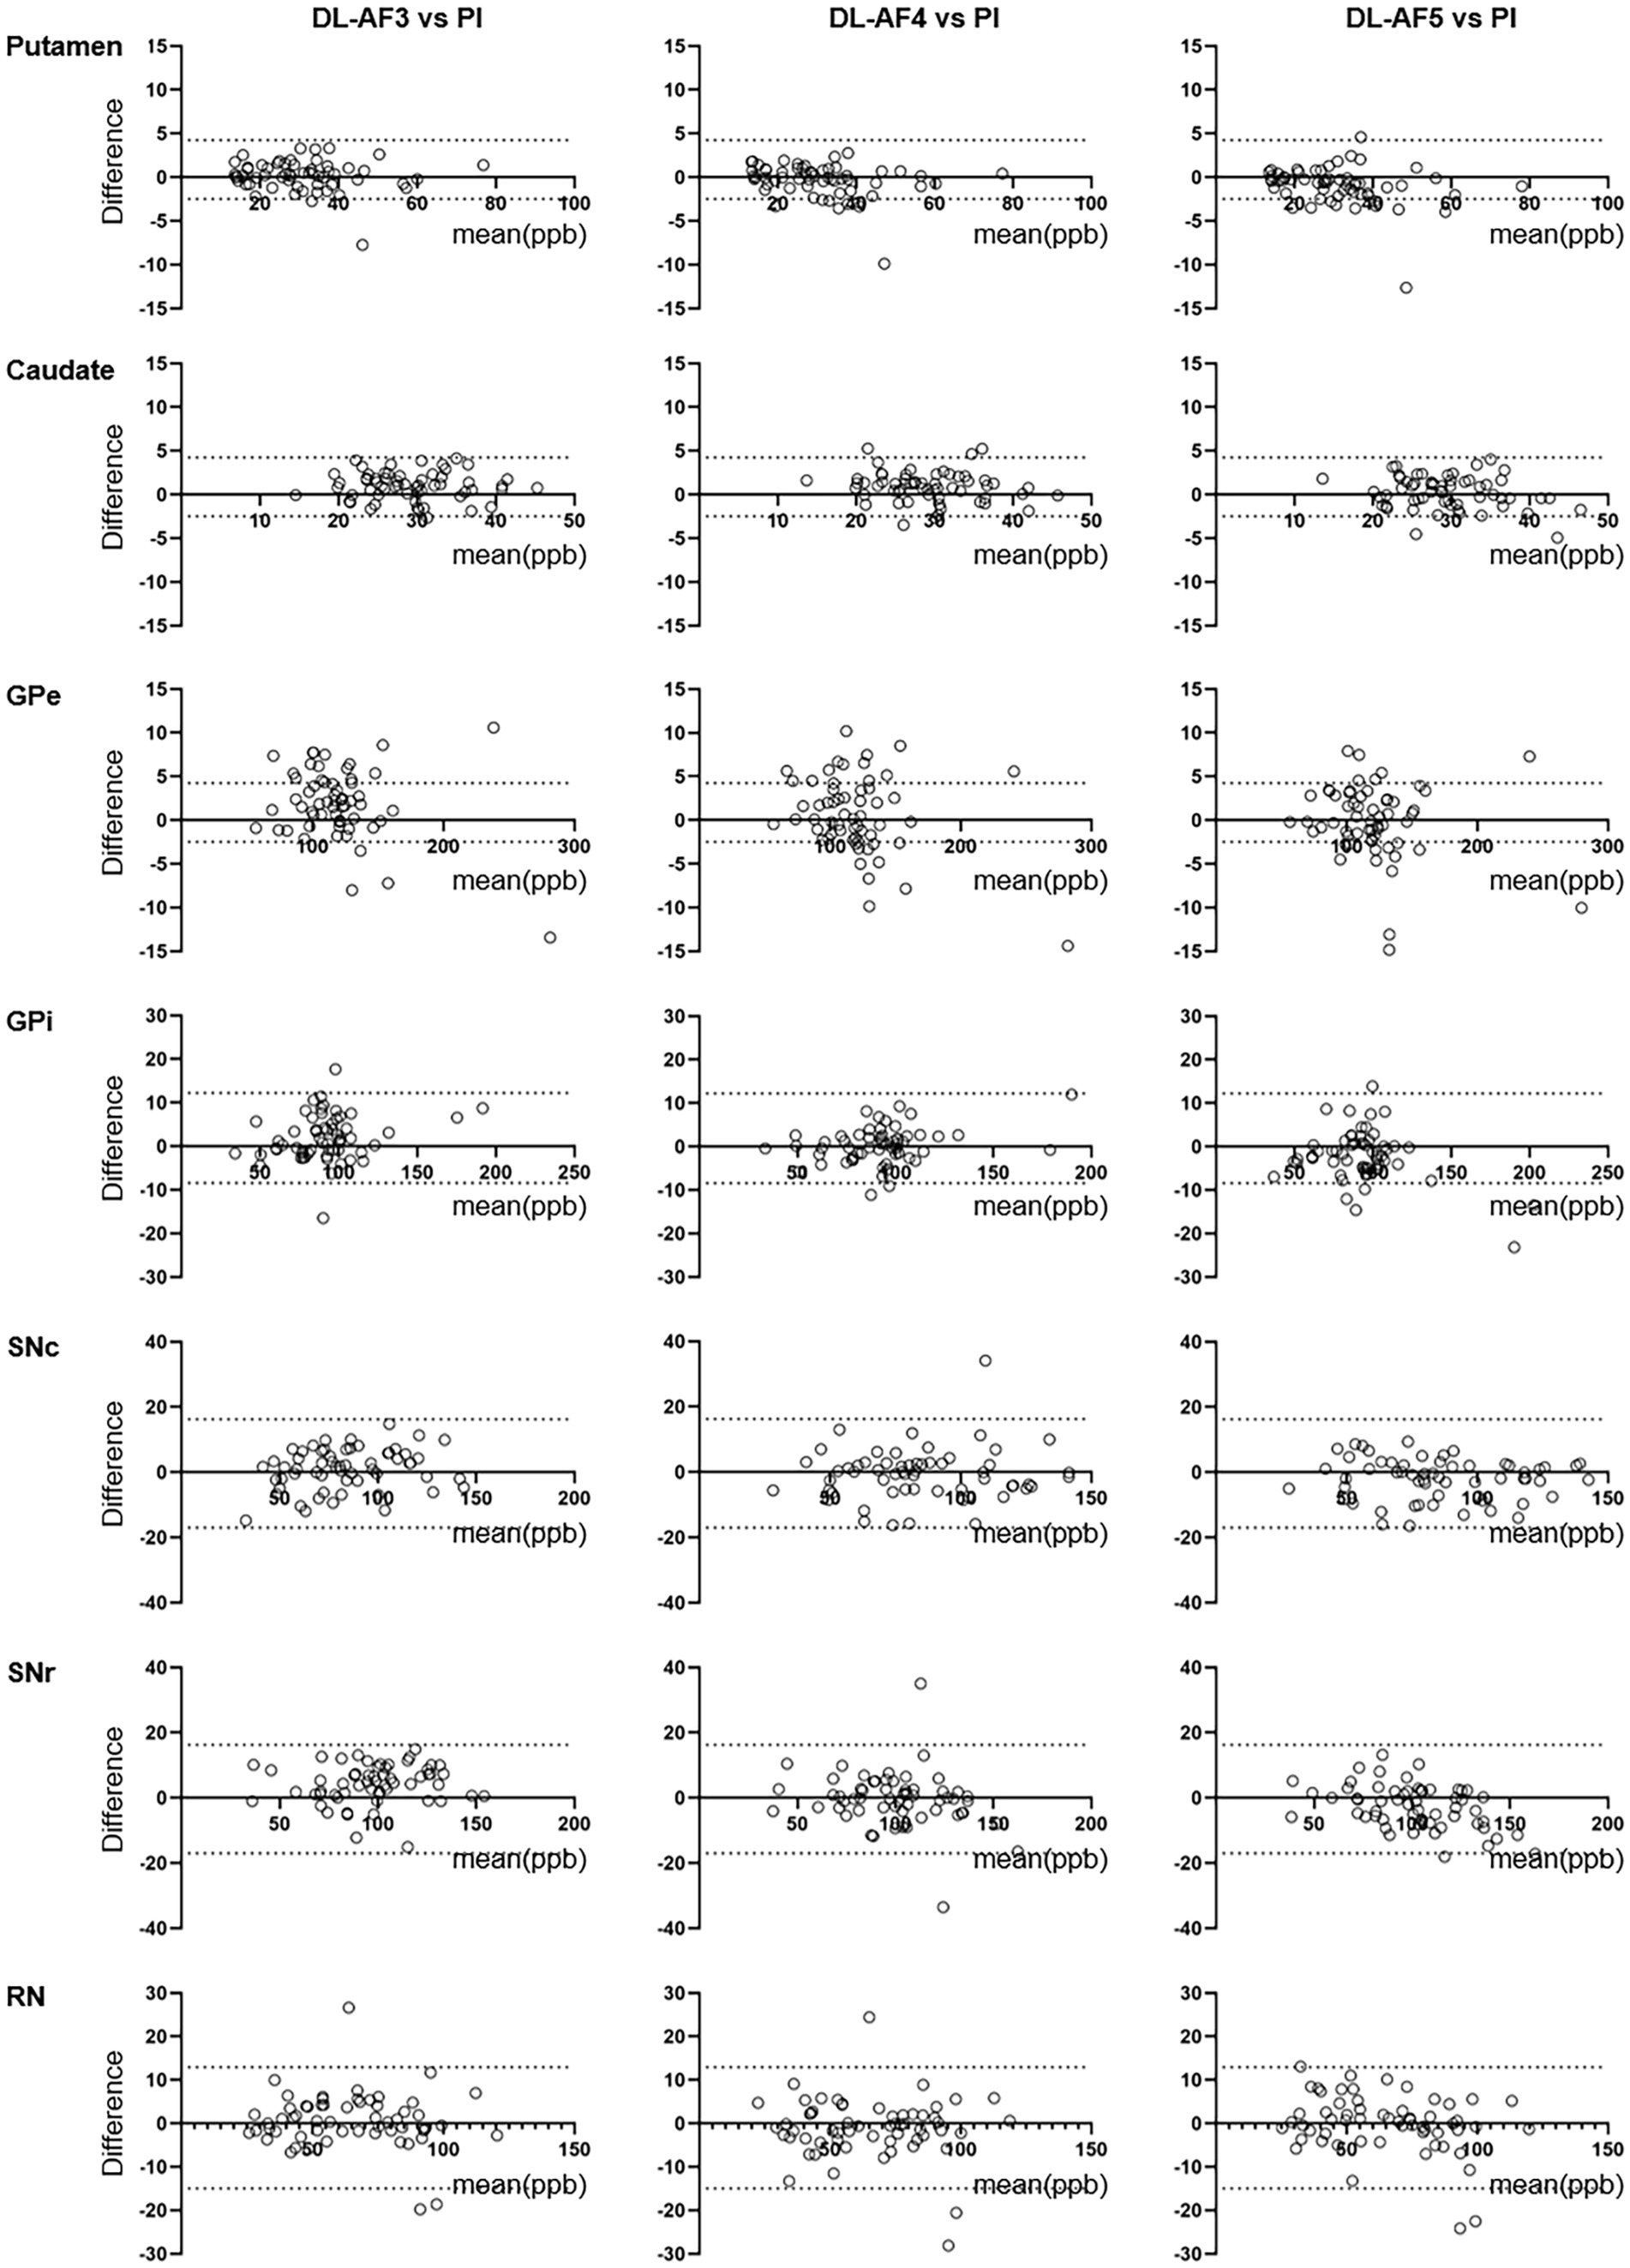
Figure 4. Bland–Altman plots showing consistency between QSM values extract from PI and DL images. The consistency was higher for larger nuclei (e.g., putamen, caudate) compared to smaller nuclei (e.g., GPi, SNc). GPe, external globus pallidus; GPi, internal globus pallidus; RN, Red nucleus; SNc, substantia nigra pars compacta; SNr, substantia nigra pars reticulata.
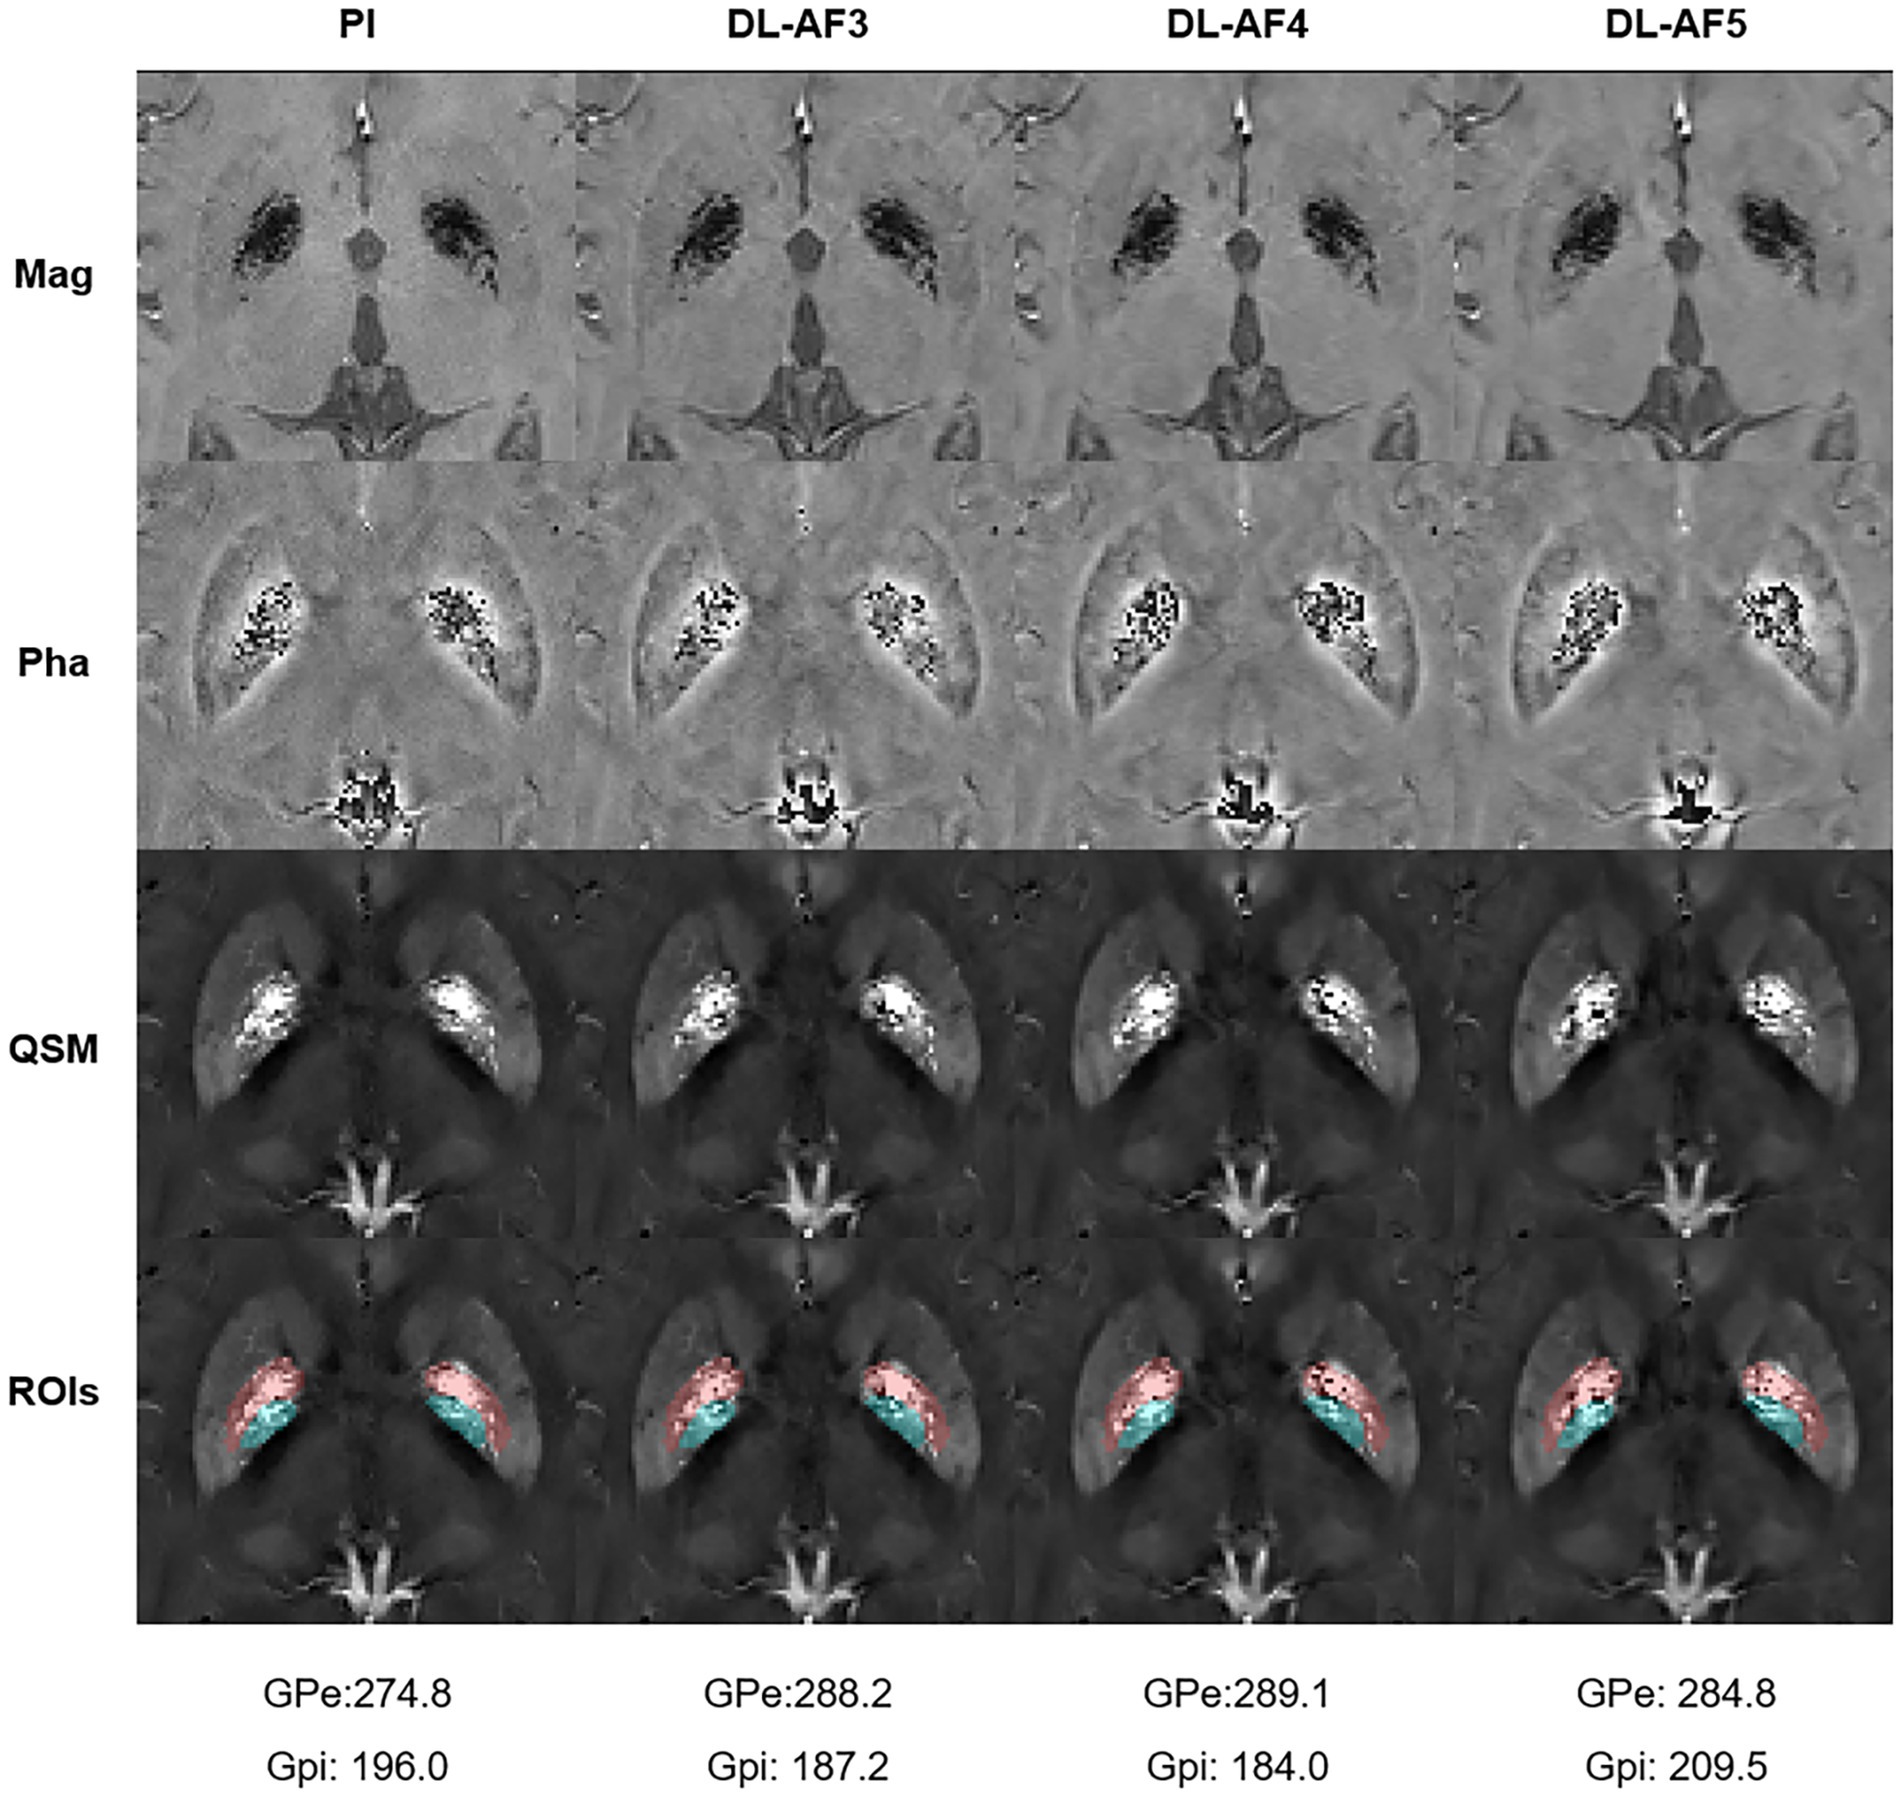
Figure 5. One participant showing relatively large differences in GPi and GPe between PI and DL images. Please notice the subtle differences within these regions (Pink: GPe; Cyan: GPi). ROIs, Regions of interest.
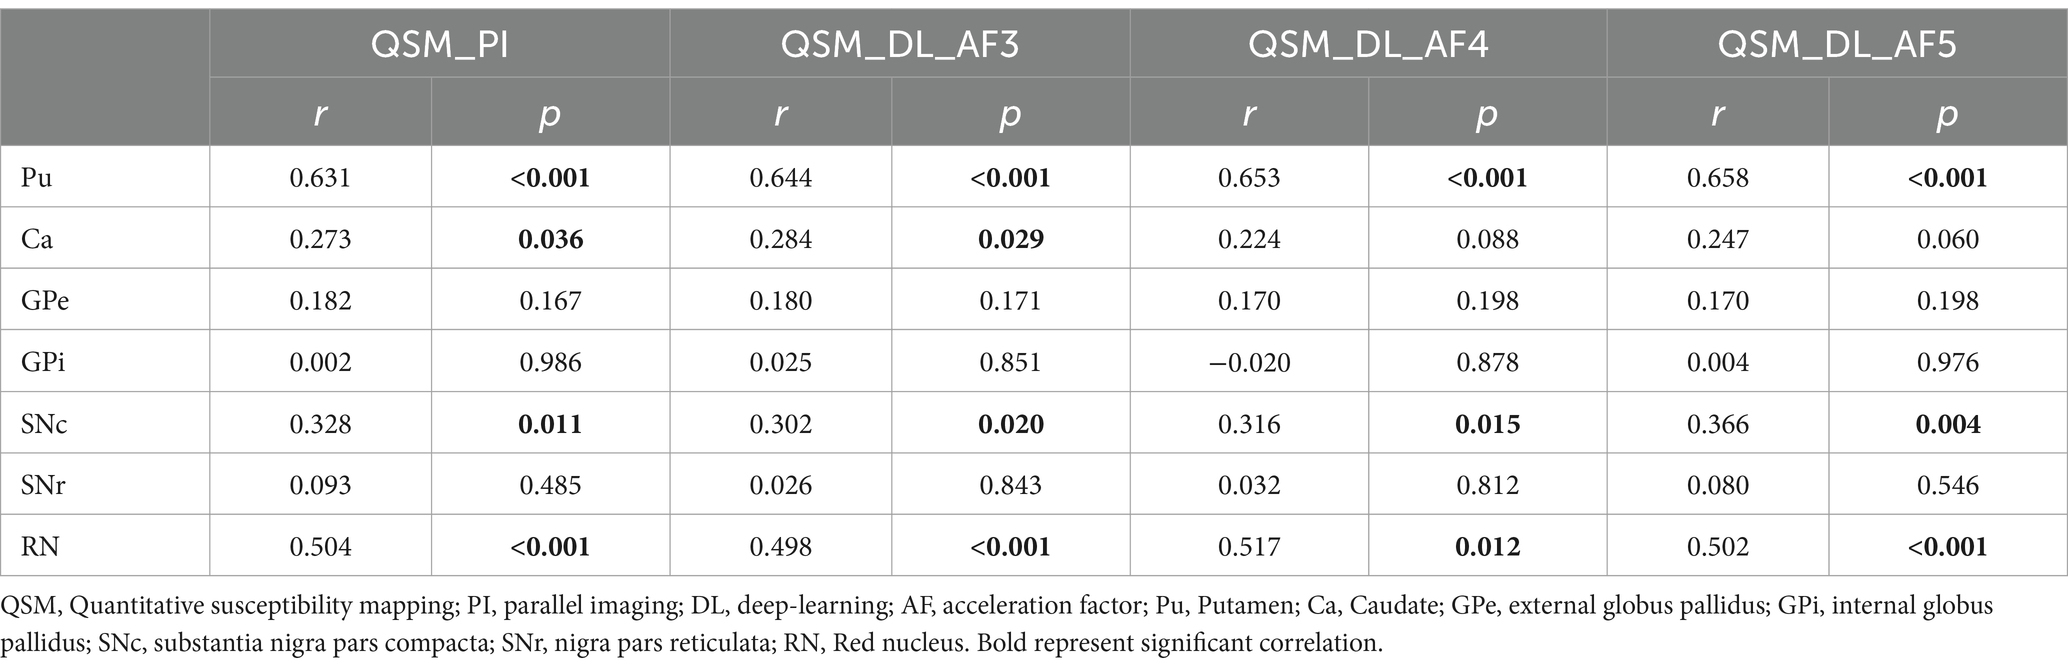
Table 4. Correlation between susceptibility values and age in different sets of images.
In the PI-QSM images, the susceptibility values of the Pu, Ca, SNc, and RN are positively correlated with age and have statistical significance, with the Pu showing the strongest correlation with age (r = 0.631, p < 0.001). In the other three DL-QSM image groups, the susceptibility values of the Pu, SNc, and RN also show significant positive correlations with age, with the Pu showing the strongest correlation with age (AF-3: r = 0.644, p < 0.001; AF-4: r = 0.653, p < 0.001; AF-5: r = 0.658, p < 0.001). The Ca shows a significant correlation with age in the DL-QSM-AF3 images (r = 0.284, p = 0.029) and a marginally significant positive correlation with age in the DL-QSM-AF4 (r = 0.224, p = 0.088) and DL-QSM-AF5 images (r = 0.247, p = 0.060).
4 Discussion
This study showed that DL-QSM images with acceleration factors of 3, 4, and 5 had good similarity to PI-QSM images, with high correlation in the measured susceptibility values of nuclei (r > 0.95). When the acceleration factor was 5, the required scanning time was only one-third of the PI-QSM acquisition time, greatly improving scanning efficiency. Although there were differences in some nuclei between different QSM images, these differences were usually less than 5% on the group level. Such small variations do not significantly affect the correlation analyses between age and QSM values.
Under the condition of 5-fold acceleration, we did not observe significant differences in the overall image appearance and nuclei structures. It should be noted that as the k-space signal sampling decreased, the images appeared slightly smoother, which might lead to slight confusion of signals in adjacent nuclei or white matter areas. The smoothing might have affected the voxel values at the nuclei boundaries and causing fluctuations in the susceptibility values of some nuclei regions. However, the differences in susceptibility values of these nuclei are general small on the group level.
On the individual level, larger differences might occur in some participants. Such variations could be due to more complex reasons besides the abovementioned smoothing effect. Head motion between scans could change the angle between the acquisition plane and the main magnetic field direction, which might alter the susceptibility effect of the dipoles. Small head motion during each QSM acquisition could cause artifacts and affect QSM estimation. There might be other factors such as magnetic field shimming, temperature changes, and various imaging artifacts. One study scanned phantoms containing five different concentrations of gadolinium solutions using 12 clinical and 3 preclinical scanners (Deh et al., 2019). At the level of 0.26 ppm, the standard deviation of the measurements was 32 ppb. In a replication study that scanned 14 participant four times using an identical scanner and the same protocol, the standard deviation of QSM values in deep brain nuclei across different imaging sessions can reach 19 ppb (Santin et al., 2017). In our study, differences between PI and DL images were at a comparable level (mostly less than 20 ppb), suggesting the influence of undersampling and DL reconstruction could be tolerated.
The basal ganglia and brainstem nuclei are key regions of the brain responsible for processing motor control, emotions, cognition, and various other functions (Groenewegen, 2003; Seger, 2006). Due to metabolic changes, vascular damages, and other factors, significant iron deposition can occur in these nuclei during brain aging (Ashraf et al., 2018). Some researchers have used QSM to study normal populations, showing that the susceptibility values of multiple nuclei in normal people tend to gradually increase with age (Acosta-Cabronero et al., 2016; Li et al., 2023). Consistent with previous results (Acosta-Cabronero et al., 2016), our study also confirmed that the Pu region shows the most significant increase in susceptibility, followed by the RN, SNc, and Ca regions. Furthermore, the correlations between age and DL-QSM values were similar to those with PI-QSM values, suggesting that the acceleration did not induce unexpected impacts to the analyses.
Although the current study preliminarily demonstrates the potential of DL-QSM sequences in magnetic resonance imaging, the robustness and general applicability of the conclusions need to be validated in larger-scale cohort studies due to the limited sample size. Particularly, expanding the sample size for different groups of patients with neurological disorders will help comprehensively evaluate the stability and diagnostic accuracy of DL-QSM sequences under various pathological conditions. Secondly, under the current experimental conditions, using an MR scanner equipped with an NVIDIA GeForce RTX 2080 Ti graphics card, image reconstruction takes several minutes to generate QSM images. Upgrading to newer, more powerful graphics cards could significantly improve image processing speed. Thirdly, while using fully sampled data as a reference is ideal, the long acquisition time may result in a high failure rate in clinical settings. Therefore, we used parallel imaging data as the reference. Since the model performance has already been assessed, and our primary goal was to evaluate the practicality of this method, comparing the image quality of DL-QSM with clinically established methods is considered acceptable. Furthermore, three-dimensional high-resolution QSM images have important value in preoperative nuclei localization, our future research will further investigate these related topics.
In summary, DL-QSM could be used for measuring susceptibility values of deep brain nuclei. An AF up to 5 did not significantly impact the accuracy of QSM results, nor the correlation between age and susceptibility in deep brain nuclei.
Data availability statement
The datasets presented in this article are not readily available because the data currently being applied has not been obtained from publicly available databases. If you wish to use this data, it must be reviewed by our committee. Requests to access the datasets should be directed to aHVhbmdweUB6anUuZWR1LmNu.
Ethics statement
The studies involving humans were approved by the Medical Ethics Committee of the Second Affiliated Hospital, Zhejiang University School of Medicine. The studies were conducted in accordance with the local legislation and institutional requirements. The participants provided their written informed consent to participate in this study.
Author contributions
YZ: Conceptualization, Data curation, Methodology, Writing – original draft. LL: Conceptualization, Data curation, Methodology, Writing – original draft. SX: Data curation, Writing – review & editing. YY: Conceptualization, Software, Writing – review & editing. RZ: Conceptualization, Software, Writing – review & editing. MZ: Supervision, Writing – review & editing. JS: Conceptualization, Software, Supervision, Writing – review & editing. PH: Conceptualization, Methodology, Supervision, Writing – original draft, Writing – review & editing.
Funding
The author(s) declare that financial support was received for the research, authorship, and/or publication of this article. This work was supported by the National Natural Science Foundation of China (Grant No: 82371907, 82101987) and the Natural Science Foundation of Zhejiang Province (Grant No: LZ24H180002, LQ20H180015). The funding agencies had no further role in study design; in the collection, analysis and interpretation of data; in the writing of the report; and in the decision to submit the article for publication.
Conflict of interest
The authors declare that the research was conducted in the absence of any commercial or financial relationships that could be construed as a potential conflict of interest.
Generative AI statement
The authors declare that no Gen AI was used in the creation of this manuscript.
Publisher’s note
All claims expressed in this article are solely those of the authors and do not necessarily represent those of their affiliated organizations, or those of the publisher, the editors and the reviewers. Any product that may be evaluated in this article, or claim that may be made by its manufacturer, is not guaranteed or endorsed by the publisher.
Footnotes
References
Acosta-Cabronero, J., Betts, M. J., Cardenas-Blanco, A., Yang, S., and Nestor, P. J. (2016). In vivo MRI mapping of brain Iron deposition across the adult lifespan. J. Neurosci. 36, 364–374. doi: 10.1523/JNEUROSCI.1907-15.2016
Akasaka, T., Fujimoto, K., Yamamoto, T., Okada, T., Fushumi, Y., Yamamoto, A., et al. (2016). Optimization of regularization parameters in compressed sensing of magnetic resonance angiography: can statistical image metrics mimic radiologists’ perception? PLoS One 11:e0146548. doi: 10.1371/journal.pone.0146548
Almansour, H., Herrmann, J., Gassenmaier, S., Afat, S., Jacoby, J., Koerzdoerfer, G., et al. (2023). Deep learning reconstruction for accelerated spine MRI: prospective analysis of interchangeability. Radiology 306:e212922. doi: 10.1148/radiol.212922
Ashraf, A., Clark, M., and So, P. W. (2018). The aging of Iron man. Front. Aging Neurosci. 10:65. doi: 10.3389/fnagi.2018.00065
Avanzo, M., Wei, L., Stancanello, J., Vallières, M., Rao, A., Morin, O., et al. (2020). Machine and deep learning methods for radiomics. Med. Phys. 47, e185–e202. doi: 10.1002/mp.13678
Bash, S., Wang, L., Airriess, C., Zaharchuk, G., Gong, E., Shankaranarayanan, A., et al. (2021). Deep learning enables 60% accelerated volumetric brain MRI while preserving quantitative performance: a prospective, multicenter, Multireader Trial. Am J Neuroradiol. 42, 2130–2137. doi: 10.3174/ajnr.A7358
Bilgic, B., Fan, A. P., Polimeni, J. R., Cauley, S. F., Bianciardi, M., Adalsteinsson, E., et al. (2014). Fast quantitative susceptibility mapping with L1-regularization and automatic parameter selection. Magn. Reson. Med. 72, 1444–1459. doi: 10.1002/mrm.25029
Chan, K. S., and Marques, J. P. (2021). SEPIA-susceptibility mapping pipeline tool for phase images. NeuroImage 227:117611. doi: 10.1016/j.neuroimage.2020.117611
Chary, K., Nissi, M. J., Nykänen, O., Manninen, E., Rey, R. I., Shmueli, K., et al. (2021). Quantitative susceptibility mapping of the rat brain after traumatic brain injury. NMR Biomed. 34:e4438. doi: 10.1002/nbm.4438
Chen, W., Gauthier, S. A., Gupta, A., Comunale, J., Liu, T., Wang, S., et al. (2014). Quantitative susceptibility mapping of multiple sclerosis lesions at various ages. Radiology 271, 183–192. doi: 10.1148/radiol.13130353
Cong, F., Liu, X., Liu, C. S. J., Xu, X., Shen, Y., Wang, B., et al. (2020). Improved depiction of subthalamic nucleus and globus pallidus internus with optimized high-resolution quantitative susceptibility mapping at 7 T. NMR Biomed. 33:e4382. doi: 10.1002/nbm.4382
Deh, K., Kawaji, K., Bulk, M., van der Weerd, L., Lind, E., Spincemaille, P., et al. (2019). Multicenter reproducibility of quantitative susceptibility mapping in a gadolinium phantom using MEDI+0 automatic zero referencing. Magn. Reson. Med. 81, 1229–1236. doi: 10.1002/mrm.27410
Deistung, A., Schweser, F., and Reichenbach, J. R. (2017). Overview of quantitative susceptibility mapping. NMR Biomed. 30:3569. doi: 10.1002/nbm.3569
Gao, Y., Cloos, M., Liu, F., Crozier, S., Pike, G. B., and Sun, H. (2021). Accelerating quantitative susceptibility and R2* mapping using incoherent undersampling and deep neural network reconstruction. NeuroImage 240:118404. doi: 10.1016/j.neuroimage.2021.118404
Gong, N. J., Dibb, R., Bulk, M., van der Weerd, L., and Liu, C. (2019). Imaging beta amyloid aggregation and iron accumulation in Alzheimer’s disease using quantitative susceptibility mapping MRI. NeuroImage 191, 176–185. doi: 10.1016/j.neuroimage.2019.02.019
Gong, E., Pauly, J. M., Wintermark, M., and Zaharchuk, G. (2018). Deep learning enables reduced gadolinium dose for contrast-enhanced brain MRI. J. Magn. Reson. Imag. 48, 330–340. doi: 10.1002/jmri.25970
Groenewegen, H. J. (2003). The basal ganglia and motor control. Neural Plast. 10, 107–120. doi: 10.1155/NP.2003.107
Guan, X., Xuan, M., Gu, Q., Huang, P., Liu, C., Wang, N., et al. (2017). Regionally progressive accumulation of iron in Parkinson’s disease as measured by quantitative susceptibility mapping. NMR Biomed. 30:3489. doi: 10.1002/nbm.3489
Han, Y., Sunwoo, L., and Ye, J. C. (2020). K -space deep learning for accelerated MRI. IEEE Trans. Med. Imaging 39, 377–386. doi: 10.1109/TMI.2019.2927101
Hong, H., Wang, S., Yu, X., Jiaerken, Y., Guan, X., Zeng, Q., et al. (2023). White matter tract injury by MRI in CADASIL patients is associated with Iron accumulation. J. Magn Reson. Imag. 57, 238–245. doi: 10.1002/jmri.28301
Johnson, P. M., Lin, D. J., Zbontar, J., Zitnick, C. L., Sriram, A., Muckley, M., et al. (2023). Deep learning reconstruction enables prospectively accelerated clinical knee MRI. Radiology 307:e220425. doi: 10.1148/radiol.220425
Knoll, F., Murrell, T., Sriram, A., Yakubova, N., Zbontar, J., Rabbat, M., et al. (2020). Advancing machine learning for MR image reconstruction with an open competition: overview of the 2019 fastMRI challenge. Magn. Reson. Med. 84, 3054–3070. doi: 10.1002/mrm.28338
Li, G., Tong, R., Zhang, M., Gillen, K. M., Jiang, W., du, Y., et al. (2023). Age-dependent changes in brain iron deposition and volume in deep gray matter nuclei using quantitative susceptibility mapping. NeuroImage 269:119923. doi: 10.1016/j.neuroimage.2023.119923
Pauli, W. M., Nili, A. N., and Tyszka, J. M. (2018). A high-resolution probabilistic in vivo atlas of human subcortical brain nuclei. Sci Data. 5:180063. doi: 10.1038/sdata.2018.63
Probst, J., Rohner, M., Zahn, M., Piccirelli, M., Pangalu, A., Luft, A., et al. (2021). Quantitative susceptibility mapping in ischemic stroke patients after successful recanalization. Sci. Rep. 11:16038. doi: 10.1038/s41598-021-95265-3
QSM Consensus Organization CommitteeBilgic, B., Costagli, M., Duyn, J., Langkammer, C., et al. (2024). Recommended implementation of quantitative susceptibility mapping for clinical research in the brain: a consensus of the ISMRM electro-magnetic tissue properties study group. Magn. Reson. Med. 91, 1834–1862. doi: 10.1002/mrm.30006
Rotta, J., Perosa, V., Yakupov, R., Kuijf, H. J., Schreiber, F., Dobisch, L., et al. (2021). Detection of cerebral microbleeds with venous connection at 7-tesla MRI. Neurology 96, e2048–e2057. doi: 10.1212/WNL.0000000000011790
Santin, M. D., Didier, M., Valabrègue, R., Yahia Cherif, L., García-Lorenzo, D., Loureiro de Sousa, P., et al. (2017). Reproducibility of R2 * and quantitative susceptibility mapping (QSM) reconstruction methods in the basal ganglia of healthy subjects. NMR Biomed. 30:3491. doi: 10.1002/nbm.3491
Seger, C. A. (2006). The basal ganglia in human learning. Neurosci Rev J Bringing Neurobiol Neurol Psychiatry 12, 285–290. doi: 10.1177/1073858405285632
Shahmaei, V., Faeghi, F., Mohammdbeigi, A., Hashemi, H., and Ashrafi, F. (2019). Evaluation of iron deposition in brain basal ganglia of patients with Parkinson’s disease using quantitative susceptibility mapping. Eur J Radiol Open 6, 169–174. doi: 10.1016/j.ejro.2019.04.005
Shen, Y., Hu, J., Eteer, K., Chen, Y., Buch, S., Alhourani, H., et al. (2020). Detecting sub-voxel microvasculature with USPIO-enhanced susceptibility-weighted MRI at 7 T. Magn. Reson. Imaging 67, 90–100. doi: 10.1016/j.mri.2019.12.010
Wang, S., Xiao, T., Liu, Q., and Zheng, H. (2021). Deep learning for fast MR imaging: a review for learning reconstruction from incomplete k-space data. Biomed Signal Process Control 68:102579. doi: 10.1016/j.bspc.2021.102579
Wu, B., Li, W., Guidon, A., and Liu, C. (2012). Whole brain susceptibility mapping using compressed sensing. Magn. Reson. Med. 67, 137–147. doi: 10.1002/mrm.23000
Ye, Y., Li, X., Zhang, Q., Zhou, F., Li, M., Qing, Z., et al. (2019). Dynamic streaking artifact regularization for QSM. In the annual meeting of ISMRM. Montreal, QC, Canada.
Ye, Y., Lyu, J., Hu, Y., Zhang, Z., Xu, J., and Zhang, W. (2022). MULTI-parametric MR imaging with fLEXible design (MULTIPLEX). Magn. Reson. Med. 87, 658–673. doi: 10.1002/mrm.28999
Ye, Y., Zhang, Z., Chen, E. Z., Chen, X., Sun, S., and Xu, J. (2023). Deep learning acceleration and reconstruction for single-channel signals. In the annual meeting of ISMRM. Toronto, ON, Canada.
Ye, Y., Zhou, F., Zong, J., Lyu, J., Chen, Y., Zhang, S., et al. (2019). Seed prioritized unwrapping (SPUN) for MR phase imaging. J. Magn. Reson. Imaging 50, 62–70. doi: 10.1002/jmri.26606
Keywords: quantitative susceptibility mapping, acceleration, brain nuclei, deep learning, parallel imaging
Citation: Zhou Y, Liu L, Xu S, Ye Y, Zhang R, Zhang M, Sun J and Huang P (2025) Validation of deep-learning accelerated quantitative susceptibility mapping for deep brain nuclei. Front. Neurosci. 19:1522227. doi: 10.3389/fnins.2025.1522227
Edited by:
Ana-Maria Oros-Peusquens, Helmholtz Association of German Research Centres (HZ), GermanyReviewed by:
Alexey V. Dimov, Cornell University, United StatesJaeseok Park, Sungkyunkwan University, Republic of Korea
Copyright © 2025 Zhou, Liu, Xu, Ye, Zhang, Zhang, Sun and Huang. This is an open-access article distributed under the terms of the Creative Commons Attribution License (CC BY). The use, distribution or reproduction in other forums is permitted, provided the original author(s) and the copyright owner(s) are credited and that the original publication in this journal is cited, in accordance with accepted academic practice. No use, distribution or reproduction is permitted which does not comply with these terms.
*Correspondence: Jianzhong Sun, MjE5MTAwOUB6anUuZWR1LmNu; Peiyu Huang, aHVhbmdweUB6anUuZWR1LmNu
†These authors have contributed equally to this work