- 1Department of Radiology, Zhongnan Hospital of Wuhan University, Wuhan, China
- 2Central Research Institute, United Imaging Healthcare, Shanghai, China
Background: Individualized cortical functional networks parcellation has been reported as highly reproducible at 3.0 T. However, in view of the complexity of cortical networks and the greatly increased sensitivity provided by ultra-high field 5.0 T MRI, the parcellation consistency between different magnetic fields is unclear.
Purpose: To explore the consistency and stability of individualized cortical functional networks parcellation at 3.0 T and 5.0 T MRI based on spatial and functional connectivity analysis.
Materials and methods: Thirty healthy young participants were enrolled. Each subject underwent resting-state fMRI at both 3.0 T and 5.0 T in a random order in less than 48 h. The individualized cortical functional networks was parcellated for each subject using a previously proposed iteration algorithm. Dice coefficient was used to evaluate the spatial consistency of parcellated networks between 3.0 T and 5.0 T. Functional connectivity (FC) consistency was evaluated using the Euclidian distance and Graph-theory metrics.
Results: A functional cortical atlas consisting of 18 networks was individually parcellated at 3.0 T and 5.0 T. The spatial consistency of these networks at 3.0 T and 5.0 T for the same subject was significantly higher than that of inter-individuals. The FC between the 18 networks acquired at 3.0 T and 5.0 T were highly consistent for the same subject. Positive cross-subject correlations in Graph-theory metrics were found between 3.0 T and 5.0 T.
Conclusion: Individualized cortical functional networks at 3.0 T and 5.0 T showed consistent and stable parcellation results both spatially and functionally. The 5.0 T MR provides finer functional sub-network characteristics than that of 3.0 T.
Introduction
The human cerebral cortex consist of hundreds of cortical regions with unique structural morphology, functionality and connectivity (Kaas, 1987; Felleman and Van Essen, 1991; Zilles and Amunts, 2010; Eickhoff et al., 2018). The highly folded structure of cerebral cortex and multiple areas are thought to be organized into numerous spatially distributed large-scale networks, that interact as part of distributed functional networks and broadly serve for different aspects of human cognition and behavior (Fischl and Dale, 2000; Bressler and Menon, 2010). However, individualized differences in brain organization are distributed heterogeneously across the cortex and white matter fiber tracts (Wang et al., 2015; Han et al., 2020), contributing significantly to the complexity of the cortical networks and individual variability. Most previous studies of functional networks have focused on the population-level or group-level, failing to fully account for individual differences. Applying a group-template to individual subject may bring misalignment, dilute brain-behavior associations with neuropsychiatric diseases, obscure individual differences in the calculation process and restrict the development of personalized medical treatment in clinical practice (Wang et al., 2015). Obtaining functional atlases at the individual level is an important step to explore individual brain function and thus can further provide basis for precision personalized medicine.
Wang et al. developed a novel cortical parcellation approach to accurately map functional organization at the individual level using resting-state blood oxygenation level dependent functional MRI (BOLD-fMRI) (Wang et al., 2015). A population-based functional atlas and a map of inter-individual variability were employed to guide the iterative search for functional networks in individual subjects. Functional networks mapped by this approach were highly reproducible within subjects and effectively captured the variability across subjects (Wang et al., 2015). Functional connectivity (FC) is defined as the temporal dependency of neurophysiological signals, such as BOLD-fMRI signals, between spatially remote brain areas (Friston et al., 1993). Individual-specific functional connectivity analysis may contribute to reflecting individual characteristics of diseases, revealing the pathogenesis of diseases, and providing the possibility for early diagnosis and treatment monitoring.
It is generally known that MRI with high magnetic field can provide more detailed anatomical information relying on higher spatial resolution and signal-to-noise ratio compared to lower fields MRI (Triantafyllou et al., 2005; Schafer et al., 2008; de Hollander et al., 2017). The BOLD signal arises from the inhomogeneity of the local field, which is caused by the difference in magnetic susceptibility between the deoxygenated hemoglobin-rich blood in the capillaries and venous vessels and the surrounding tissues. For resting-state fMRI, the ultra-high field strength MRI greatly increases sensitivity to the BOLD contrast (Triantafyllou et al., 2005). Recently, a 5.0 T MRI scanner was developed. The high field strengths of 5.0 T may provide more accurate topological and functional maps at individual level than that of 3.0 T (Prudent et al., 2010).
The individualized cortical functional networks parcellation method proposed by Wang et al. has been reported as highly reproducible at 3.0 T (Wang et al., 2015). However, this method has never been tested on high field MRI above 3.0 T, such as 5.0 T MRI. It remains unclear whether the spatial distribution of these functional networks for the same subject would remain similar at different magnetic fields. Given the complexity of cortical networks and the significantly increased sensitivity to BOLD effects at ultra-high fields, this study aimed to explore the consistency and stability of individualized cortical functional networks parcellation across 3.0 T and 5.0 T MRI based on spatial measurement, between-network functional connectivity, and graph-theory analysis.
Materials and methods
Participants
This prospective study was approved by the Medical Research Ethics Committee and Institutional Review Board of Zhongnan Hospital and written informed consent was obtained from all subjects. Thirty healthy young individuals (mean age ± SD, 27 years ±5; male: 16, female: 14) were enrolled from September 2021 to March 2022. All participants were right-handed and without any comorbidities.
MR acquisitions
Each participant underwent both 3.0 T and 5.0 T MRI scan in a random order within a 48-h window. The imaging protocols included resting-state blood oxygenation level dependent (rs-BOLD) MRI and structural three-dimensional (3D) T1-weighted images. The 3.0 T examinations were conducted with a commercial MR scanner (Discovery MR 750w, GE Healthcare, Waukesha, WI, United States) equipped with a 32-channel head coil. The 5.0 T examinations were performed with a newly MR scanner (uMR Jupiter, United Imaging Healthcare, Shanghai, China), also with a 32-channel head coil. To ensure homogeneous and reliable results, the main parameters were standardized between 3.0 T and 5.0 T devices. Resting-state data were acquired using a gradient echo-planar imaging (EPI) sequence with the following parameters: TR/TE = 2000/25 ms, timepoints = 240, FOV = 240 mm × 240 mm, flip angle (FA) = 90°, Acquisition Matrix = 60 × 60, slice thickness = 4.0 mm, number of slices = 39, and voxel size = 4 × 4 × 4 mm3. Structural 3D T1-weighted images for the 3.0 T scans were acquired with a brain volume imaging (BRAVO) sequence: TR/TE = 8.0/3.0 ms, thickness = 1.0 mm, FA = 12°, Acquisition Matrix = 240 × 240, FOV = 240 mm × 240 mm, number of slices = 148 and voxel size = 1 × 1 × 1 mm3. For the 5.0 T scans, structural 3D T1-weighted images were acquired with a three-dimension fast spoiled gradient echo sequence (T1 GRE-FSP 3D) with identical parameter to the 3.0 T scans. During resting functional MRI scanning, participants were instructed to relax, lie down comfortably with eyes closed, remain awake, and minimize cognitive activity. Head motion was minimized using foam pads, and earplugs were provided to attenuate scanner noise, ensuring smooth progress of the MRI scan and image quality.
SNR, tSNR and CNR of raw resting-state fMRI data evaluation
To compare the Signal-to-Noise Ratio (SNR) of 3.0 T and 5.0 T, the signal component (S) was determined as the mean intensity within the selected parenchyma region of interests (ROIs). The ROIs were symmetrically drawn in frontal and parietal lobes at the apex level of the lateral ventricle from axial conventional resting-state fMRI data (Supplementary Figure S1). The noise (N) area was defined as regions in the four corners of the image, and its standard deviation was determined by calculating the mean of the standard deviation of four corners (Han et al., 2021). The mean SNR was calculated by S/N. The temporal SNR (tSNR) was computed on a voxel-wise basis and defined as the temporal mean signal divided by temporal standard deviation in subjects. Considering that neuronal activity signals may lead to bias in the measurement of tSNR on BOLD images, we also scanned a water phantom at 3.0 T and 5.0 T MR and calculated the tSNR, respectively. For Contrast-to-Noise Ratio (CNR) of 3.0 T and 5.0 T, we collected the mean intensity of gray (Sgray) and white matter (Swhite). The ROI of gray matter was drawn on the frontal lobe at the apex level of the lateral ventricle from axial raw resting-state fMRI, and ROI of white matter was drawn in callosum area of the same level as gray matter ROI (Supplementary Figure S1). The CNR was calculated by (Sgray-Swhite)/Swhite.
fMRI preprocessing
Resting-state fMRI data, preprocessed using the Independent Component Analysis Fix (ICA-FIX) method from Human Connectome Project (HCP) subjects and presented as temporal series of grayordinates, were processed using the HCP pipeline (Glasser et al., 2016). The preprocessing steps involved the use of FSL (FMRIB Software Library), FreeSurfer, and command line functions from Connectome Workbench (Marcus et al., 2011; Barch et al., 2013; Smith et al., 2013; Glasser et al., 2016). Resting-state fMRI data for each subject underwent resampling to a standardized cortical surface mesh representation (fs_LR 32 k mesh). Despite the application of ICA-FIX, previous studies noted that global physiological noise and motion-related artifacts were not entirely eliminated (Marcus et al., 2011; Glasser et al., 2016). To enhance the resting-state fMRI analysis, we implemented additional processing steps:(1) Normalization of resting-state fMRI time series at each vertex to zero mean and unit variance.(2) Linear detrending and band-pass filtering (0.01–0.08 Hz). (3) Regression of 12 head-motion parameters and whole-brain signal. (4) Gaussian smoothing (sigma = 2.55 mm) on the 32 k fs_LR surface.
Individualized homologous functional regions parcellation
Following preprocessing of fMRI data, individualized functional networks were parcellated, homologous networks were identified, and ROI-ROI functional connectivity was calculated using the Homologous Functional Regions Across Individuals toolbox (HFR_ai, http://nmr.mgh.harvard.edu/bid/DownLoad.html). Initially, the individual parcellation was conducted based on the methodology proposed by Wang et al. (2015). The confidence value was set to 3, with 10 terminating iterations, and homologous networks of the left and right hemispheres were combined. Subsequently, homologous functional regions across individuals were determined based on the individual parcellation results obtained from the previous step. The parcellation result after 10 consecutive iterations was selected, with a match rate set to 1, indicating that all subjects had matched that ROI or the kept ROI was homologous in function across all individuals. Finally, ROI-ROI functional connectivity was calculated using the homologous regions defined in the previous step.
Individualized cortical functional networks spatial consistency evaluation
Intra-subject reliability and inter-subject variability were measured using the Dice coefficient. The Dice coefficient measures the similarity between two sets of data, such as binary masks or segmentations of an image. The Dice coefficient is defined as the ratio of the intersection or overlap of two sets of data to their union:
Dice coefficient = 2 |A ∩ B|/ (|A| + |B|). In this study, each individualized network was transformed into a binary mask. |A| + |B| indicates the sum of the number of total voxels within network A and B. And |A ∩ B|indicates the number of the common voxels between network A and B.
We used dice coefficient to describe the spatial consistency of cortical functional networks obtained by parcellation of BOLD images from different MRI devices, i.e., 3.0 T and 5.0 T field strengths. Thus there were two different dice coefficients for each network. One was the dice coefficient of 3.0 T images and 5.0 T images for the same subject, which we named the “dice coefficient intra-individual,” and the other was for the different subjects (namely dice coefficient for one subject’s 3.0 T images and every other subject’s 5.0 T images), which we named the “dice coefficient inter-individual.” We then evaluated the difference between these two dice coefficients. A high intra-individual dice coefficient would indicate high spatial consistency of a certain network at different magnetic fields for the same subject, and reflects the stability of the individualized brain functional parcellation method. The inter-individual variability of the cortical networks would lead to a lower dice coefficients for different subjects and further reflects the functional complexity of corresponding networks.
Between-networks functional connectivity consistency analysis of individualized cortical networks
The total number of sub-regions obtained by HFR-ai parcellation (the second step of HFR-ai above) was calculated and analyzed for 3.0 T and 5.0 T images. We clustered these sub-regions according to the 18-networks (except for lateral ventricle system) they belonged to. These 18-networks were divided by the two hemispheres into 36 networks. Then the BOLD signals of the homologous functional regions clustered to the same network were averaged. The FC between these 36 networks was calculated using the averaged BOLD signals. Thus a functional connectivity matrix of size 36 × 36 was obtained for each subject for 3.0 T and 5.0 T images, respectively. We used the Euclidian distance (Frobenius Norm) to measure the consistency between two FC matrices. The Euclidian distance of two matrices was defined as the square root of the sum of the absolute squares of the difference between their corresponding elements:
The intra-individual Euclidian distance between the 3.0 T network FC matrix and the 5.0 T network FC matrix was calculated for each subject. The inter-individual Euclidian distance between the 3.0 T network FC matrix of each subject and the 5.0 T network FC matrices of other subjects was also calculated.
Graph theory analysis of functional connectivity matrices
For the between-network FC matrices (FC between the 36 networks) and the between sub-regions matrices (FC between the 75 sub-regions for 3.0 T and the 84 sub-regions for 5.0 T) obtained from HFR-ai parcellation, global network metrics were calculated using the Graph Theoretical Network Analysis (GRETNA).1 These global network metrics included small-world parameters such as the clustering coefficient (Cp), the characteristic path length (Lp), normalized clustering coefficient (γ), normalized characteristic path length (λ) and small-worldness (σ), as well as other global network metrics like global network efficiency, assortativity, synchronization, and hierarchy. Subsequently, the correlation of the global network metrics between 3.0 T and 5.0 T images for these two matrices was calculated to explore the consistency and stability of functional connectivity of individualized cortical functional networks across different magnetic field strengths.
Statistical analysis
Statistical analyses were conducted using SPSS 23.0 software (SPSS, Inc., Chicago, IL, USA). A significance level of p < 0.05 was considered statistically significant. A paired sample t-test was used for the statistics of image SNR, tSNR and CNR between groups. A two-way Analysis of Variance (ANOVA) was used to calculate the main and interaction effects for individual and cortical network factors of the difference of dice coefficient. Group statistics of dice coefficients were compared using a two-sample independent t-test. The area under curve (AUCs) of all the network metrics of 3.0 T and 5.0 T images was statistically analyzed using Pearson correlation analysis.
Results
SNR, tSNR and CNR of 3.0 T and 5.0 T resting-state fMRI data
The original three cross-sectional views of raw fMRI images (axial, coronal and sagittal) of 3.0 T and 5.0 T of one representative subject were demonstrated (Supplementary Figure S2). The quality of 5.0 T images was visibly better than that of 3.0 T images. Significant statistical differences were observed in SNR (370.8 ± 61.8 vs. 144.8 ± 29.7, p < 0.0001) and CNR (0.88 ± 0.20 vs. 0.65 ± 0.10, p < 0.0001) between two groups (Supplementary Table S1).
The tSNR map calculated on a voxel-wise manner of 3.0 T and 5.0 T have been demonstrated (Supplementary Figure S3). The tSNR measured in a gray matter ROI of 5.0 T images was superior to 3.0 T (27.95 ± 2.66 vs. 25.78 ± 2.72, p < 0.0001). In addition, the water phantom tSNR of 5.0 T was also significantly better than that of 3.0 T (320.13 vs. 210.24) (Supplementary Table S1).
Spatial consistency of individualized cortical functional parcellation between 3.0 T and 5.0 T images
A functional cortical atlas comprising 18 networks (excluding the lateral ventricle system) for each unilateral cerebral hemisphere was individually parcellated on both 3.0 T and 5.0 T images. The details of this template atlas was provided in the original paper (Yeo et al., 2011). The lateral ventricle, not belonging to the cortical network, was excluded from our study. The labels of these 18 networks and the atlas projected onto the individual cortical surface are depicted in Figure 1 (Wang et al., 2020).
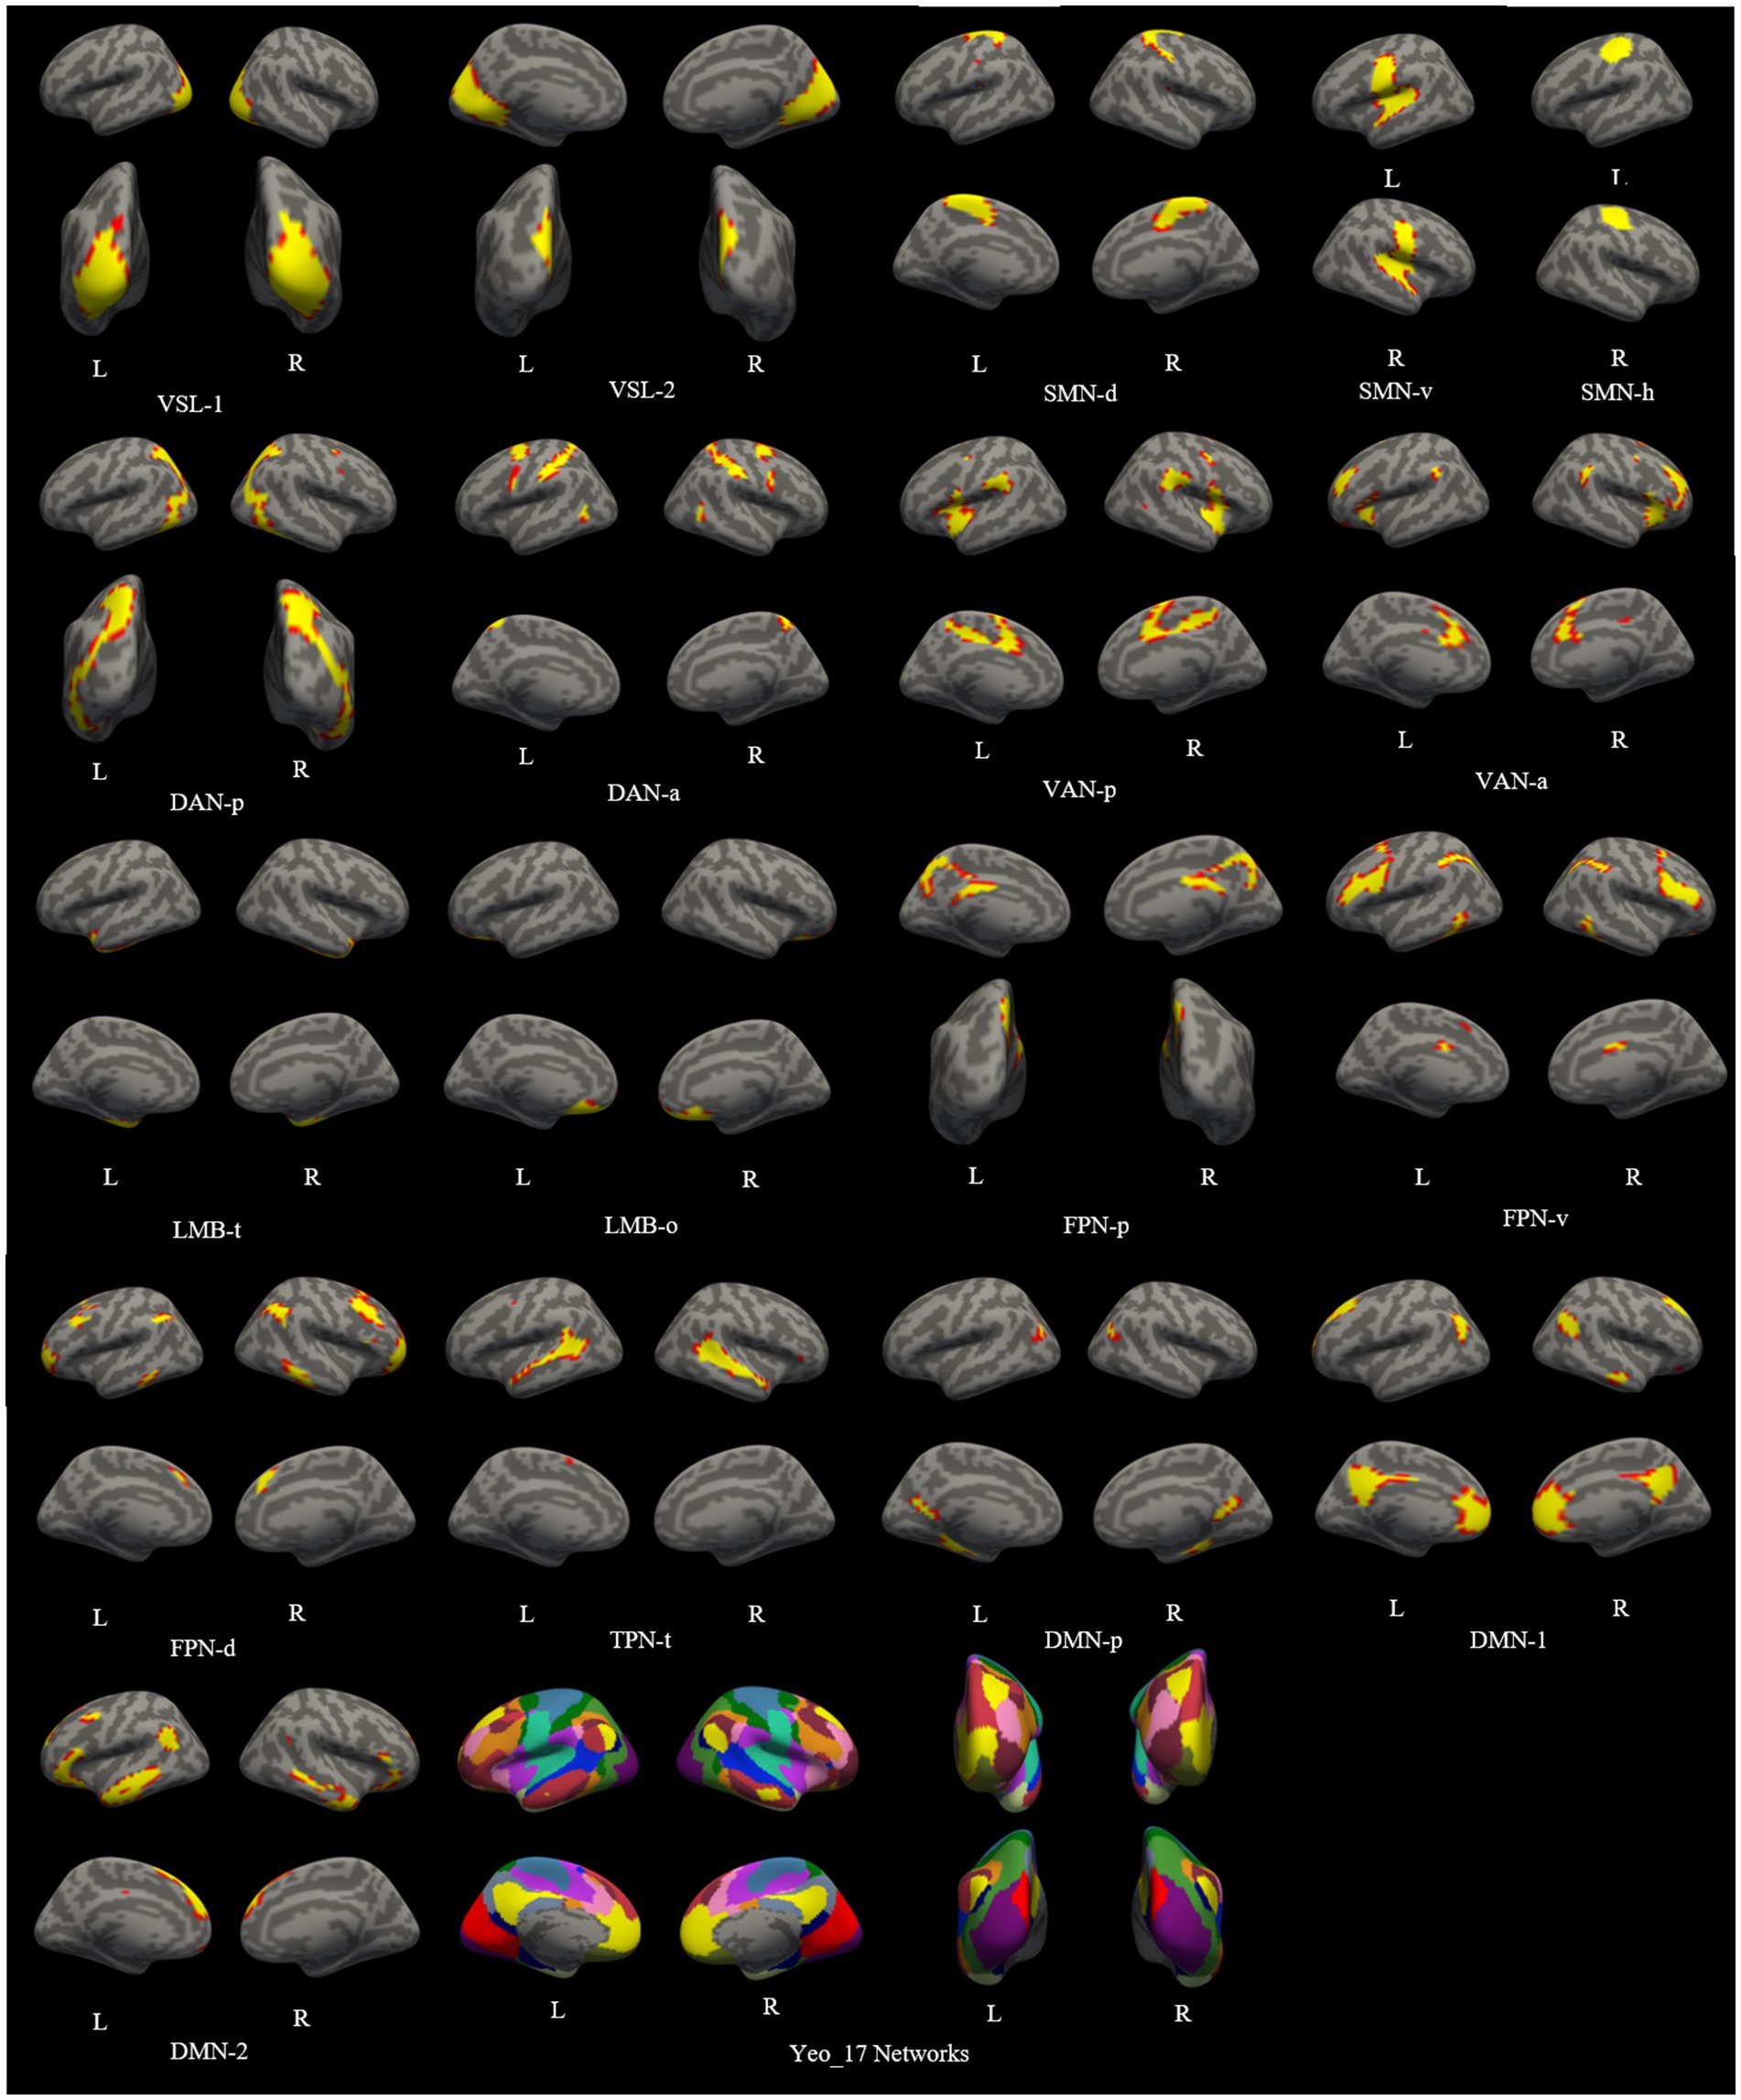
Figure 1. The functional cortical atlas consisting of 18 networks individually parcellated on both images of 3.0 T and 5.0 T. VSL, Visual Network; SMN-d, Dorsal Somatomotor Network; SMN-v, Ventral Somatomotor Network; SMN-h, Somatomotor Network for hand; DAN-p, Posterior Dorsal Attention Network; DAN-a, Anterior Dorsal Attention Network; VAN-p, Posterior Ventral Attention Network; VAN-a, Anterior Ventral Attention Network; LMB-t, Temporal Limbic Network; LMB-o, Orbitofrontal Limbic Network; FPN-p, Posterior Frontoparietal Network; FPN-v, Ventrolateral Frontoparietal Network; FPN-d, Dorsolateral Frontoparietal Network; TPN-t, Temporal Parietal Network; DMN, Default Network; DMN-p, Posterior Default Network.
The calculated dice coefficients of each networks are presented in Figure 2 and Table 1. The bilateral hemispheres were calculated separately. The intra-individual dice coefficient of each cortical functional network between 3.0 T and 5.0 T was high (range: 0.5143–0.8337) for both hemispheres. The results of ANOVA analysis revealed that the main and interaction effects of individual and cortical network factors on the dice coefficient were statistically significant (F > 8.3, p < 0.0001, see Supplementary Figure S4 and Supplementary Table S2). This suggests that individual and cortical network were main factors affecting the difference in dice coefficients. The post-hoc analysis at each cortical network showed that almost all cortical functional networks exhibited a higher dice coefficient intra-individually than inter-individually, with significant statistical differences (p < 0.05), except for bilateral temporal limbic network (LMB-t) and orbitofrontal limbic network (LMB-o).
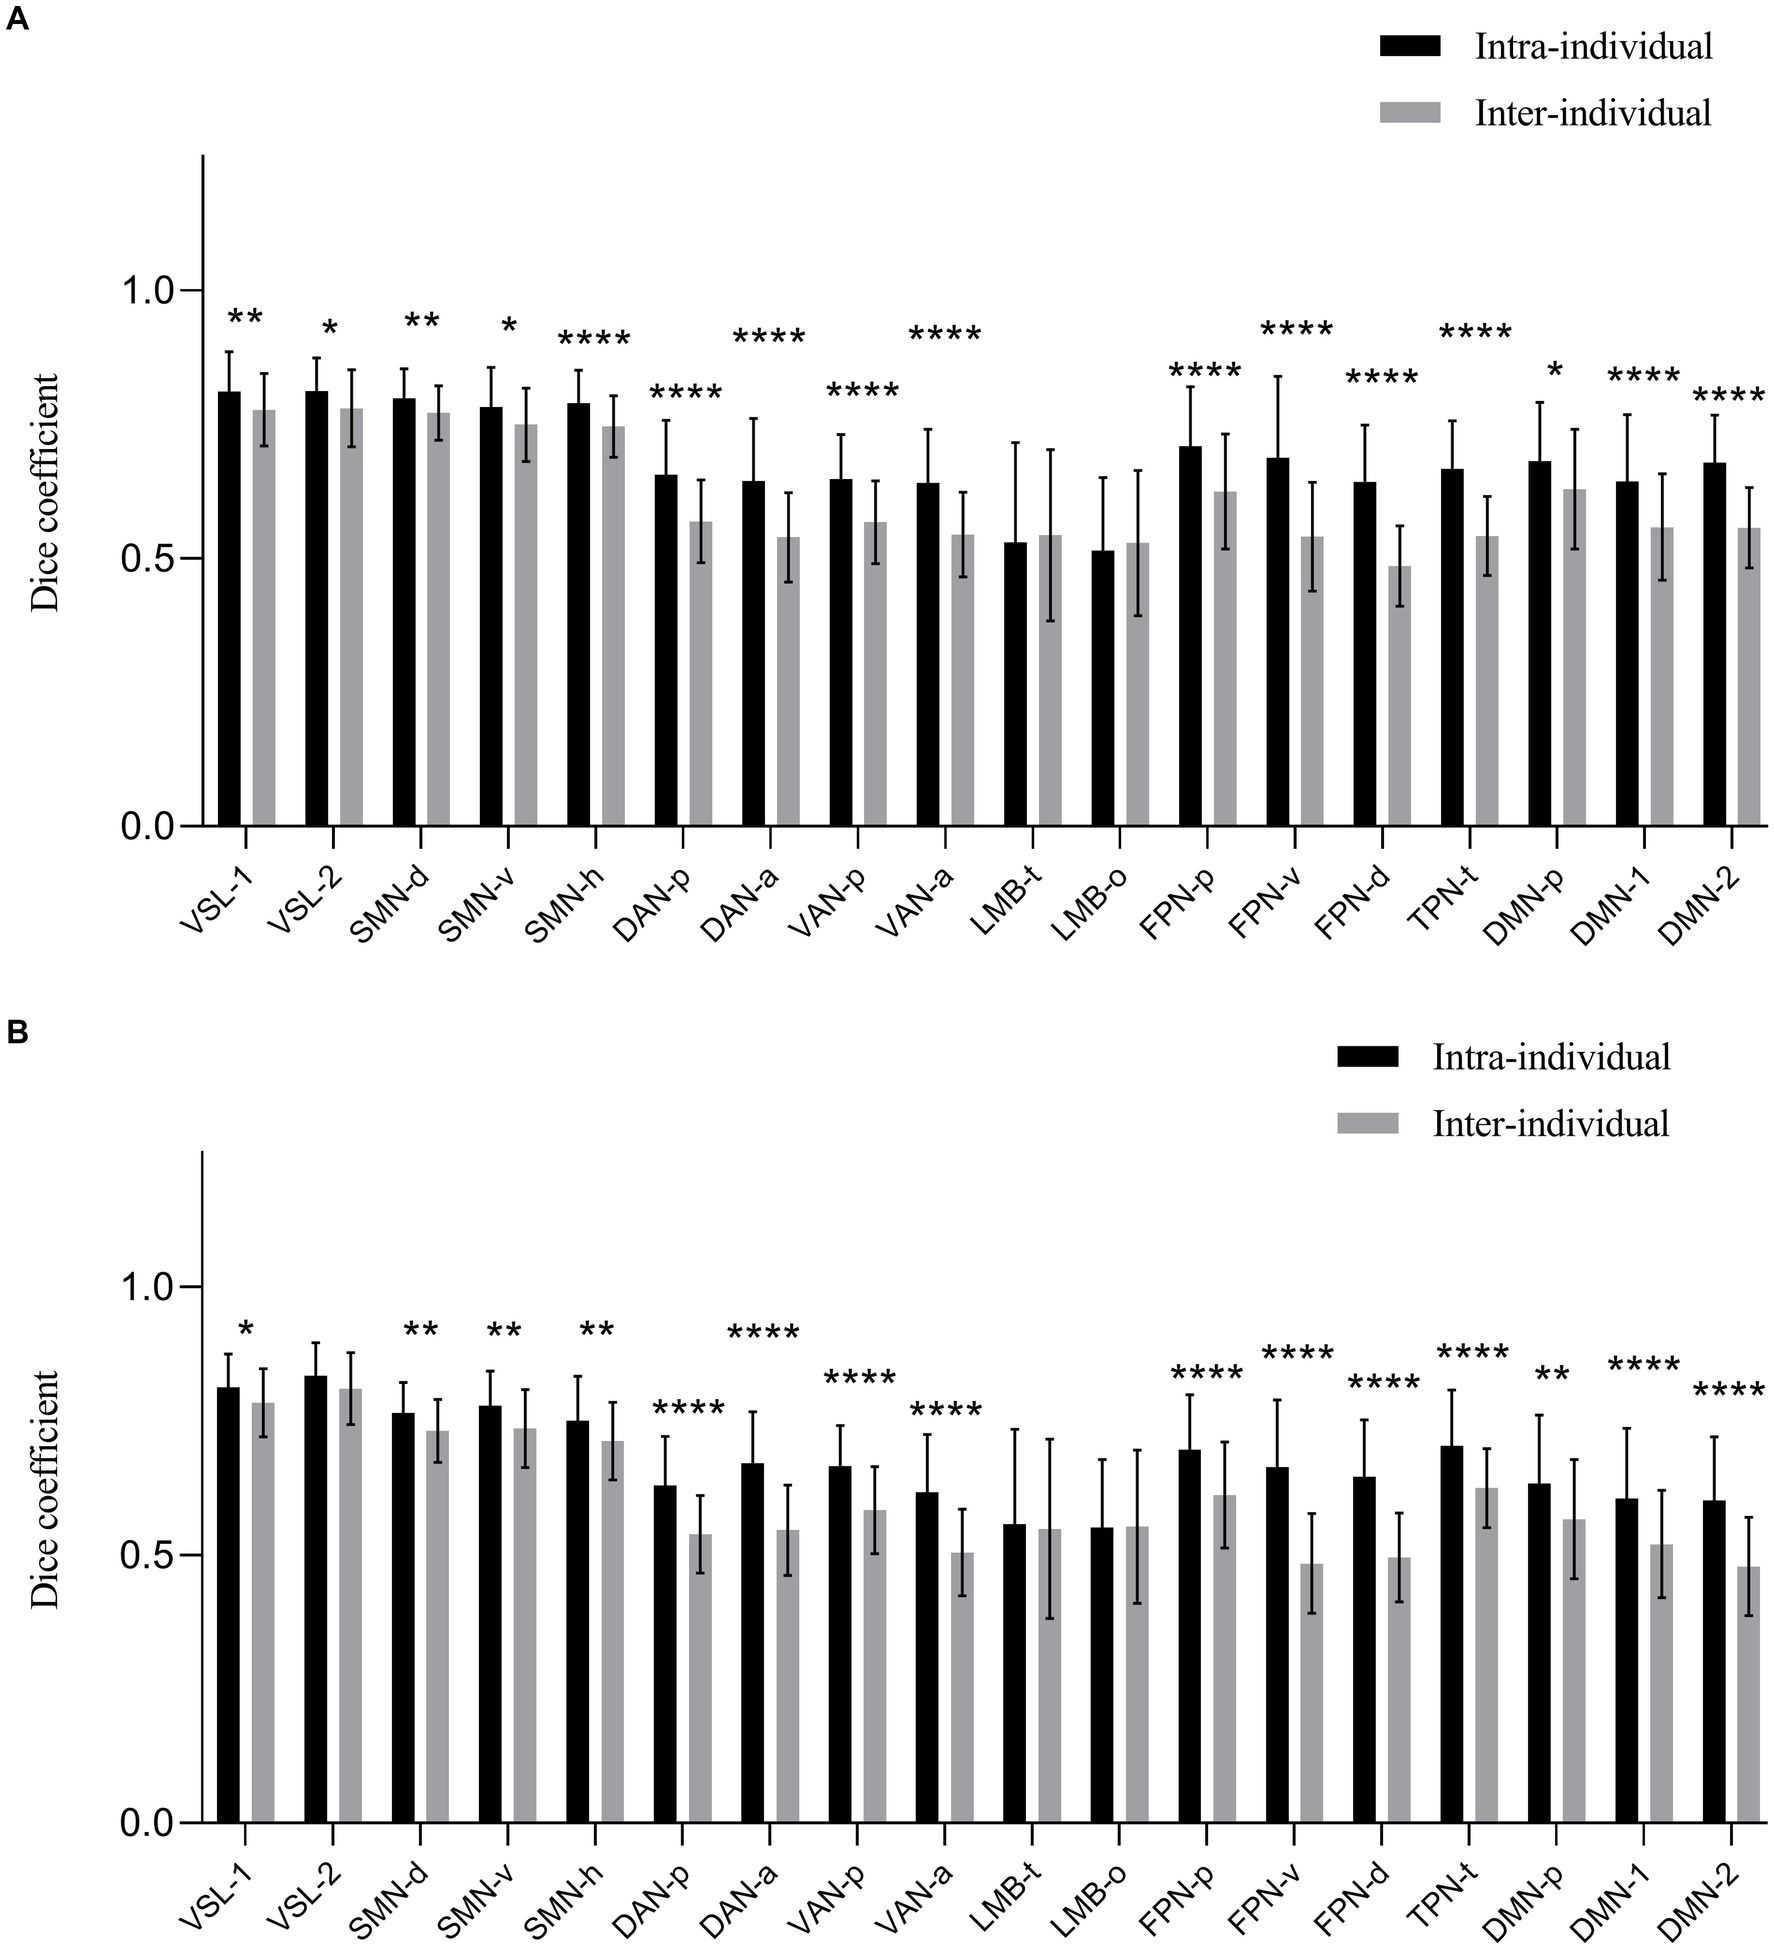
Figure 2. The dice coefficient of obtained 18 cortical networks of 3.0 T and 5.0 T images for intra and inter-individual. (A) The left hemisphere. (B) The right hemisphere. The dice coefficient of each network at 3.0 T and 5.0 T was generally high value (range: 0.5143–0.8337) of bilateral hemispheres. Almost all cortical functional networks had the higher dice coefficient intra-individual than that of inter-individual with significant statistic difference (p < 0.05), except for bilateral networks of LMB-t and LMB-o. VSL, Visual Network; SMN-d, Dorsal Somatomotor Network; SMN-v, Ventral Somatomotor Network; SMN-h, Somatomotor Network for hand; DAN-p, Posterior Dorsal Attention Network; DAN-a, Anterior Dorsal Attention Network; VAN-p, Posterior Ventral Attention Network; VAN-a, Anterior Ventral Attention Network; LMB-t, Temporal Limbic Network; LMB-o, Orbitofrontal Limbic Network; FPN-p, Posterior Frontoparietal Network; FPN-v, Ventrolateral Frontoparietal Network; FPN-d, Dorsolateral Frontoparietal Network; TPN-t, Temporal Parietal Network; DMN, Default Network; DMN-p, Posterior Default Network. *p < 0.05. **p < 0.01. ***p < 0.001. ****p < 0.0001.
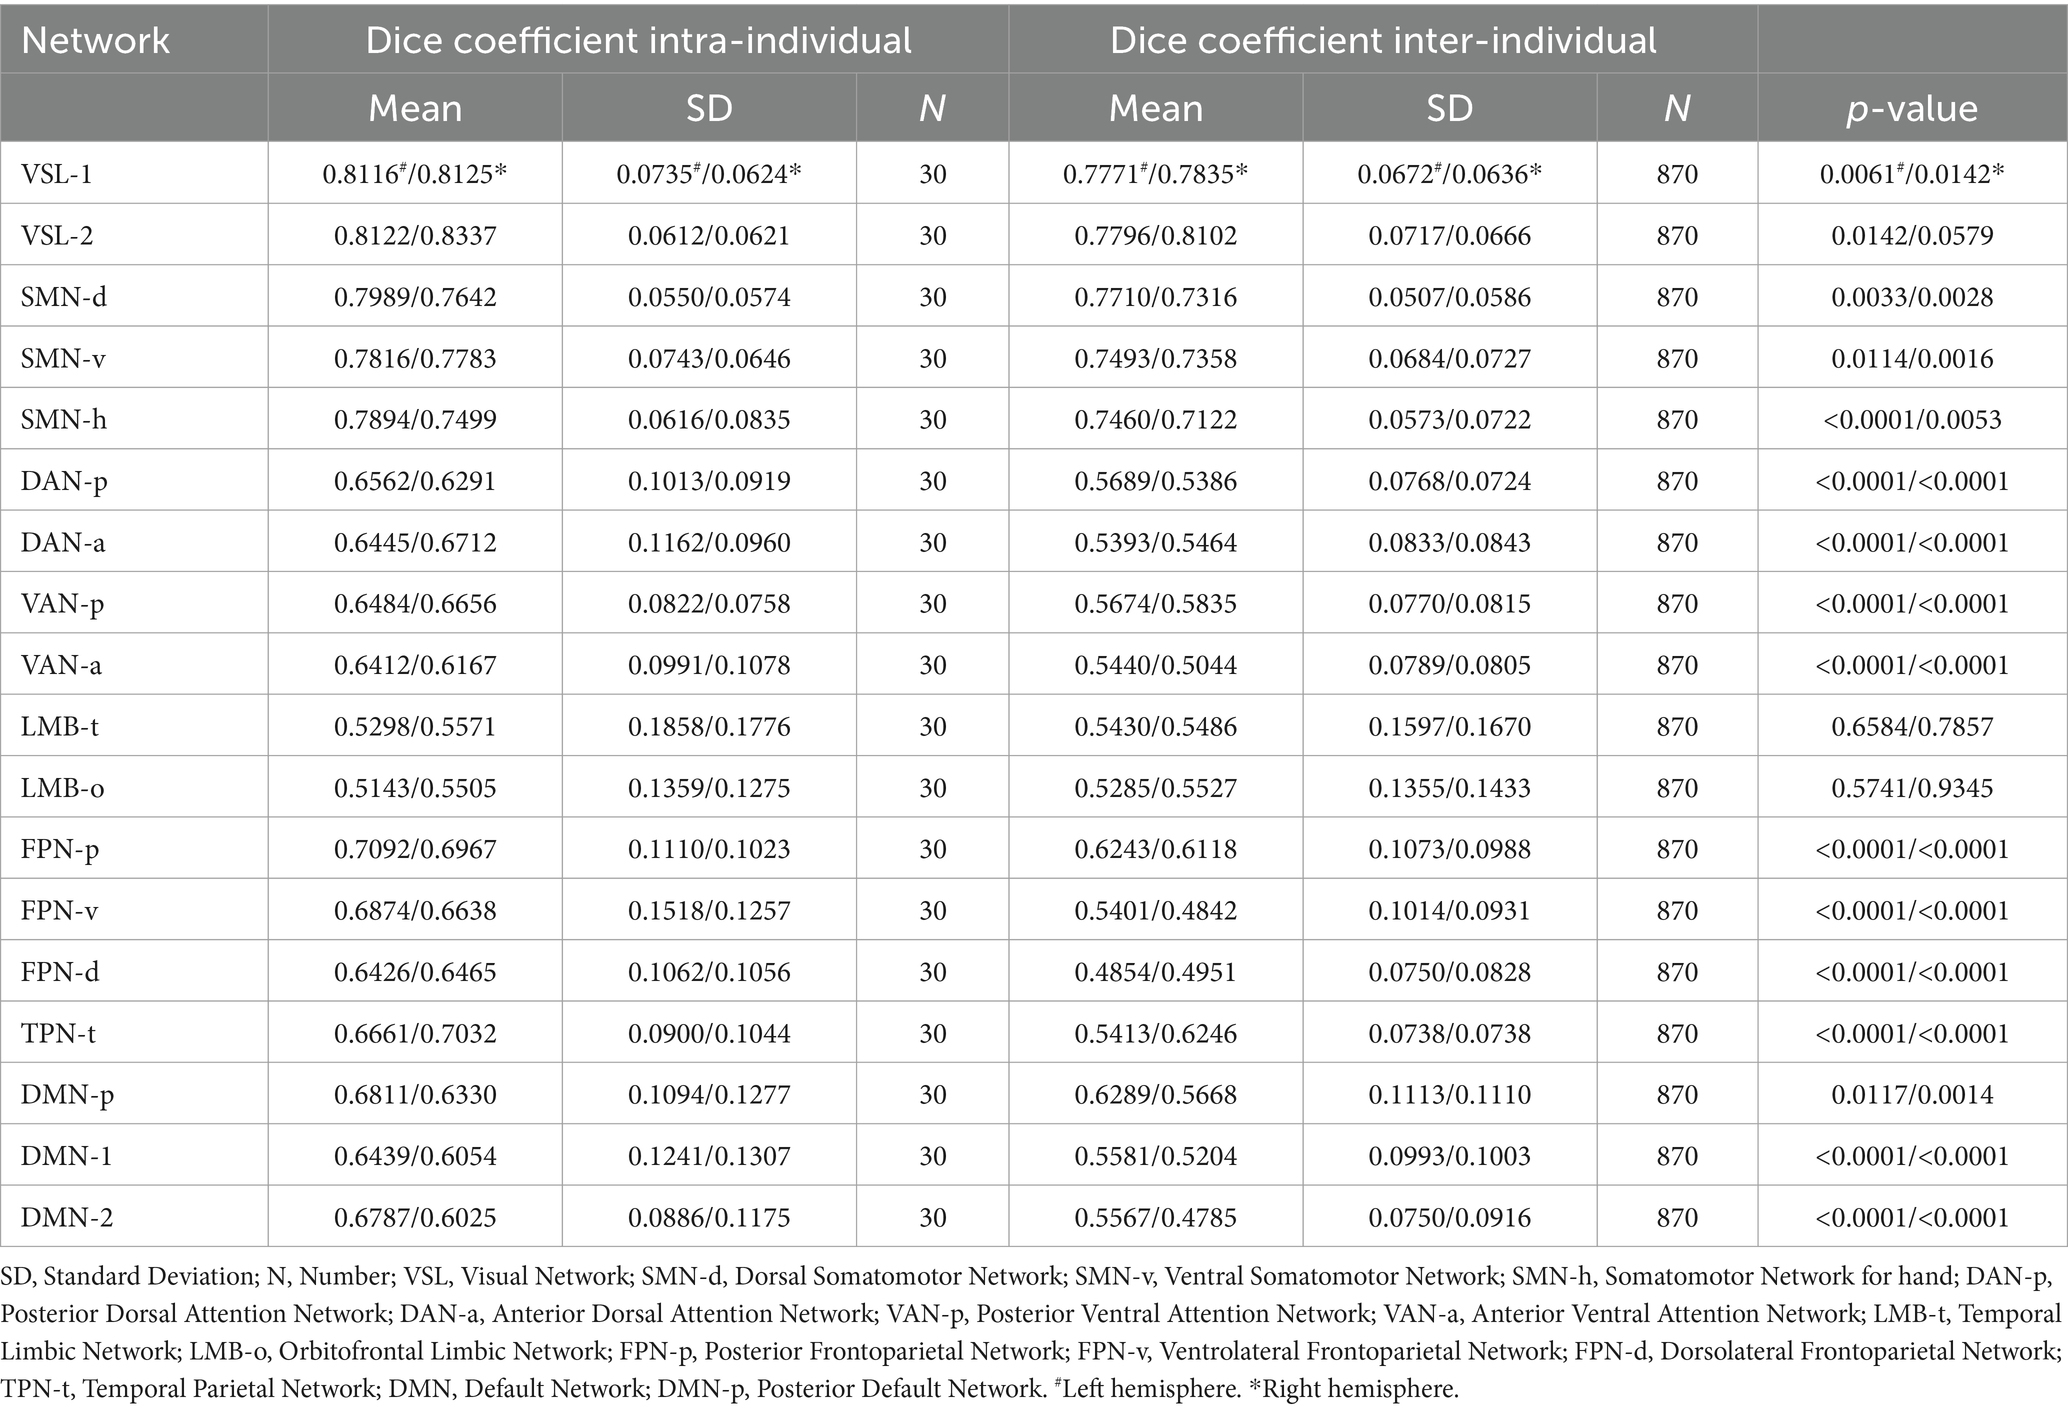
Table 1. The Mean and SD of dice coefficient intra and inter-individual for 18 networks in bilateral hemispheres.
Based on the intra-individual dice coefficient, along with the statistical differences between dice coefficient intra and inter-individuals, we classified all parcellated cortical functional networks into three categories. First, networks with a relatively high intra-individual dice coefficients and slight statistical difference between intra and inter-individual dice coefficients. These included bilateral visual network-1 (VSL-1), Visual Network-2 (VSL-2), dorsal somatomotor network (SMN-d), ventral somatomotor network (SMN-v) and somatomotor network for hand (SMN-h) (intra-individual dice coefficient > 0.75). Second, networks with moderate dice coefficient intra-individual and significant statistical difference between intra and inter-individual dice coefficients were identified. These encompassed networks such as bilateral posterior dorsal attention network (DAN-p), anterior dorsal attention network (DAN-a), posterior ventral attention network (VAN-p), anterior ventral attention network (VAN-a), posterior frontoparietal network (FPN-p), ventrolateral frontoparietal network (FPN-v), dorsolateral frontoparietal Network (FPN-d), temporal parietal network (TPN-t), posterior default network (DMN-p), default network-1 (DMN-1) and default network-2 (DMN-2) (intra-individual dice coefficients 0.60–0.75). Third, the networks with relatively lower dice coefficient both intra-and inter-individual. The remaining networks of bilateral LMB-t and LMB-o fell into this category (intra-individual dice coefficient 0.50–0.60).
The number of parcellated individualized cortical functional sub-regions for 3.0 T and 5.0 T images
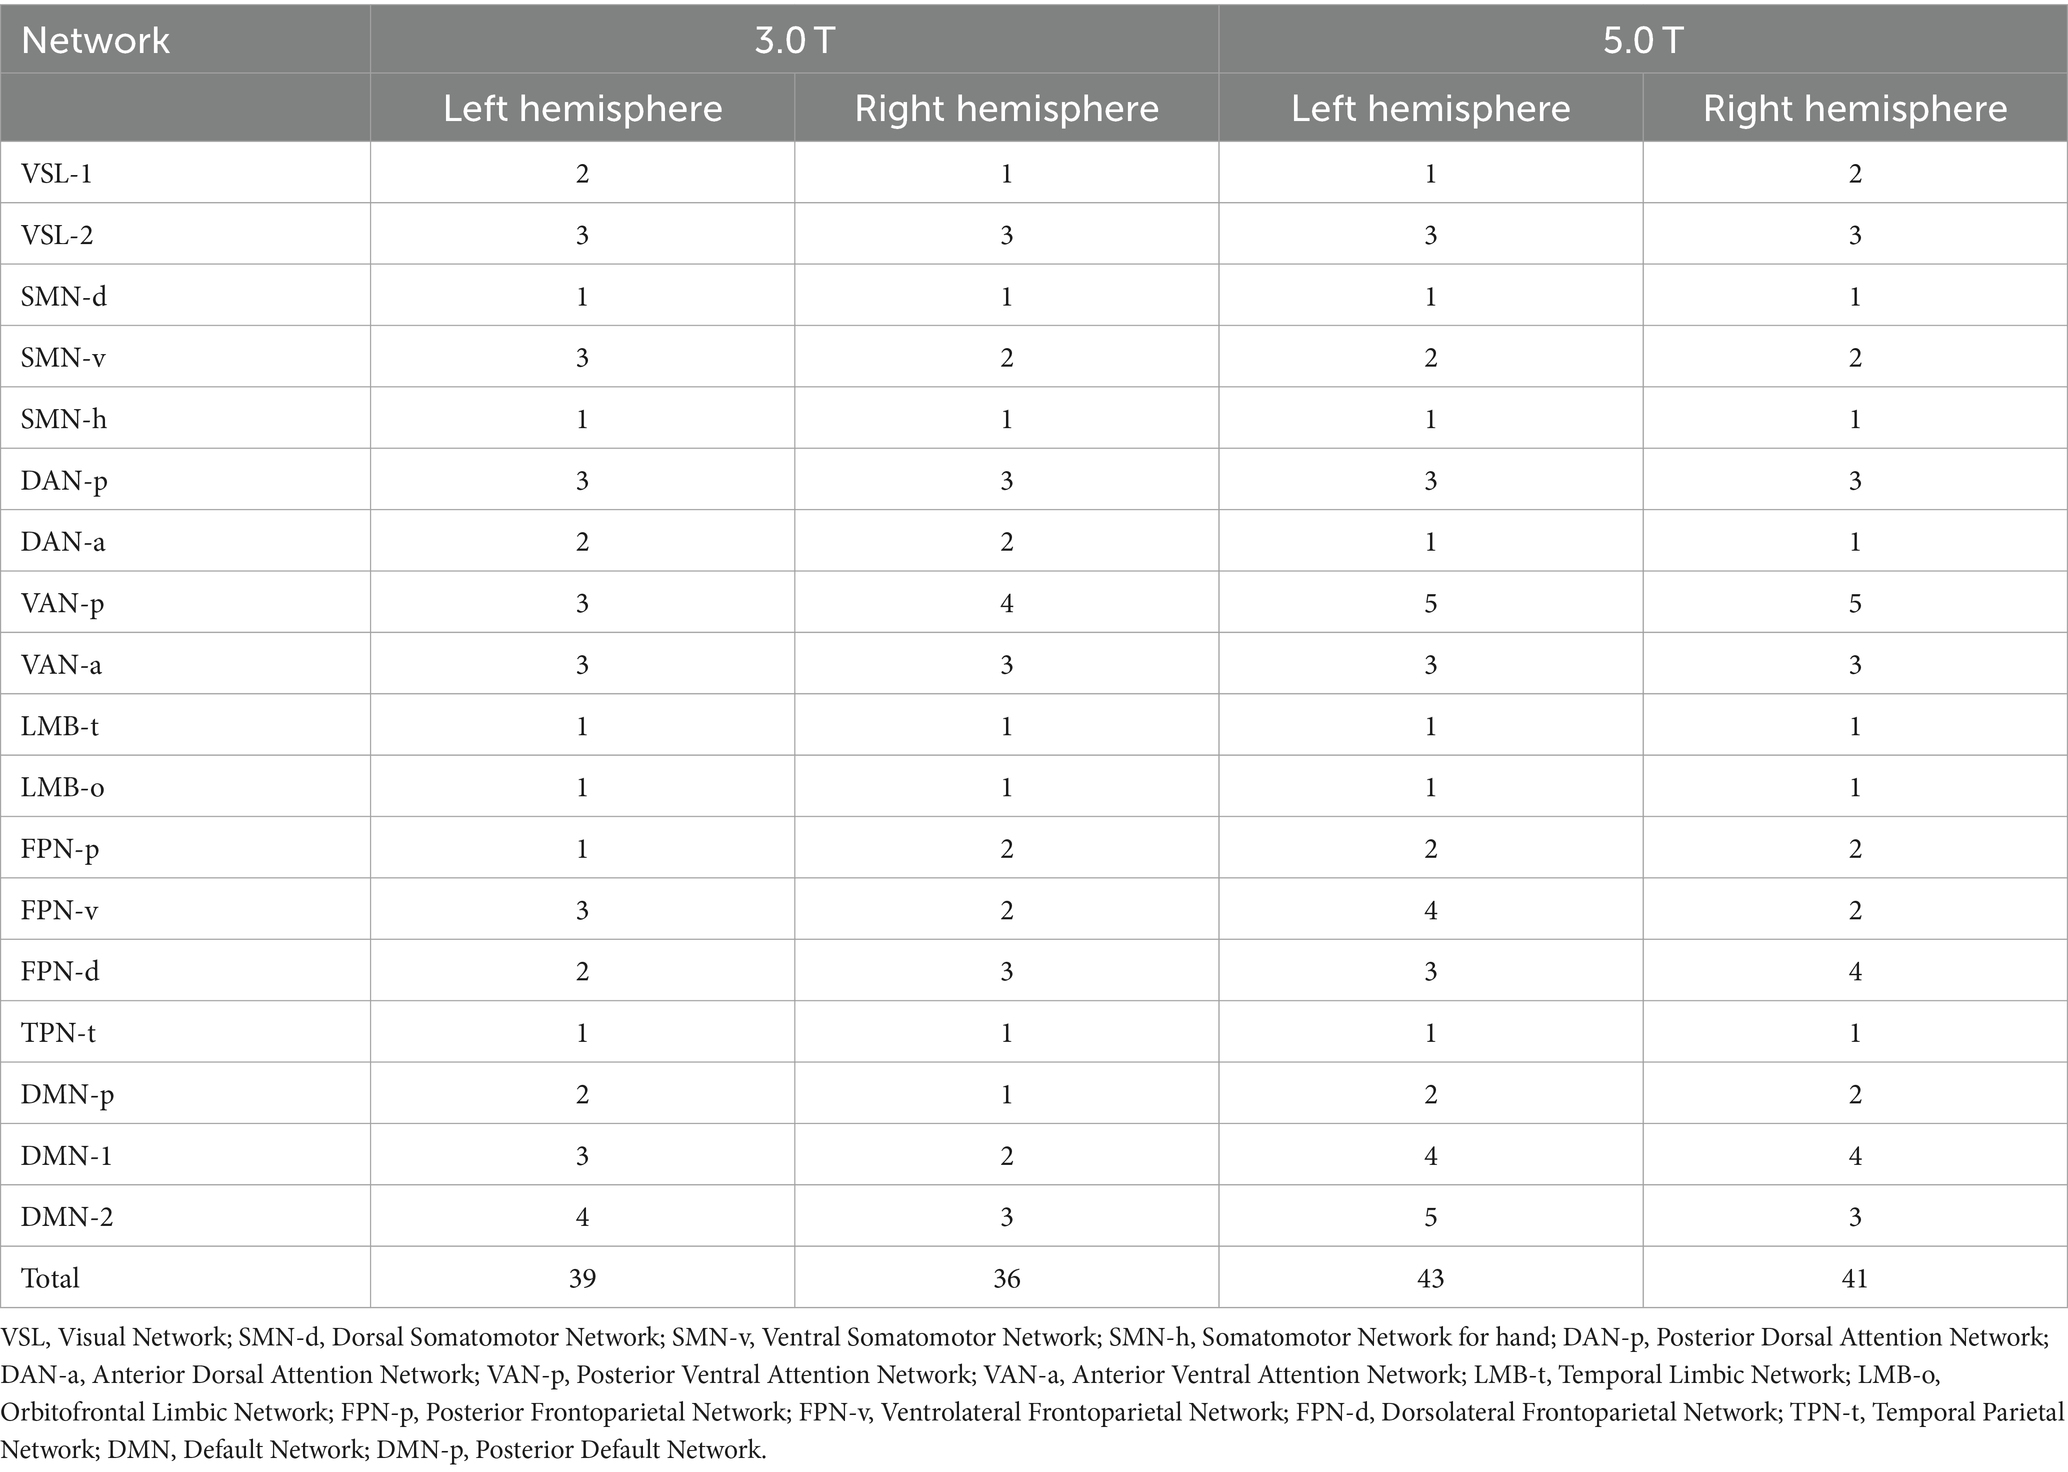
The total number of individualized homologous functional sub-regions was 75 for 3.0 T images and 84 for 5.0 T images (Figure 3 and Table 2). Each of the sub-regions was displayed for a representative individual (Supplementary Figure S5). These functional regions constituted the 36 larger brain networks of bilateral cerebral hemispheres. For each of the 36 parcellated networks, the number of functional sub-regions parcellated was shown in Table 2. Figure 4 demonstrated two representative individuals, and it clear that the angular gyrus was correctly identified on 5.0 T but was missing on 3.0 T for both subjects, hence the number of the parcellated sub-regions of DMN-2 was 5 at 5.0 T, and 4 at 3.0 T (Figure 4). Likely, in some other networks (e.g., right VSL-1, bilateral VAN-p, left FPN-p, left FPN-v, bilateral FPN-d, right DMN-p, bilateral DMN-1, and left DMN-2), the number of sub-regions parcellated from 5.0 T images exceeded that from 3.0 T images.
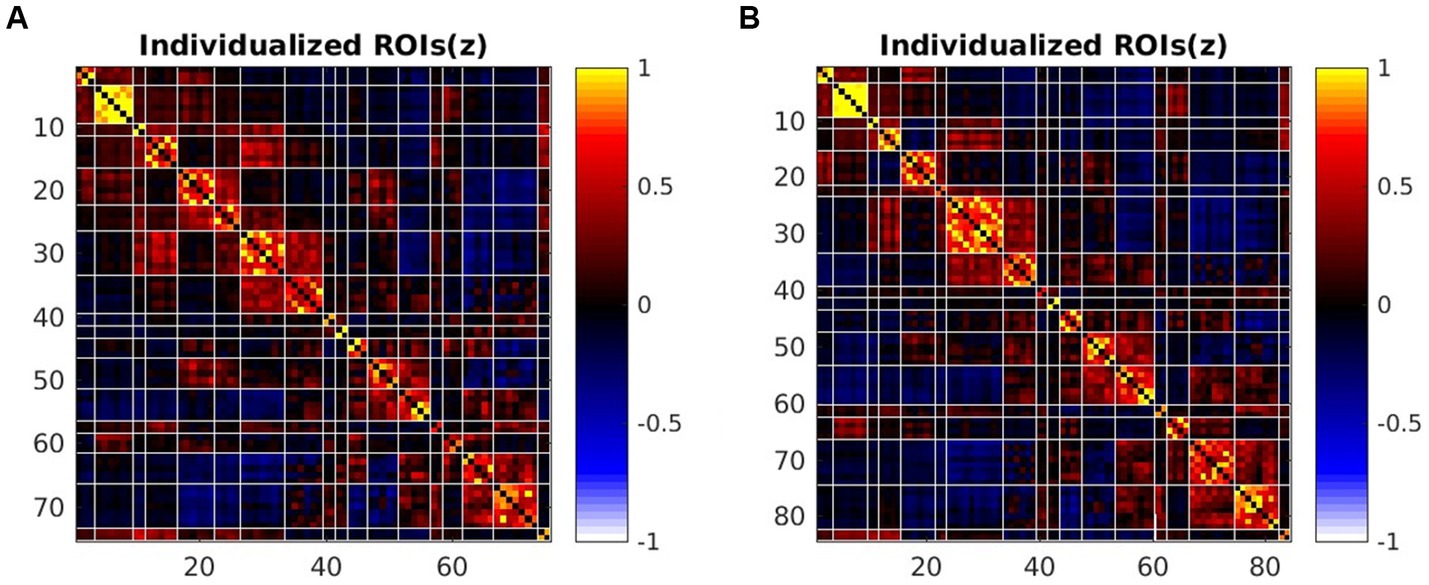
Figure 3. The average FC matrix of sub-regions at 3.0 T and 5.0 T by HFR software. (A) The 75*75 sub-regions FC matrix of 3.0 T images. (B) The 84*84 sub-regions FC matrix of 5.0 T images.
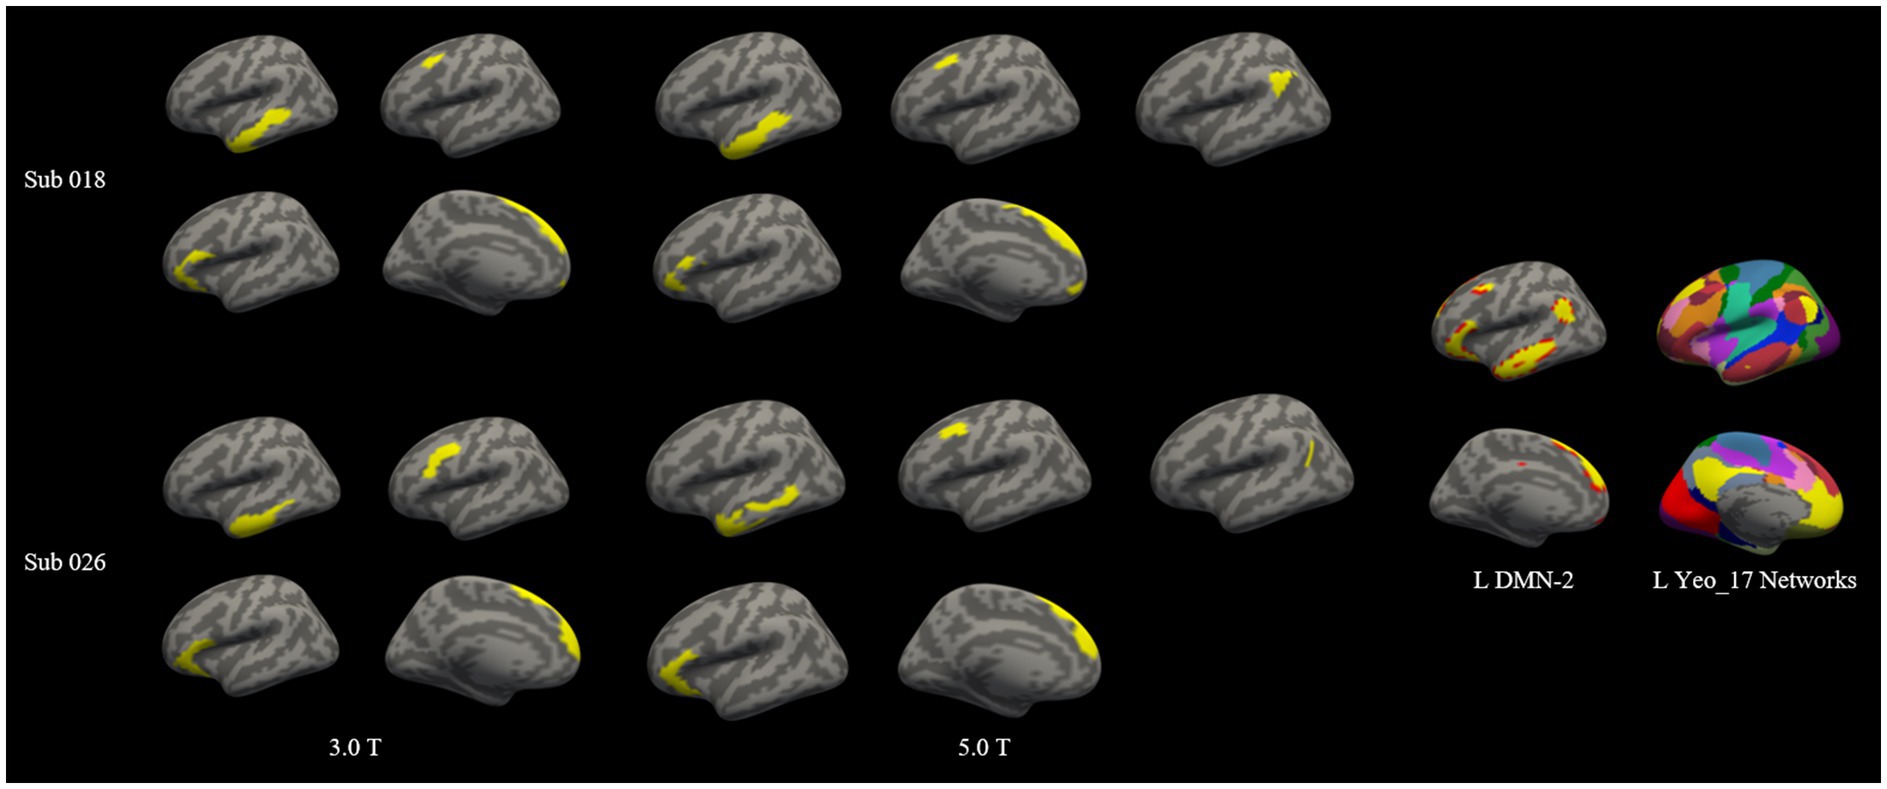
Figure 4. Two representative subjects with high and moderate dice coefficients for the left DMN-2 network at 3.0 T and 5.0 T. Subject 018 was with high dice coefficient (0.8084) and subject 026 was with moderate dice coefficient (0.6119) intra-individually. The individualized left DMN-2 networks were projected onto the individual cortical surface. The spatial distribution of left DMN-2 network was highly similar between 3.0 T and 5.0 T for subject 018, however the spatial distribution of this network was slightly different on 3.0 T and 5.0 T for subject 026. Note that the angular gyrus was correctly identified on 5.0 T but was missing on 3.0 T, hence the number of the parcellated sub-regions of DMN-2 was 5 at 5.0 T, and 4 at 3.0 T.
Consistency of between-network functional connectivity of individualized cortical networks between 3.0 T and 5.0 T images
Significant statistical differences were observed between intra and inter-individuals for the Euclidean distance of the between-network FC matrices (p = 0.006) (Figure 5). The mean Euclidian distance for inter-individuals was higher than that of intra-individuals (11.1647 ± 1.7128 vs. 10.2922 ± 1.4312).
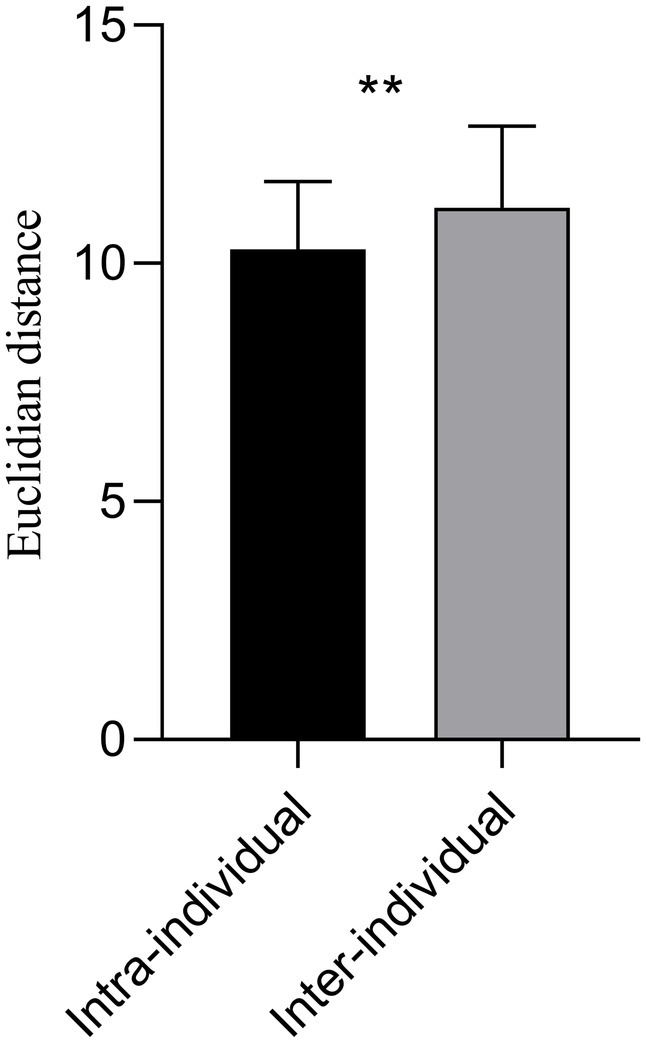
Figure 5. The Euclidian distance of the 36 × 36 averaged FC matrix at 3.0 T and 5.0 T for intra and inter-individual. The mean Euclidian distance for inter-individual was higher than that of intra-individual (11.1647 ± 1.7128 vs. 10.2922 ± 1.4312). Significant statistical difference intra and inter-individuals on the 3.0 T and 5.0 T images was observed (p = 0.006). **p < 0.01.
Graph theory metrics consistency
For correlation analysis of the global network metrics of the between-network FC matrices (size of 36 × 36) between the 3.0 T and 5.0 T images, a positive correlation was observed in metrics such as assortativity (ar, r = 0.403, p = 0.027), network efficiency (aEg, r = 0.507, p = 0.004), characteristic path length (aLambda, r = 0.365, p = 0.047), and normalized characteristic path length (aLp, r = 0.504, p = 0.005) (Figure 6A).
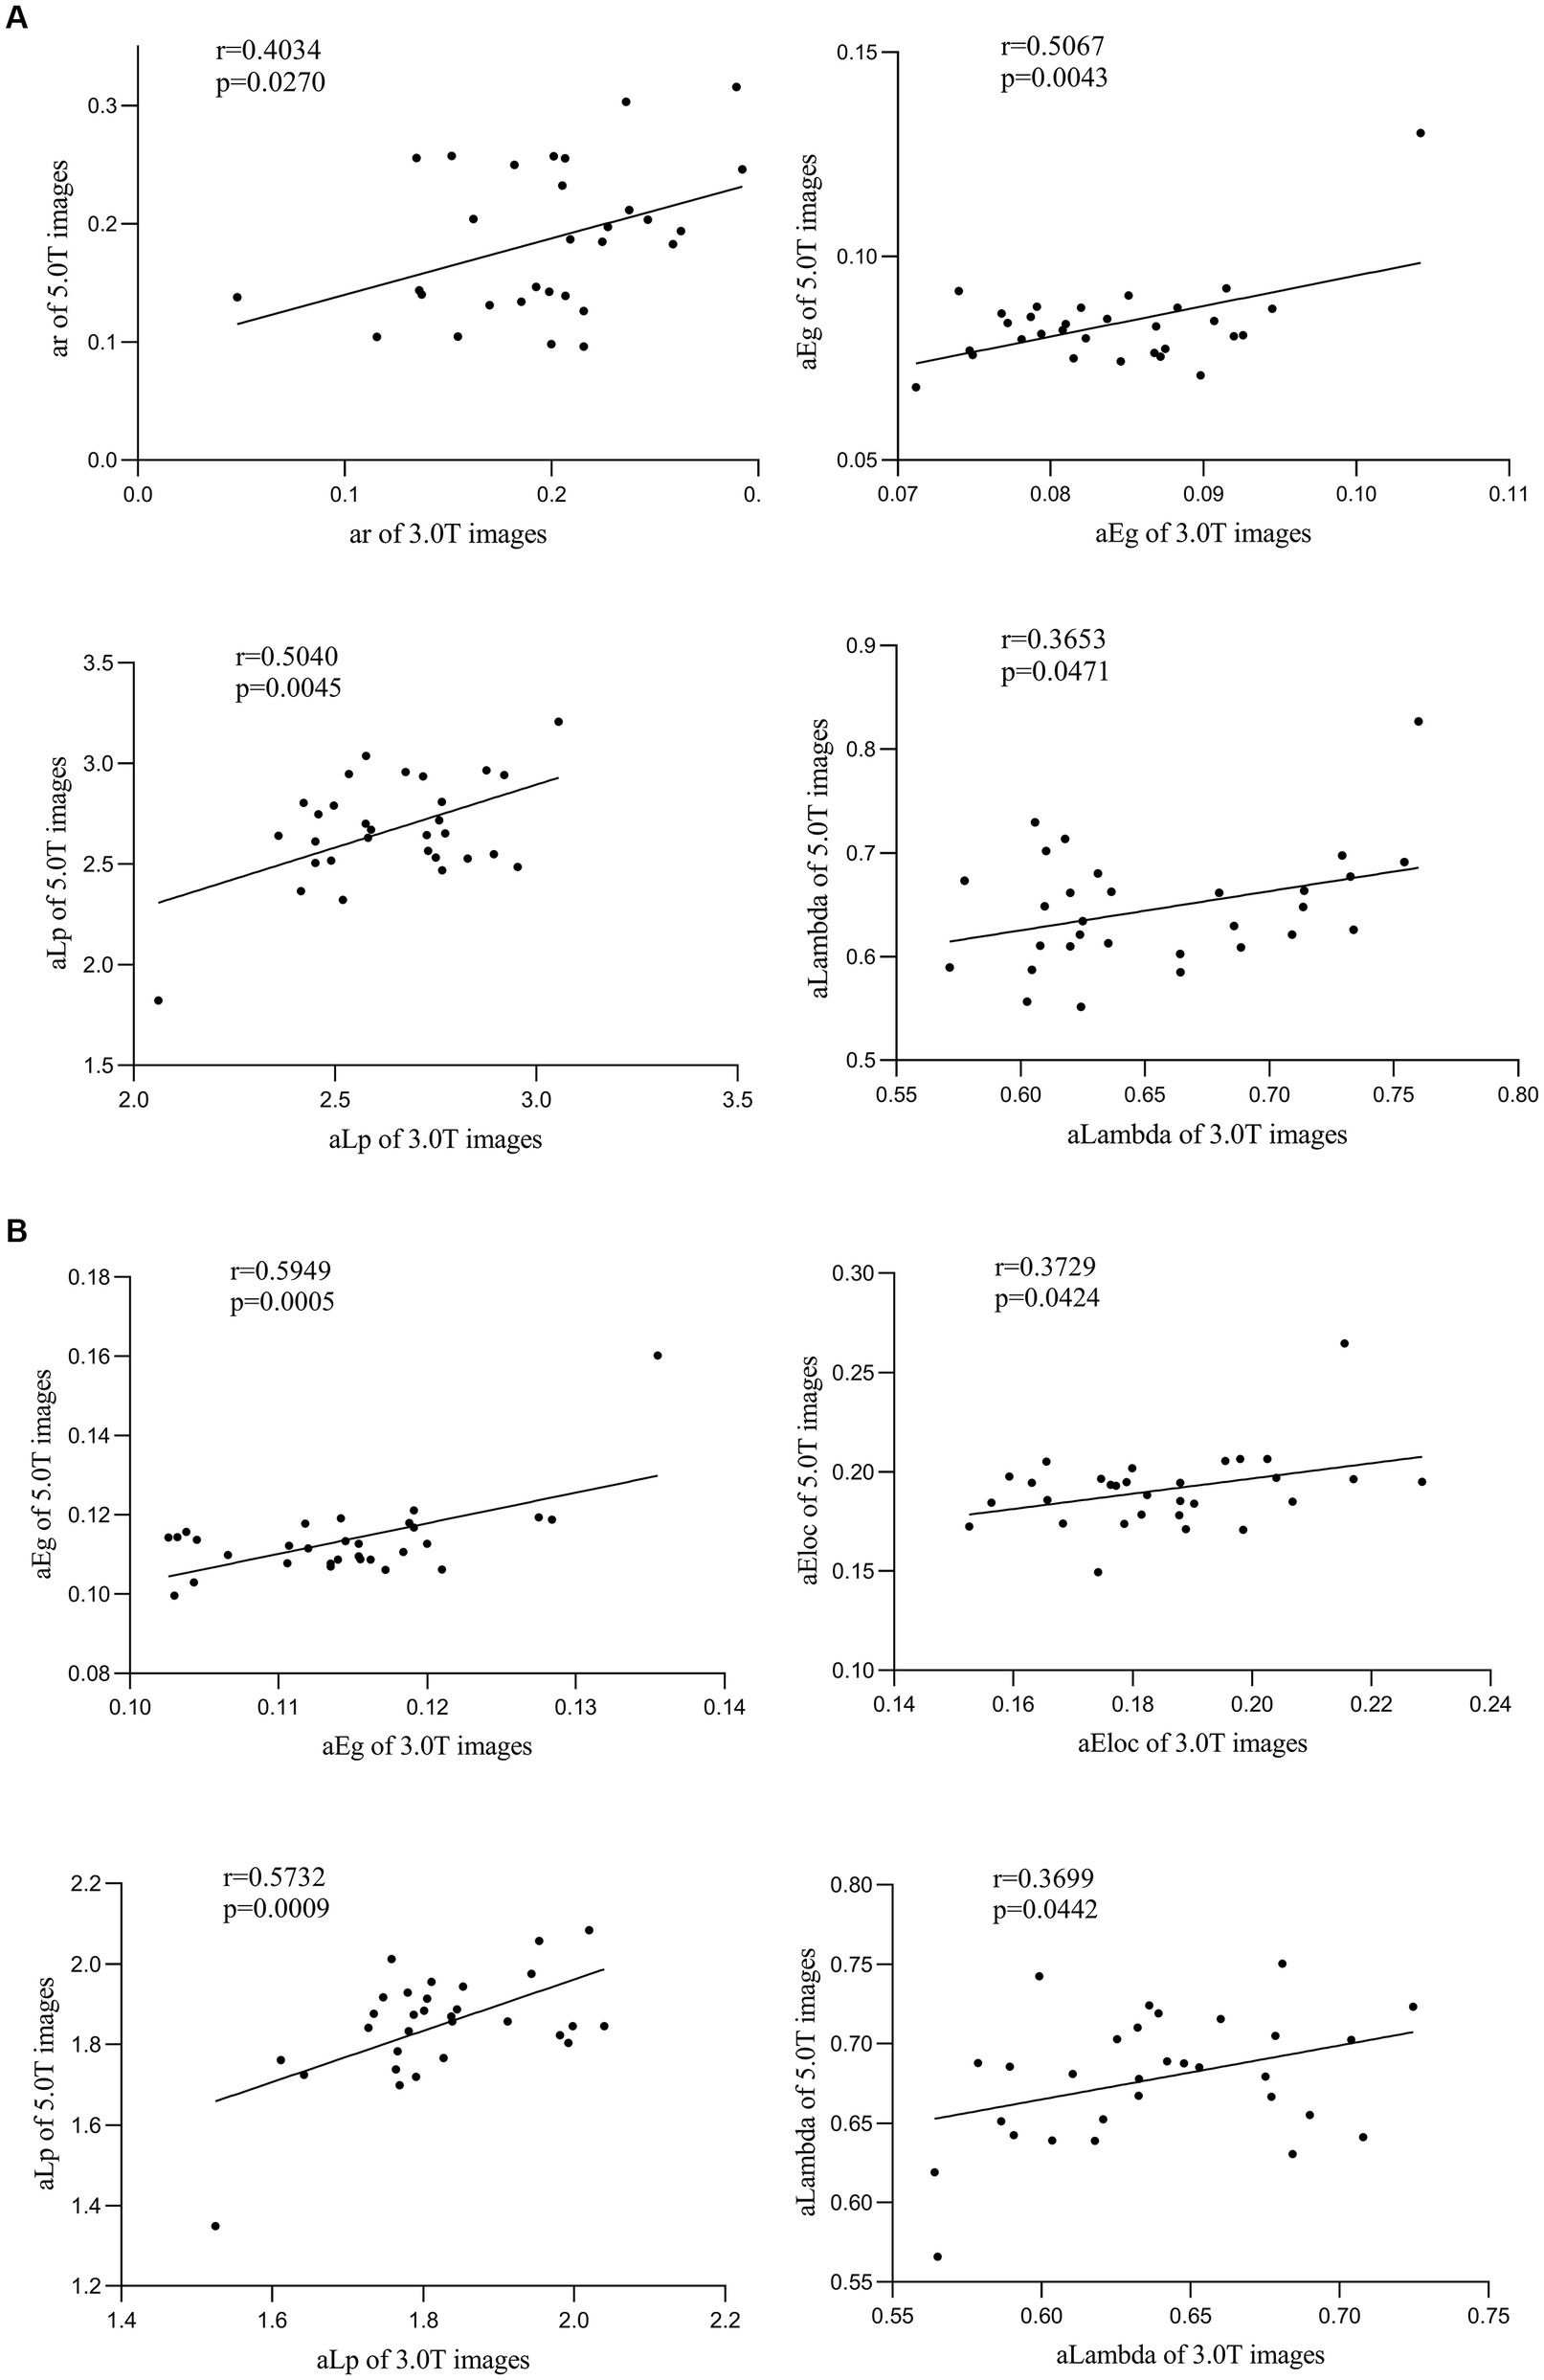
Figure 6. Correlation analysis of functional connectivity matrix of individualized cortical networks between 3.0 T and 5.0 T images. (A) For the 36 × 36 averaged functional connectivity matrix between the 3.0 T and 5.0 T images, a positive correlation in metrics of assortativity (ar, r = 0.403, p = 0.027), network efficiency (aEg, r = 0.507, p = 0.004), characteristic path length (aLambda, r = 0.365, p = 0.047) and normalized characteristic path length (aLp, r = 0.504, p = 0.005) has been observed. (B) For the primitive sub-regions matrix, significant positive correlation between 3.0 T and 5.0 T images of network n (aEg, r = 0.595, p = 0.001; aEloc, r = 0.373, p = 0.042), characteristic path length (aLambda, r = 0.370, p = 0.044) and normalized characteristic path length (aLp, r = 0.573, p = 0.001) was also observed.
Similarly, a significant positive correlation of certain global network metrics was observed in the between-sub-regions matrices (matrix size of 75 × 75 for 3.0 T and matrix size of 84 × 84 for 5.0 T) images obtained from HFR-ai parcellation on (Figure 6B), namely network efficiency (aEg, r = 0.595, p = 0.001; aEloc, r = 0.373, p = 0.042), characteristic path length (aLambda, r = 0.370, p = 0.044) and normalized characteristic path length (aLp, r = 0.573, p = 0.001).
Discussion
Parcellating functional networks across the cerebral cortex in individuals based on functional connectivity is particularly important for personalized diagnosis and treatment (Fan et al., 2020; Gordon et al., 2022). This study represents the first attempt to evaluate the consistency and stability of individualized cortical functional networks parcellation at 3.0 T and 5.0 T MRI. We delineated 18 cortical functional networks based on a previously proposed cortical parcellation algorithm and derived several key findings (Wang et al., 2015). Firstly, the spatial consistency (dice coefficient) of the parcellated 18 networks between 3.0 T and 5.0 T within the same individuals was generally high, surpassing that of inter-individuals. Secondly, the total number of sub-regions obtained by individualized parcellation of cerebral cortex at 5.0 T exceeded that of 3.0 T, indicating a higher sensitivity and enhanced cross-regional contrast achievable at 5.0 T. Thirdly, we observed high consistency of individualized FC between 3.0 T and 5.0 T for the same subject, indicated by a significantly lower Euclidian distance of the between-network FC matrix between 3.0 T and 5.0 T intra-individual than inter-individual. Fourthly, for graph theory analysis of the individualized FC, we identified a significant correlation in graph theory metrics (such as assortativity, network efficiency, and small-worldness) between 3.0 T and 5.0 T. These results helped verify the consistency and stability of individualized cortical functional networks parcellation at 3.0 T and 5.0 T, and demonstrated the variance of cortical networks across individuals (Laumann et al., 2015).
All the parcellated cortical functional networks could be classified into three categories based on the intra-and inter-individual dice coefficients between 3.0 T and 5.0 T. First, the category with a relatively high dice coefficient intra-individual and slight statistic difference between dice coefficient intra and inter-individual. The spatial consistency of these cortical networks within individuals was very high across different magnetic fields, and the spatial variance between individuals was relatively small. The parcellated cortical functional networks of bilateral VSL-1, VSL-2, SMN-d, SMN-v and SMN-h were classified into this category. Previous FC study also revealed that SMN and VSL systems had low inter-subject variability (Mueller et al., 2013), consistent with our findings. Both VSL and SMN are primary sensory and motor networks. The low variabilities of VSL and SMN was related to their dedicated and simpler functions, and their less complicated evolutionary cortical expansion and cortical folding (Hill et al., 2010). Interestingly, we have recognized a new network not labeled independently in Yeo’s 17-network atlas. It was located in the anterior central gyrus (the part of the brain that responsible for hand movement) and was part of the somatomotor network, we named it SMN-h. Quite significant differences between intra and inter-individuals were demonstrated in SMN-h in left hemisphere, but not in SMN-d or SMN-v, nor in the right hemisphere. This provided two implications. First, compared to other SMN sub-networks, SMN-h has more complex functions and greater individual variability. Second, in terms of lateralization, SMN-h in the left hemisphere exhibited more complicated functional activities than that of right hemisphere. This probably can be explained by the fact that the healthy participants included in our study were all right-handed.
The second category of networks showed moderate intra-individual dice coefficients and significant statistical difference between intra-and inter-individual dice coefficients. These networks include the bilateral DAN-p, DAN-a, VAN-p, VAN-a, FPN-p, FPN-v, FPN-d, TPN-t, DMN-p, DMN-1 and DMN-2. The DAN is supposed to be organized bilaterally and comprises the intraparietal sulcus (IPS), the frontal eye fields (FEF) and superior parietal lobule of each hemisphere (Petersen and Posner, 2012; Vossel et al., 2014). The VAN is mainly located in Temporal–parietal junction (right-lateralized) and ventral prefrontal cortex (Vossel et al., 2014), generally considered part of the Salience network. Both DAN and VAN are higher-order cognitive networks, previous studies have shown great variability of these two networks by using different parcellation models (Vossel et al., 2014; Allan et al., 2020; Ramezanpour and Fallah, 2022). FPN is a key component of higher order function network and has extensive connectivity with many different brain networks, making it a functional hub of cognitive functions (Power et al., 2013). The study of precise mapping reflected the large individual variation in the precise anatomy of the FPN (Laumann et al., 2015). In addition, previous study also demonstrated FPN and attentional networks showed high inter-individual variability (Mueller et al., 2013), which was consistent with our results. The studies of DMN are the most extensive (Buckner, 2012). Related experiments analysis of intrinsic connectivity combined with graph-analytic and clustering techniques have demonstrated that DMN comprises two subsystems that interact with a common core, and the subsystems functionally dissociate when under different task or resting-state conditions (Andrews-Hanna et al., 2010). The results of our individualized analysis on different MR fields also confirmed the existence of three sub-networks of DMN. All the above networks are higher-order cognitive networks, thus it is not surprising that these networks showed significant inter-individual variability also less intra-individual consistency than the first category of visual and sensory-motor networks, indirectly reflecting their possible complex functions.
The sole cortical network classified into the third category with a relatively lower intra-and inter-individual dice coefficient was the limbic network (LMB-t and LMB-o). The limbic system can be divided into cortical and sub-cortical limbic regions. While the two sub-networks (LMB-o and LMB-t) we have parcellated seemed to mainly located in other extended nodes referred as the “limbic forebrain” (Morgane et al., 2005). The limbic system has been implicated in memory and mood regulations, and its status may change rapidly according to the subjects’ mood status. Our study suggested that these two networks were highly variable both intra-individual and across individuals, likely due to their involvement in short-term memory processing and mood-related functional activities. Besides, the limbic system areas are close to the bottom of the brain and are very susceptible to low SNR and signal drop, which might be one of the reasons that contributes to the low spatial consistency (dice coefficients) both intra and inter-individually of this network. However, by a visual check of the raw fMRI data (see Supplementary materials), we did not find any significant artefact or distortion of the medial and inferior temporal areas, despite a slightly weaker signal at the temporal pole. Thus, the inter-and intra-variability of the LMB networks is more likely due to the quick neurophysiological changes in these areas.
The total number of individualized homologous functional regions of 5.0 T images was slightly larger than that of 3.0 T images. In 11 of the 36 networks, more sub-regions were parcellated from 5.0 T images, predominantly in networks of FPN, DMN and VAN. This may be due to the superior image quality, higher SNR and CNR of 5.0 T than 3.0 T, and the spatially adjacent but functionally segregated sub-regions are more distinguishable at 5.0 T. We have compared the SNR, tSNR and CNR of the raw resting-state fMRI data between 3.0 T and 5.0 T groups. Results showed that the raw BOLD images at 5.0 T have higher SNR, tSNR and CNR than that at 3.0 T. This was expectable and consistent with previous studies (Triantafyllou et al., 2005; Schafer et al., 2008). The attenuation of intravascular signal from veins at higher field facilitated spatial specificity of detecting neural activity related signal (Gati et al., 1997). Studies on 7.0 T MR have shown that ultra-high field provides significant advantage over lower (3.0 T) field for functional connectivity measurement, based on higher BOLD CNR yielding higher temporal correlation between functionally connected brain areas (Duong et al., 2002; Hale et al., 2010). Another study used increased BOLD contrast-to-noise ratio at 7.0 T to measure the topographic representation of the digits in human somatosensory cortex at 1 mm isotropic resolution in individual subjects, this is almost impossible to achieve at or below 3.0 T field strength (Sanchez-Panchuelo et al., 2010). These results further confirmed that MRI with ultra-high field could obtain finer functional sub-network characteristics.
We further analyzed the consistency of the parcellated networks from a functional connectivity perspective. The mean Euclidian distance of FC matrices for inter-individual at 3.0 T and 5.0 T was significantly higher than for intra-individual. This indicated that functional connectivity between the 36 brain networks obtained by individualized parcellation was consistent within individuals across 3.0 T and 5.0 T, but variable across individuals. Multiple previous studies have also demonstrated the variability of the human cortical spontaneous activity across space, rs-fMRI platforms (3 T and 7 T), and individuals, with higher connectivity variability between participants and the lower connectivity variability within individual participants (Frost and Goebel, 2012; Xing et al., 2023). These findings elucidate individual variances in functional connectivity of cortical networks, and were again validated by our use of individualized parcellation method in high and ultra-high fields.
Correlation analysis of the graph theory global metrics for the between-network FC and sub-regions FC matrix obtained from HFR-ai parcellation showed a positive correlation between the 5.0 T and the 3.0 T matrices. The graph theory analysis results were consistent and correlated under different field strengths. A previous study have reported good or excellent test–retest reliability for many metrics including assortativity, characteristic path length, global efficiency and local efficiency at 3.0 T (Welton et al., 2015). Our results expanded these findings to different magnetic fields.
Several limitations in our study should be acknowledged. First, we set a total of 10 iterations in individualized parcellation based on previous reference (Wang et al., 2015). However, at 5.0 T, 10 iterations may not capture all individualized parcellation details. Thus probably resulting in fewer sub-regions parcellated for some networks at 5.0 T than 3.0 T. In the future, we intend to set more iterations at 5.0 T to evaluate the performance of individualized parcellation. Second, we set the same TE values of 25 ms and flip angle of 90° at 5.0 T MR with 3.0 T. These TE and flip angle values were very commonly used parameter settings, while it may not be the optimal for the 5.0 T field strength. For 5.0 T images, the optimal TE and Ernst angle is not clear and have not been reported. Yacoub et al. have reported TE = 25 ms was the optimal TE to be used in 7.0 T BOLD fMRI in the human visual cortex, while 35 ms was optimal TE at 4.0 T (Yacoub et al., 2001). Gonzalez-Castillo et al. have reported that for the gray matter compartment, the Ernst angle was 77° at 3.0 T BOLD fMRI. While using lower flip angles in 3.0 T BOLD fMRI experimentation may have benefits such as reduction of RF power, limitation of apparent T1-related inflow effects, reduction of through-plane motion artifacts and lower levels of physiological noise (Gonzalez-Castillo et al., 2011). More studies are needed to explore the optimal parameter for the BOLD images at 5.0 T MR. Third, we did not collect multiple resting-state scanning sessions at 3.0 T and 5.0 T. Previous study has confirmed the consistency of individualized parcellation at 3.0 T, indicating that the consistency and stability were reliable on the same field strength (Wang et al., 2015). Considering the purpose of our study was to explore the consistency and stability of individualized parcellation across different magnetic fields, only one session was collected for each field. Finally, we investigated the individual-specific functional connectivity by resting-state fMRI, while task-evoked conditions need further evaluation to draw similar conclusions.
In conclusion, we have confirmed that individualized cortical functional networks at different magnetic fields had consistent and stable parcellation results both spatially and functionally. The 5.0 T BOLD fMRI has higher SNR and CNR than 3.0 T and provides finer functional sub-network characteristics of individualized cortical functional networks parcellation. These results have laid the foundation for future application of individualized cortical functional networks parcellation at 5.0 T and other ultra-high field MR.
Data availability statement
The raw data supporting the conclusions of this article will be made available by the authors, without undue reservation.
Ethics statement
The studies involving humans were approved by Medical Research Ethics Committee and Institutional Review Board of Zhongnan Hospital. The studies were conducted in accordance with the local legislation and institutional requirements. The participants provided their written informed consent to participate in this study.
Author contributions
MY: Writing – review & editing, Writing – original draft, Visualization, Validation, Supervision, Software, Resources, Project administration, Methodology, Investigation, Funding acquisition, Formal analysis, Data curation, Conceptualization. BR: Writing – review & editing, Writing – original draft, Visualization, Validation, Supervision, Software, Resources, Project administration, Methodology, Investigation, Funding acquisition, Formal analysis, Data curation, Conceptualization. YC: Writing – review & editing, Writing – original draft, Visualization, Validation, Supervision, Software, Resources, Project administration, Methodology, Investigation, Funding acquisition, Formal analysis, Data curation, Conceptualization. LG: Writing – review & editing, Methodology, Formal analysis. HL: Writing – review & editing, Visualization, Validation, Supervision, Methodology, Funding acquisition. XS: Writing – review & editing, Visualization, Validation, Supervision, Methodology, Funding acquisition. HX: Writing – review & editing, Visualization, Validation, Supervision, Methodology, Funding acquisition, Conceptualization.
Funding
The author(s) declare that financial support was received for the research, authorship, and/or publication of this article. This study was funded by the research fund from the National Natural Science Foundation of China (grant no. 82271960 and 22327901).
Acknowledgments
We would like to thank those who helped us in our department for their help during this study. We gratefully acknowledge Ms. Weiyin Vivian Liu from GE Healthcare for help in solving MR technical problems. We want to extend our thanks to Central Research Institute of United Imaging Healthcare for technical support. We would also like to thank all the subjects who participated in our study.
Conflict of interest
The authors declare that the research was conducted in the absence of any commercial or financial relationships that could be construed as a potential conflict of interest.
Publisher’s note
All claims expressed in this article are solely those of the authors and do not necessarily represent those of their affiliated organizations, or those of the publisher, the editors and the reviewers. Any product that may be evaluated in this article, or claim that may be made by its manufacturer, is not guaranteed or endorsed by the publisher.
Supplementary material
The Supplementary material for this article can be found online at: https://www.frontiersin.org/articles/10.3389/fnins.2024.1425032/full#supplementary-material
Footnotes
References
Allan, P. G., Briggs, R. G., Conner, A. K., O'Neal, C. M., Bonney, P. A., Maxwell, B. D., et al. (2020). Parcellation-based tractographic modeling of the ventral attention network. J. Neurol. Sci. 408:116548. doi: 10.1016/j.jns.2019.116548
Andrews-Hanna, J. R., Reidler, J. S., Sepulcre, J., Poulin, R., and Buckner, R. L. (2010). Functional-anatomic fractionation of the brain's default network. Neuron 65, 550–562. doi: 10.1016/j.neuron.2010.02.005
Barch, D. M., Burgess, G. C., Harms, M. P., Petersen, S. E., Schlaggar, B. L., Corbetta, M., et al. (2013). Function in the human connectome: task-fMRI and individual differences in behavior. NeuroImage 80, 169–189. doi: 10.1016/j.neuroimage.2013.05.033
Bressler, S. L., and Menon, V. (2010). Large-scale brain networks in cognition: emerging methods and principles. Trends Cogn. Sci. 14, 277–290. doi: 10.1016/j.tics.2010.04.004
Buckner, R. L. (2012). The serendipitous discovery of the brain's default network. NeuroImage 62, 1137–1145. doi: 10.1016/j.neuroimage.2011.10.035
de Hollander, G., Keuken, M. C., van der Zwaag, W., Forstmann, B. U., and Trampel, R. (2017). Comparing functional MRI protocols for small, iron-rich basal ganglia nuclei such as the subthalamic nucleus at 7 T and 3 T. Hum. Brain Mapp. 38, 3226–3248. doi: 10.1002/hbm.23586
Duong, T. Q., Yacoub, E., Adriany, G., Hu, X., Ugurbil, K., Vaughan, J. T., et al. (2002). High-resolution, spin-echo BOLD, and CBF fMRI at 4 and 7 T. Magn. Reson. Med. 48, 589–593. doi: 10.1002/mrm.10252
Eickhoff, S. B., Constable, R. T., and Yeo, B. (2018). Topographic organization of the cerebral cortex and brain cartography. NeuroImage 170, 332–347. doi: 10.1016/j.neuroimage.2017.02.018
Fan, Y. S., Li, L., Peng, Y., Li, H., Guo, J., Li, M., et al. (2020). Individual-specific functional connectome biomarkers predict schizophrenia positive symptoms during adolescent brain maturation. Hum. Brain Mapp. 42, 1475–1484. doi: 10.1002/hbm.25307
Felleman, D. J., and Van Essen, D. C. (1991). Distributed hierarchical processing in the primate cerebral cortex. Cereb. Cortex 1, 1–47. doi: 10.1093/cercor/1.1.1
Fischl, B., and Dale, A. M. (2000). Measuring the thickness of the human cerebral cortex from magnetic resonance images. Proc. Natl. Acad. Sci. USA 97, 11050–11055. doi: 10.1073/pnas.200033797
Friston, K. J., Frith, C. D., Liddle, P. F., and Frackowiak, R. S. J. (1993). Functional connectivity: the principal-component analysis of large (PET) data sets. J. Cereb. Blood Flow Metab. 13, 5–14. doi: 10.1038/jcbfm.1993.4
Frost, M. A., and Goebel, R. (2012). Measuring structural-functional correspondence: spatial variability of specialised brain regions after macro-anatomical alignment. NeuroImage 59, 1369–1381. doi: 10.1016/j.neuroimage.2011.08.035
Gati, J. S., Menon, R. S., Uǧurbil, K., and Rutt, B. K. (1997). Experimental determination of the BOLD field strength dependence in vessels and tissue. Magn. Reson. Med. 38, 296–302. doi: 10.1002/mrm.1910380220
Glasser, M. F., Smith, S. M., Marcus, D. S., Andersson, J. L. R., Auerbach, E. J., Behrens, T. E. J., et al. (2016). The human connectome Project's neuroimaging approach. Nat. Neurosci. 19, 1175–1187. doi: 10.1038/nn.4361
Gonzalez-Castillo, J., Roopchansingh, V., Bandettini, P. A., and Bodurka, J. (2011). Physiological noise effects on the flip angle selection in BOLD fMRI. NeuroImage 54, 2764–2778. doi: 10.1016/j.neuroimage.2010.11.020
Gordon, E. M., Marek, S., Newbold, D. J., Hampton, J. M., and Seider, N. A. (2022). Individualized functional subnetworks connect human striatum and frontal cortex. Cereb. Cortex 32, 2868–2884. doi: 10.1093/cercor/bhab387
Hale, J. R., Brookes, M. J., Hall, E. L., Zumer, J. M., Stevenson, C. M., Francis, S. T., et al. (2010). Comparison of functional connectivity in default mode and sensorimotor networks at 3 and 7T. MAGMA 23, 339–349. doi: 10.1007/s10334-010-0220-0
Han, S., Eun, S., Cho, H. J., Uludaǧ, K., and Kim, S. G. (2021). Improvement of sensitivity and specificity for laminar BOLD fMRI with double spin-echo EPI in humans at 7 T. NeuroImage 241:118435. doi: 10.1016/j.neuroimage.2021.118435
Han, M., Yang, G., Li, H., Zhou, S., Xu, B., Jiang, J., et al. (2020). Individualized cortical Parcellation based on diffusion MRI Tractography. Cereb. Cortex 30, 3198–3208. doi: 10.1093/cercor/bhz303
Hill, J., Dierker, D., Neil, J., Inder, T., Knutsen, A., Harwell, J., et al. (2010). A surface-based analysis of hemispheric asymmetries and folding of cerebral cortex in term-born human infants. J. Neurosci. 30, 2268–2276. doi: 10.1523/JNEUROSCI.4682-09.2010
Kaas, J. H. (1987). The organization of neocortex in mammals: implications for theories of brain function. Annu. Rev. Psychol. 38, 129–151. doi: 10.1146/annurev.ps.38.020187.001021
Laumann, T. O., Gordon, E. M., Adeyemo, B., Snyder, A. Z., Joo, S. J., Chen, M. Y., et al. (2015). Functional system and areal Organization of a Highly Sampled Individual Human Brain. Neuron 87, 657–670. doi: 10.1016/j.neuron.2015.06.037
Marcus, D. S., Harwell, J., Olsen, T., Hodge, M., Glasser, M. F., Prior, F., et al. (2011). Informatics and data mining tools and strategies for the human connectome project. Front. Neuroinform. 5:4. doi: 10.3389/fninf.2011.00004
Morgane, P. J., Galler, J. R., and Mokler, D. J. (2005). A review of systems and networks of the limbic forebrain/limbic midbrain. Prog. Neurobiol. 75, 143–160. doi: 10.1016/j.pneurobio.2005.01.001
Mueller, S., Wang, D., Fox, M. D., Yeo, B. T., Sepulcre, J., Sabuncu, M. R., et al. (2013). Individual variability in functional connectivity architecture of the human brain. Neuron 77, 586–595. doi: 10.1016/j.neuron.2012.12.028
Petersen, S. E., and Posner, M. I. (2012). The attention system of the human brain: 20 years after. Annu. Rev. Neurosci. 35, 73–89. doi: 10.1146/annurev-neuro-062111-150525
Power, J. D., Schlaggar, B. L., Lessov-Schlaggar, C. N., and Petersen, S. E. (2013). Evidence for hubs in human functional brain networks. Neuron 79, 798–813. doi: 10.1016/j.neuron.2013.07.035
Prudent, V., Kumar, A., Liu, S., Wiggins, G., Malaspina, D., and Gonen, O. (2010). Human hippocampal subfields in young adults at 7.0 T: feasibility of imaging. Radiology 254, 900–906. doi: 10.1148/radiol.09090897
Ramezanpour, H., and Fallah, M. (2022). The role of temporal cortex in the control of attention. Curr. Res. Neurobiol. 3:100038. doi: 10.1016/j.crneur.2022.100038
Sanchez-Panchuelo, R. M., Francis, S., Bowtell, R., and Schluppeck, D. (2010). Mapping human somatosensory cortex in individual subjects with 7T functional MRI. J. Neurophysiol. 103, 2544–2556. doi: 10.1152/jn.01017.2009
Schafer, A., Zwaag, W., Francis, S. T., Head, K. E., Gowland, P. A., and Bowtell, R. W. (2008). High resolution SE-fMRI in humans at 3 and 7 T using a motor task. MAGMA 21, 113–120. doi: 10.1007/s10334-007-0099-6
Smith, S. M., Beckmann, C. F., Andersson, J., Auerbach, E. J., Bijsterbosch, J., Douaud, G., et al. (2013). Resting-state fMRI in the human connectome project. NeuroImage 80, 144–168. doi: 10.1016/j.neuroimage.2013.05.039
Triantafyllou, C., Hoge, R. D., Krueger, G., Wiggins, C. J., Potthast, A., Wiggins, G. C., et al. (2005). Comparison of physiological noise at 1.5 T, 3 T and 7 T and optimization of fMRI acquisition parameters. NeuroImage 26, 243–250. doi: 10.1016/j.neuroimage.2005.01.007
Vossel, S., Geng, J. J., and Fink, G. R. (2014). Dorsal and ventral attention systems: distinct neural circuits but collaborative roles. Neuroscientist 20, 150–159. doi: 10.1177/1073858413494269
Wang, D., Buckner, R. L., Fox, M. D., Holt, D. J., Holmes, A. J., Stoecklein, S., et al. (2015). Parcellating cortical functional networks in individuals. Nat. Neurosci. 18, 1853–1860. doi: 10.1038/nn.4164
Wang, K., Smolker, H. R., Brown, M. S., Snyder, H. R., Hankin, B. L., and Banich, M. T. (2020). Association of gamma-aminobutyric acid and glutamate/glutamine in the lateral prefrontal cortex with patterns of intrinsic functional connectivity in adults. Brain Struct. Funct. 225, 1903–1919. doi: 10.1007/s00429-020-02084-9
Welton, T., Kent, D. A., Auer, D. P., and Dineen, R. A. (2015). Reproducibility of graph-theoretic brain network metrics: a systematic review. Brain Connect. 5, 193–202. doi: 10.1089/brain.2014.0313
Xing, X. X., Gao, X., and Jiang, C. (2023). Individual variability of human cortical spontaneous activity by 3T/7T fMRI. Neuroscience 528, 117–128. doi: 10.1016/j.neuroscience.2023.07.032
Yacoub, E., Shmuel, A., Pfeuffer, J., van de Moortele, P. F., Adriany, G., Andersen, P., et al. (2001). Imaging brain function in humans at 7 tesla. Magn. Reson. Med. 45, 588–594. doi: 10.1002/mrm.1080
Yeo, B. T., Krienen, F. M., Sepulcre, J., Sabuncu, M. R., Lashkari, D., Hollinshead, M., et al. (2011). The organization of the human cerebral cortex estimated by intrinsic functional connectivity. J. Neurophysiol. 106, 1125–1165. doi: 10.1152/jn.00338.2011
Keywords: 5.0 T, resting-state fMRI, individualized parcellation, sub-networks, consistency, stability
Citation: Yu M, Rao B, Cao Y, Gao L, Li H, Song X and Xu H (2024) Consistency and stability of individualized cortical functional networks parcellation at 3.0 T and 5.0 T MRI. Front. Neurosci. 18:1425032. doi: 10.3389/fnins.2024.1425032
Edited by:
Mingrui Xia, Beijing Normal University, ChinaCopyright © 2024 Yu, Rao, Cao, Gao, Li, Song and Xu. This is an open-access article distributed under the terms of the Creative Commons Attribution License (CC BY). The use, distribution or reproduction in other forums is permitted, provided the original author(s) and the copyright owner(s) are credited and that the original publication in this journal is cited, in accordance with accepted academic practice. No use, distribution or reproduction is permitted which does not comply with these terms.
*Correspondence: Huan Li, Y250bGhAd2h1LmVkdS5jbg==; Xiaopeng Song, c29uZ3hwQHBrdS5lZHUuY24=; Haibo Xu, eHVoYWlib0B3aHUuZWR1LmNu
†These authors share first authorship
 Minhua Yu
 Bo Rao
 Yayun Cao1†
 Lei Gao
 Xiaopeng Song
 Haibo Xu