 Hui Xu1,2*
 Guanghui Bai
 Bo Yin
- 1Department of Neurosurgery, The Second Affiliated Hospital and Yuying Children’s Hospital of Wenzhou Medical University, Wenzhou, Zhejiang, China
- 2Peter Boris Centre for Addictions Research, St. Joseph’s Healthcare Hamilton, McMaster University, Hamilton, ON, Canada
- 3School of Psychology and Cognitive Science, East China Normal University, Shanghai, China
- 4Faculty of Psychology, Tianjin Normal University, Tianjin, China
- 5Department of Radiology, The Second Affiliated Hospital and Yuying Children’s Hospital of Wenzhou Medical University, Wenzhou, Zhejiang, China
Background: Crystallized intelligence (Gc) and fluid intelligence (Gf) are regarded as distinct intelligence components that statistically correlate with each other. However, the distinct neuroanatomical signatures of Gc and Gf in adults remain contentious.
Methods: Machine learning cross-validated elastic net regression models were performed on the Human Connectome Project Young Adult dataset (N = 1089) to characterize the neuroanatomical patterns of structural magnetic resonance imaging variables that are associated with Gc and Gf. The observed relationships were further examined by linear mixed-effects models. Finally, intraclass correlations were computed to examine the similarity of the neuroanatomical correlates between Gc and Gf.
Results: The results revealed distinct multi-region neuroanatomical patterns predicted Gc and Gf, respectively, which were robust in a held-out test set (R2 = 2.40, 1.97%, respectively). The relationship of these regions with Gc and Gf was further supported by the univariate linear mixed effects models. Besides that, Gc and Gf displayed poor neuroanatomical similarity.
Conclusion: These findings provided evidence that distinct machine learning-derived neuroanatomical patterns could predict Gc and Gf in healthy adults, highlighting differential neuroanatomical signatures of different aspects of intelligence.
1. Introduction
General intelligence is defined as a general capability to understand complex ideas, adapt flexibly to the changing environment, solve problems, and engage in critical reasoning (Neisser et al., 1996; Gottfredson, 1997). Markers of neural substrates in brain regions and genetic biomarkers have been closely linked to intelligence (Posthuma et al., 2002; Genç et al., 2018), prompting the use of neuroimaging techniques to uncover the neural signature of intelligence. Furthermore, general intelligence has been postulated to consist of two independent components, crystallized intelligence (Gc) and fluid intelligence (Gf) (Cattell, 1943). While Gc reflects our ability to acquire skills through knowledge and experience and is related to verbal ability and general knowledge (Deary et al., 2007; Yuan et al., 2018), Gf refers to the capacity for problem-solving and logical reasoning and is suggested as one of the most important features associated with various cognitive abilities (Varriale et al., 2018). Despite the evidence that Gc and Gf are regarded as distinct intelligence components that statistically correlate with each other (Cattell, 1943; Li et al., 2004), it remains contentious whether there are distinct neuroanatomical signatures of Gc and Gf in adults.
An increasing number of functional magnetic resonance imaging (MRI) studies have found that Gf is linked with multiple cortical regions, which is postulated by the Parieto-Frontal Integration Theory (P-FIT) (Gray et al., 2003; Jung and Haier, 2007; Cipolotti et al., 2022). Based on P-FIT, Gf is linked to the executive network, which includes the dorsolateral prefrontal cortex, inferior and superior parietal lobules, and anterior cingulate gyrus (Jung and Haier, 2007). This explains the goal-directed behavior that is expressed by individual differences in Gf (Barbey et al., 2013; Barbey, 2018). Additionally, substantial evidence from structural MRI (sMRI) studies found higher Gc expression, which remained stable over time. The Gc level was associated with greater gray matter volume (GMV) reduction, and thinning of the cortex thickness (CT) (Yuan et al., 2018). Moreover, individual differences in Gc may depend on declarative knowledge stored in the temporal lobe and inferior prefrontal cortex, leading to widespread cortical region differences across individuals (Martin and Chao, 2001; McClelland and Rogers, 2003; Gainotti, 2006). Furthermore, Gf and Gc exhibit distinct trajectories of development (McArdle et al., 2000). However, these studies investigated the neural substrates of Gc and Gf using different models of modalities. These studies had small sample sizes for brain-intelligence associations using MRI (Marek et al., 2022), which led to low sensitivity for true effects (i.e., type I error) and increased risk for false positives (i.e., type II error) (Button et al., 2013).
Recently, studies started adopting larger samples to characterize the neuroanatomical correlates of Gc and Gf. One study used a large cohort of adults from the Human Connectome Project (HCP) and reported higher performance in Gf, which was associated with cortical expansion in regions related to working memory, attention, and visuospatial processing. In contrast, Gc was associated with thinner CT and higher cortical surface area (CSA) in language-related networks (N = 740) (Tadayon et al., 2020). Another Adolescent Brain Cognitive Development study (N = 10,652) conducted a double generalized linear model to assess the independent association between the mean and dispersion of CT/CSA and intelligence. It was found that higher intelligence in preadolescents was associated with higher mean CT in orbitofrontal and primary sensory cortices but with lower CT in the dorsolateral and medial prefrontal cortex, particularly in the rostral anterior cingulate (Zhao et al., 2022). However, these two studies were conducted using mass univariate approaches without cross-validation (CV), which might increase the risks of overfitting. In contrast, machine learning approaches with CV can assess and prevent overfitting more effectively than univariate approaches, ultimately leading to more generalized findings. One example of a machine learning approach is elastic net regression (ENR), which is an ideal approach to analyzing a large number of inter-correlated variables or predictors (Zou and Hastie, 2005; Owens et al., 2022). One study tested numerous machine learning algorithms for their effectiveness in the context of neuroimaging data and found that ENR models with CV performed well over a range of sample sizes as compared to other approaches (Jollans et al., 2019).
Several recent machine learning studies with CV comprehensively investigated predictive intelligence. Two moderately large studies (N = 415 and 392, respectively) found that distinct functional and structural connections contributed to the prediction of individual Gc and Gf (Dhamala et al., 2021), and the findings revealed neurobiological features of the functional connectome of Gc and Gf across the sexes (Dhamala et al., 2022). Additionally, another study (N = 308) reported that absolute GMV enabled significant predictions of individual intelligence scores (Hilger et al., 2020). However, these studies had several limitations. Firstly, the samples were enrolled from datasets with a relatively small sample size (less than 500). Secondly, these studies only investigated functional and structural connections or one neuroanatomical measure, GMV, and their relationship with intelligence. However, cortical GMV comprises CT and cortical surface area (CSA), which are known to be distinct morphological features of the cortical architecture (Tadayon et al., 2020). Both CT and CSA have distinct developmental trajectories and uncorrelated genetic backgrounds (Storsve et al., 2014), suggesting that CSA and CT should be considered separate morphometric features in neurodevelopment (Panizzon et al., 2009; Xu et al., 2023b).
To address these limitations, the current study used a machine learning approach to predict Gc and Gf from CSA, CT, and GMV. Data were drawn from the HCP, which remains one of the largest studies to date with contemporaneously collected Gc, Gf, and sMRI data. This study conducted ENR models with the CV approach, which is well suited to assess the overfitting and generalization of findings (Xu et al., 2023a). This approach simultaneously investigates all brain morphological variables as predictors of a target. Hence, this approach elucidates the neuroanatomical structures that are uniquely important to Gc and Gf. As a secondary strategy, this study also used a traditional univariate approach (linear mixed effects modeling) to confirm the presence of a univariate relationship between Gc and Gf and the neuroanatomical features contributing to the ENR models. Furthermore, intraclass correlation analyses were performed to examine the neuroanatomical pattern similarity of Gc and Gf. This study aimed to investigate whether Gc and Gf could be effectively predicted in an independent sample using a machine learning approach and uncover the distinct neuroanatomical patterns of Gc and Gf in adults.
2. Materials and methods
2.1. Participants
In this study, the HCP release S1200 dataset was used. Participants were recruited at Washington University in St. Louis over 2 days between August 2012 and October 2015 (Van Essen et al., 2012). The protocols were approved by each institution’s research ethics board. All participants provided written informed consent in accordance with the Declaration of Helsinki. All participants were young adults between 22 and 35 years old. The exclusion criteria were as follows: history of psychiatric disorder, substance abuse, neurodevelopmental disorder or damage, cardiovascular disease, severe health conditions (such as diabetes, multiple sclerosis, cerebral palsy, premature birth), or MRI contraindications (large tattoos, non-removable piercings, metal devices in the body or claustrophobia, etc.). The complete details of the inclusion and exclusion criteria and the informed consent for participants can be found in references (Van Essen et al., 2012, 2013). Some participants were excluded from further analysis due to the following reasons: missing sMRI scans, missing demographic data, and missing behavioral data. A total of 1,089 participants (90.75% of the initial sample size) were included in the final analysis (Table 1).
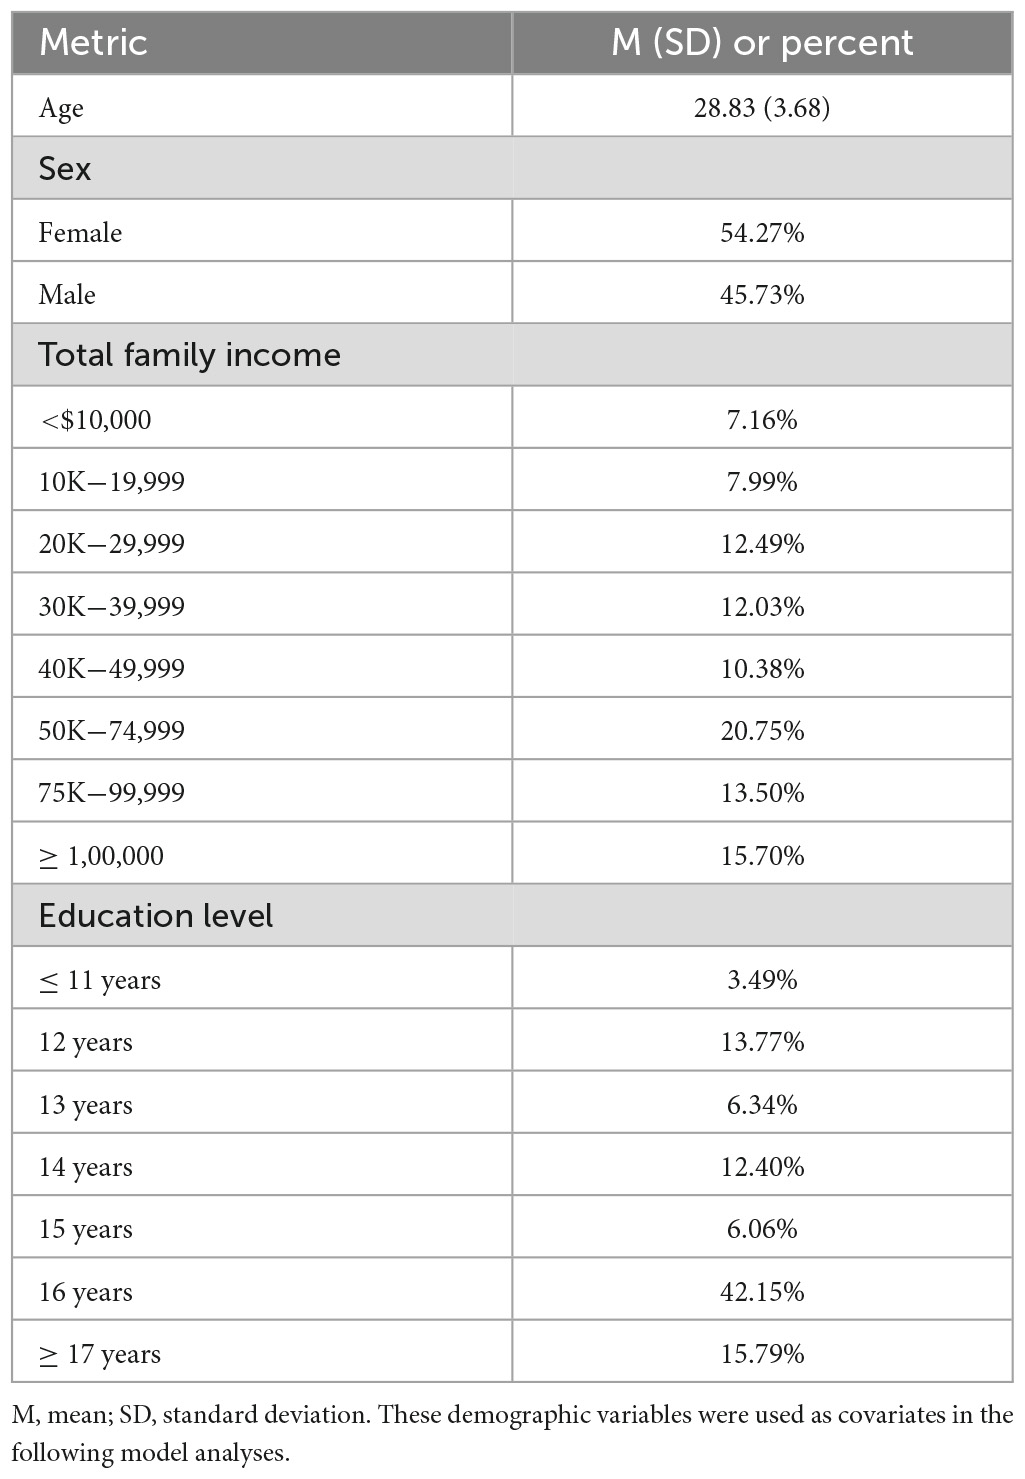
Table 1. Demographic characteristics of sample (N = 1089).
2.2. Intelligence assessment
Cognitive ability was assessed by the NIH Toolbox Cognition Battery with extensively validated neuropsychological tasks (Mungas et al., 2014). Two composite scores (crystallized cognition composite and fluid cognition composite) were derived from the scores of participants when performing NIH Toolbox Cognitive Battery tasks (Mungas et al., 2014). Gc was measured by Picture Vocabulary and Oral Reading Recognition Tests, which assessed language and verbal skills. Likewise, Gf was measured using the Dimensional Change Card Sort, Flanker Inhibitory Control and Attention Test, Picture Sequence Memory, List Sorting Working Memory, and the Pattern Comparison Processing Speed Test, which broadly assessed processing speed, memory, and executive functioning (Figure 1A).
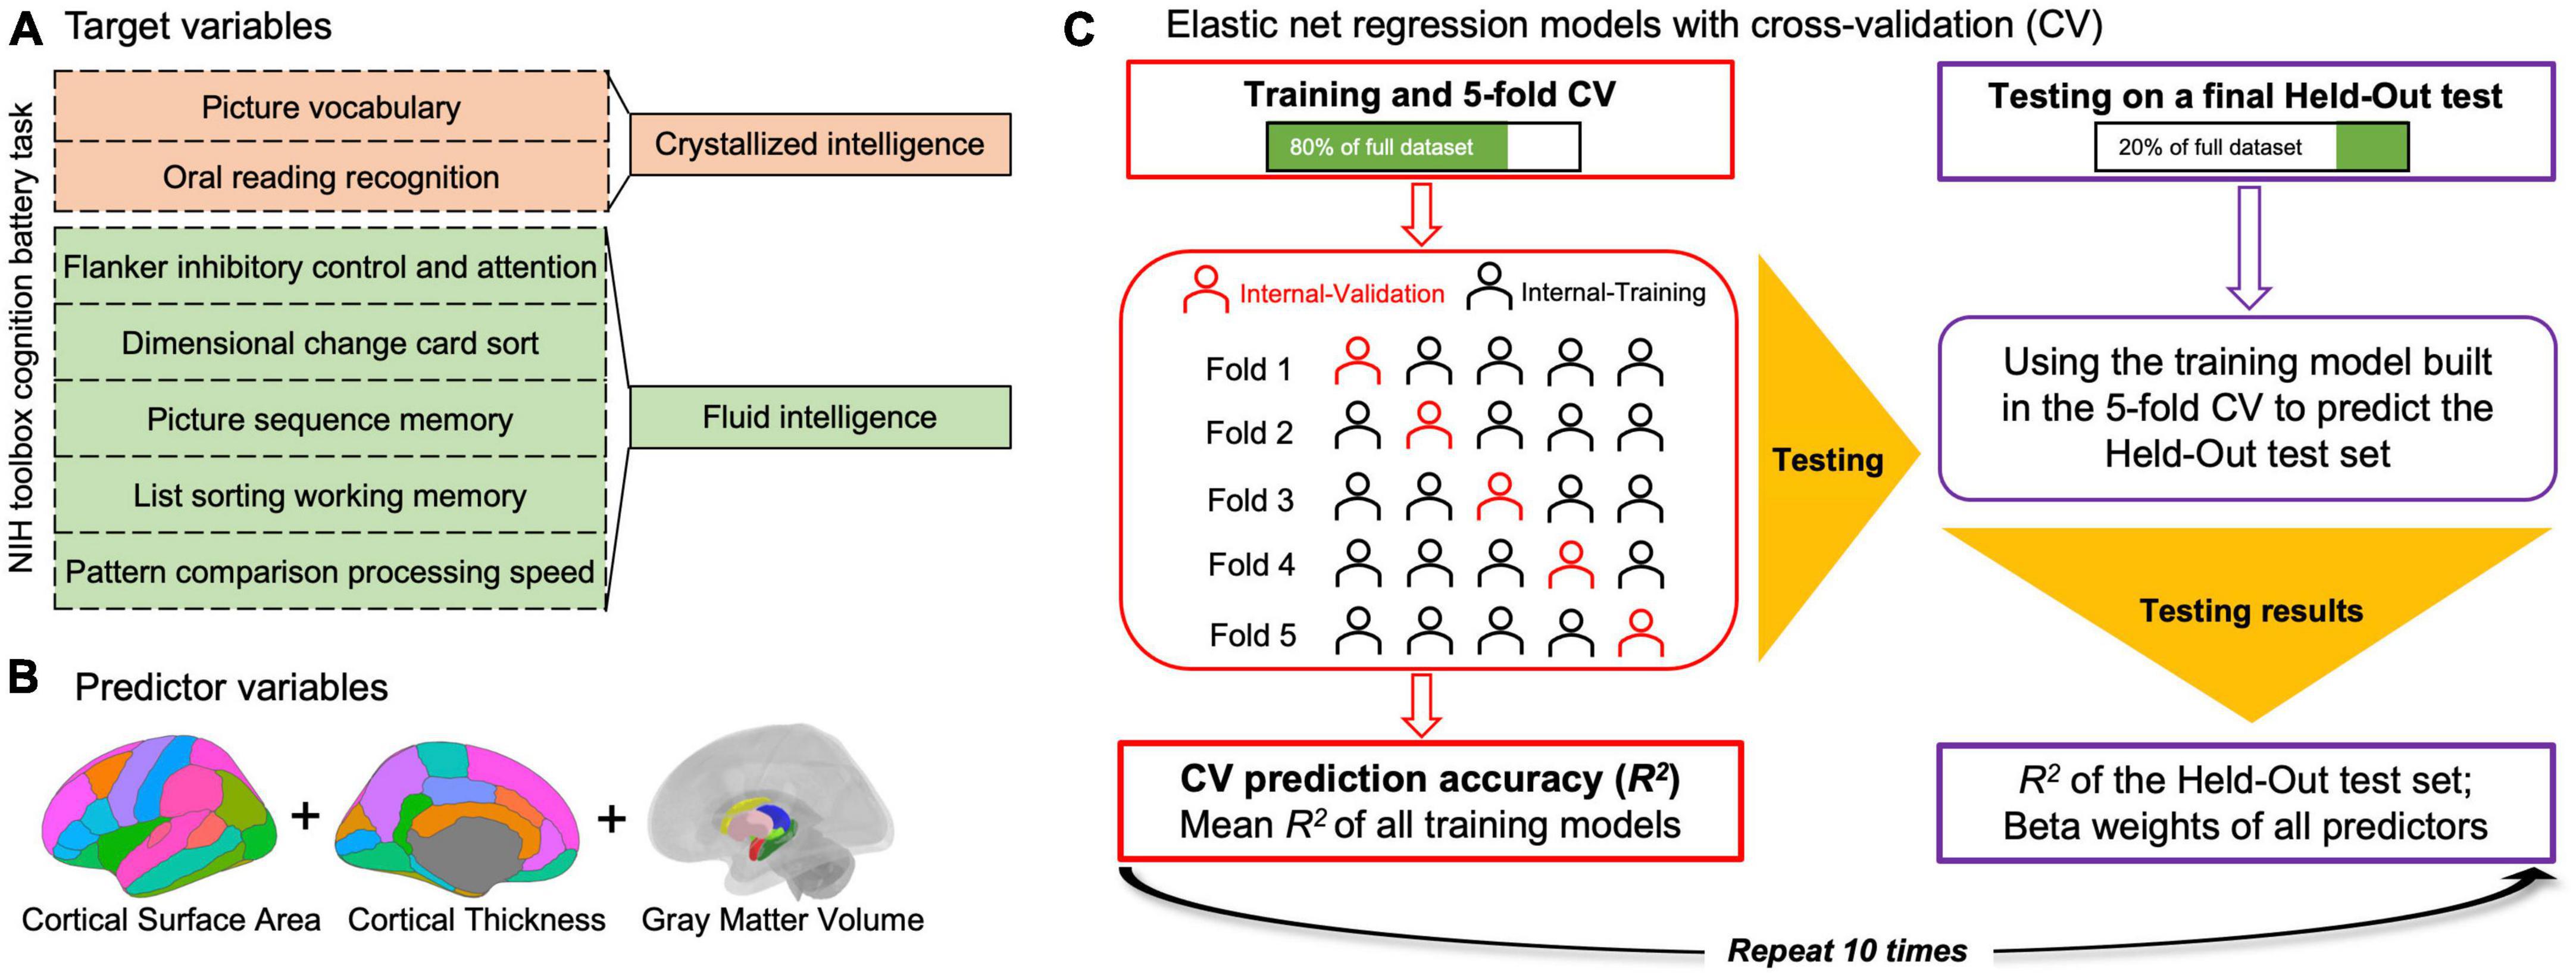
Figure 1. Schematic of elastic net regression (ENR) model analyses conducted. ENR models were built in which crystallized intelligence or fluid intelligence was the target, respectively, (A) and the predictors were regional sMRI variables (i.e., the cortical thickness and cortical surface area of each cortical region, gray matter volume of each subcortical region, and total intracranial volume) (B). A modified coefficient of determination (R2) was calculated as the measure of prediction accuracy for each model. All ENR analyses were repeated 10 times to ensure stability of findings across different train/test splits and results across repetitions were averaged (C).
2.3. MRI data acquisition and pre-processing
In the HCP dataset, T1-weighted structural images were collected using a 32-channel head coin on a 3T Siemens Skyra scanner (Siemens AG, Erlanger, Germany) with the following scanning parameters: isotropic resolution = 0.7 mm3, field of view = 224 mm × 240 mm, matrix size = 320 × 320, repetition time = 2,400 ms, echo time = 2.14 ms, inversion time = 1,000 ms, flip angle = 8°, and 256 sagittal slices. Data were reconstructed and pre-processed using a modified version of the FreeSurfer pipeline (Fischl et al., 2004) in FreeSurfer Image Analysis Suite version 5.31 (Fischl, 2012). For details of acquisition parameters, reconstruction, and pre-processing of the HCP sMRI data, see references (Van Essen et al., 2012; Glasser et al., 2013) and Supplementary materials. All structural images were reviewed by a technician immediately after acquisition to ensure scans were without any significant problems (i.e., artifacts and substantial movement). For a detailed explanation of HCP quality control, check reference (Marcus et al., 2013). The quantitative measures of CT and CSA for cortical regions were defined by the Desikan atlas (Desikan et al., 2006), while the GMV for subcortical regions from the ASEG parcellation and intracranial volume (ICV) was derived in FreeSurfer (Fischl, 2012).
2.4. Data analyses
ENR model analyses (Figure 1) were conducted in Python using Scikit-Learn (Pedregosa et al., 2011) and the Brain Predictability toolbox (Hahn et al., 2021). LME model analyses were performed using R (Version 4.1.32) and RStudio (“Ghost Orchid” Release; see text footnote 2), with the lme4 package (Version 1.1-28) (Bates et al., 2015).
2.4.1. Elastic net regression model analyses
To remove the covariance (e.g., demographic variables, including age, sex, total family income, and education level), residual covariates were removed from a pool of variables, comprising Gc and Gf. The ENR models were built with Gc or Gf as the dependent variable. Hence, the predictors (i.e., independent variables) of the model-building algorithm were regional sMRI variables (i.e., the CT and CSA of each cortical region, the GMV of each subcortical region, and total ICV; Figure 1B). The model aimed to investigate neuroanatomical patterns that could predict Gc and Gf.
A modified coefficient of determination (R2) was calculated as a measure of accuracy for each model. All elastic net analyses were repeated 10 times to validate findings across different train/test splits, and the results across multiple repetitions were averaged (Figure 1C).
Initially, 20% of the total participants were selected as the held-out test set. For the remaining participants, a 5-fold CV was used to build and test five separate elastic net regression models. In this approach, the training data were split into five equal groups (i.e., “folds”). A model was then built using four of the 5-folds (i.e., the training data) and tested on the 5-fold (i.e., the validation set) to determine its accuracy. After five repetitions, with each fold serving as the test set exactly once, the mean of the five models was used to predict the held-out test set.
Within this 5-fold CV, hyperparameter tuning was performed in the training set with a nested 3-fold CV. A random hyperparameter search algorithm was used on 200 randomly selected combinations of hyperparameters (Alibrahim and Ludwig, 2021). In the 3-fold CV, the training data were split into 3-folds in each of the five model-building phases. Within each of the 3-folds, 200 randomly selected combinations of parameters were tested, and the best combination was selected. The combination that yielded the best accuracy from all the folds was used to build a model for 5-fold iteration in the outer loop.
2.4.2. Linear mixed effects model analyses
To better interpret elastic net regression analyses, a secondary analysis was conducted to test the association of Gc and Gf with each sMRI variable from the final elastic net regression model. The linear mixed effects (LME) model analyzed each sMRI variable as a fixed effect. Demographic variables (sex, age, education level, and total family income) and ICV were fixed effects, and family ID was used as a random effect. The Gc or Gf was the dependent variable. The P < 0.05 after Bonferroni correction was used to indicate significance. Regions included in ERN models were only considered as neural correlates of Gc and Gf if they were also associated in the same direction in the univariate analyses.
2.4.3. Intraclass correlation analyses
To examine the neuroanatomical distinctiveness of Gc and Gf, absolute similarity coefficients (i.e., intraclass correlation (ICC)) were calculated across the entire set of sMRI features. The regression coefficients for each regional brain measure from LME models and beta weights from ENR models served as the elements of ICC analyses. The double-entry intraclass correlations (McCrae, 2008), which accounted for absolute similarities in magnitude and direction of the neuroanatomical profiles of Gc and Gf, were used to quantify the degree of absolute neuroanatomical similarity between Gc and Gf. These indices were computed separately across CSA features, CT features, and GMV features, and across all sMRI features again. The neuroanatomical similarity between Gc and Gf was interpreted using cut-offs based on “poor reliability/replicability” (ICC = 0.00−0.50), “moderate reliability/replicability” (ICC = 0.50−0.75), “good reliability/replicability” (ICC = 0.75−0.90), and “excellent reliability/replicability” (ICC = 0.90−1.00) (Koo and Li, 2016). Additionally, Pearson correlations were conducted in sMRI features between Gc and Gf accordingly.
3. Results
3.1. ENR models
The ENR model predicted Gc with R2 of 1.00% after a 5-fold cross-validation. The R2 was 2.40% when predicting the held-out test set across 10 repetitions of the ENR procedure (Figure 2 and Supplementary Table 1). The pattern of regions that contributed to the mode (beta weights ranging between −0.3744 and 0.5356) included CSA and CT of the widespread frontal, parietal, and temporal regions (e.g., rostral middle frontal gyrus, medial orbitofrontal cortex, caudal middle frontal, posterior cingulate cortex, and caudal anterior cingulate cortex), and GMV of the subcortical regions, including the bilateral hippocampus and left thalamus (Figure 3A). Brain regions with positive/negative beta weights in the ENR model are reported in Supplementary Table 2.
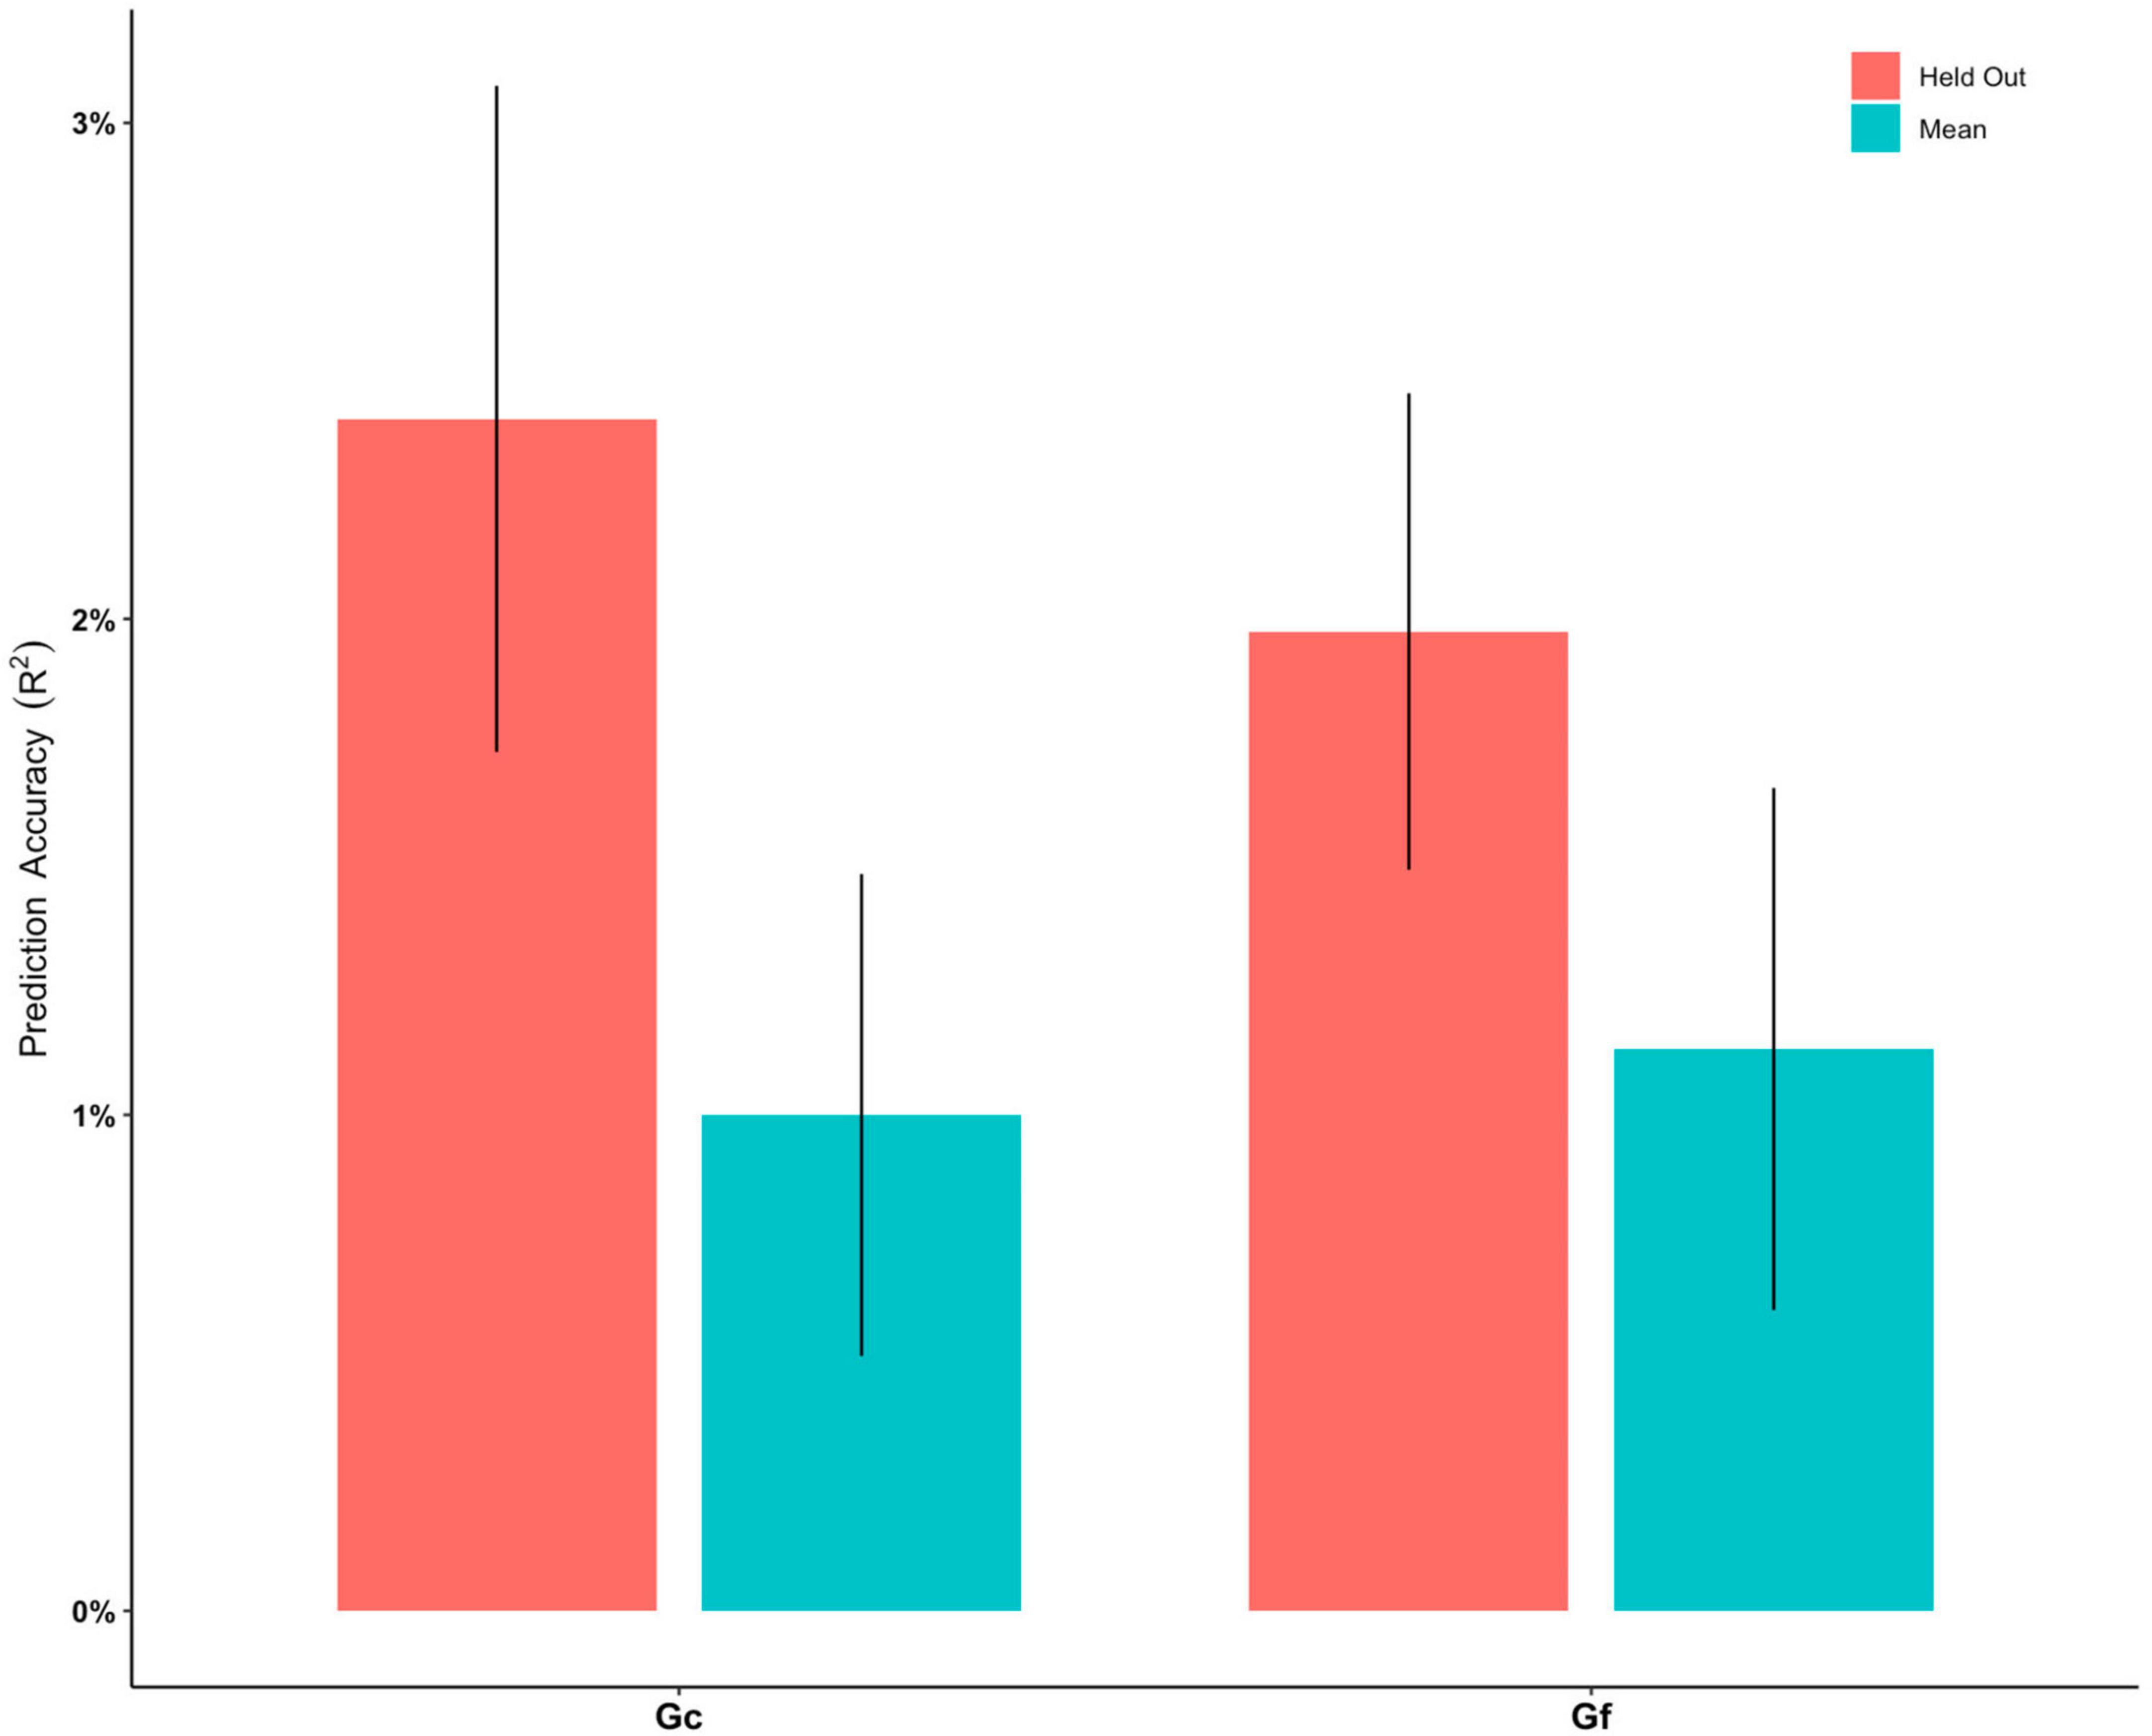
Figure 2. Prediction accuracy (R2) for elastic net regression models to predict crystalized intelligence (Gc) and fluid intelligence (Gf), respectively. “Mean” indicate the mean R2 of all models built in the training phase. “Held Out” indicates the all R2 of all models from the training phase being tested on the held-out test set. Error bars stand for standard error of mean.
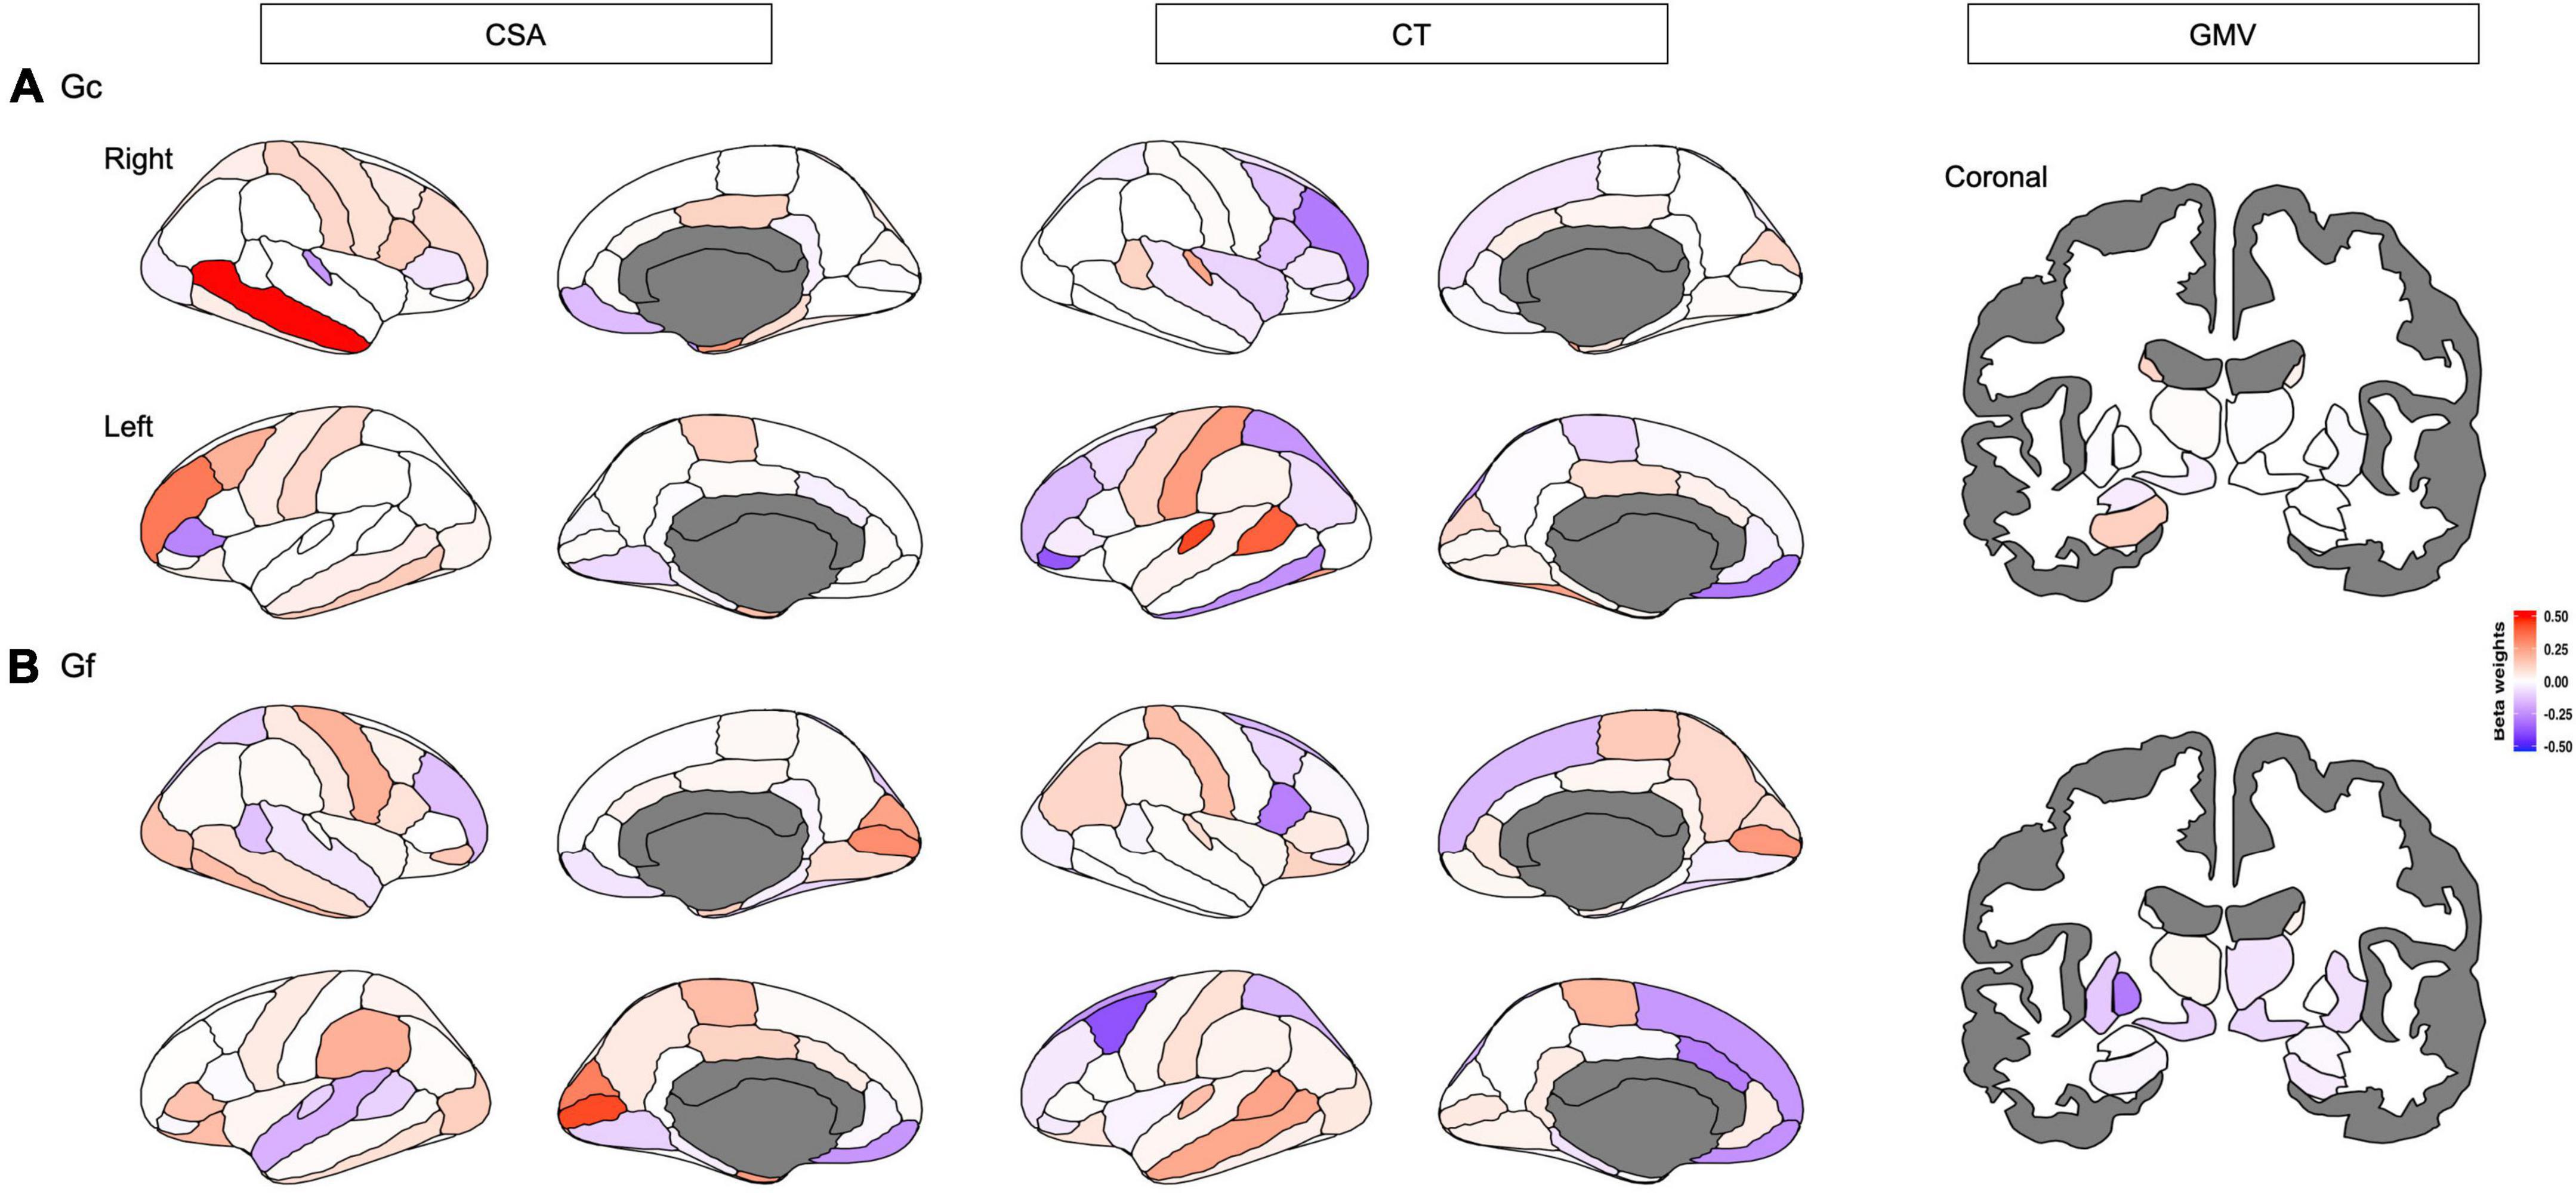
Figure 3. Distinct neuroanatomical patterns were indexed by beta weights of different features including cortical surface area (CSA), and cortical thickness (CT) of each cortical region, and gray matter volume (GMV) of each subcortical that predicted (A) crystalized intelligence (Gc) and (B) fluid intelligence (Gf), respectively. Red-shaded brain regions or bars indicate positive beta weights, while blue-shaded brain regions or bars indicate negative beta weights.
The ENR model predicted Gf with an R2 of 1.13% after a 5-fold cross-validation. The R2 was 1.97% when predicting the held-out test set across 10 repetitions of the ENR procedure (Figure 2 and Supplementary Table 1). The pattern of regions that contributed to the mode (beta weights ranging between −0.3866 and 0.4309) included CSA and CT of the widespread frontal, parietal, and temporal regions (e.g., rostral middle frontal gyrus, medial orbitofrontal cortex, caudal middle frontal, superior and inferior parietal lobule, posterior cingulate cortex, and caudal anterior cingulate cortex), and GMV of the subcortical regions, including the bilateral nucleus accumbens and left pallidum (Figure 3B). Brain regions with positive/negative beta weights in the ENR model are reported in Supplementary Table 3.
3.2. LME models
Linear mixed effects model analyses (Table 2) revealed the association between Gc and the CSA of widespread cortical regions (including bilateral rostral middle frontal gyrus, caudal middle frontal, superior frontal gyrus, and parahippocampal gyrus) and the GMV of subcortical regions (including the bilateral hippocampus and left thalamus). However, Gf was significantly associated with only CSA in limited cortical regions (including bilateral the pericalcarine fissure). According to the ENR model, the brain regions that were significant in the LME model for both Gc and Gf are displayed in Figure 4.
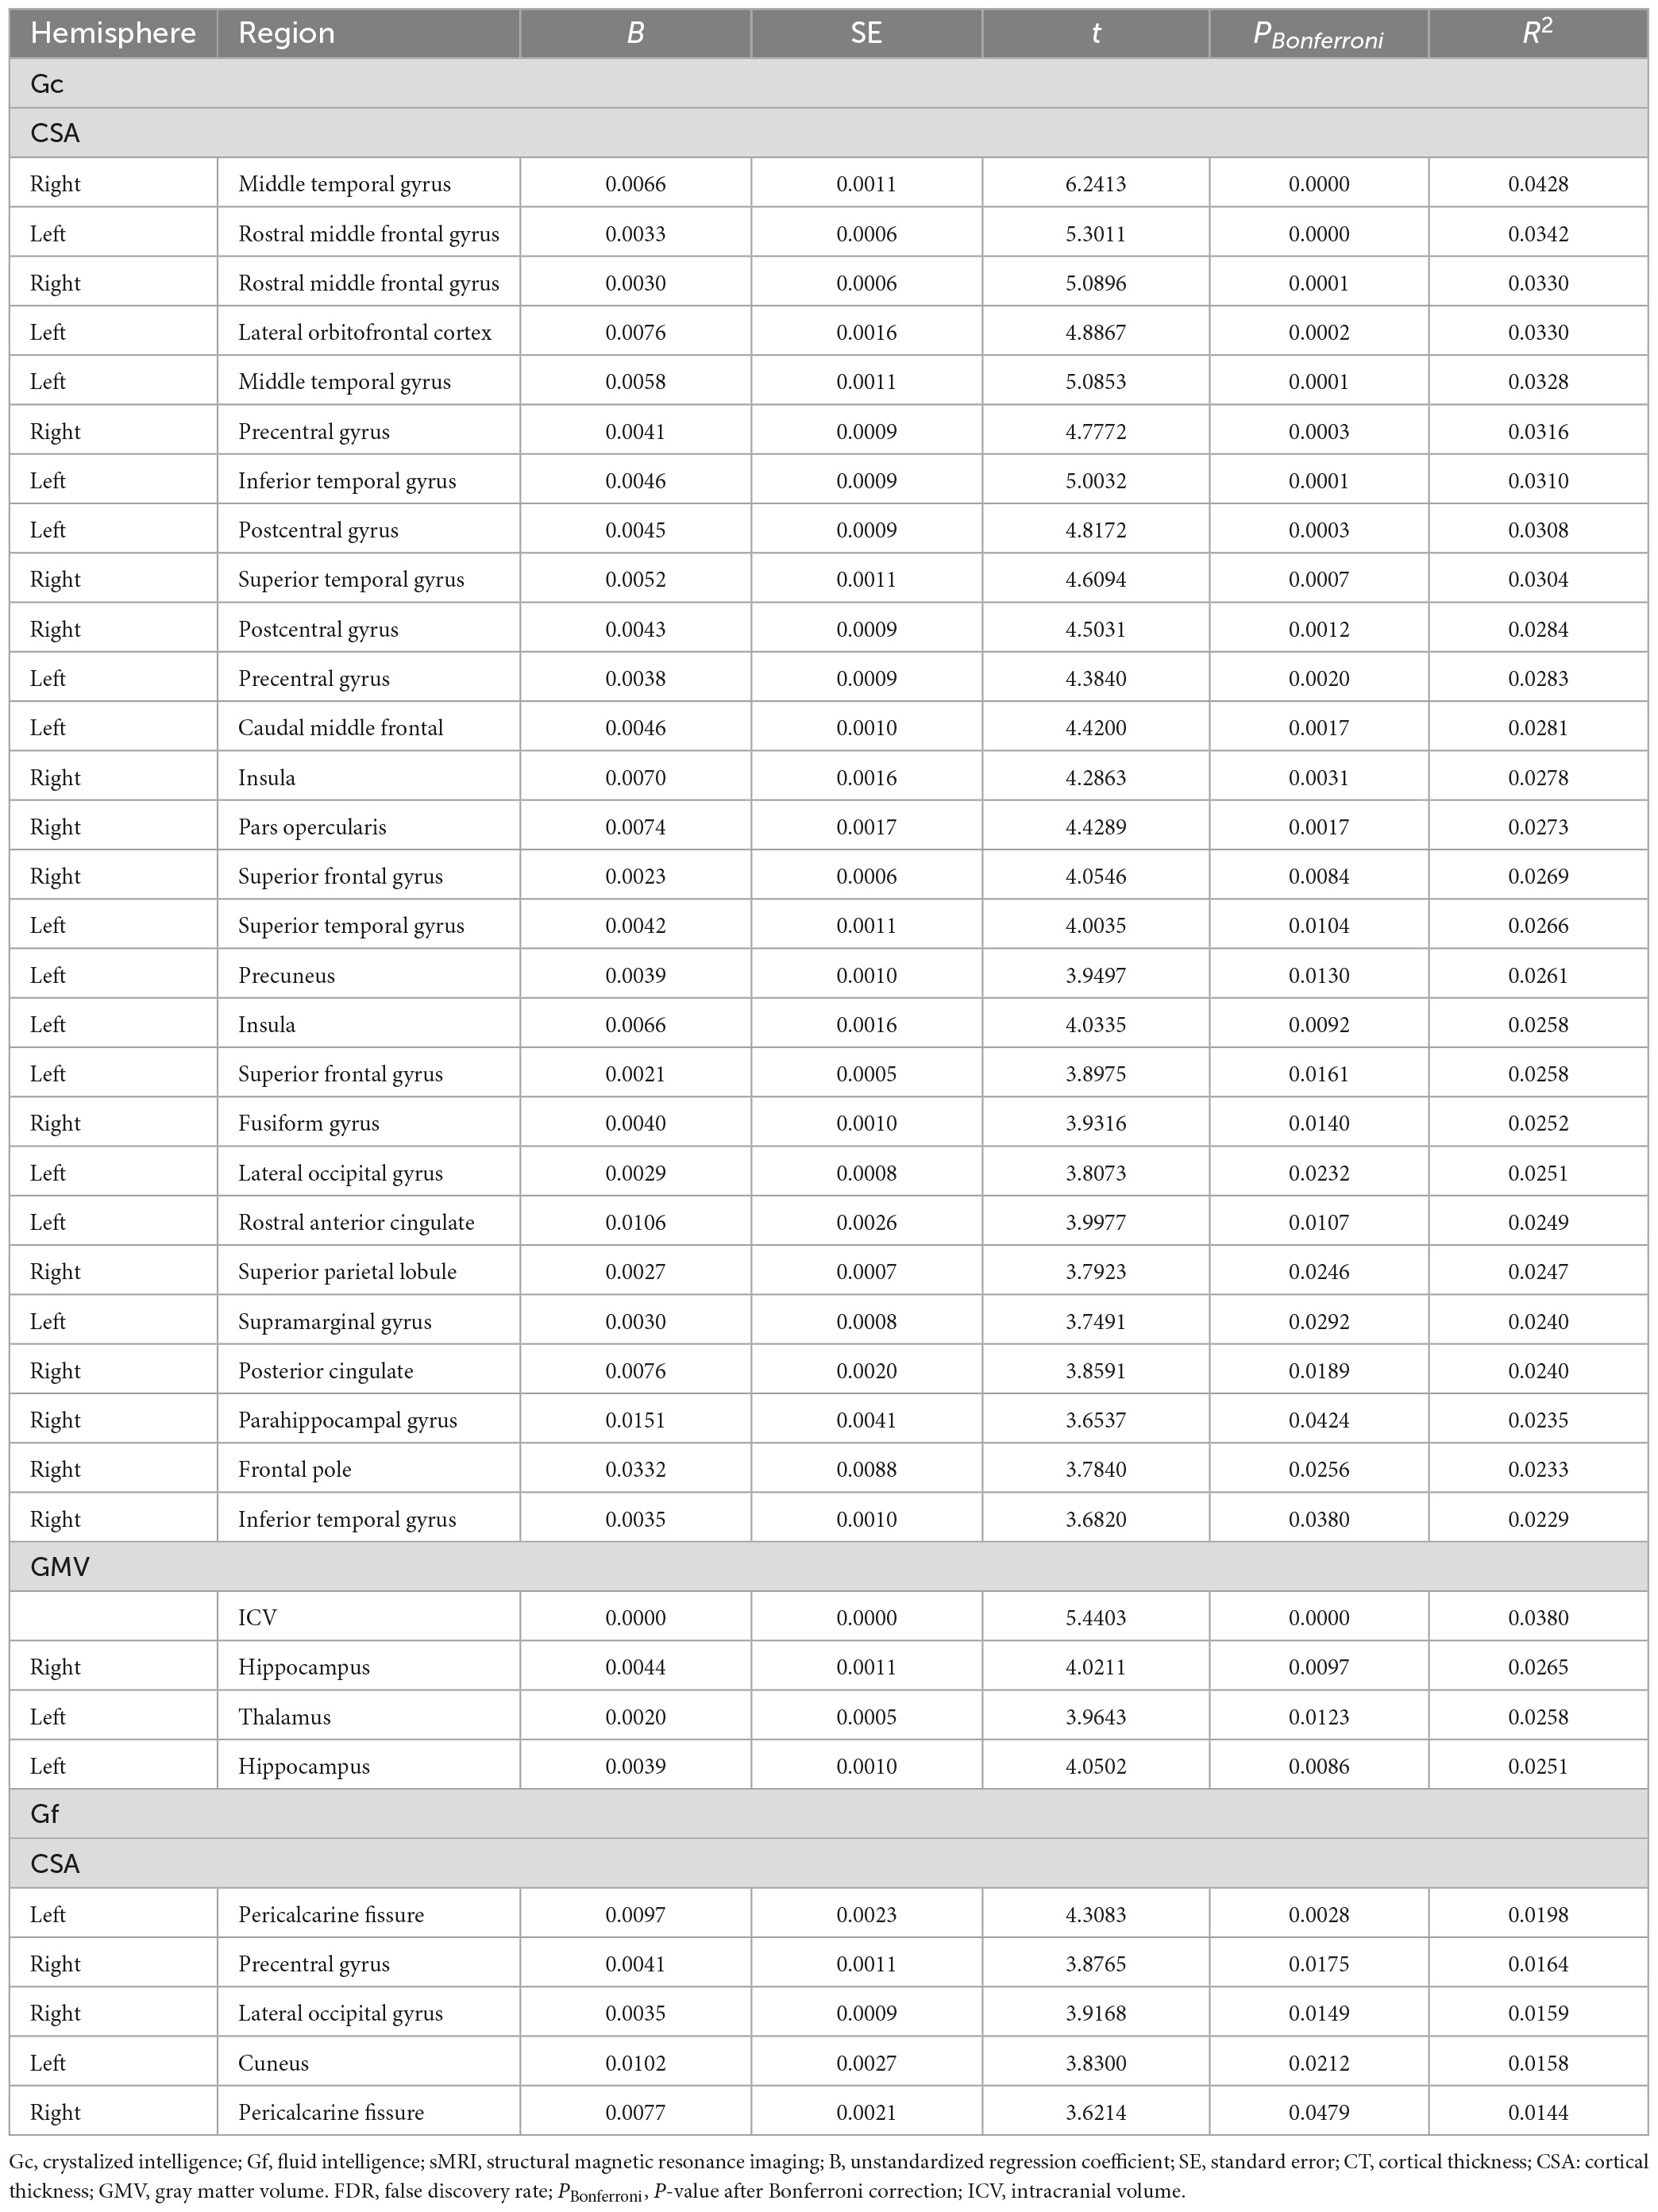
Table 2. Significant sMRI correlates of Gc and Gf in linear mixed effect models after Bonferroni correction.
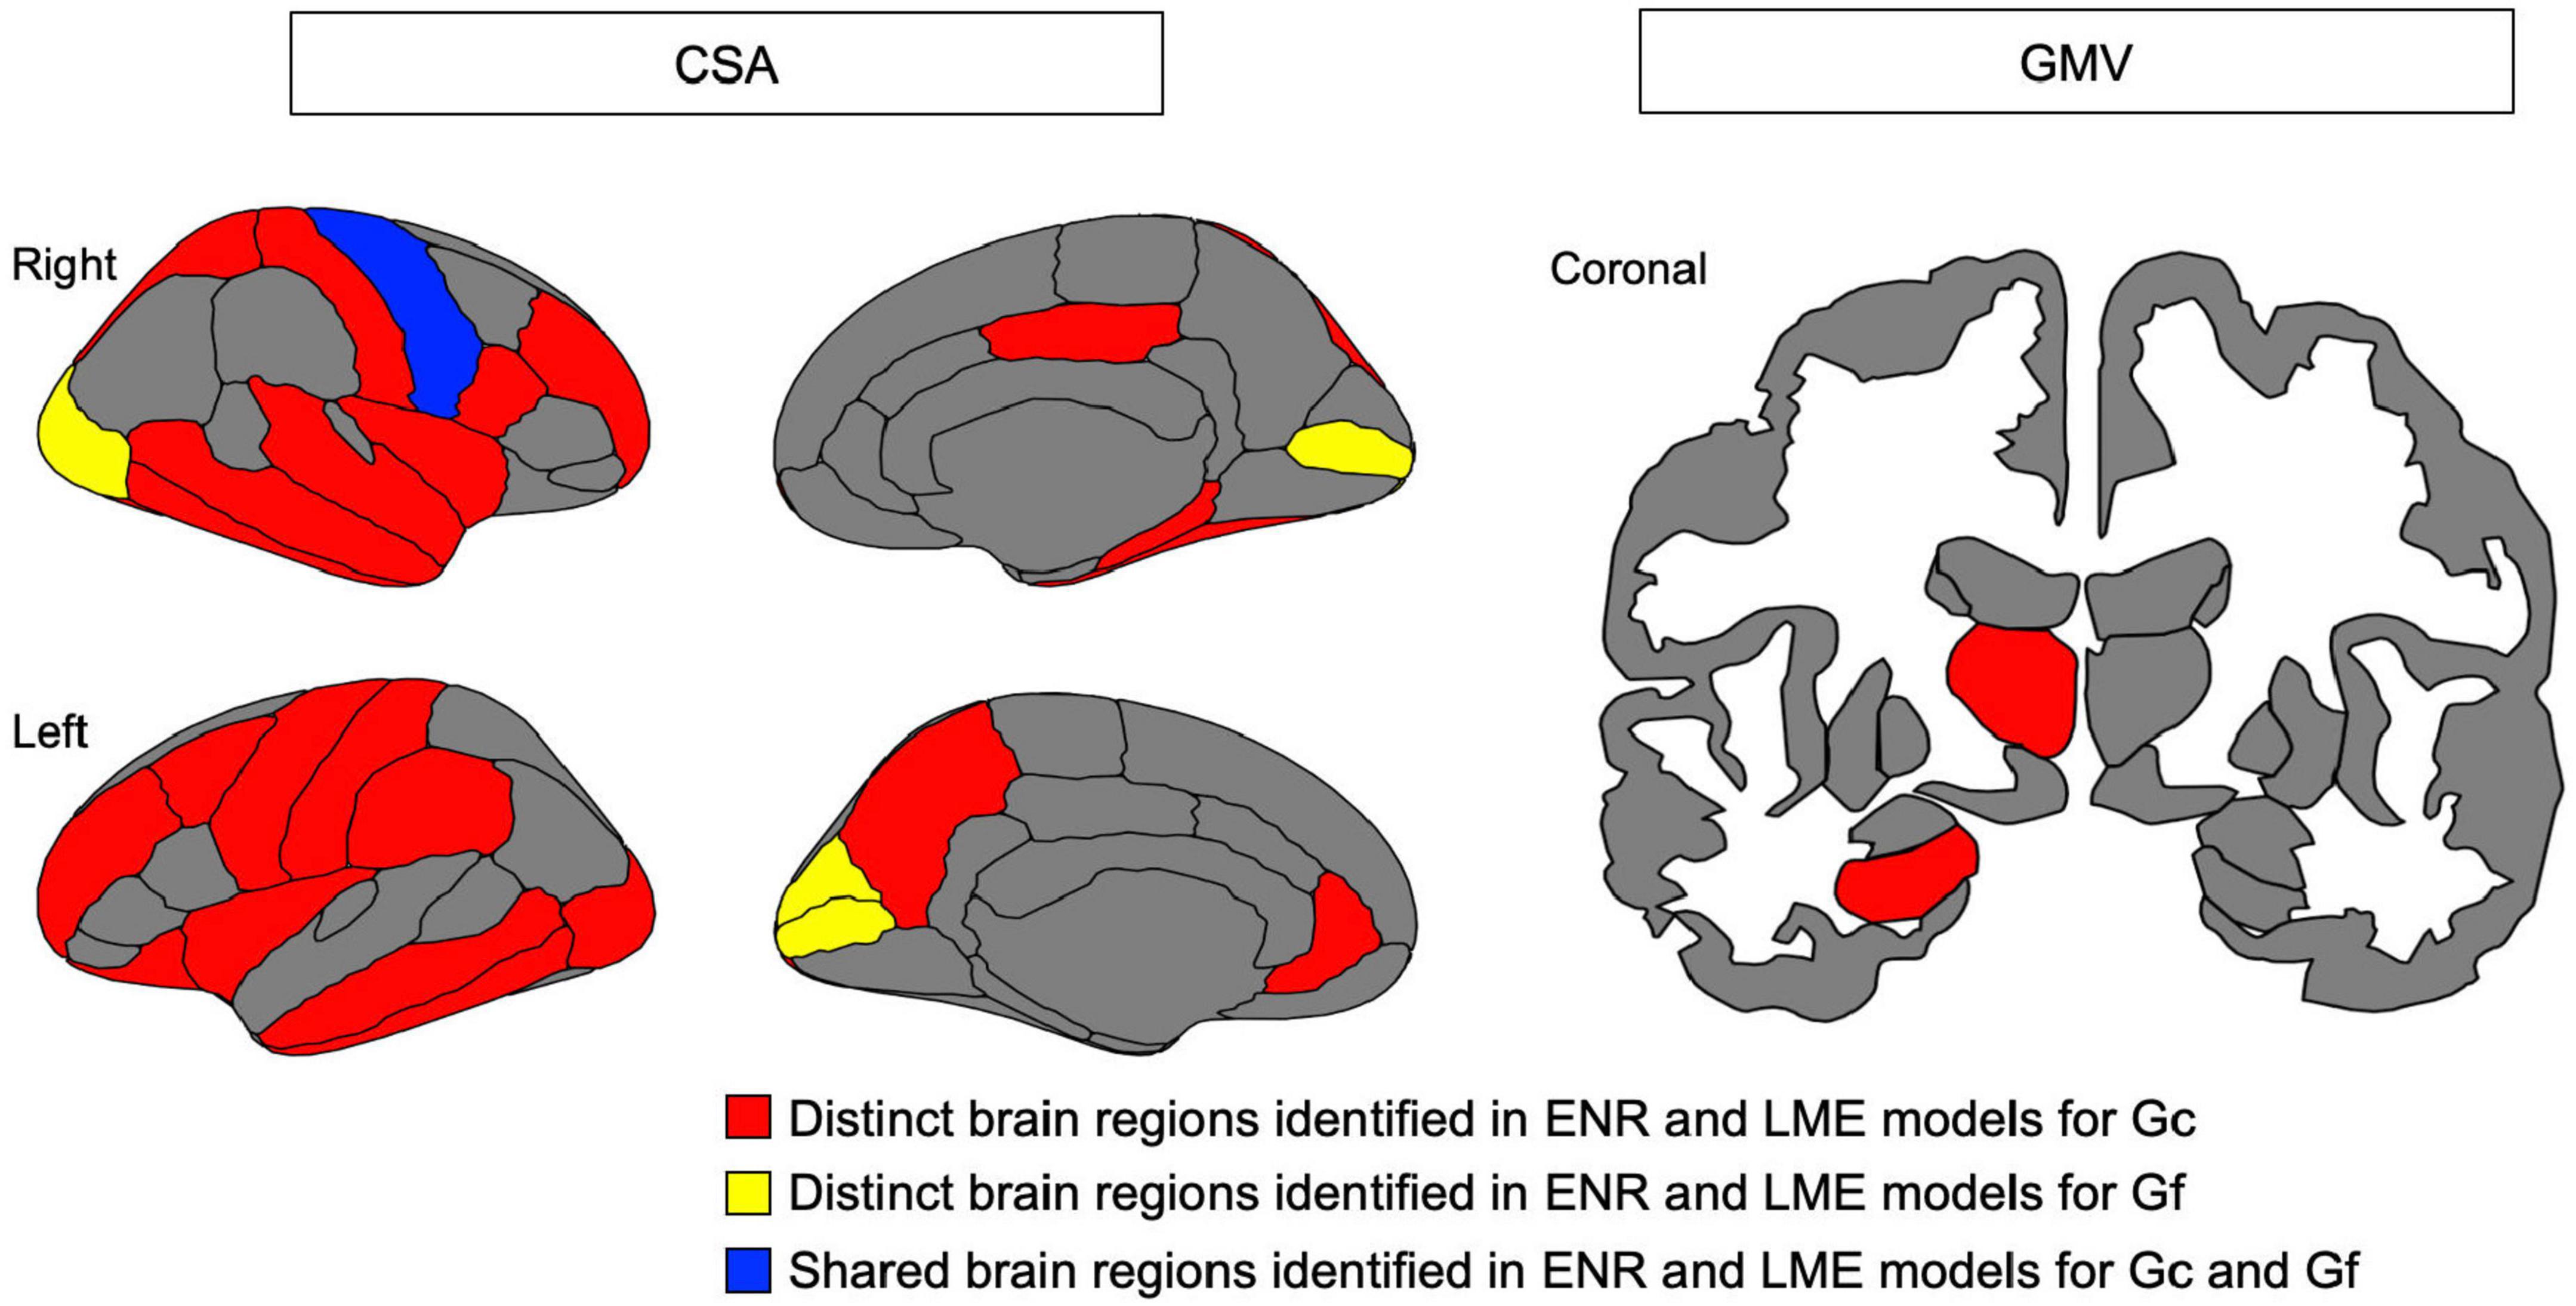
Figure 4. Brain map for cortical surface area (CSA) of cortical region and gray matter volume (GMV) of subcortical region identified as contributing to predict crystalized intelligence (Gc) and (B) fluid intelligence (Gf), respectively, in elastic net regression (ENR) models and found to be significantly associations in linear mixed effect (LME) models. Red indicates distinct brain regions identified in ENR and LME models for Gc; yellow indicates distinct brain regions identified in ENR and LME models for Gf; blue indicted shared brain regions identified in ENR and LME models for both Gc and Gf.
3.3. Neuroanatomical pattern similarity
intraclass correlation analyses of regression coefficients indicated that all sMRI features had poor similarity with all ICC below 0.50 between Gc and Gf (ICC = 0.1649−0.4761; Pearson’s r = 0.2614−0.5184; Table 3). Similarly, beta weights of all sMRI features reported poor similarity with all ICC below 0.40 between Gc and Gf (ICC = 0.0817−0.3910; Pearson’s r = 0.0812−0.4851; Table 3).
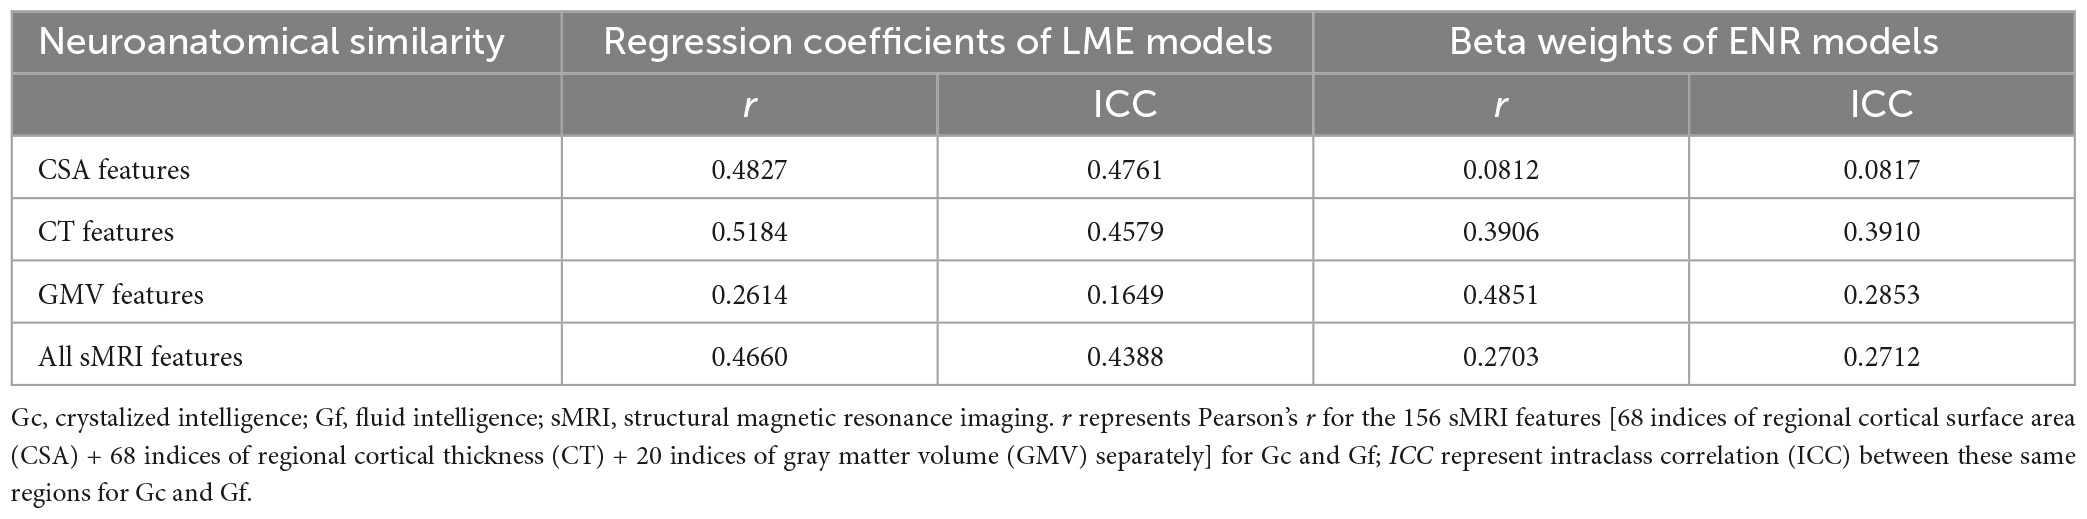
Table 3. Neuroanatomical similarity between Gc and Gf in different sMRI features.
4. Discussion
This study aimed to provide a comprehensive examination of distinct neuroanatomical patterns to predict Gc and Gf in healthy adults using a cross-validated machine learning approach. Results of this approach indicted that distinct multi-region neuroanatomical patterns predicted Gc and Gf, respectively, with robust prediction accuracy in a held-out test set (R2 = 2.40% for Gc and R2 = 1.97% for Gf). Univariate LME model analyses supported the results, where the same brain regions identified in ENR models were significantly associated with Gc and Gf. Additionally, ICC findings exhibited poor neuroanatomical pattern similarity between Gc and Gf, indicating distinct neuroanatomical patterns to predict Gc and Gf. Taken together, these findings provided evidence that machine learning-derived distinct neuroanatomical patterns could predict Gc and Gf in healthy adults.
Interestingly, the ENR model indicated that Gc was more predictable than Gf from multi-region neuroanatomical patterns. Previous research proposed that Gc and Gf exhibited distinct developments and transformations across the lifespan (Cattell, 1967). While Gc is the ability to use previously learned knowledge and life experience, which are thought to be influenced by education and cultural factors, Gf is regarded as the ability to solve new problems using logical reasoning and adapt to unknown situations, which are thought to be more dependent on biological processes (Heaton et al., 2014). In this study, Gc reflected the scores of tasks such as vocabulary and decoding, while Gf reflected the scores of cognitive tasks including cognitive flexibility, working memory, and information processing speed (Mungas et al., 2014). The eloquent nature of the mapping between neuroanatomical morphometry profile and language, including vocabulary and reading as measured by Gc, may explain the higher variance of the scores when compared to Gc, which relies on brain functional networks for different cognitive functions. Another possible explanation for the higher predictability of Gc relative to Gf could be the impact of environment on neuroanatomical morphometry (Maggioni et al., 2020). Additionally, Gc is more stable throughout life and generally less susceptible to factors that affect cognitive function (e.g., mood and stress) (Riedel et al., 2002; O’Neill et al., 2020), resulting in the higher predictability of Gc over Gf. Additionally, a previous study found that cortical grey matter morphology provided little information about Gf and was probably incapable of predicting Gf (Oxtoby et al., 2019). This study validated this claim, whereby a low CSA led to low Gf predictivity. In this regard, Gf reflected higher cognitive functions, which were more dependent on large-scale brain networks (Gray et al., 2003; Barbey, 2018).
Moreover, the feature of neuroanatomical morphometry most linked to intelligence was CSA, which had more significant associations with Gc and Gf than CT or subcortical GMV. From the evolutionary perspective of the human cerebral cortex, the brain region is theorized to be enlarged mainly by the expansion of the surface area without a comparable increase in its thickness (Rakic et al., 2009). This suggests that the frontal and parietal surface area are enlarged first, followed by increasing thickness for young adults with higher intelligence. Evidence has verified that CSA and CT possess distinct genetic bases and developmental trajectories (Panizzon et al., 2009). Furthermore, gene expression is inversely correlated with development (Vidal-Pineiro et al., 2020). CSA and CT contribute to different aspects of intelligence (Gc and Gf). This study revealed the poor similarity between the neural correlates of Gc and Gf, evidenced by the low ICC in both ENR and LME models. The poor similarity between the neuroanatomical correlates of Gc and Gf supports the concept of distinct neuroanatomical patterns, suggesting that Gc and Gf may be “two sides of the same coin” (i.e., different aspects of intelligence have differential neuroanatomical signatures).
This study had several noteworthy strengths. This is a study for a machine learning-based approach to predict Gc and Gf using multiple metrics of the brain (i.e., CT, CSA, and GMV). The brain regions analyzed via the machine learning approach were largely supported by a univariate LME model, which validated the distinct brain regions to predict Gc and Gf. Additionally, the findings of this study were largely consistent with previous univariate analyses on the sMRI correlates of intelligence, highlighting the significance of the neuroanatomical correlates of intelligence. Furthermore, Gc and Gf were predicted by distinct neuroanatomical patterns with poor pattern similarity, which exhibited different neural substrates of distinct intelligence components in adults.
In retrospect, this study had several limitations. Firstly, the study used a cross-sectional design, which would discredit claims regarding the causality of the observed relationships. Future longitudinal studies should be performed to address this issue (Xu et al., 2018, 2019). Secondly, the current results are limited only to sMRI data, which could be further validated by resting-state functional MRI data or functional MRI data for related tasks (e.g., executive function) (Niu et al., 2020; Yang et al., 2020). Another direction to be explored is to determine whether the predictive model accuracy can be improved by an alternative machine learning approach. There is work suggesting that convolutional neural network modeling can outperform standard machine learning algorithms (Abrol et al., 2021). While this approach would require substantially more computational resources than the current analysis, this may improve the accuracy of predictive models.
5. Conclusion
In summary, using a cross-validated elastic net regression approach, this study indicated distinct neuroanatomical patterns that predicted Gc and Gf with robust accuracy in healthy adults. These findings verified the results of prior works to understand the neuroanatomical foundations of intelligence and demonstrate the utility of machine learning in this field of research. In addition, the distinct structural neural correlates of Gc and Gf were comprehensively studied and recognized for their involvement in different individual cognitive functions.
Data availability statement
Publicly available datasets were analyzed in this study. This data can be found here: All data were provided by the Human Connectome Project, WU-Minn Consortium (Principal Investigators: David Van Essen and Kamil Ugurbil; 1U54MH091657) funded by the 16 NIH Institutes and Centers that support the NIH Blueprint for Neuroscience Research and the McDonnell Center for Systems Neuroscience at Washington University in St. Louis.
Ethics statement
The studies involving human participants were reviewed and approved by the Second Affiliated Hospital and Yuying Children’s Hospital of Wenzhou Medical University. The patients/participants provided their written informed consent to participate in this study.
Author contributions
HX: conceptualization, methodology, data curation, formal analysis, software, visualization, investigation, supervision, writing – original draft, and writing – review and editing. CX, ZY, and GB: methodology, and writing – reviewing and editing. BY: funding acquisition, project administration, supervision, and writing – review and editing. All authors contributed to the article and approved the submitted version.
Funding
This study was funded by the Natural Science Foundation of Zhejiang Province (No. LY15H090016), Wenzhou Science and Technology Bureau in China (No. Y20140577), and Beijing New Health Industry Development Foundation (No. XM2020-02-002).
Conflict of interest
The authors declare that the research was conducted in the absence of any commercial or financial relationships that could be construed as a potential conflict of interest.
Publisher’s note
All claims expressed in this article are solely those of the authors and do not necessarily represent those of their affiliated organizations, or those of the publisher, the editors and the reviewers. Any product that may be evaluated in this article, or claim that may be made by its manufacturer, is not guaranteed or endorsed by the publisher.
Supplementary material
The Supplementary Material for this article can be found online at: https://www.frontiersin.org/articles/10.3389/fnins.2023.1199106/full#supplementary-material
Footnotes
References
Abrol, A., Fu, Z., Salman, M., Silva, R., Du, Y., Plis, S., et al. (2021). Deep learning encodes robust discriminative neuroimaging representations to outperform standard machine learning. Nat. Commun. 12:353. doi: 10.1038/s41467-020-20655-6
Alibrahim, H., and Ludwig, S. A. (2021). “Hyperparameter optimization: comparing genetic algorithm against grid search and bayesian optimization,” in Paper Presented at the 2021 IEEE congress on evolutionary compssutation (CEC), (Kraków).
Barbey, A. K. (2018). Network neuroscience theory of human intelligence. Trends Cogn. Sci. 22, 8–20. doi: 10.1016/j.tics.2017.10.001
Barbey, A. K., Colom, R., and Grafman, J. (2013). Dorsolateral prefrontal contributions to human intelligence. Neuropsychologia 51, 1361–1369. doi: 10.1016/j.neuropsychologia.2012.05.017
Bates, D., Mächler, M., Bolker, B., and Walker, S. (2015). Fitting linear mixed-effects models using lme4. J. Stat. Softw. 67, 1–48. doi: 10.18637/jss.v067.i01
Button, K. S., Ioannidis, J. P., Mokrysz, C., Nosek, B. A., Flint, J., Robinson, E. S., et al. (2013). Power failure: why small sample size undermines the reliability of neuroscience. Nat. Rev. Neurosci. 14, 365–376. doi: 10.1038/nrn3475
Cattell, R. B. (1943). The measurement of adult intelligence. Psychol. Bull. 40, 153–193. doi: 10.1037/h0059973
Cattell, R. B. (1967). The theory of fluid and crystallized general intelligence checked at the 5–6 year-old level. Br. J. Educ. Psychol. 37, 209–224. doi: 10.1111/j.2044-8279.1967.tb01930.x
Cipolotti, L., Ruffle, J. K., Mole, J., Xu, T., Hyare, H., Shallice, T., et al. (2022). Graph lesion-deficit mapping of fluid intelligence. Brain 146, 167–181. doi: 10.1093/brain/awac304
Deary, I. J., Strand, S., Smith, P., and Fernandes, C. (2007). Intelligence and educational achievement. Intelligence 35, 13–21. doi: 10.1016/j.intell.2006.02.001
Desikan, R. S., Segonne, F., Fischl, B., Quinn, B. T., Dickerson, B. C., Blacker, D., et al. (2006). An automated labeling system for subdividing the human cerebral cortex on MRI scans into gyral based regions of interest. Neuroimage 31, 968–980. doi: 10.1016/j.neuroimage.2006.01.021
Dhamala, E., Jamison, K. W., Jaywant, A., and Kuceyeski, A. (2022). Shared functional connections within and between cortical networks predict cognitive abilities in adult males and females. Hum. Brain Mapp. 43, 1087–1102. doi: 10.1002/hbm.25709
Dhamala, E., Jamison, K. W., Jaywant, A., Dennis, S., and Kuceyeski, A. (2021). Distinct functional and structural connections predict crystallised and fluid cognition in healthy adults. Hum. Brain Mapp. 42, 3102–3118. doi: 10.1002/hbm.25420
Fischl, B., van der Kouwe, A., Destrieux, C., Halgren, E., Segonne, F., Salat, D. H., et al. (2004). Automatically parcellating the human cerebral cortex. Cereb. Cortex 14, 11–22. doi: 10.1093/cercor/bhg087
Gainotti, G. (2006). Anatomical functional and cognitive determinants of semantic memory disorders. Neurosci. Biobehav. Rev. 30, 577–594. doi: 10.1016/j.neubiorev.2005.11.001
Genç, E., Fraenz, C., Schlüter, C., Friedrich, P., Hossiep, R., Voelkle, M. C., et al. (2018). Diffusion markers of dendritic density and arborization in gray matter predict differences in intelligence. Nat. Commun. 9:1905. doi: 10.1038/s41467-018-04268-8
Glasser, M. F., Sotiropoulos, S. N., Wilson, J. A., Coalson, T. S., Fischl, B., Andersson, J. L., et al. (2013). The minimal preprocessing pipelines for the human connectome project. Neuroimage 80, 105–124. doi: 10.1016/j.neuroimage.2013.04.127
Gottfredson, L. S. (1997). Why g matters: the complexity of everyday life. Intelligence 24, 79–132. doi: 10.1016/S0160-2896(97)90014-3
Gray, J. R., Chabris, C. F., and Braver, T. S. (2003). Neural mechanisms of general fluid intelligence. Nat. Neurosci. 6, 316–322. doi: 10.1038/nn1014
Hahn, S., Yuan, K., Thompson, W. K., Owens, M., Allgaier, N., and Garavan, H. (2021). Brain Predictability toolbox: a Python library for neuroimaging-based machine learning. Bioinformatics 37, 1637–1638. doi: 10.1093/bioinformatics/btaa974
Heaton, R. K., Akshoomoff, N., Tulsky, D., Mungas, D., Weintraub, S., Dikmen, S., et al. (2014). Reliability and validity of composite scores from the NIH toolbox cognition battery in adults. J. Int. Neuropsychol. Soc. 20, 588–598. doi: 10.1017/S1355617714000241
Hilger, K., Winter, N. R., Leenings, R., Sassenhagen, J., Hahn, T., Basten, U., et al. (2020). Predicting intelligence from brain gray matter volume. Brain Struct. Funct. 225, 2111–2129. doi: 10.1007/s00429-020-02113-7
Jollans, L., Boyle, R., Artiges, E., Banaschewski, T., Desrivieres, S., Grigis, A., et al. (2019). Quantifying performance of machine learning methods for neuroimaging data. Neuroimage 199, 351–365. doi: 10.1016/j.neuroimage.2019.05.082
Jung, R. E., and Haier, R. J. (2007). The parieto-frontal integration theory (P-FIT) of intelligence: converging neuroimaging evidence. Behav. Brain Sci. 30, 135–154; discussion154–187. doi: 10.1017/s0140525x07001185
Koo, T. K., and Li, M. Y. (2016). A guideline of selecting and reporting intraclass correlation coefficients for reliability research. J. Chiropr. Med. 15, 155–163. doi: 10.1016/j.jcm.2016.02.012
Li, S. C., Lindenberger, U., Hommel, B., Aschersleben, G., Prinz, W., and Baltes, P. B. (2004). Transformations in the couplings among intellectual abilities and constituent cognitive processes across the life span. Psychol. Sci. 15, 155–163. doi: 10.1111/j.0956-7976.2004.01503003.x
Maggioni, E., Squarcina, L., Dusi, N., Diwadkar, V. A., and Brambilla, P. (2020). Twin MRI studies on genetic and environmental determinants of brain morphology and function in the early lifespan. Neurosci. Biobehav. Rev. 109, 139–149. doi: 10.1016/j.neubiorev.2020.01.003
Marcus, D. S., Harms, M. P., Snyder, A. Z., Jenkinson, M., Wilson, J. A., Glasser, M. F., et al. (2013). Human connectome project informatics: quality control, database services, and data visualization. Neuroimage 80, 202–219. doi: 10.1016/j.neuroimage.2013.05.077
Marek, S., Tervo-Clemmens, B., Calabro, F. J., Montez, D. F., Kay, B. P., Hatoum, A. S., et al. (2022). Reproducible brain-wide association studies require thousands of individuals. Nature 603, 654–660. doi: 10.1038/s41586-022-04492-9
Martin, A., and Chao, L. L. (2001). Semantic memory and the brain: structure and processes. Curr. Opin. Neurobiol. 11, 194–201. doi: 10.1016/s0959-4388(00)00196-3
McArdle, J. J., Hamagami, F., Meredith, W., and Bradway, K. P. (2000). Modeling the dynamic hypotheses of Gf–Gc theory using longitudinal life-span data. Learn. Individ. Differ. 12, 53–79. doi: 10.1016/S1041-6080(00)00036-4
McClelland, J. L., and Rogers, T. T. (2003). The parallel distributed processing approach to semantic cognition. Nat. Rev. Neurosci. 4, 310–322. doi: 10.1038/nrn1076
McCrae, R. R. (2008). A note on some measures of profile agreement. J. Pers. Assess. 90, 105–109. doi: 10.1080/00223890701845104
Mungas, D., Heaton, R., Tulsky, D., Zelazo, P. D., Slotkin, J., Blitz, D., et al. (2014). Factor structure, convergent validity, and discriminant validity of the NIH toolbox cognitive health battery (NIHTB-CHB) in adults. J. Int. Neuropsychol. Soc. 20, 579–587. doi: 10.1017/S1355617714000307
Neisser, U., Boodoo, G., Bouchard, T. J. Jr., Boykin, A. W., Brody, N., Ceci, S. J., et al. (1996). Intelligence: knowns and unknowns. Am. Psychol. 51, 77–101. doi: 10.1037/0003-066X.51.2.77
Niu, X., Xu, H., Guo, C., Yang, T., Kress, D., Gao, L., et al. (2020). Strengthened thalamoparietal functional connectivity in patients with hemifacial spasm: a cross-sectional resting-state fMRI study. Br. J. Radiol. 93:20190887.
O’Neill, J., Kamper-DeMarco, K., Chen, X., and Orom, H. (2020). Too stressed to self-regulate? Associations between stress, self-reported executive function, disinhibited eating, and BMI in women. Eat Behav. 39:101417. doi: 10.1016/j.eatbeh.2020.101417
Owens, M. M., Hyatt, C., Xu, H., Thompson, M., Miller, J., Lynam, D., et al. (2022). Replicability of the neuroanatomical correlates of impulsive personality traits in the ABCD study. PsyArXiv [Preprint]. doi: 10.31234/osf.io/u3bxc
Oxtoby, N. P., Ferreira, F. S., Mihalik, A., Wu, T., Brudfors, M., Lin, H., et al. (2019). “ABCD neurocognitive prediction challenge 2019: predicting individual residual fluid intelligence scores from cortical grey matter morphology,” in Paper Presented at the adolescent brain cognitive development neurocognitive prediction, (Cham).
Panizzon, M. S., Fennema-Notestine, C., Eyler, L. T., Jernigan, T. L., Prom-Wormley, E., Neale, M., et al. (2009). Distinct genetic influences on cortical surface area and cortical thickness. Cereb. Cortex 19, 2728–2735. doi: 10.1093/cercor/bhp026
Pedregosa, F., Varoquaux, G., Gramfort, A., Michel, V., Thirion, B., Grisel, O., et al. (2011). Scikit-learn: machine learning in Python. J. Mach. Learn. Res. 12, 2825–2830.
Posthuma, D., De Geus, E. J., Baaré, W. F., Hulshoff Pol, H. E., Kahn, R. S., and Boomsma, D. I. (2002). The association between brain volume and intelligence is of genetic origin. Nat. Neurosci. 5, 83–84. doi: 10.1038/nn0202-83
Rakic, P., Ayoub, A. E., Breunig, J. J., and Dominguez, M. H. (2009). Decision by division: making cortical maps. Trends Neurosci. 32, 291–301. doi: 10.1016/j.tins.2009.01.007
Riedel, W. J., Klaassen, T., and Schmitt, J. A. J. (2002). Tryptophan, mood, and cognitive function. Brain Behav. Immun. 16, 581–589. doi: 10.1016/S0889-1591(02)00013-2
Storsve, A. B., Fjell, A. M., Tamnes, C. K., Westlye, L. T., Overbye, K., Aasland, H. W., et al. (2014). Differential longitudinal changes in cortical thickness, surface area and volume across the adult life span: regions of accelerating and decelerating change. J. Neurosci. 34, 8488–8498. doi: 10.1523/JNEUROSCI.0391-14.2014
Tadayon, E., Pascual-Leone, A., and Santarnecchi, E. (2020). Differential contribution of cortical thickness, surface area, and gyrification to fluid and crystallized intelligence. Cereb. Cortex 30, 215–225. doi: 10.1093/cercor/bhz082
Van Essen, D. C., Smith, S. M., Barch, D. M., Behrens, T. E., Yacoub, E., Ugurbil, K., et al. (2013). The WU-minn human connectome project: an overview. Neuroimage 80, 62–79. doi: 10.1016/j.neuroimage.2013.05.041
Van Essen, D. C., Ugurbil, K., Auerbach, E., Barch, D., Behrens, T. E., Bucholz, R., et al. (2012). The human connectome project: a data acquisition perspective. Neuroimage 62, 2222–2231. doi: 10.1016/j.neuroimage.2012.02.018
Varriale, V., van der Molen, M. W., and De Pascalis, V. (2018). Mental rotation and fluid intelligence: a brain potential analysis. Intelligence 69, 146–157. doi: 10.1016/j.intell.2018.05.007
Vidal-Pineiro, D., Parker, N., Shin, J., French, L., Grydeland, H., Jackowski, A. P., et al. (2020). Cellular correlates of cortical thinning throughout the lifespan. Sci. Rep. 10:21803. doi: 10.1038/s41598-020-78471-3
Xu, H., MacKillop, J., and Owens, M. M. (2023a). A machine learning-derived neuroanatomical pattern predicts delayed reward discounting in the human connectome project young adult sample. J. Neurosci. Res. [Epub ahead of prit]. doi: 10.1002/jnr.25185
Xu, H., Wang, X., Chen, Z., Bai, G., Yin, B., Wang, S., et al. (2018). Longitudinal changes of caudate-based resting state functional connectivity in mild traumatic brain injury. Front. Neurol. 9:467. doi: 10.3389/fneur.2018.00467
Xu, H., Xu, C., Gu, P., Hu, Y., Guo, Y., and Bai, G. (2023b). Neuroanatomical restoration of salience network links reduced headache impact to cognitive function improvement in mild traumatic brain injury with posttraumatic headache. J. Headache Pain 24:43. doi: 10.1186/s10194-023-01579-0
Xu, H., Zhao, T., Luo, F., and Zheng, Y. (2019). Dissociative changes in gray matter volume following electroconvulsive therapy in major depressive disorder: a longitudinal structural magnetic resonance imaging study. Neuroradiology 61, 1297–1308. doi: 10.1007/s00234-019-02276-z
Yang, Q., Xu, H., Zhang, M., Wang, Y., and Li, D. (2020). Volumetric and functional connectivity alterations in patients with chronic cervical spondylotic pain. Neuroradiology 62, 995–1001. doi: 10.1007/s00234-020-02413-z
Yuan, P., Voelkle, M. C., and Raz, N. (2018). Fluid intelligence and gross structural properties of the cerebral cortex in middle-aged and older adults: a multi-occasion longitudinal study. Neuroimage 172, 21–30. doi: 10.1016/j.neuroimage.2018.01.032
Zhao, Q., Voon, V., Zhang, L., Shen, C., Zhang, J., and Feng, J. (2022). The ABCD study: brain heterogeneity in intelligence during a neurodevelopmental transition stage. Cereb. Cortex 32, 3098–3109. doi: 10.1093/cercor/bhab403
Keywords: crystallized intelligence, fluid intelligence, neuroanatomy, morphometry, machine learning, elastic net regression
Citation: Xu H, Xu C, Yang Z, Bai G and Yin B (2023) Two sides of the same coin: distinct neuroanatomical patterns predict crystallized and fluid intelligence in adults. Front. Neurosci. 17:1199106. doi: 10.3389/fnins.2023.1199106
Received: 02 April 2023; Accepted: 08 May 2023;
Published: 25 May 2023.
Edited by:
Yingying Tang, Shanghai Jiao Tong University, ChinaReviewed by:
Shouliang Qi, Northeastern University, ChinaAnar Amgalan, University of Southern California, United States
Copyright © 2023 Xu, Xu, Yang, Bai and Yin. This is an open-access article distributed under the terms of the Creative Commons Attribution License (CC BY). The use, distribution or reproduction in other forums is permitted, provided the original author(s) and the copyright owner(s) are credited and that the original publication in this journal is cited, in accordance with accepted academic practice. No use, distribution or reproduction is permitted which does not comply with these terms.
*Correspondence: Hui Xu, aHVpeHVqeEBnbWFpbC5jb20=; Bo Yin, NzZ5aW5ib0AxNjMuY29t