 Meng-Ting Li
 Jia-Wei Sun
 Lin-Lin Zhan
 Collins Opoku Antwi
 Ya-Ting Lv
 Xi-Ze Jia
 Jun Ren
- 1School of Psychology, Zhejiang Normal University, Jinhua, China
- 2Department of Clinical Neuroscience, Division of Neuro, Karolinska Institutet, Stockholm, Sweden
- 3School of Western Studies, Heilongjiang University, Harbin, China
- 4Center for Cognition and Brain Disorders, The Affiliated Hospital, Hangzhou Normal University, Hangzhou, China
Introduction: Default mode network (DMN) is the most involved network in the study of brain development and brain diseases. Resting-state functional connectivity (rsFC) is the most used method to study DMN, but different studies are inconsistent in the selection of seed. To evaluate the effect of different seed selection on rsFC, we conducted an image-based meta-analysis (IBMA).
Methods: We identified 59 coordinates of seed regions of interest (ROIs) within the default mode network (DMN) from 11 studies (retrieved from Web of Science and Pubmed) to calculate the functional connectivity; then, the uncorrected t maps were obtained from the statistical analyses. The IBMA was performed with the t maps.
Results: We demonstrate that the overlap of meta-analytic maps across different seeds’ ROIs within DMN is relatively low, which cautions us to be cautious with seeds’ selection.
Discussion: Future studies using the seed-based functional connectivity method should take the reproducibility of different seeds into account. The choice of seed may significantly affect the connectivity results.
1. Introduction
Our brain is a network of spatially distributed but functionally linked regions. Increasingly, and rightly, studies have treated the brain as an integrative network with regions neatly interacting functionally, using resting-state functional connectivity (Van den Heuvel and Hulshoff Pol, 2010). Resting-state functional connectivity (rsFC) refers to temporal dependence of neuronal activity patterns of anatomically separated brain regions when resting (Aertsen et al., 1989; Friston et al., 1993; Biswal et al., 1995). Relevant studies contribute to our understanding of this spontaneous activity, which forms communication across brain regions (Rosazza et al., 2012).
Seed-based functional connectivity was the first method employed to identify the resting state networks and provided a direct way to examine the regions with robust functional connectivity with the seed ROI (Cole et al., 2010; Smitha et al., 2017). The mean resting-state time series from the seed region correlated with the time series from other voxels of the entire brain results in a functional connectivity map (FC map). Thus, one could obtain the rsFC information of any meaningful voxel or brain region from the FC map. The map provides an elegant way to examine functional connectivity in the human brain (Van den Heuvel and Hulshoff Pol, 2010). This fundamental method has been applied in many studies (e.g., Cordes et al., 2000; Fox et al., 2005; Ji et al., 2020). In particular, it has been widely deployed in disease prognostication. The findings reveal considerable variability in neuropsychiatric illnesses, including Parkinson’s disease (Bi et al., 2020, 2021), schizophrenia (Yang et al., 2018), depression (Yu et al., 2020) and migraine (Wei et al., 2020). Notably, to perform seed-based FC, the seed (i.e., ROI) needs to be defined. Specifically, the seed ROI can be determined by activating the relevant task or using prior anatomical knowledge or standard brain atlases (Wu et al., 2018). However, there is no gold standard for selecting the seed. Given the multiplicity of available options (Sohn et al., 2015), the reproducibility across different seed ROIs is uncertain.
Cordes et al. (2000) noted that not every selected seed voxel yields the same functional connectivity map. However, whether and to what extent different seeds will significantly influence the results of the seed-based functional connectivity is unclear. The default mode network, the most fundamental resting-state network, is observed to be active even when people are not engaged in any goal-directed cognitive activities and show a deactivation pattern (Shulman et al., 1997; Bonnelle et al., 2012). The DMN is consist of medial prefrontal cortex (MPFC), posterior cingulate cortex/precuneus (PCC/PrC) and bilateral inferior parietal lobules (IPL) (Assaf et al., 2010). Zuo and Xing (2014) conducted a multisite analysis of resting-state metrics’ test–retest reliability. They found that the default mode network was one of the most reliable ones within the seven brain networks, including visual, somatomotor, dorsal attention, limbic, frontoparietal and DMN networks (Yeo et al., 2011). Sex differences were chosen to identify the statistical difference in the functional connectivity because sex can be easily tested across large scale datasets in the light of its objective nature (Chen et al., 2018). Meanwhile, the functional differences in the human brain between men and women have been well investigated in previous resting-state studies. Allen et al. (2011) explored the effect of sex on the resting state networks (RSNs) and found females generate stronger intra-network connectivity and meles show stronger inter-network connectivity. Beltz et al. (2015) investigate the sex-related differences in resting state brain function of smokers and identified greater connectivity within the DMN in women and greater connectivity within the reward network in men. Evidences from these studies supported the importance of sex differences in resting state studies.
The present study aims two-fold: first, to identify whether the results contained in functional connectivity studies using different seeds are reproducible; second, to quantify the effect of the spatial location of seed ROIs on the seed-based functional connectivity.
2. Materials and methods
2.1. Participants and imaging protocols
MRI data were obtained from the Consortium for Reliability and Reproducibility (CoRR) (Zuo and Xing, 2014). The 36 datasets from the CoRR originally included 1725 participants who underwent at least two scanning sessions. Here, we only chose the baseline RS-fMRI data to analyze the functional connectivity difference between males and females. With the above exclusion criteria, we made quality control. From this perspective, 1,290 participants from 30 datasets were selected (age 25.797 ± 15.538, 671 females, see Table 1 for details). Six datasets were excluded due to the loss of information or the small sample size of participants. Participants from the rest of the datasets were excluded if their head motion was excessive (more than 2.5 mm of maximal translation in any direction of x, y, or z or 2.5°of maximal rotation throughout scanning). To control the confounds of handedness, participants with non-right handedness were excluded. Participants with low-quality normalization or incomplete brain coverage were excluded. In addition, age was matched (p > 0.5, two sample T-test) between male and female groups in each dataset.
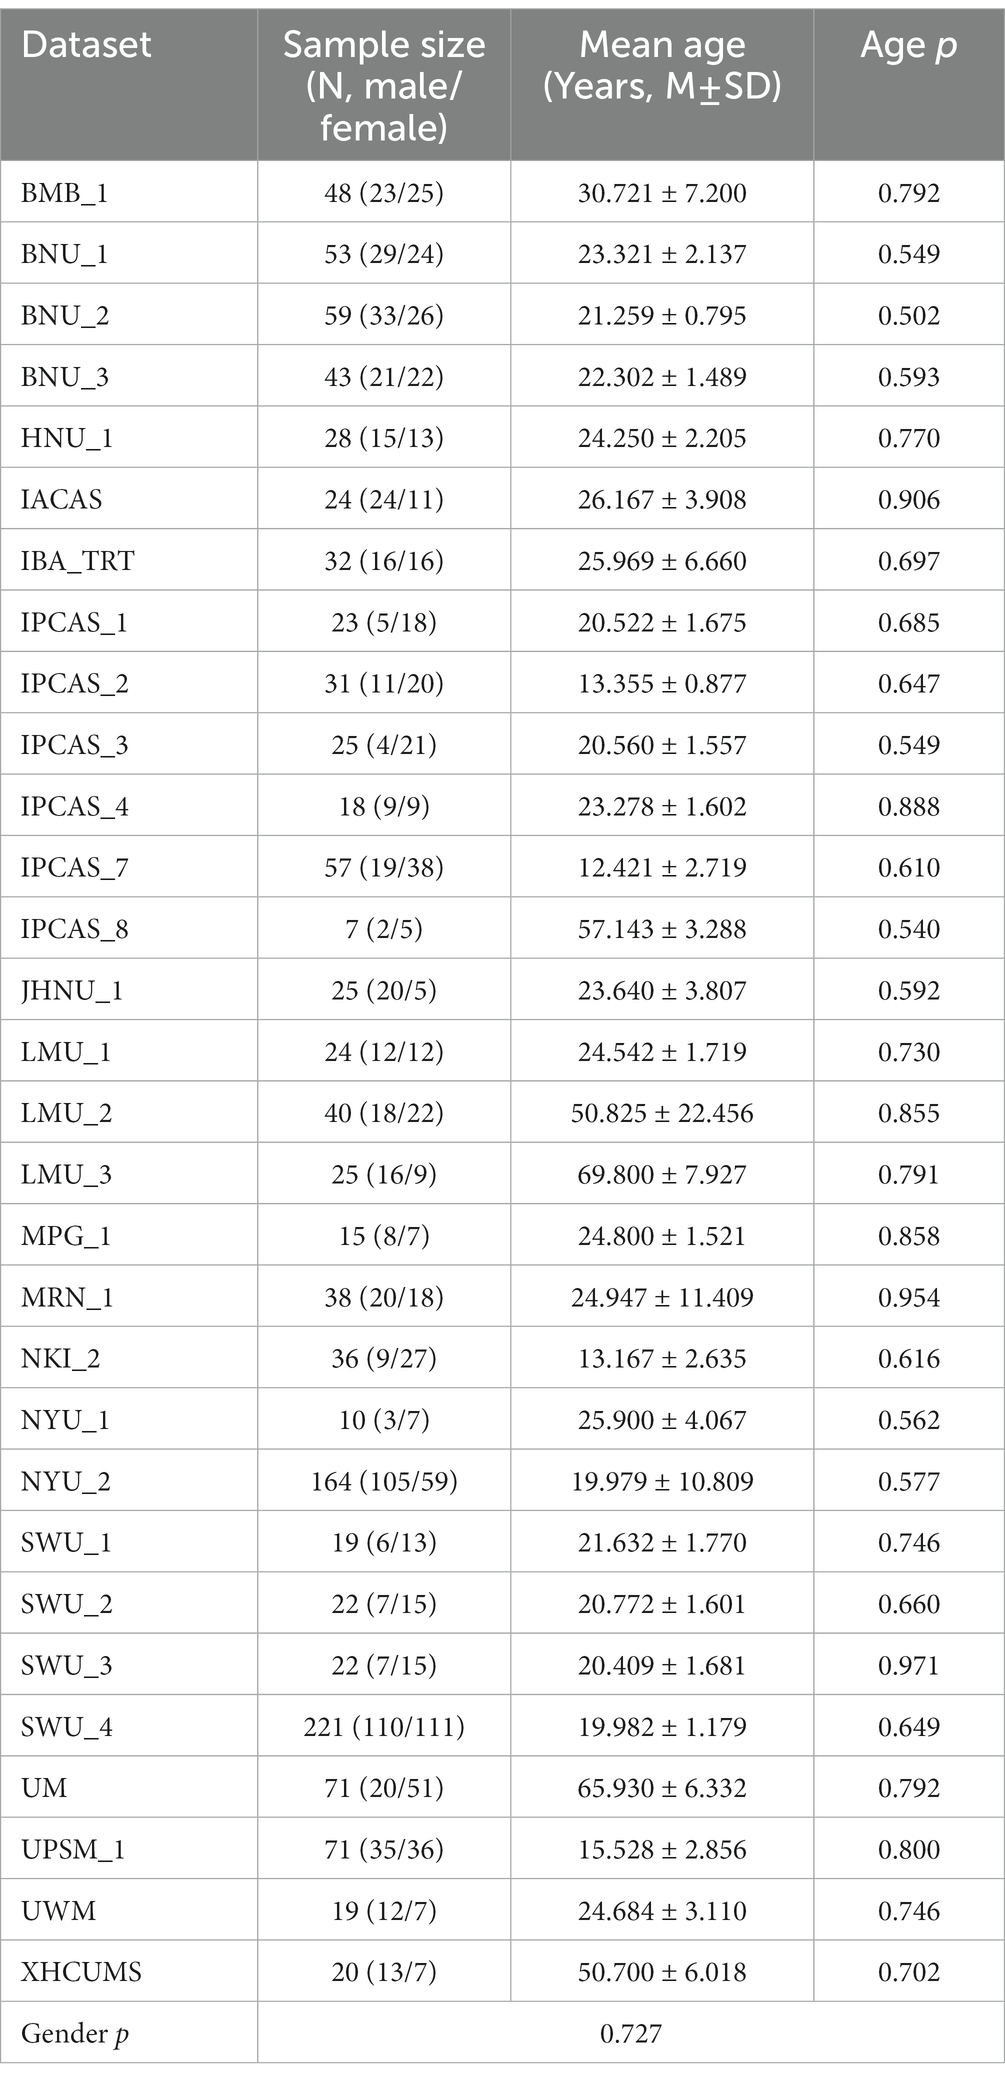
Table 1. Sample characteristics of CoRR dataset.
2.2. Data preprocessing
All preprocessing of resting-state fMRI data was processed using RESTplus V1.24 (Jia et al., 2019). Initially, the first 10 time points were discarded to overcome the influence of instability when the scanner was switched on while participants adapted to the scanner’s noise. Second, a slice-timing correction was performed to correct the acquisition time delay for all volumes. Third, head motion correction. Fourth, individual structural images were co-registered to mean functional images; then, the co-registered structural images were segmented into gray matter (GM), white matter (WM), cerebrospinal fluid (CSF), bone, soft tissue and air/background (Kazemi and Noorizadeh, 2014). Parameters generated from step 4 were used to apply for functional images spatially normalized to Montreal Neurologic Institute space (the resampling voxel size = 3 mm × 3 mm × 3 mm). Fifth, normalized fMRI data were smoothed with a Gaussian kernel of 6 mm × 6 mm × 6 mm full-width at half maximum (FWHM). Sixth, the linear trend of the time course was removed. Next, head motion effects (using Friston 24 parameters) (Friston et al., 1996), global mean signals and white matter signals were regressed out to minimize confounds. Finally, data were temporally band-pass filtered (0.01 Hz – 0.08 Hz).
2.3. Functional connectivity calculation
Fifty-nine coordinates within DMN were extracted from the 11 studies, and all coordinates were converted to Montreal Neurological Institute space. As for resting-state functional connectivity, we defined fifty-nine spherical regions of interests (ROIs) with a radius of 6 mm centered on the fifty-nine coordinates. The radius was defined in line with a prior study (Yu et al., 2020). After data preprocessing, the time course of each seed ROI was extracted, and functional connectivity was calculated by computing the Pearson correlation coefficient between the mean signal time course from the ROI and all other voxels in the entire brain.
3. Statistical analysis
To increase the normality of the distribution of correlation, all FC maps were transformed from r values to z values through Fisher’s r-to-z transformation. Further, two-sample t-tests were performed using Data Processing & Analysis for Brain Imaging (DPABI) (Yan et al., 2016) to compare the difference between males and females’ FC maps, which Fisher’s r-to-z transformation has processed. Finally, all t maps were used for subsequent image-based meta-analysis.
Meanwhile, to show the functional connectivity pattern of each seed in different gender, for each seed, we also calculated the one sample t test results of FC maps of different genders with center as covariate (Results maps see Supplementary Figures S2–S60 in the supplementary material).
3.1. Literature search
A literature search of relevant articles was conducted in Web of Science and PubMed as of December 13, 2020, using the keywords “default mode network” or “DMN.” First, the titles of highly cited papers on the topic labeled by the databases were recorded. Then, a full-text search for these articles was performed to assess the documents for those that provided coordinates of DMN nodes. Finally, the reference lists of articles with coordinates of DMN nodes were manually scanned for other articles that were not retrieved at the database search phase. When multiple articles reported exact coordinates, the earliest one was included. And if the coordinates reported in the papers were quoted, the source article was selected instead. When the coordinates of the same article were inconsistent in different references, the coordinates reported in the original research were included. As a result, 68 articles were identified by our search. These criteria generated 59 coordinates of DMN nodes from 11 articles that were retrieved from our searches.
3.2. Data extraction and coding
All coordinates were converted to Montreal Neurological Institute space using the tal2icbm transform (Lancaster et al., 2007). According to the converted coordinates, each seed was categorized into a brain region of anatomical automatic labeling (AAL) atlas (Tzourio-Mazoyer et al., 2002) (see Table 2 for details). Visualization of seeds and brain network were shown through the BrainNet Viewer software (Xia et al., 2013).
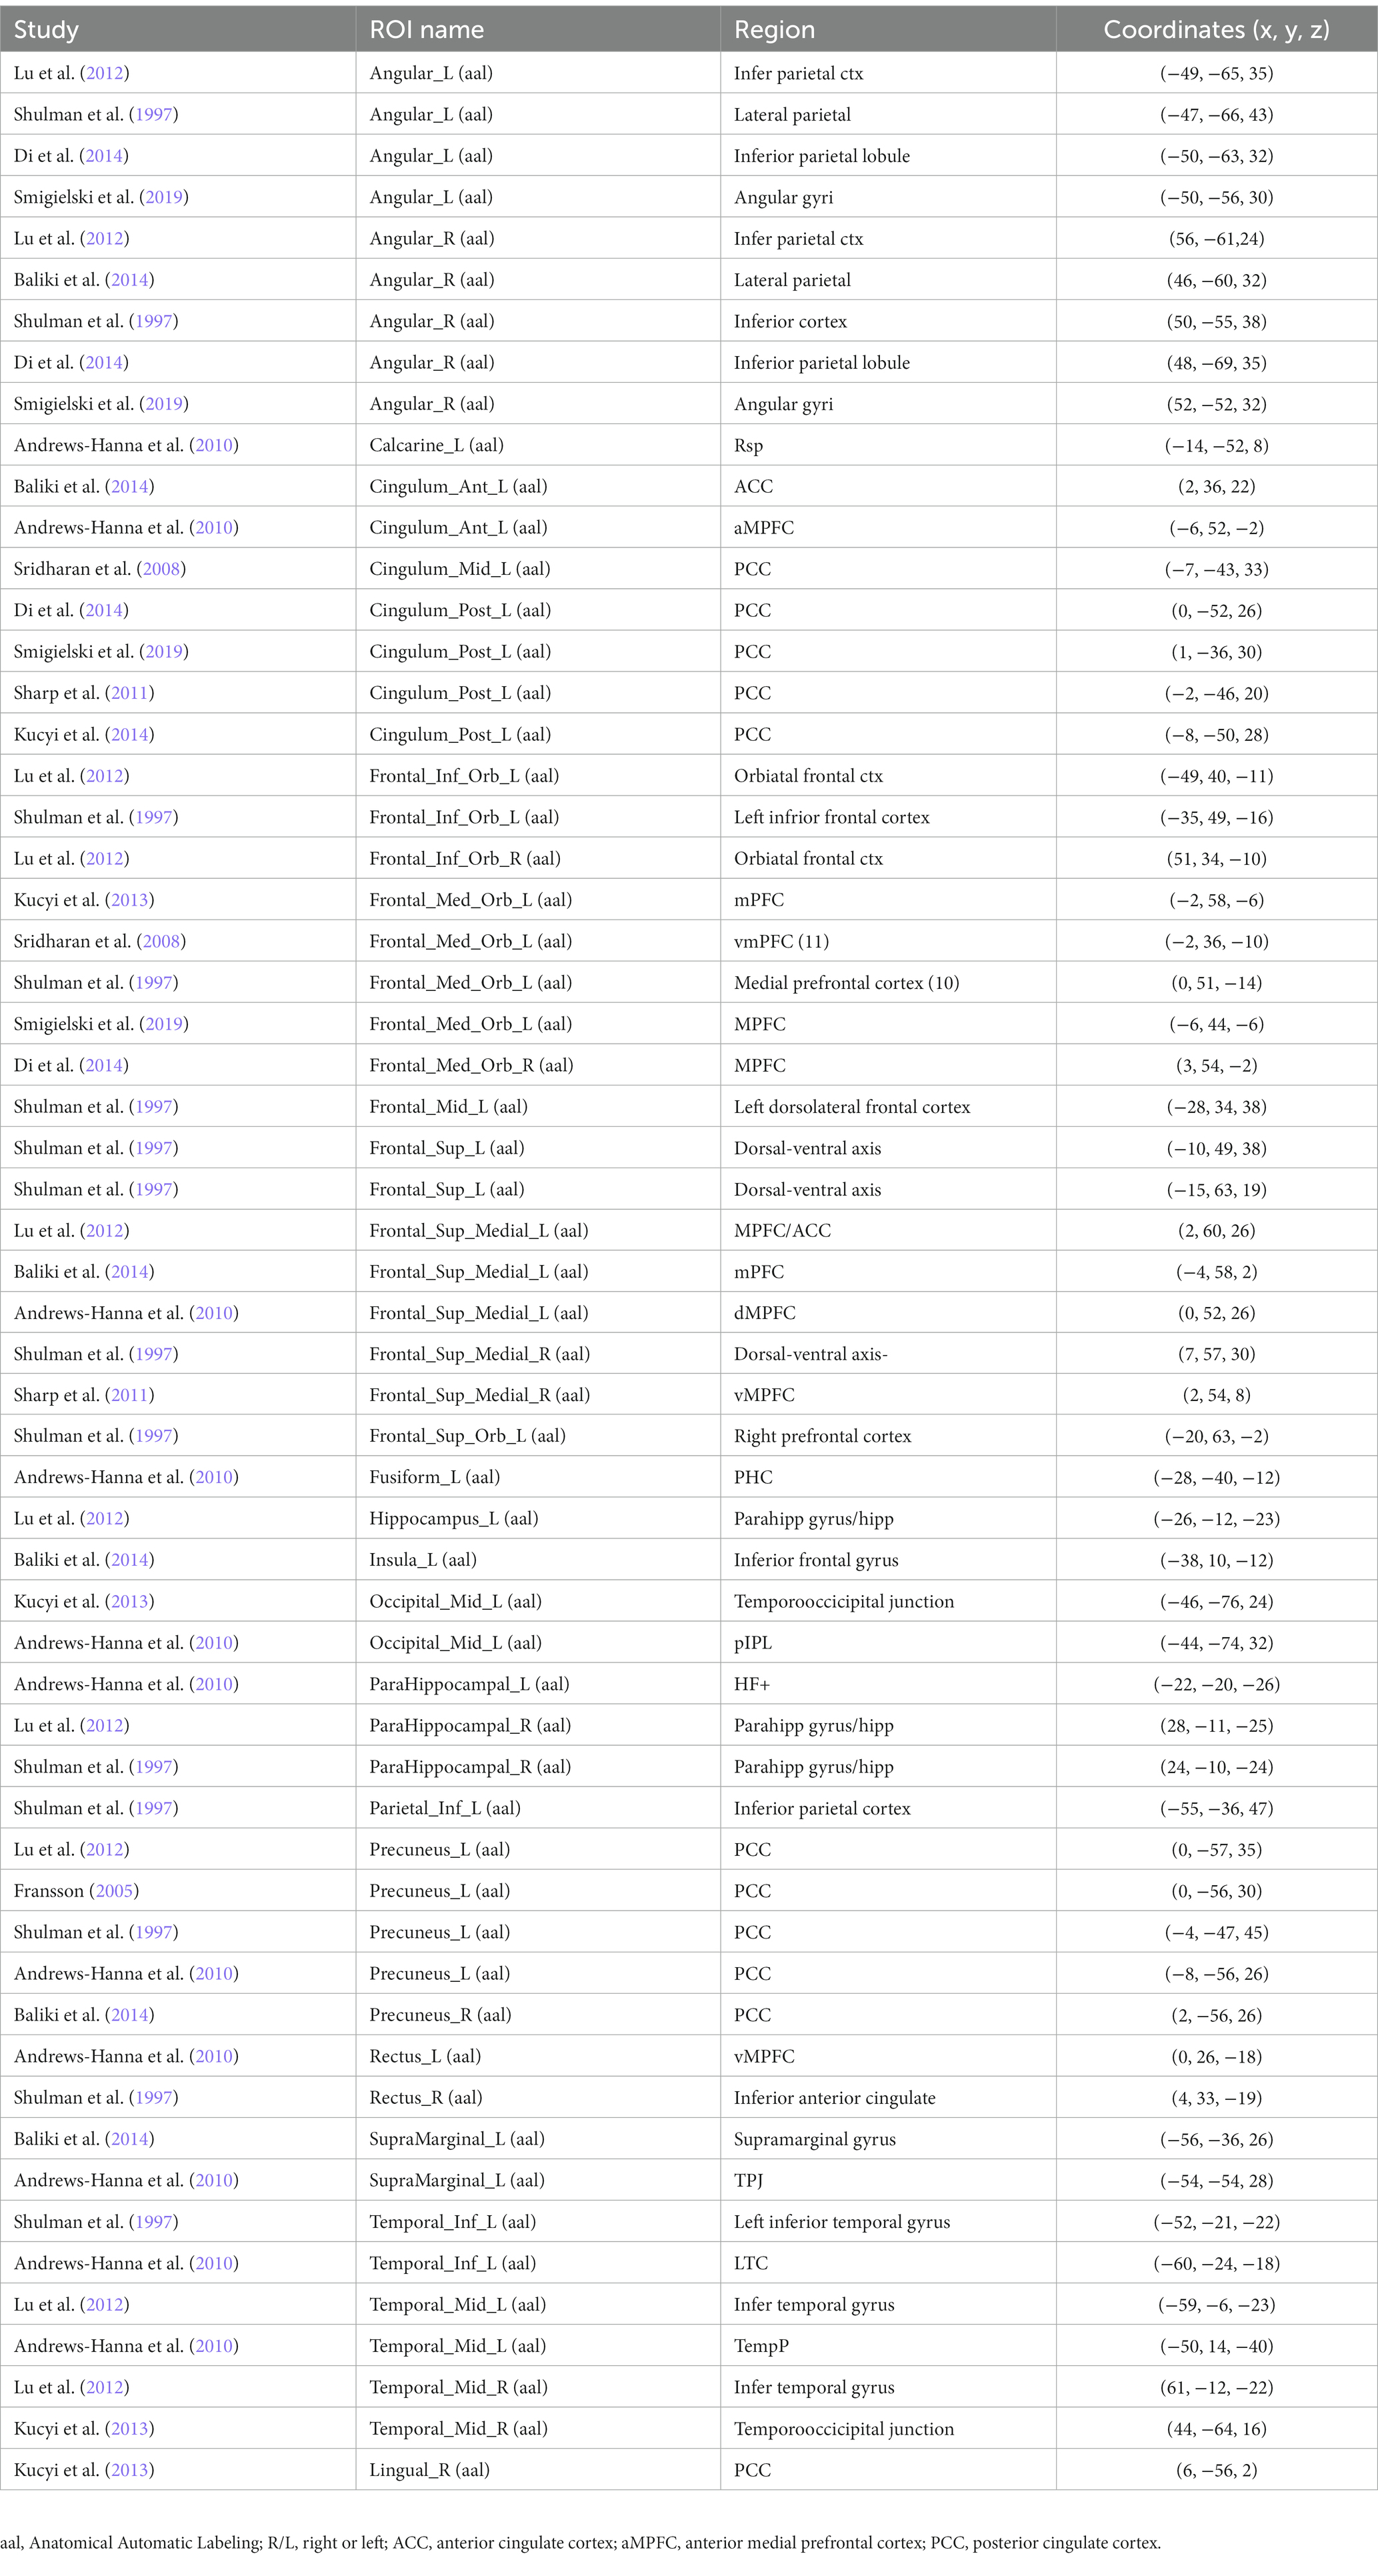
Table 2. Montreal Neurological Institute (MNI) coordinates of 59 DMN regions of interest (ROIs).
3.3. SDM Meta-analysis
We performed an image-based meta-analysis named Anisotropic Effect-Size Signed Difference Mapping (AES-SDM, version 5.15) to examine the FC differences between male and female. The AES-SDM approach uses full statistical images as input and allows both positive and negative values of the same map to be preserved (Joaquim Radua et al., 2014). This approach has been found valid and well described in previous studies (see Peters et al., 2012; Radua et al., 2012; Joaquim Radua et al., 2014; Welton et al., 2015).
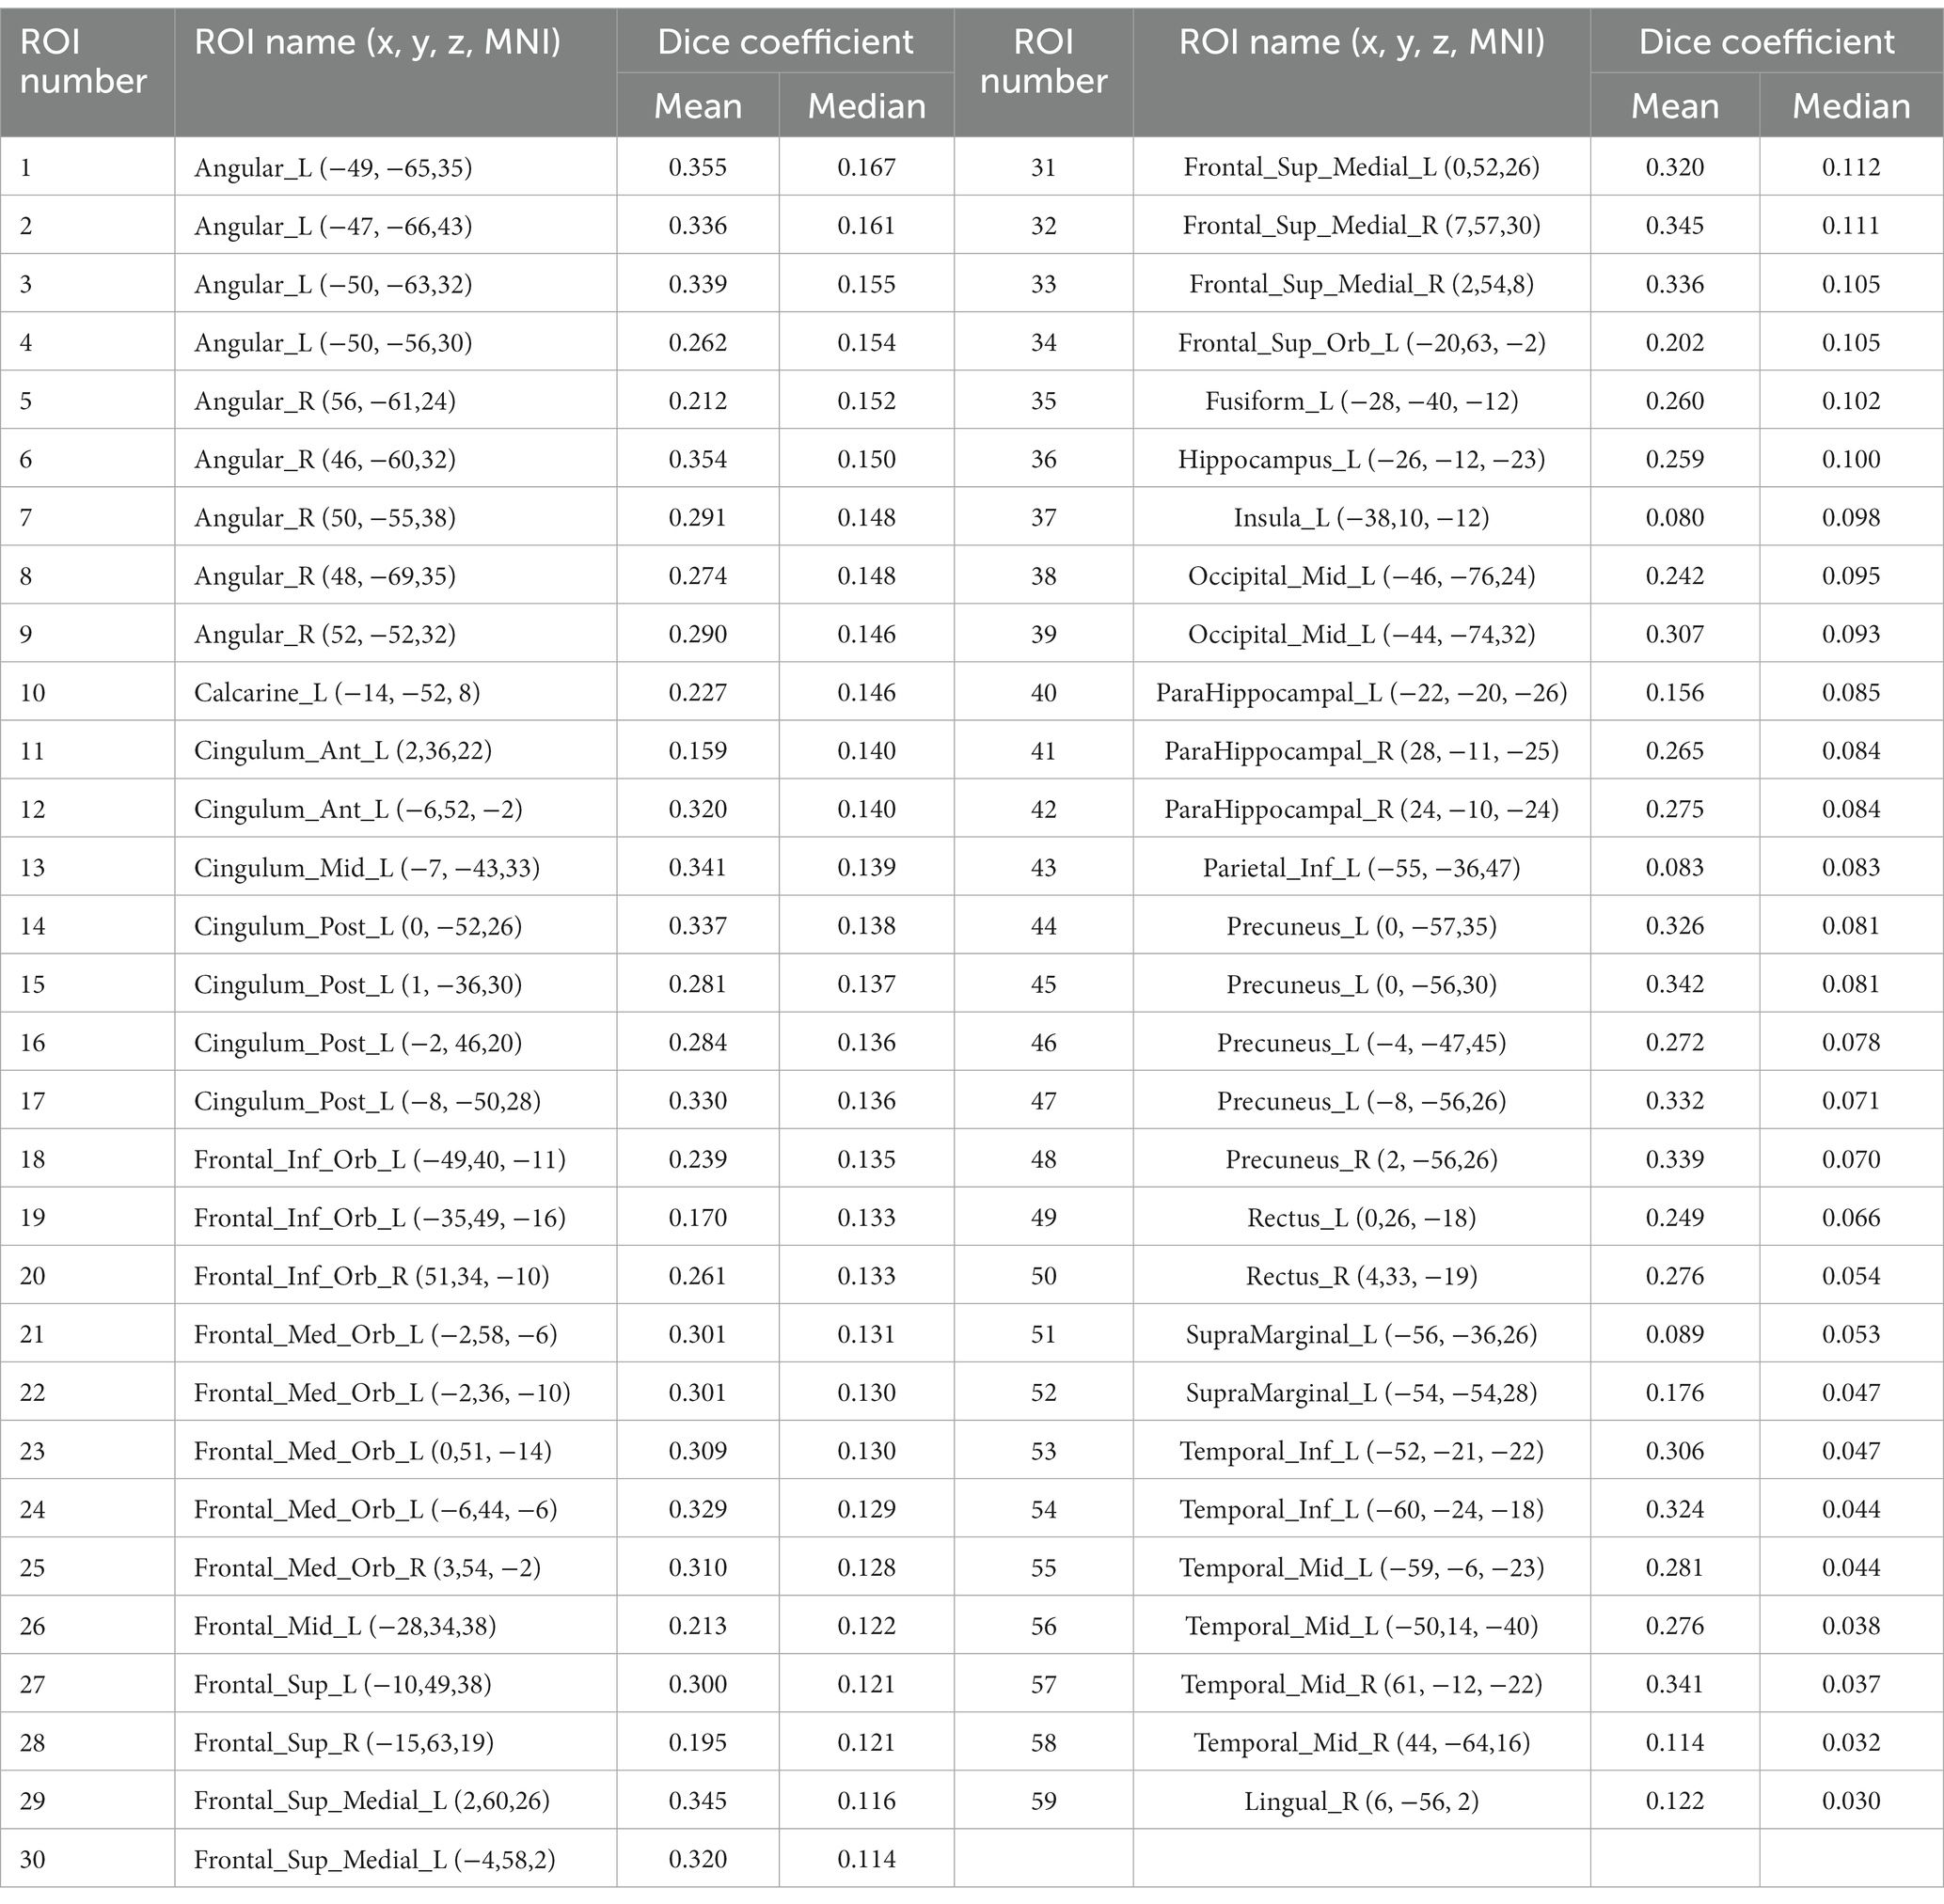
Table 3. The mean and median Dice coefficient of each seed ROI.
For each center, AES-SDM constructs an effect size and corresponding variance map from the unthresholded two sample T-map. The method uses a standard random-effects model, which considers sample size, study precision and between-study heterogeneity, to combine the maps of different effect sizes and variance of different centers. The random-effects model ensures that studies with larger sample size or lower variability contribute more to the meta-analysis results. A randomization test that randomizes the location of the voxels within the SDM gray matter template was performed to assess the statistical significance. Since the corrected p value in fMRI articles is seriously affected by methodological factors, AES-SDM uses a combination of two thresholds, in which four uncorrected p values (p = 0.005, p = 0.001, p = 0.0005; p = 0.0001) are applied separately as the main threshold. In addition, a Z-based threshold is added to reduce the possibility of false-positive results (we set z > 1.00, which is the default setting of AES-SDM). Meanwhile, 10 voxels were applied to threshold the cluster size.
4. Results
4.1. Meta analysis results of gender difference
The meta-analytic maps of 30 centers in each seed were shared online.1
4.2. Consistency of meta-analytic results
Meta-analysis can produce robust results and therefore be used here to investigate the reproducibility across different seeds. To evaluate the consistency of meta results among all DMN seeds, we calculated the overlap percentage of each voxel of all 59 meta-analytic brain images at four meta uncorrected P thresholds (Figure 1). Specifically, a binarized mask was created for each meta-analytic image. Further, we summed all the binary maps voxel-by-voxel and calculated an overlap rate map. Specifically, all the 59 meta-analytic maps firstly transformed into a binarized map which means that all the ono-zero values were transformed into 1 and zero values keep unchanged. For each voxel in the whole brain, the consistency value was calculated by dividing the sum of the values in all the 59 binarized maps by 59. The percentage of most voxels is less than 10% which showed very low overlap among these DMN seeds (Figures 2, 3). Compared with the whole brain voxel number, a minimal number of voxels exceed 50% regardless of the different thresholds of meta-analysis, which provide us with an intuitive distribution of the overlap among meta-analytic results.
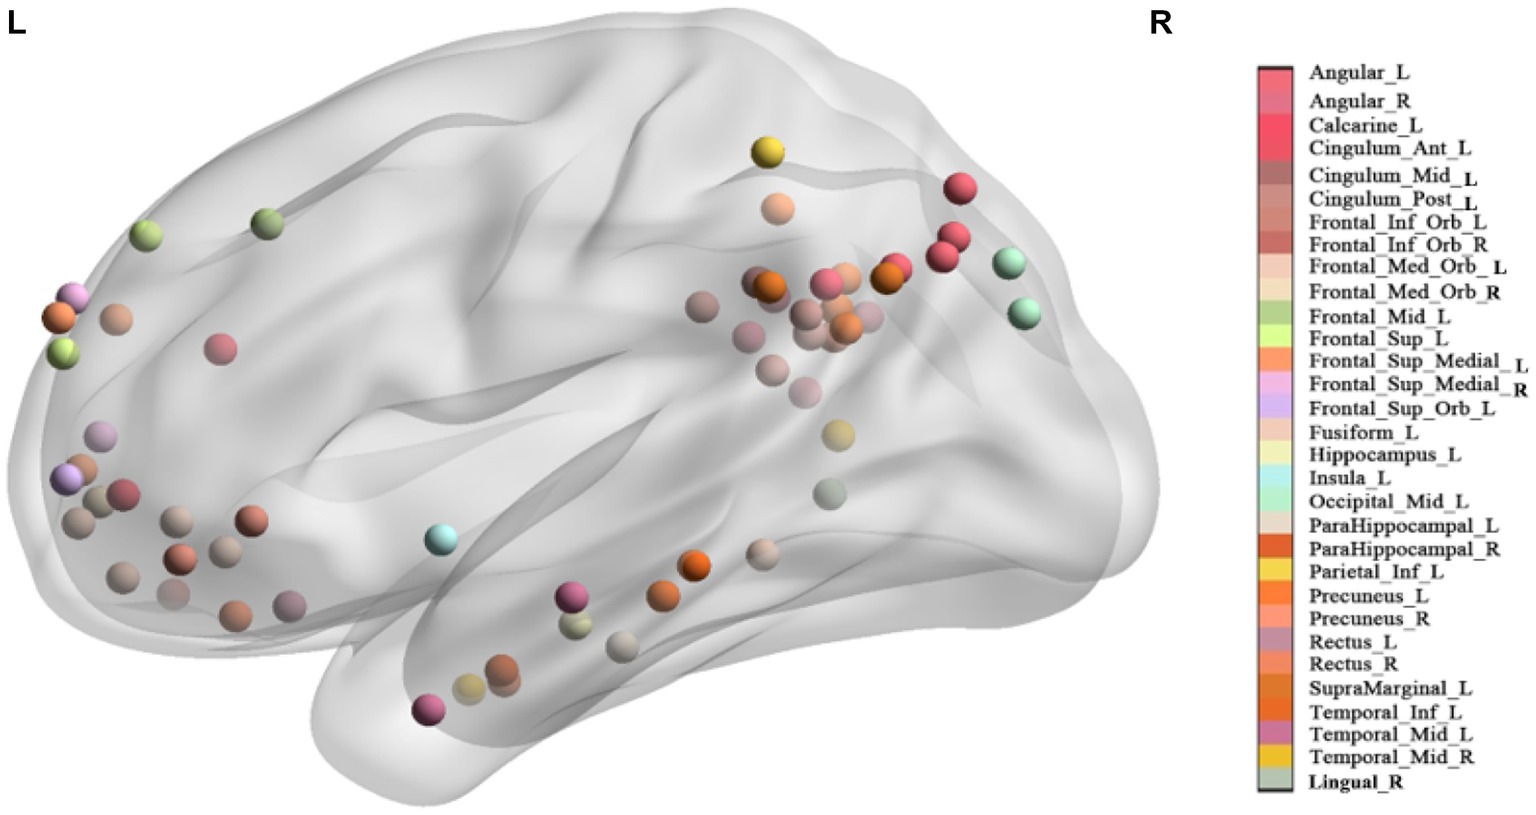
Figure 1. The location of each seed. Seeds with the same name are marked with the same color (See Supplementary Figure S1 in the supplementary material for multiple view).
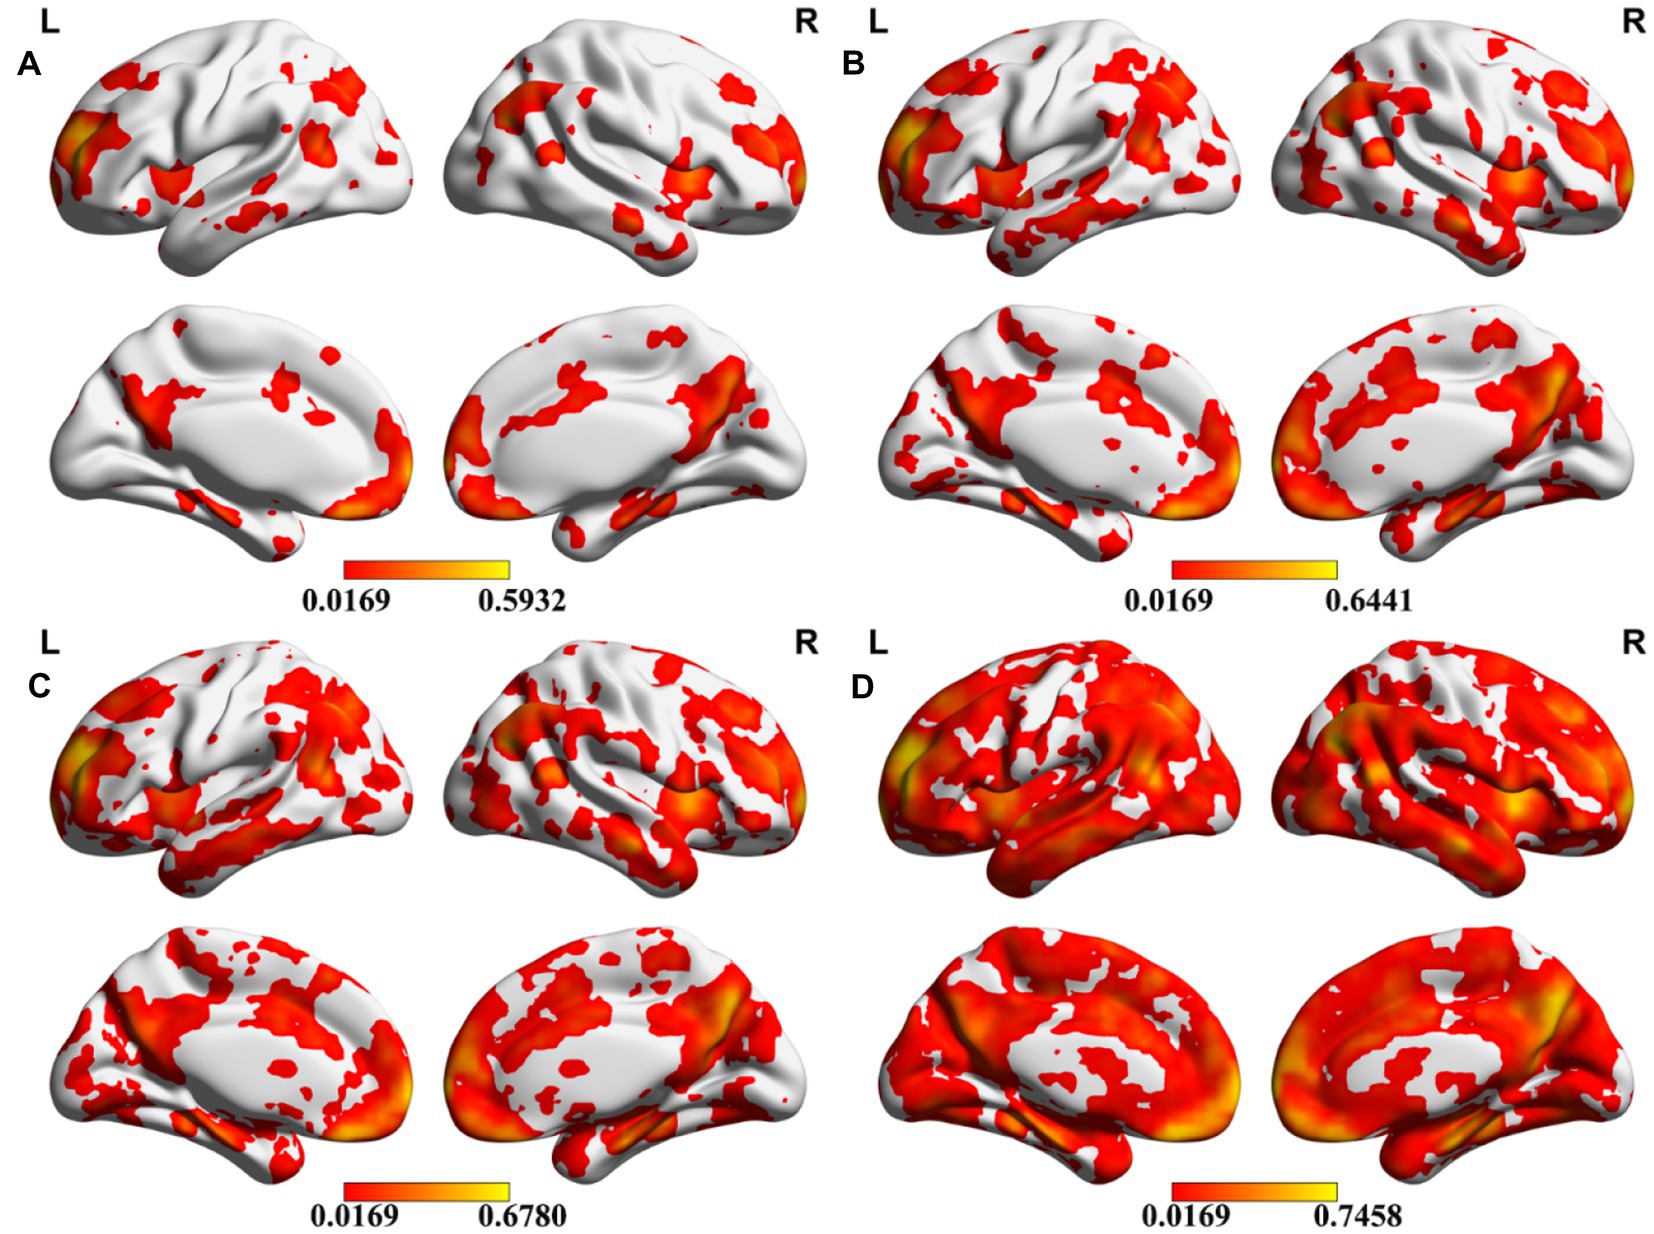
Figure 2. Overlap of different seeds. Meta-analytic results were transformed to binary images, and the percentage of each voxel was calculated after all binary images added together. The color bar indicates the overlap rate of each voxel. A–D present the results under four uncorrected thresholds of the meta-analysis (p = 0.0001, p = 0.0005, p = 0.001, p = 0.005).
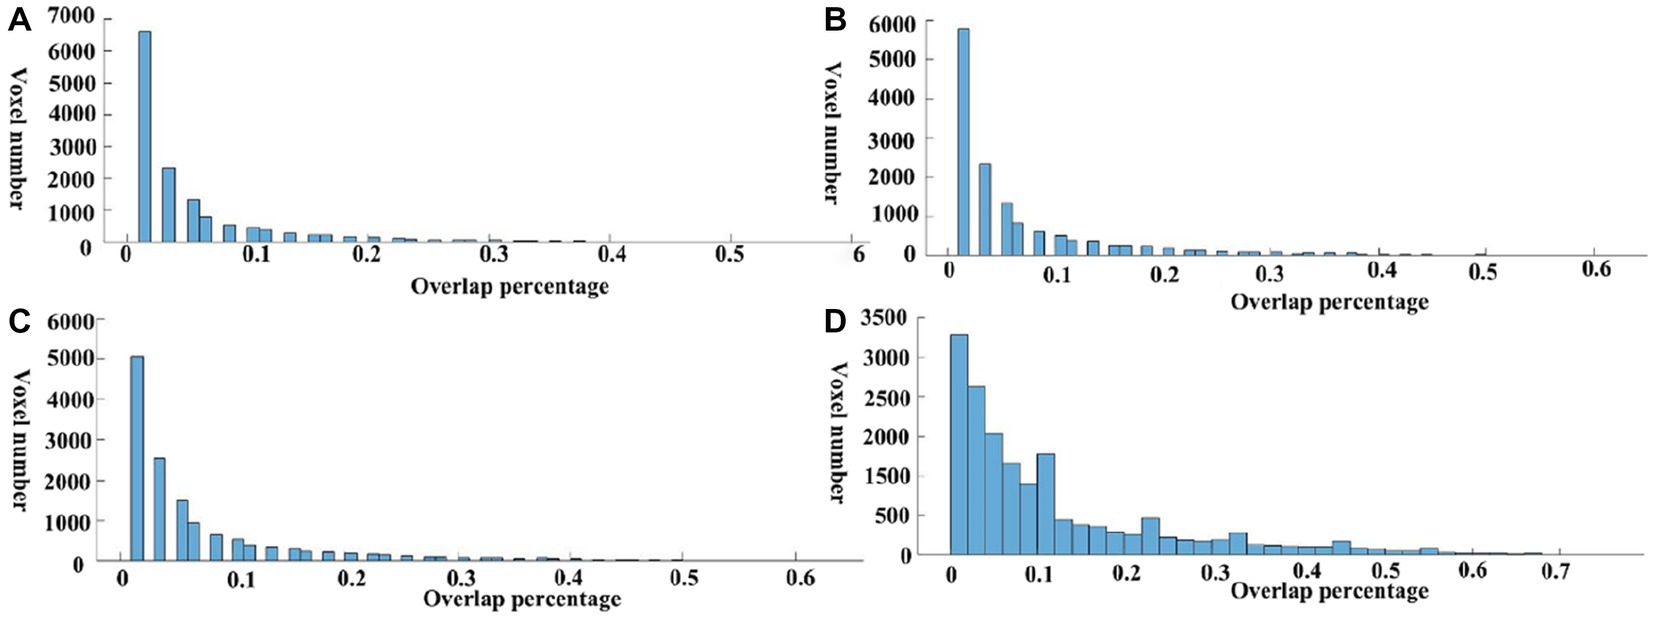
Figure 3. Overlap percentage of different seeds. The value of each voxel in the overlap maps was extracted, and the voxel number under each overlap percentage was calculated. A–D present the results under four uncorrected thresholds of the meta-analysis (p = 0.0001, p = 0.0005, p = 0.001, p = 0.005).
4.3. Overlap between different brain regions of DMN
The Dice coefficient (Dice, 1945) was used to evaluate replicability between every two seeds of DMN, which is calculated by the formula:
V1 and V2 are the number of non-zero voxels in two IBMA images that are thresholded in the meta-analysis. Voverlap is the number of non-zero voxels in both images. Dice coefficient ranges from 0 to 1, in which 0 represents no overlap and 1 represents good overlap. Figure 4 displays the Dice coefficient matrix across different DMN seeds. It is observed that the overlap among these seeds is not very good in general.
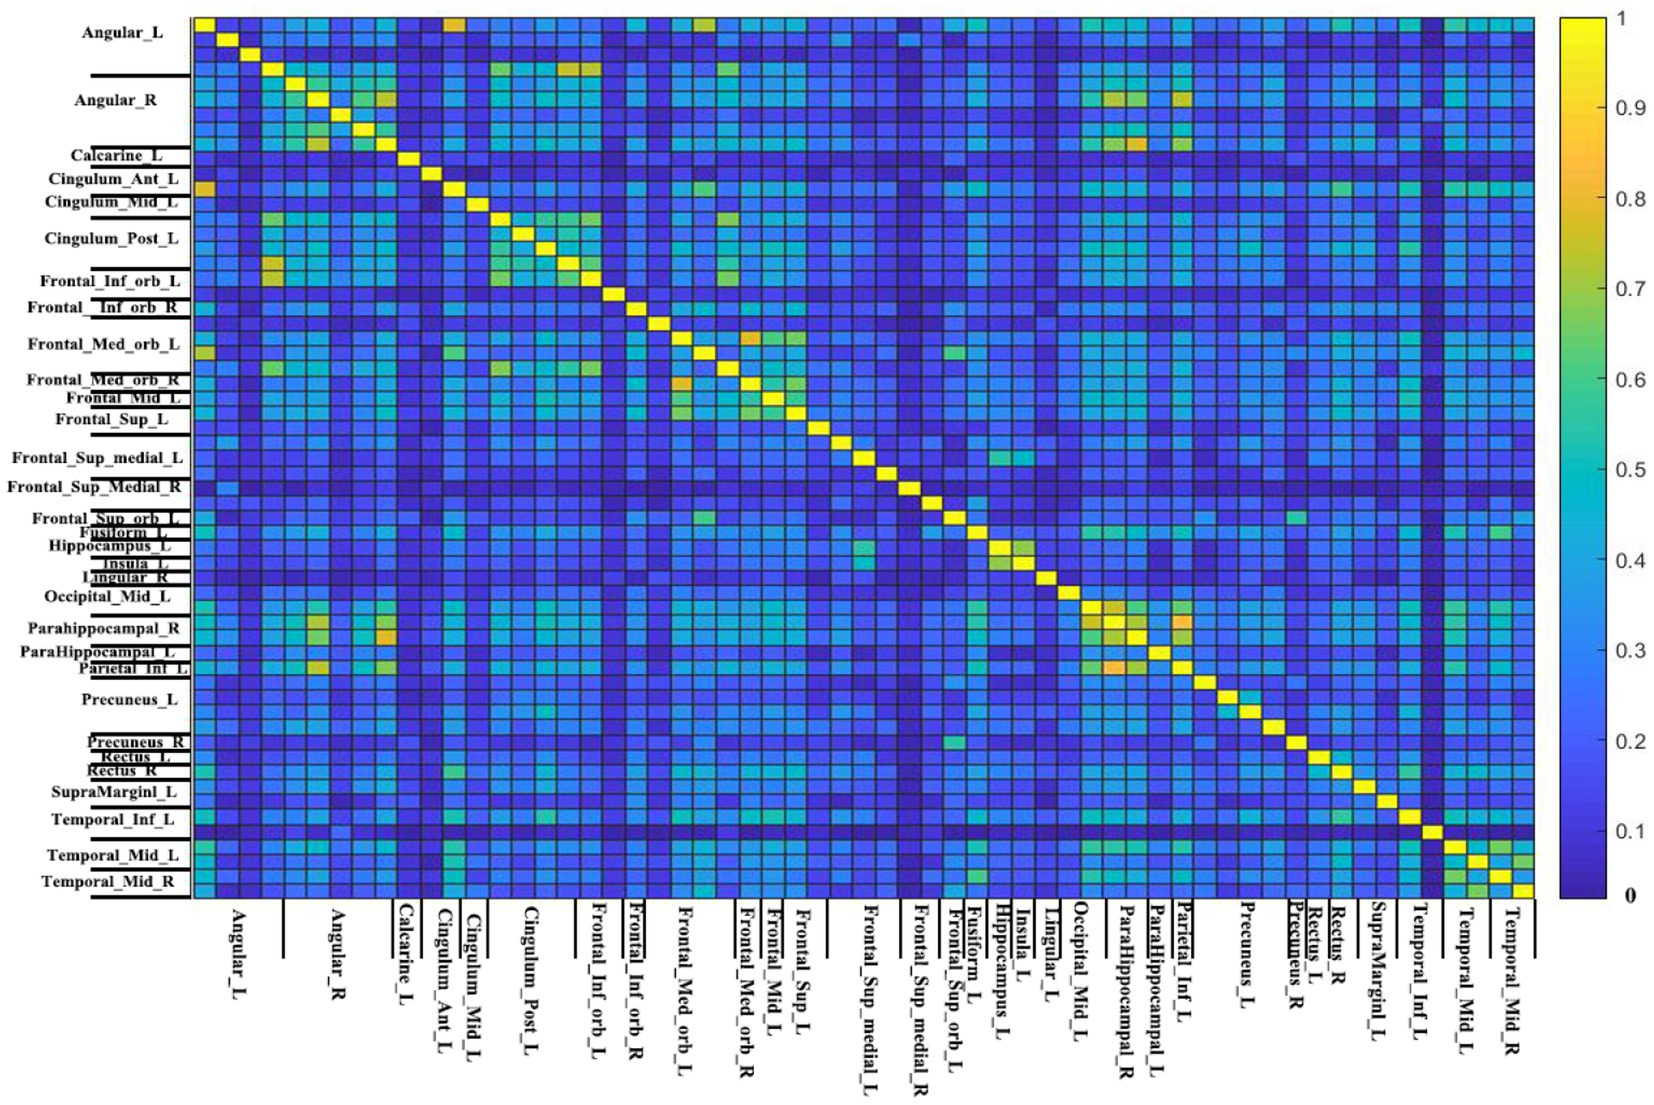
Figure 4. The Dice coefficient matrix. The threshold-free Dice coefficient matrix of each seed with all other seeds represent the overlap of every two meta-analytic maps. This is because the name of seeds between two short lines is the same (just different in location). The color bar indicates the Dice coefficient. The higher the Dice coefficient, the better the overlap.
To measure the general overlap of different DMN brain regions without being affected by the extreme values, we calculated the median Dice coefficient of each seed (Figure 5). The median Dice coefficient of 59 DMN seeds was from 0.043 which belongs to Temporal_Inf_L (−60, −24, −18) to 0.337 originating from Angular_R (46, −60, 32). It also revealed a poor overlap among these seeds, illustrating in Figure 4 that the overlaps of different DMN seeds are quite different.
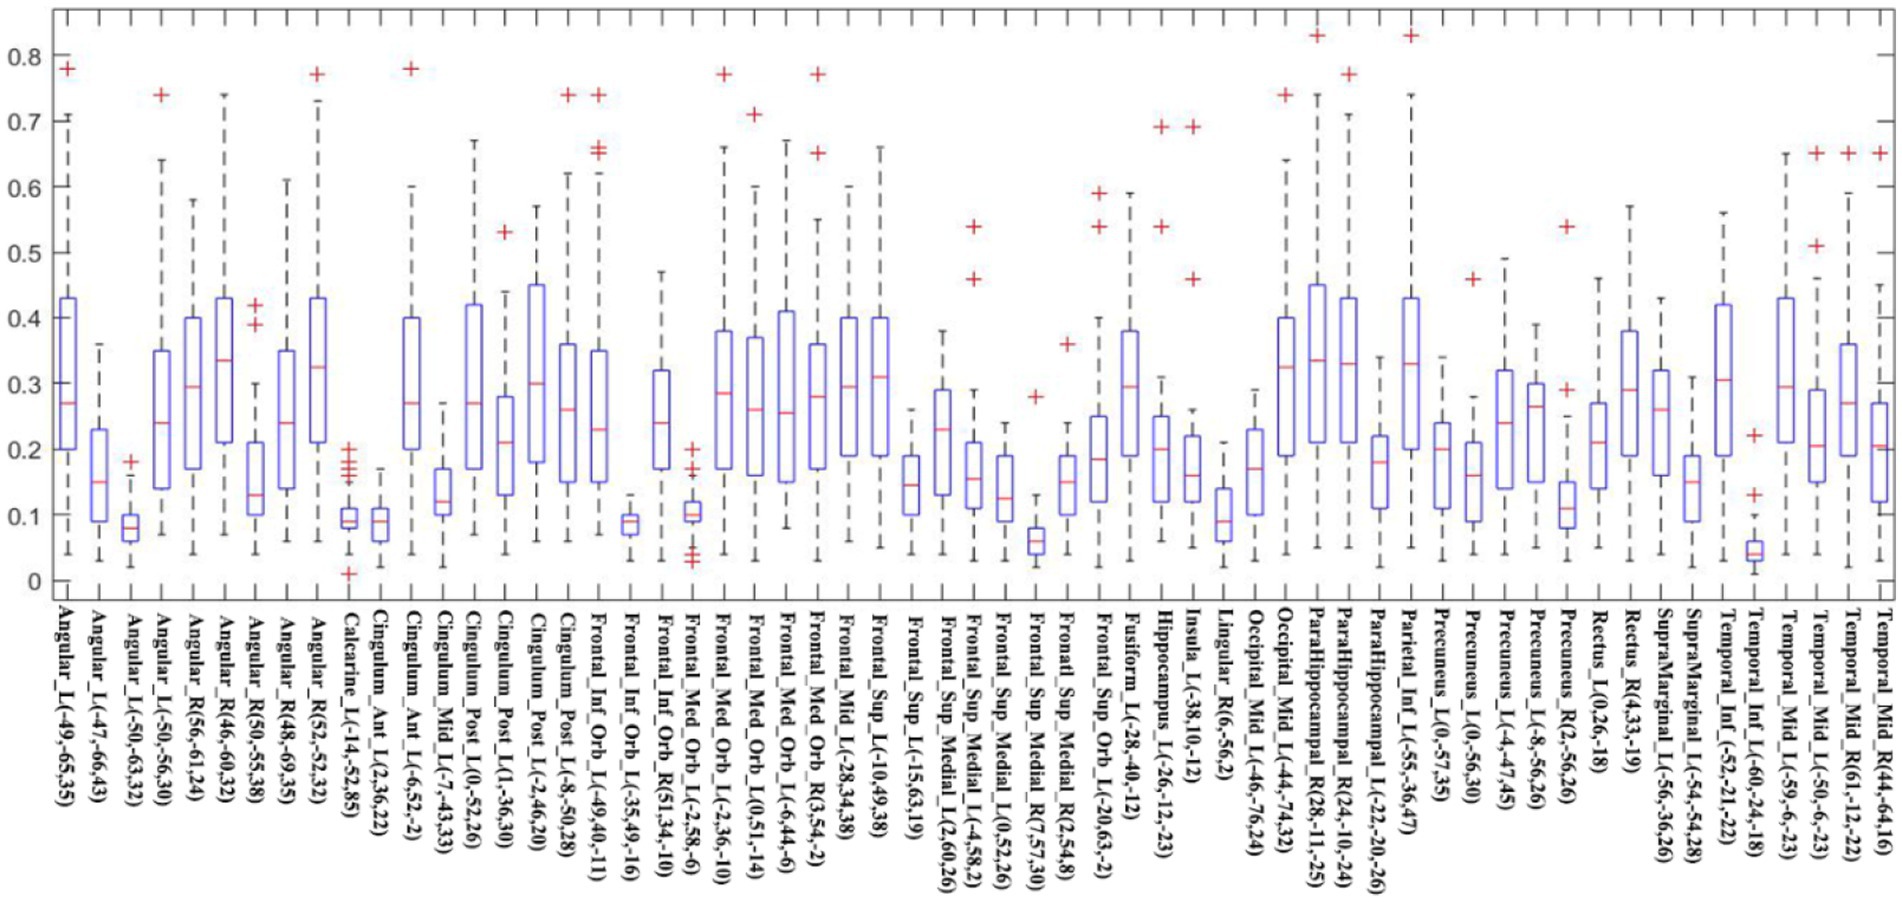
Figure 5. The Dice coefficient of each seed is shown using a boxplot. The red line in every box represents the median Dice coefficient, and the edges of the box represent the 25th and 75th percentiles. The whiskers extend to 1.5 interquartile range (IQR), and red “+” signs display values beyond 1.5 IQR. This note applies to the following Boxplots.
4.4. Classification of different DMN seeds
To figure out which seed yielded better overlap results, we further calculated the average of all medians and considered the seeds above average with a higher overlap than those below average (see Figure 6). As Figure 6 shows, the nodes have a higher median Dice coefficient with a relatively similar distribution. Therefore, we believe that the meta results of these seeds are much more consistent. And Figure 6B showed the distribution of seeds with a lower median Dice coefficient, which represents that these seeds showed lower overlap with other seeds belonging to DMN. The mean and median Dice coefficient of each seed was showed in the Table 3.
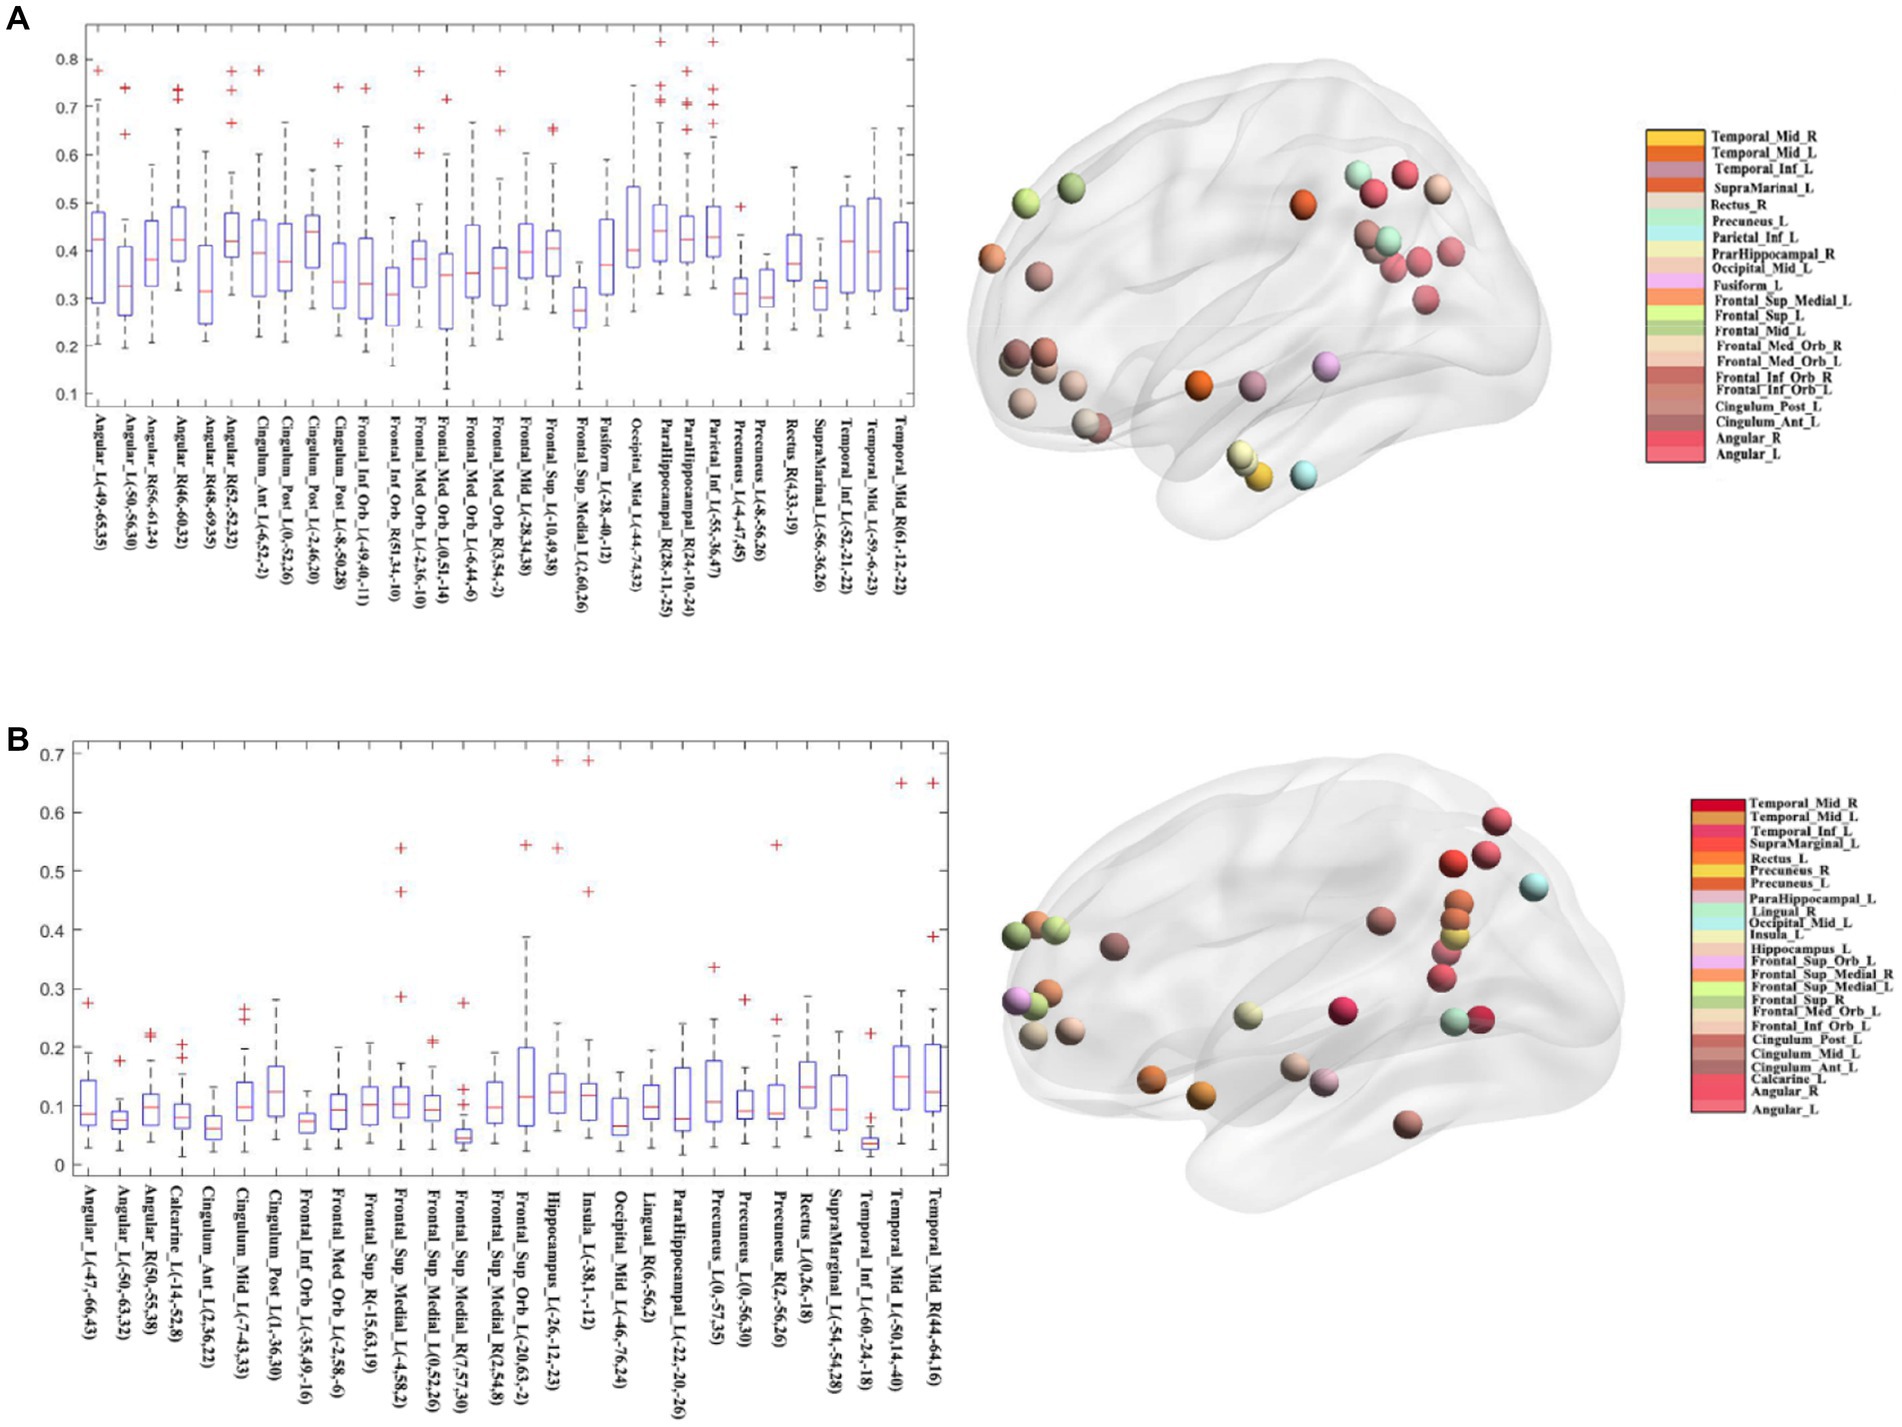
Figure 6. Classification of different seeds. (A) The seeds whose median Dice coefficient above average and their visualized network pattern. (B) The seeds whose median Dice coefficient below average and their visualized network pattern.
5. Discussion
Seed-based functional connectivity is one of the most widely used methods in resting-state fMRI studies. It measures the linear temporal correlation between the seed regions and every other voxel in the whole brain. Assessing seed selection arbitrariness on studies’ results, the current meta-analysis revealed that the results of seed-based functional connectivity were exclusively affected by choice of seed. This was accomplished using image-based meta-analysis to identify seeds with relatively high reproducibility due to their high sensitivity. We then performed several image-based meta-analyses with 59 different DMN seeds from the retrieved articles. Among these meta-analytic maps, a very low degree of spatial overlap has been displayed. The overlap rate of most voxels in the whole brain was less than 10%, and the median Dice coefficient of all 59 seeds fluctuated wildly.
Functional connectivity should be reliable, sensitive and specific to longitudinal changes (Dosenbach et al., 2010; Satterthwaite et al., 2014). However, the reliability of functional imaging results has been criticized in recent years (Bennett and Miller, 2010). Many studies have estimated the test–retest reliability of resting-state functional connectivity, and the results ranged from poor to good (Shehzad et al., 2009; Noble et al., 2017; Pannunzi et al., 2017). Our study supported the assumption that the reliability of functional connectivity across different seed ROIs is poor. Consistent with the finds of Noble et al. (2017), the different locations of seed region in previous studies lower the test–retest reliability of functional connectivity. Again, Wu et al. (2018) concluded that the seed-based functional connectivity patterns are unreliable. Although previous studies have proposed that different seed voxels produce different maps and the selection of seed regions would bias the results and restrict the functional connectivity map to the selected regions (Cordes et al., 2000; Van den Heuvel and Hulshoff Pol, 2010), our study provides quantitative evidence to support the proposition. There is a very low degree of overlap among all the meta-analytic results, indicating that different seeds cannot produce the same functional map.
Although our study selected seeds from classic articles, the low Dice coefficient speaks for relatively low reproducibility across meta-analytic results of different seeds. The arbitrary selection of seeds has been proven to influence functional connectivity results (Marrelec and Fransson, 2011). Even when the same strategy is used, the difference in location results in significant changes to the connectivity pattern in the DMN (Cole et al., 2010; Hayasaka and Laurienti, 2010). In addition to static functional connectivity, the study has found that the reproducibility in dynamic functional connectivity is not high (Zhang et al., 2018). All of these give us a wake-up call that the selection of seeds should be thought through Cole et al. (2010) found that even the slightest spatial difference of seeds can affect the spatial characteristics of the resting-state networks. Thus, the selection of seed seems to be quite substantial. Sohn et al. (2015) discovered that inappropriate seeds would bring lower calculated connectivity and higher variance. The overall replicability challenge is severe; therefore, any attempts to ascertain which seeds possess relatively higher reproducibility are a worthy pursuit. The dice coefficient matrix shows a very complex pattern of the overlap among these seeds in which some seeds generate a high Dice coefficient while some seeds are with low overlap. Different seeds yielded quite different results of reproducibility. Margulies et al. (2009) revealed that even a slight shift of seed location within the precuneus produced significant changes in the connectivity pattern. It is worth noting that the seeds with relatively high reproducibility should be treated with caution. They may show different results in different diseases.
Some limitations deserve further investigation in future work. First, considering the prominence of DMN in current literature, we targeted DMN rather than other resting-state networks. Thus, the reproducibility across different seeds in other resting-state networks needs further investigation. Second, our study chose the sex difference as the model to explore the statistical difference due to its stability compared with disease. Therefore, caution should be applied in interpreting our conclusions in the context of diseases. In respect of this, further research adopting a difference-in-disease model is needed. Third, due to lack of the psychiatric or neurologic history information of the participants, the exclusion criteria did not include the psychiatric or neurologic history. Thus, the interpretation of the results should be cautious. Fourth, although the present study revealed the poor reproducibility among different seed of the same network, future study should focus on finding out the robust seed.
6. Conclusion
This study demonstrates that the selection of seeds influences the functional connectivity pattern and generates inconsistent results among the seeds. Although previous studies have noted this issue, our study provides quantitative evidence through image-based meta-analysis. There was a very low degree of spatial overlap among these meta-analytic results. From this perspective, researchers need to be cautious in selecting the seed regions. Thus, special attention should be paid to the seeds with extremely low reproducibility illustrated in our study.
Data availability statement
Publicly available datasets were analyzed in this study. This data can be found here: The datasets analyzed during the current study are available in the International Neuroimaging Data-sharing Initiative (INDI), Consortium for Reliability and Reproducibility (CoRR) — Consortium for Reliability and Reproducibility (CoRR) documentation.
Author contributions
JR and X-ZJ designed the study. J-WS collected and analyzed the data. M-TL wrote the first draft of the manuscript, which JR, X-ZJ, Y-TL, CA, and L-LZ revised. All authors contributed to the article and approved the submitted version.
Funding
This Funding was obtained through the Open Research Fund of College of Teacher Education, Zhejiang Normal University: Jykf22001w, National Natural Science Foundation of China: 82001898 and Beijing Well-being Foundation 2021 Key Project of Positive Psychology.
Conflict of interest
The authors declare that the research was conducted in the absence of any commercial or financial relationships that could be construed as a potential conflict of interest.
Publisher’s note
All claims expressed in this article are solely those of the authors and do not necessarily represent those of their affiliated organizations, or those of the publisher, the editors and the reviewers. Any product that may be evaluated in this article, or claim that may be made by its manufacturer, is not guaranteed or endorsed by the publisher.
Supplementary material
The Supplementary material for this article can be found online at: https://www.frontiersin.org/articles/10.3389/fnins.2023.1120741/full#supplementary-material
Footnotes
References
Aertsen, A. M., Gerstein, G. L., Habib, M. K., and Palm, G. (1989). Dynamics of neuronal firing correlation: modulation of “effective connectivity.”. J. Neurophysiol. 61, 900–917. doi: 10.1152/jn.1989.61.5.900
Allen, E. A., Erhardt, E. B., Damaraju, E., Gruner, W., Segall, J. M., Silva, R. F., et al. (2011). A baseline for the multivariate comparison of resting-state networks. Front. Syst. Neurosci. 5:2. doi: 10.3389/fnsys.2011.00002
Andrews-Hanna, J. R., Reidler, J. S., Sepulcre, J., Poulin, R., and Buckner, R. L. (2010). Functional-anatomic fractionation of the brain’s default network. Neuron 65, 550–562. doi: 10.1016/j.neuron.2010.02.005
Assaf, M., Jagannathan, K., Calhoun, V. D., Miller, L., Stevens, M. C., Sahl, R., et al. (2010). Abnormal functional connectivity of default mode sub-networks in autism spectrum disorder patients. NeuroImage 53, 247–256. doi: 10.1016/j.neuroimage.2010.05.067
Baliki, M. N., Mansour, A. R., Baria, A. T., and Apkarian, A. V. (2014). Functional reorganization of the default mode network across chronic pain conditions. PLoS ONE 9:e106133. doi: 10.1371/journal.pone.0106133
Beltz, A. M., Berenbaum, S. A., and Wilson, S. J. (2015). Sex differences in resting state brain function of cigarette smokers and links to nicotine dependence. Exp. Clin. Psychopharmacol. 23, 247–254. doi: 10.1037/pha0000033
Bennett, C. M., and Miller, M. B. (2010). How reliable are the results from functional magnetic resonance imaging? Ann. N. Y. Acad. Sci. 1191, 133–155. doi: 10.1111/j.1749-6632.2010.05446.x
Bi, X., Hu, X., Xie, Y., and Wu, H. (2021). A novel CERNNE approach for predicting Parkinson’s disease-associated genes and brain regions based on multimodal imaging genetics data. Med. Image Anal. 67:101830. doi: 10.1016/j.media.2020.101830
Bi, X., Liu, Y., Xie, Y., Hu, X., and Jiang, Q. (2020). Morbigenous brain region and gene detection with a genetically evolved random neural network cluster approach in late mild cognitive impairment. Bioinformatics 36, 2561–2568. doi: 10.1093/bioinformatics/btz967
Biswal, B., Zerrin Yetkin, F., Haughton, V. M., and Hyde, J. S. (1995). Functional connectivity in the motor cortex of resting human brain using echo-planar mri. Magn. Reson. Med. 34, 537–541. doi: 10.1002/mrm.1910340409
Bonnelle, V., Ham, T. E., Leech, R., Kinnunen, K. M., Mehta, M. A., Greenwood, R. J., et al. (2012). Salience network integrity predicts default mode network function after traumatic brain injury. Proc. Natl. Acad. Sci. 109, 4690–4695. doi: 10.1073/pnas.1113455109
Chen, X., Lu, B., and Yan, C.-G. (2018). Reproducibility of R-fMRI metrics on the impact of different strategies for multiple comparison correction and sample sizes: R-fMRI reproducibility: on the impact of correction strategies and sample size. Hum. Brain Mapp. 39, 300–318. doi: 10.1002/hbm.23843
Cole, D. M., Smith, S. M., and Beckmann, C. F. (2010). Advances and pitfalls in the analysis and interpretation of resting-state FMRI data. Front. Syst. Neurosci. 4:8. doi: 10.3389/fnsys.2010.00008
Cordes, D., Haughton, V. M., Arfanakis, K., Wendt, G. J., Turski, P. A., Moritz, C. H., et al. (2000). Mapping functionally related regions of brain with functional connectivity MR imaging. Am. J. Neuroradiol 21, 1636–1644.
Di, X., and Biswal, B. B. (2014). Identifying the default mode network structure using dynamic causal modeling on resting-state functional magnetic resonance imaging. NeuroImage 86, 53–59. doi: 10.1016/j.neuroimage.2013.07.071
Dice, L. R. (1945). Measures of the amount of ecologic association between species. Ecology 26, 297–302. doi: 10.2307/1932409
Dosenbach, N. U. F., Nardos, B., Cohen, A. L., Fair, D. A., Power, J. D., Church, J. A., et al. (2010). Prediction of individual brain maturity using fMRI. Science 329, 1358–1361. doi: 10.1126/science.1194144
Fox, M. D., Snyder, A. Z., Vincent, J. L., Corbetta, M., Van Essen, D. C., and Raichle, M. E. (2005). The human brain is intrinsically organized into dynamic, anticorrelated functional networks. Proc. Natl. Acad. Sci. U. S. A. 102, 9673–9678. doi: 10.1073/pnas.0504136102
Fransson, P. (2005). Spontaneous low-frequency BOLD signal fluctuations: An fMRI investigation of the resting-state default mode of brain function hypothesis. Hum. Brain Mapp. 26, 15–29. doi: 10.1002/hbm.20113
Friston, K. J., Frith, C. D., Liddle, P. F., and Frackowiak, R. S. J. (1993). Functional connectivity: the principal-component analysis of large (PET) data sets. J. Cereb. Blood Flow Metab. 13, 5–14. doi: 10.1038/jcbfm.1993.4
Friston, K. J., Williams, S., Howard, R., Frackowiak, R. S. J., and Turner, R. (1996). Movement-related effects in fMRI time-series: movement artifacts in fMRI. Magn. Reson. Med. 35, 346–355. doi: 10.1002/mrm.1910350312
Hayasaka, S., and Laurienti, P. J. (2010). Comparison of characteristics between region-and voxel-based network analyses in resting-state fMRI data. NeuroImage 50, 499–508. doi: 10.1016/j.neuroimage.2009.12.051
Ji, X., Quan, W., Yang, L., Chen, J., Wang, J., and Wu, T. (2020). Classification of schizophrenia by seed-based functional connectivity using Prefronto-temporal functional near infrared spectroscopy. J. Neurosci. Methods 344:108874. doi: 10.1016/j.jneumeth.2020.108874
Jia, X.-Z., Wang, J., Sun, H.-Y., Zhang, H., Liao, W., Wang, Z., et al. (2019). RESTplus: an improved toolkit for resting-state functional magnetic resonance imaging data processing. Sci. Bull. 64, 953–954. doi: 10.1016/j.scib.2019.05.008
Kazemi, K., and Noorizadeh, N. (2014). Quantitative comparison of SPM, FSL, and Brainsuite for brain MR image segmentation. J. Biomed. Phys. Eng. 4, 13–26.
Kucyi, A., Moayedi, M., Weissman-Fogel, I., Goldberg, M. B., Freeman, B. V., Tenenbaum, H. C., et al. (2014). Enhanced Medial Prefrontal-Default Mode Network Functional Connectivity in Chronic Pain and Its Association with Pain Rumination. J. Neurosci. 34, 3969–3975. doi: 10.1523/JNEUROSCI.5055-13.2014
Kucyi, A., Salomons, T. V., and Davis, K. D. (2013). Mind wandering away from pain dynamically engages antinociceptive and default mode brain networks. Proc. Natl. Acad. Sci. 110, 18692–18697. doi: 10.1073/pnas.1312902110
Lancaster, J. L., Tordesillas-Gutiérrez, D., Martinez, M., Salinas, F., Evans, A., Zilles, K., et al. (2007). Bias between MNI and Talairach coordinates analyzed using the ICBM-152 brain template. Hum. Brain Mapp. 28, 1194–1205. doi: 10.1002/hbm.20345
Lu, H., Zou, Q., Gu, H., Raichle, M. E., Stein, E. A., and Yang, Y. (2012). Rat brains also have a default mode network. Proc. Natl. Acad. Sci. 109, 3979–3984. doi: 10.1073/pnas.1200506109
Margulies, D. S., Vincent, J. L., Kelly, C., Lohmann, G., Uddin, L. Q., Biswal, B. B., et al. (2009). Precuneus shares intrinsic functional architecture in humans and monkeys. Proc. Natl. Acad. Sci. 106, 20069–20074. doi: 10.1073/pnas.0905314106
Marrelec, G., and Fransson, P. (2011). Assessing the influence of different ROI selection strategies on functional connectivity analyses of fMRI data acquired during steady-state conditions. PLoS One 6:e14788. doi: 10.1371/journal.pone.0014788
Noble, S., Spann, M. N., Tokoglu, F., Shen, X., Constable, R. T., and Scheinost, D. (2017). Influences on the test–retest reliability of functional connectivity MRI and its relationship with behavioral utility. Cereb. Cortex 27, 5415–5429. doi: 10.1093/cercor/bhx230
Pannunzi, M., Hindriks, R., Bettinardi, R. G., Wenger, E., Lisofsky, N., Martensson, J., et al. (2017). Resting-state fMRI correlations: from link-wise unreliability to whole brain stability. NeuroImage 157, 250–262. doi: 10.1016/j.neuroimage.2017.06.006
Peters, B. D., Szeszko, P. R., Radua, J., Ikuta, T., Gruner, P., DeRosse, P., et al. (2012). White matter development in adolescence: diffusion tensor imaging and Meta-analytic results. Schizophr. Bull. 38, 1308–1317. doi: 10.1093/schbul/sbs054
Radua, J., Mataix-Cols, D., Phillips, M. L., El-Hage, W., Kronhaus, D. M., Cardoner, N., et al. (2012). A new meta-analytic method for neuroimaging studies that combines reported peak coordinates and statistical parametric maps. Eur. Psychiatry 27, 605–611. doi: 10.1016/j.eurpsy.2011.04.001
Radua, J., Rubia, K., Canales-Rodríguez, E. J., Pomarol-Clotet, E., Fusar-Poli, P., and Mataix-Cols, D. (2014). Anisotropic kernels for coordinate-based Meta-analyses of neuroimaging studies. Front. Psych. 5:13. doi: 10.3389/fpsyt.2014.00013
Rosazza, C., Minati, L., Ghielmetti, F., Mandelli, M. L., and Bruzzone, M. G. (2012). Functional connectivity during resting-state functional MR imaging: study of the correspondence between independent component analysis and region-of-interest−based methods. AJNR Am. J. Neuroradiol. 33, 180–187. doi: 10.3174/ajnr.A2733
Satterthwaite, T. D., Elliott, M. A., Ruparel, K., Loughead, J., Prabhakaran, K., Calkins, M. E., et al. (2014). Neuroimaging of the Philadelphia neurodevelopmental cohort. NeuroImage 86, 544–553. doi: 10.1016/j.neuroimage.2013.07.064
Sharp, D. J., Beckmann, C. F., Greenwood, R., Kinnunen, K. M., Bonnelle, V., De Boissezon, X., et al. (2011). Default mode network functional and structural connectivity after traumatic brain injury. Brain 134, 2233–2247. doi: 10.1093/brain/awr175
Shehzad, Z., Kelly, A. M. C., Reiss, P. T., Gee, D. G., Gotimer, K., Uddin, L. Q., et al. (2009). The resting brain: unconstrained yet reliable. Cereb. Cortex 19, 2209–2229. doi: 10.1093/cercor/bhn256
Shulman, G. L., Corbetta, M., Buckner, R. L., Fiez, J. A., Miezin, F. M., Raichle, M. E., et al. (1997). Common blood flow changes across visual tasks: I. increases in subcortical structures and cerebellum but not in nonvisual cortex. J. Cogn. Neurosci. 9, 624–647. doi: 10.1162/jocn.1997.9.5.624
Smigielski, L., Scheidegger, M., Kometer, M., and Vollenweider, F. X. (2019). Psilocybin-assisted mindfulness training modulates self-consciousness and brain default mode network connectivity with lasting effects. NeuroImage 196, 207–215. doi: 10.1016/j.neuroimage.2019.04.009
Smitha, K., Akhil Raja, K., Arun, K., Rajesh, P., Thomas, B., Kapilamoorthy, T., et al. (2017). Resting state fMRI: a review on methods in resting state connectivity analysis and resting state networks. Neuroradiol. J. 30, 305–317. doi: 10.1177/1971400917697342
Sohn, W. S., Yoo, K., Lee, Y.-B., Seo, S. W., Na, D. L., and Jeong, Y. (2015). Influence of ROI selection on resting state functional connectivity: an individualized approach for resting state fMRI analysis. Front. Neurosci. 9:280. doi: 10.3389/fnins.2015.00280
Sridharan, D., Levitin, D. J., and Menon, V. (2008). A critical role for the right fronto-insular cortex in switching between central-executive and default-mode networks. Proc. Natl. Acad. Sci. 105, 12569–12574. doi: 10.1073/pnas.0800005105
Tzourio-Mazoyer, N., Landeau, B., Papathanassiou, D., Crivello, F., Etard, O., Delcroix, N., et al. (2002). Automated anatomical labeling of activations in SPM using a macroscopic anatomical Parcellation of the MNI MRI single-subject brain. NeuroImage 15, 273–289. doi: 10.1006/nimg.2001.0978
Van den Heuvel, M. P., and Hulshoff Pol, H. E. (2010). Exploring the brain network: a review on resting-state fMRI functional connectivity. Eur. Neuropsychopharmacol. 20, 519–534. doi: 10.1016/j.euroneuro.2010.03.008
Wei, H.-L., Chen, J., Chen, Y.-C., Yu, Y.-S., Zhou, G.-P., Qu, L.-J., et al. (2020). Impaired functional connectivity of limbic system in migraine without aura. Brain Imaging Behav. 14, 1805–1814. doi: 10.1007/s11682-019-00116-5
Welton, T., Kent, D., Constantinescu, C. S., Auer, D. P., and Dineen, R. A. (2015). Functionally relevant white matter degradation in multiple sclerosis: a tract-based spatial Meta-analysis. Radiology 275, 89–96. doi: 10.1148/radiol.14140925
Wu, L., Caprihan, A., Bustillo, J., Mayer, A., and Calhoun, V. (2018). An approach to directly link ICA and seed-based functional connectivity: Application to schizophrenia. NeuroImage 179, 448–470. doi: 10.1016/j.neuroimage.2018.06.024
Xia, M., Wang, J., and He, Y. (2013). BrainNet viewer: a network visualization tool for human brain Connectomics. PLoS One 8:e68910. doi: 10.1371/journal.pone.0068910
Yan, C.-G., Wang, X.-D., Zuo, X.-N., and Zang, Y.-F. (2016). DPABI: Data Processing & Analysis for (resting-state) brain imaging. Neuroinformatics 14, 339–351. doi: 10.1007/s12021-016-9299-4
Yang, M., He, H., Duan, M., Chen, X., Chang, X., Lai, Y., et al. (2018). The effects of music intervention on functional connectivity strength of the brain in schizophrenia. Neural Plast. 2018, 1–10. doi: 10.1155/2018/2821832
Yeo, B. T. T., Krienen, F. M., Sepulcre, J., Sabuncu, M. R., Lashkari, D., Hollinshead, M., et al. (2011). The organization of the human cerebral cortex estimated by intrinsic functional connectivity. J. Neurophysiol. 106, 1125–1165. doi: 10.1152/jn.00338.2011
Yu, H., Li, M.-L., Li, Y.-F., Li, X.-J., Meng, Y., Liang, S., et al. (2020). Anterior cingulate cortex, insula and amygdala seed-based whole brain resting-state functional connectivity differentiates bipolar from unipolar depression. J. Affect. Disord. 274, 38–47. doi: 10.1016/j.jad.2020.05.005
Zhang, C., Baum, S. A., Adduru, V. R., Biswal, B. B., and Michael, A. M. (2018). Test-retest reliability of dynamic functional connectivity in resting state fMRI. NeuroImage 183, 907–918. doi: 10.1016/j.neuroimage.2018.08.021
Keywords: seed-based functional connectivity, seed selection, image-based meta-analysis, reproducibility, default mode network
Citation: Li M-T, Sun J-W, Zhan L-L, Antwi CO, Lv Y-T, Jia X-Z and Ren J (2023) The effect of seed location on functional connectivity: evidence from an image-based meta-analysis. Front. Neurosci. 17:1120741. doi: 10.3389/fnins.2023.1120741
Edited by:
Yi Zhang, Zhejiang University, ChinaCopyright © 2023 Li, Sun, Zhan, Antwi, Lv, Jia and Ren. This is an open-access article distributed under the terms of the Creative Commons Attribution License (CC BY). The use, distribution or reproduction in other forums is permitted, provided the original author(s) and the copyright owner(s) are credited and that the original publication in this journal is cited, in accordance with accepted academic practice. No use, distribution or reproduction is permitted which does not comply with these terms.
*Correspondence: Xi-Ze Jia, amlheGl6ZUBmb3htYWlsLmNvbQ==; Jun Ren, ZHJpbnJlbkAxNjMuY29t
†These authors have contributed equally to this work and share first-authorship