
95% of researchers rate our articles as excellent or good
Learn more about the work of our research integrity team to safeguard the quality of each article we publish.
Find out more
ORIGINAL RESEARCH article
Front. Hum. Neurosci. , 17 February 2025
Sec. Brain Health and Clinical Neuroscience
Volume 19 - 2025 | https://doi.org/10.3389/fnhum.2025.1521355
 Keke Li1†
 Man Li2†
 Wanqing Liu1,3
 Yanzhi Wu1Fang Li1Jingwei Xie1,4,5Shaolong Zhou1,4,5
 Sen Wang1
 Yongkun Guo1,4,5*†
 Jiahui Pan6*†
 Xinjun Wang1,3,4,5*†
Objective: This study aimed to explore differences in sleep electroencephalogram (EEG) patterns in individuals with prolonged disorders of consciousness, utilizing polysomnography (PSG) to assist in distinguishing between the vegetative state (VS)/unresponsive wakefulness syndrome (UWS) and the minimally conscious state (MCS), thereby reducing misdiagnosis rates and enhancing the quality of medical treatment.
Methods: A total of 40 patients with prolonged disorders of consciousness (pDOC; 27 patients in the VS/UWS and 13 in the MCS) underwent polysomnography. We analyzed differential EEG indices between VS/UWS and MCS groups and performed correlation analyses between these indices and the Coma Recovery Scale-Revised (CRS-R) scores. The diagnostic accuracy of the differential indices was evaluated using receiver operating characteristic (ROC) curves.
Results: 1. The fractal dimension (Higuchi’s fractal dimension (HFD)) of patients in the MCS tended to be higher than that of patients in the VS/UWS across all phases, with a significant difference only in the waking phase (p < 0.05). The HFD in the waking phase was positively correlated with the CRS-R score and exhibited the highest diagnostic accuracy at 88.3%. The Teager–Kaiser energy operator (TKEO) also showed higher levels in patients in the MCS compared to those in the VS/UWS, significantly so in the NREM2 phase (p < 0.05), with a positive correlation with the CRS-R score and diagnostic accuracy of 75.2%. The δ-band power spectral density [PSD(δ)] in the patients in the MCS was lower than that in those in the VS/UWS, significantly so in the waking phase (p < 0.05), and it was negatively correlated with the CRS-R score, with diagnostic accuracy of 71.5%.
Conclusion: Polysomnography for the VS/UWS and MCS revealed significant differences, aiding in distinguishing between the two patient categories and reducing misdiagnosis rates. Notably, the HFD and PSD(δ) showed significantly better performance during wakefulness compared to sleep, while the TKEO was more prominent in the NREM2 stage. Notably, the HFD exhibited a robust correlation with the CRS-R scores, the highest diagnostic accuracy, and immense promise in the clinical diagnosis of prolonged disorders of consciousness.
Prolonged disorders of consciousness (pDOC) are defined as pathological states characterized by a loss of consciousness that lasts for more than 28 days following brain injury from various causes (Cheapen et al., 2017). This category includes the vegetative state (VS)/unresponsive wakefulness syndrome (UWS), in which patients appear awake but show no behavioral signs of consciousness, and the minimally conscious state (MCS), in which patients demonstrate fluctuating awareness and can respond appropriately to certain stimuli (Septien and Rubin, 2018). As critical care medicine advances, an increasing number of patients with acute brain injuries survive, leading to a rise in pDOC cases. This trend poses significant burdens on families and society (Kang et al., 2022). One of the challenges in clinically diagnosing and treating these patients is accurately determining their level of consciousness and distinguishing between the MCS and VS/UWS (Calabrò et al., 2016). This distinction has important ethical and therapeutic implications as patients in the MCS may experience pain or suffering and could benefit from analgesic treatments or other interventions aimed at improving their quality of life. In addition, the prognosis for MCS is generally more favorable than that for VS/UWS, making it crucial to encourage families to adopt a proactive approach in treating their loved ones (Thibaut et al., 2019). However, the differential diagnosis between the MCS and VS/UWS is extremely challenging and is associated with a high rate of misdiagnosis. Currently, the Coma Recovery Scale-Revised (CRS-R) is regarded as the gold standard for diagnosis, yet its misdiagnosis rate can be as high as 43%, due to both subjective factors (variability in scores among different raters) and objective factors (such as patients’ motor deficits and significant fluctuations in levels of consciousness; Giacino et al., 2004). For example, a study by Bodien et al. found that some patients diagnosed with VS/UWS using the CRS-R exhibited detectable abilities to perform cognitive tasks, as shown by functional magnetic resonance imaging (fMRI) and electroencephalogram (EEG), suggesting a certain level of consciousness that is often misdiagnosed in the clinic in this population (Bodien et al., 2024). There is an urgent need for new diagnostic methods to aid in accurate diagnosis.
Numerous studies have investigated the role of various diagnostic tools, such as EEG, fMRI (Bodien et al., 2024), positron emission tomography–computed tomography (PET-CT; Stender et al., 2014), and polysomnography (PSG), in diagnosing pDOC (Kondziella et al., 2020; Stender et al., 2014). Among these, EEG has been the focus of extensive research, revealing two primary types of indicators for differentiating between the consciousness states: linear and non-linear metrics. The linear indicators include the spectral power of different EEG bands, power ratios between frequency bands, and variations between closed and open eye states (e.g., alpha blocking; Schmidt et al., 2013). In contrast, the non-linear metrics encompass fractal dimensionality, entropy, and EEG microstates (Porcaro et al., 2022). Notably, Porcaro et al. found that the likelihood of distinguishing between the MCS and VS is greater when using Higuchi’s fractal dimension (HFD) compared to traditional linear methods (Porcaro et al., 2022). On the other hand, PET-CT and fMRI are less frequently utilized in clinical practice due to challenges such as high costs and difficulties in patient cooperation.
In contrast, PSG offers distinct advantages. Unlike neuroimaging techniques such as fMRI and PET-CT, PSG provides a direct measurement of neuronal activity in the brain. In addition, compared to short-term EEG, PSG is more sensitive to changes in brain network dynamics throughout the patient’s wake–sleep cycle. Duclos et al. found that improvements in consciousness and cognitive function were closely associated with enhancements in sleep–wake quality, highlighting a significant relationship between the sleep brain network and the conscious brain network (Duclos et al., 2017). Therefore, investigating polysomnographic differences in patients with pDOC is crucial for assessing their levels of consciousness. HFD is a time-series-based non-linear metric related to brain activity and brain network complexity (Walker et al., 2022). The Teager–Kaiser energy operator (TKEO) is a non-linear metric related to signal energy that quantifies instantaneous changes in EEG signal energy, emphasizing changes in the frequency and amplitude of the signal, thus responding to the strength of brain function (Shi et al., 2022). The δ-band power spectral density [PSD(δ)] is a commonly used linear metric, with larger values generally representing poorer awareness (Stefan et al., 2018). In this study, we analyzed PSG data from 40 patients with pDOC (27 in the VS/UWS and 13 in the MCS) to explore three discrepancies between the VS/UWS and MCS, calculating the diagnostic efficacy of these discrepancies separately.
This study was a prospective cohort investigation involving 60 patients with pDOC who underwent PSG testing at the Fifth Affiliated Hospital of Zhengzhou University from 1 January 2024 to 31 July 2024. Basic clinical information was collected, including age, gender, etiology, and the duration of DOC. The inclusion criteria were as follows: 1. Age between 18 and 80 years; 2. DOC duration of 28 days or more; 3. no history of seizures and no use of antiepileptic, sedative, or other neuroexcitation-inhibiting medications before and after enrollment; 4. stable clinical status; 5. diagnosis of the VS/UWS or MCS based on the CRS-R scale; and 6. voluntary participation from the patient’s legal representative after reviewing the informed consent form. The exclusion criteria included: 1. History of psychiatric or neurodegenerative diseases prior to the onset of the condition; 2. severe cardiac, hepatic, or renal dysfunction or other significant comorbidities; and 3. the presence of a large cranial defect that would interfere with electrode-scalp contact. The enrolled patients were evaluated by two trained neurosurgeons who administered the CRS-R for five consecutive days. Based on the highest scores obtained, the patients were classified into either the VS/UWS group or the MCS group. In cases of discrepancies in the final scores, the supervising physician was consulted to reassess the patients and determine the final scoring results. Subsequently, a professional neurophysiologist conducted PSG tests on the patients. The study was conducted in accordance with the ethical standards of the Declaration of Helsinki and received approval from the Ethics Committee of the Fifth Affiliated Hospital of Zhengzhou University (Ethics No. KY2024006-K02). Before enrollment, the legal representatives of the patients were informed about the study, and written consent was obtained, with the option to withdraw from participation at any time.
Data were recorded using a mobile polysomnograph (NicoletOne, United States) with a sampling rate of 256 Hz, a high-pass filter set at 0.5 Hz, and a low-pass filter set at 40 Hz. The setup included 16-lead EEG, two-channel electrooculography, and three-channel electromyography. All recordings were conducted in the patient’s ward, and it was communicated in advance to the supervising physician and nursing staff that nursing interventions should be minimized during the testing. The experimenter checked electrode impedance after each intervention and replaced the electrodes when the impedance exceeded 5 kΩ. The patients remained in stable condition for at least 1 week before the recording, and their individual medication regimens were kept consistent. The recordings commenced at approximately 4:00 PM and concluded at 8:00 AM the following day.
The AASM Sleep and Associated Events Scoring Manual is the most widely used guideline for sleep staging (Morgenthaler et al., 2006). In this study, we adopted the sleep-scoring method proposed by Rossi et al. (2018), which aligns closely with the AASM guidelines while incorporating some modifications to account for the unique sleep patterns observed in the patients with disorders of consciousness (Cologan et al., 2013).
The two raters first reached a consensus on the sleep-scoring criteria before independently scoring each segment of the sleep EEG. Any discrepancies in period staging and arousal identification were subsequently reviewed and resolved. Uncertain periods were excluded from statistical analysis to maintain data integrity.
The EEG signals were re-referenced using an average reference montage. The signals were filtered with a 50 Hz notch filter and a bandpass filter set between 0.5 and 40 Hz. To ensure consistency across the channels, each signal was normalized. For improved computational efficiency, the signals were downsampled to 100 Hz, and EEG was segmented into consecutive 30-s cycles. The time periods in which the voltage range of the EEG channel exceeded 100 μV were excluded from further analysis. Subsequently, the EEG traces were carefully reviewed, and any segments contaminated with residual artifacts were discarded. A text file containing sleep stage vectors was then loaded at a sampling frequency of 1/30 and upsampled to match the sampling frequency and duration of the EEG signal. Finally, we categorized the entire EEG data, after artifact removal, into wakefulness, NREM1, NREM2, NREM3, and REM phases according to the sleep-scoring method proposed by Rossi Sebastiano et al.
HFD is a method used to estimate the dimensionality of discrete time series data, serving as a quantitative measure of the inherent complexity or similarity of a signal or geometric structure (Walker et al., 2022). This method has been widely applied in sleep studies as it allows for the direct estimation of the fractal dimension from time series data without requiring prior transformations or embedding. The standard approach of HFD consists of the following steps: (1). For each sample i of an EEG segment Sj, calculate the absolute difference between Sj (i) and Sj (i + k) values (i.e., the samples at distance k), considering k = 1, klin. (2). These absolute differences are multiplied by a normalization factor that considers the sample size of the number of available samples for each k-value. (3). For each k, L(k) is calculated by summing the resulting values for all EEG segment samples and dividing by k. (4). By definition, if the value of L(k) is proportional to k-D, then the curve is a fractal curve of dimension D. If L(k) is proportional to k-D, klin, then log(k) and log(L(k)) have a linear relationship. In particular, from the log(L(k)) vs. log(k) curve (hereafter referred to as k), the linear coefficient of D as a regression line can be estimated by ordinary least squares. (5). Choose klin as the largest k for which L(k) is proportional to k-D. The fractal dimension D computed using the Higuchi method is in the linear region of the k-curve, i.e., k ≤ klin, while the non-linear region of the k-curve, i.e., k > klin, is usually not considered.
The TKEO is a non-linear energy tracking operator that measures the energy and frequency content of a signal, effectively determining the instantaneous energy of non-smooth signals. The discrete wavelet transform (DWT) has been successfully applied to EEG detection. Since the smoothness of the Daubechies 4 (db4) wavelet makes it more suitable for detecting changes in EEG signals, the DWT with the function db4 wavelet was used in this study. The DWT provides near-optimal time-frequency localization that decomposes EEG signals into seven different bands, corresponding to various brain rhythms. The signals were categorized into delta (A7), theta (D7), alpha (D6), beta (D5), gamma (D4), high gamma (D3), ripple (D2), and fast ripple (D1). Based on the TKEO method and the DWT, a combined global TKEO-DWT detection method is proposed, which analyzes the signal in both time and frequency domains.
The PSD quantifies the power distribution of a signal across various frequency components (Stefan et al., 2018). δ-wave brainwave frequencies typically range from 0.5 to 4 Hz and are closely associated with deep sleep stages. In this study, the Welch method was employed to compute the PSD for each time segment.
For detailed calculations of the characteristics mentioned above, please refer to Annex 1.
Continuous variables were reported as mean ± standard deviation, while non-normally distributed variables were expressed as quartiles. Categorical variables were presented as counts and/or frequencies. The Shapiro–Wilk normality test was conducted for the continuous variables. One-way ANOVA was utilized to identify indicators of variability between the MCS and the VS groups. The correlation between the variability indicators and the CRS-R scores was assessed using Spearman’s correlation analysis. In addition, the diagnostic accuracy of the variability indicators was evaluated using receiver operating characteristic (ROC) curves.
A total of 60 patients with pDOC were initially included in the study. The study excluded 15 patients for failing to meet the inclusion criteria. Ultimately, 27 patients in the VS/UWS and 13 in the MCS were included in the analysis. The research subject and flowchart are shown in Figure 1. There were no significant differences in age, gender, the duration of DOC, or etiology between the two groups (p > 0.05). Basic clinical information is presented in Table 1.

Figure 1. Flowchart of the study. CRS-R, Coma Recovery Scale-Revised; PSG, polysomnography.
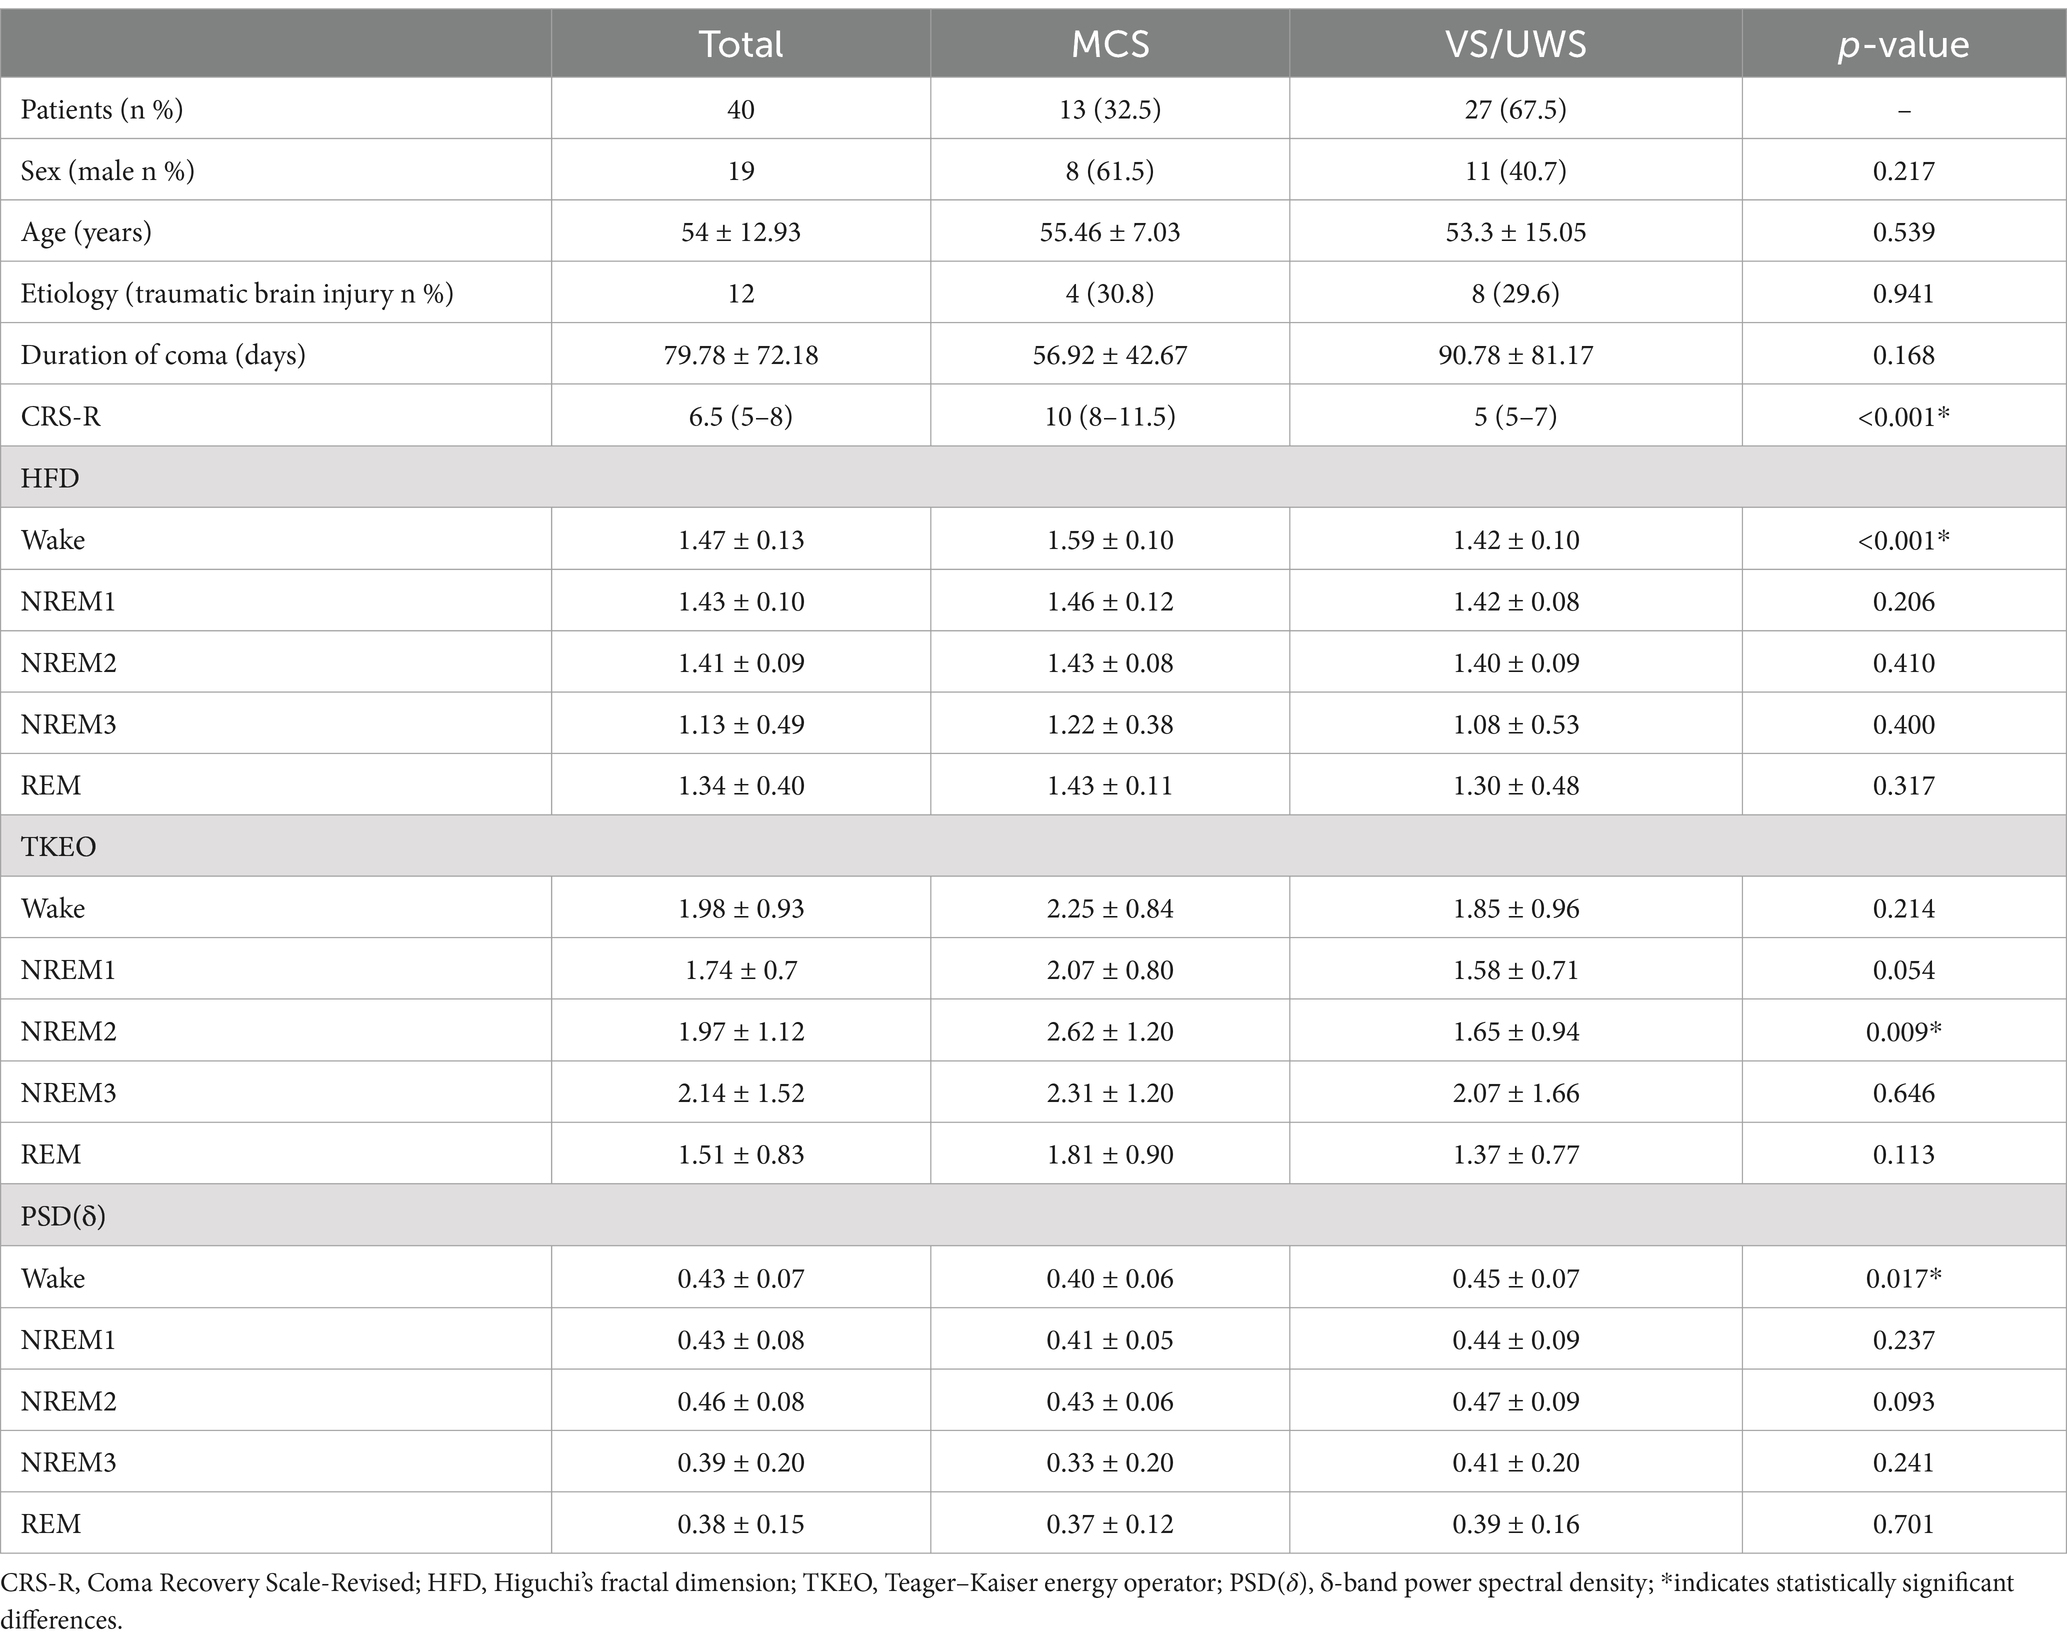
Table 1. Basic clinical characteristics and sleep EEG characteristics of the patients.
The one-way ANOVA analysis revealed that the HFD in the MCS group exhibited a tendency to be higher than that in the VS/UWS group across all stages, with a statistically significant difference observed only during the waking stage (p < 0.001). Moreover, both groups displayed a gradual decrease in the HFD from the waking stage to NREM3, followed by an increase in the REM stage. Similarly, the TKEO in the MCS group showed a discernible tendency to be higher than that in the VS/UWS group across all stages, with a statistically significant difference observed only in the NREM2 stage (p = 0.009). Furthermore, the PSD (δ) in the MCS group demonstrated a pattern of being lower than that in the VS/UWS group across all stages, with statistical significance observed only during the waking stage (p = 0.017). For further details, please refer to Table 1 and Figure 2.
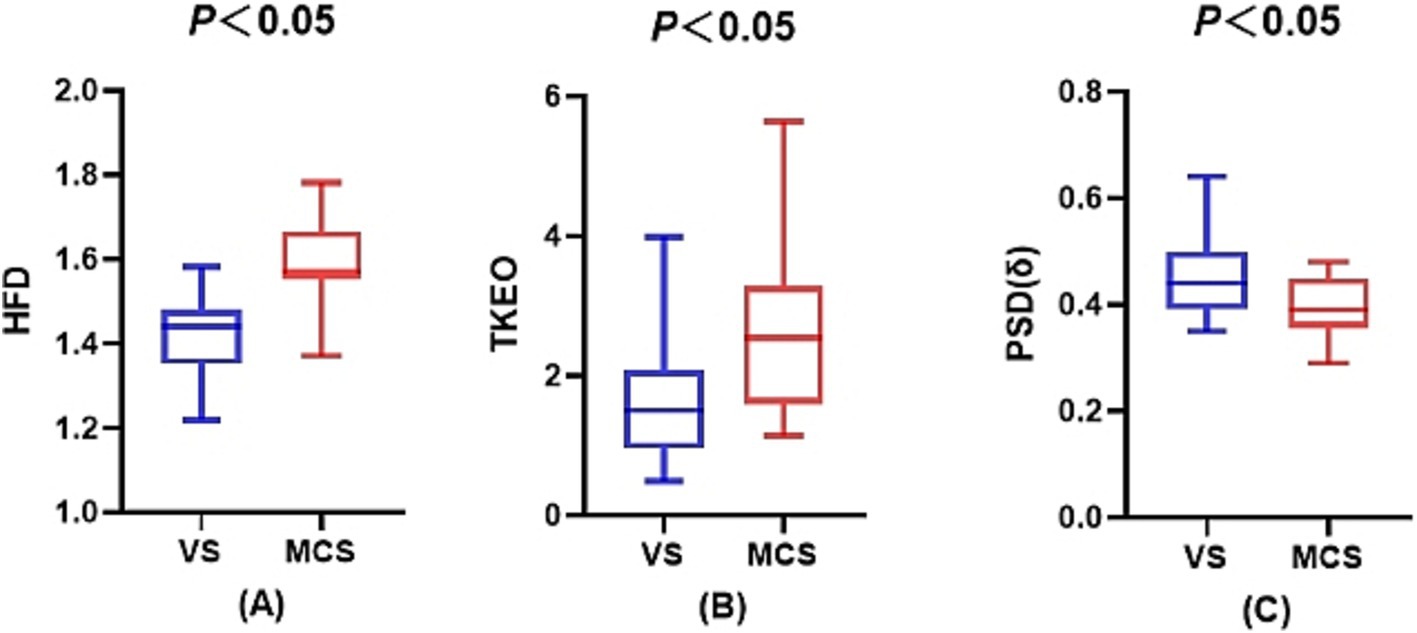
Figure 2. Sleep electroencephalogram differences between the VS/UWS and MCS groups. (A) The difference in the fractal dimension during wakefulness between the VS/UWS and MCS groups. (B) The difference in the Teager-Kaiser energy operator during the NREM2 phase between the VS/UWS and MCS groups. (C) The difference in the power spectral density of the δ-band during wakefulness between the VS/UWS and MCS groups.
The Spearman correlation analysis of the HFD, TKEO, PSD of δ waves, and CRS-R scores revealed significant relationships. The HFD showed a strong positive correlation with the CRS-R score (r = 0.781, p < 0.001). Similarly, the TKEO was positively correlated with the CRS-R score (r = 0.555, p < 0.001). In contrast, the PSD (δ) exhibited a negative correlation with the CRS-R score (r = −0.512, p < 0.001). Among these indicators, the HFD demonstrated the strongest correlation with the CRS-R score. Please refer to Figure 3 for further details.
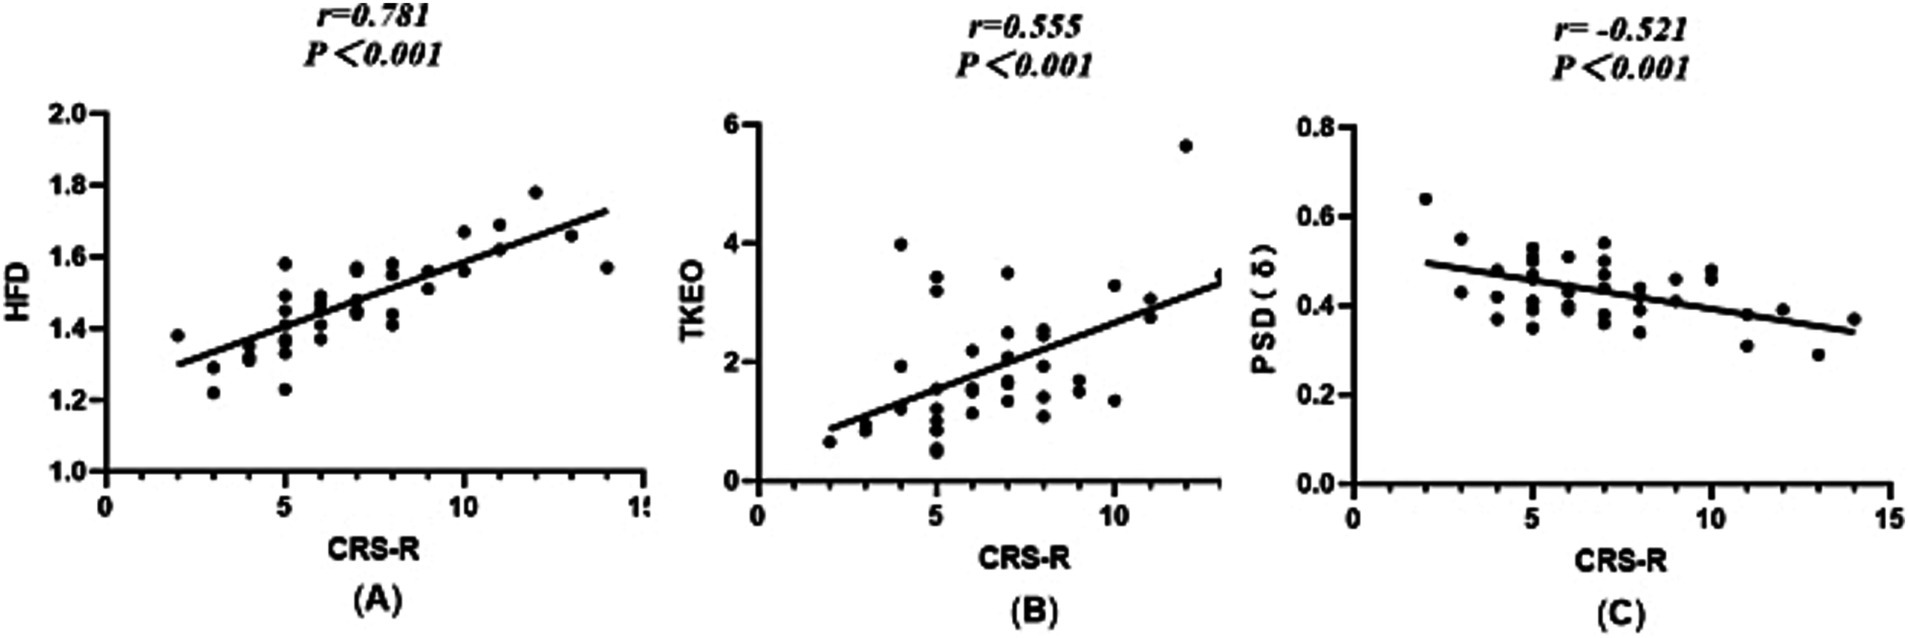
Figure 3. Scatterplot between the HFD, TKEO, PSD (δ), and CRS-R scores. (A) Dimension of the fractal during wakefulness. (B) The TKEO in the NREM2 phase. (C) The power spectral density of the δ-band during wakefulness.
The ROC curve analysis indicated that the HFD exhibited the highest diagnostic accuracy at 88.3% (p < 0.001). The TKEO demonstrated diagnostic accuracy of 75.2% (p = 0.011), while the PSD of δ waves had diagnostic accuracy of 71.5% (p = 0.029). Please see Figure 4 for additional details.
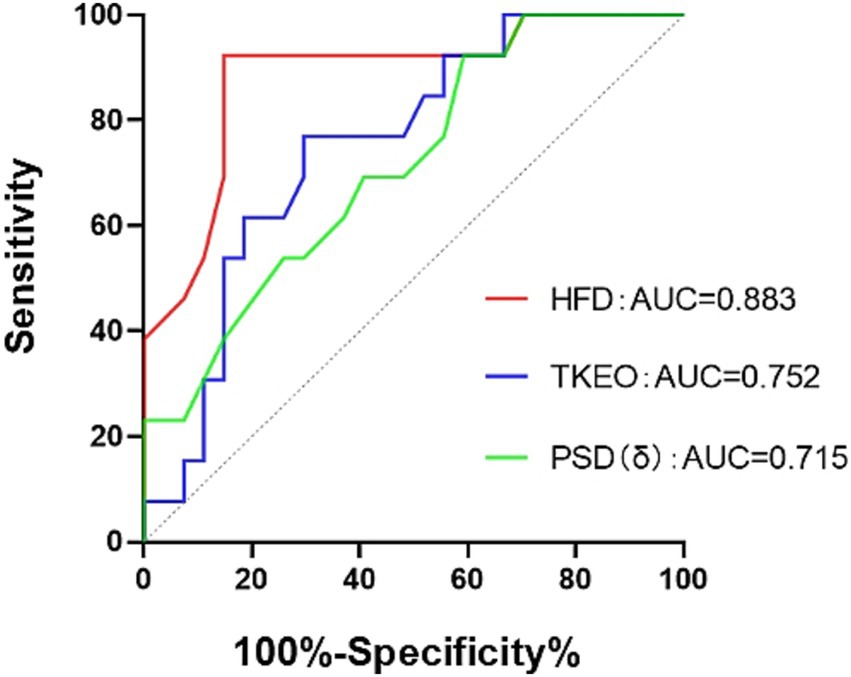
Figure 4. ROC curve. HFD, the fractal dimension during wakefulness. The TKEO, the Teager–Kaiser energy operator in the NREM2 phase. The PSD (δ), the power spectral density in the δ-band during wakefulness.
As the number of patients with pDOC continues to rise, an increasing number of studies have been conducted in recent years. Although the CRS-R score remains the gold standard for diagnosis, its misdiagnosis rate is notably high in clinical applications (Giacino et al., 2004). In contrast to neuroimaging techniques such as fMRI and PET, there is growing interest in electrophysiological techniques such as PSG and EEG. This interest stems from the advantages of electrophysiological testing as it is low-cost, non-invasive, and portable. Given that many patients with pDOC are bedridden and may have poor oxygen saturation, these techniques can be performed at the bedside, making them widely applicable in clinical practice (Comanducci et al., 2020; Porcaro et al., 2022). Moreover, unlike neuroimaging methods, electrophysiological techniques provide direct measurements of brain electrical activity, allowing for an intuitive reflection of changes in brain function. This makes them particularly valuable for diagnosing pDOC, a notion supported by the growing number of electrophysiological markers developed over the past decade (Comanducci et al., 2020; Porcaro et al., 2022). While PSG requires a longer detection time compared to EEG, it allows for the exploration of the complete sleep–wake cycle and the characteristics of EEG, revealing the close relationship between the conscious brain network and the sleep brain network (Duclos et al., 2017). Therefore, investigating sleep differences in pDOC using PSG is highly valuable. In this study, we analyzed the PSG data from 27 patients in the VS/UWS and 13 patients in the MCS, finding significant differences in the HFD and PSD (δ) during wakefulness, as well as in the TKEO during the NREM2 stage. The correlation analyses indicated that both HFD and TKEO were significantly positively correlated with the CRS-R scores, while the PSD (δ) exhibited a significant negative correlation with the CRS-R scores. Notably, the HFD showed the strongest correlation with the CRS-R scores (r = 0.781). The ROC curve analysis demonstrated significant diagnostic efficacy for the HFD, TKEO, and PSD (δ), with the HFD achieving the highest diagnostic accuracy of 88.3%.
HFD of EEG signals serves as an indicator of the complexity of EEG activity, with higher HFD values potentially reflecting more complex brain dynamics associated with elevated levels of consciousness. Currently, HFD is widely utilized in various fields, including neuroimaging analysis, bone studies, mammography, and ECG/EEG diagnostics (Maetani et al., 2023). Its versatility in EEG applications has contributed to significant advancements in understanding several disorders, such as epilepsy, sleep disorders, and Alzheimer’s disease (Gangadhar et al., 2003; Woyshville and Calabrese, 1994; Raghavendra et al., 2009; De Ruiz Miras et al., 2019). Woyshville et al. reported that patients with Alzheimer’s disease exhibited significantly lower HFD values compared to healthy participants (Woyshville and Calabrese, 1994). Similarly, Raghavendra et al. found a diffuse reduction in HFD values among patients with schizophrenia (Raghavendra et al., 2009). Ruiz et al. demonstrated that brain activity in the conscious state displayed a more complex structure and evolution compared to the unconscious state, noting that HFD values during sleep were generally lower than those during wakefulness (De Ruiz Miras et al., 2019). In our study, we observed that patients’ HFD values gradually decreased from wakefulness to deep sleep, with a tendency for the HFD to increase upon entering the REM phase, potentially correlating with dreaming during this stage (Boyce and Adamantidis, 2017). Furthermore, during the wakefulness period, the HFD values of the patients in the MCS were significantly higher compared to those in the VS/UWS. This finding suggests that brain activity in the MCS is more pronounced, indicating a higher level of consciousness. The correlation analysis further revealed that higher CRS-R scores corresponded with increased HFD values, reflecting greater complexity in brain activity. Although a similar trend was observed in the TKEO, it was not as pronounced as that seen with the HFD, aligning with previous studies.
The TKEO is a non-linear indicator that reflects the complexity of instantaneous energy in various signals. It has applications in engineering and materials science, where it is widely used to diagnose bearing faults (Shi et al., 2022) and to detect layered composite materials by analyzing instantaneous energy changes (Gałęzia and Orłowska-Gałęzia, 2021). In recent years, numerous studies have investigated the role of the TKEO in biological contexts. For instance, the TKEO has been shown to enhance the detection of electromyography onset (Li et al., 2007), identify focal EEG signals in patients with epilepsy (Chatterjee, 2019), quantify respiratory impacts on cardiac function by analyzing electrocardiogram changes (Imirzalioglu and Semiz, 2022), and detect spontaneous seizures in mice during basic experimental setups (Wei et al., 2021). However, no studies have yet explored the role of the TKEO in the sleep EEG of patients with pDOC. Our study found that during the NREM2 stage, the TKEO values were significantly higher in the patients in the MCS compared to those in the VS/UWS. This finding suggests that the EEG signals of patients in the MCS exhibit greater energy, further confirming that residual brain function in the MCS is relatively well-developed compared to the VS/UWS, with stronger functional connectivity among consciousness-related brain regions. The correlation analysis indicated a positive relationship between the TKEO and CRS-R scores, suggesting that the TKEO may serve as a sensitive indicator of consciousness level progression. Currently, there are limited studies on this topic, and further exploration of its clinical value is warranted.
Numerous previous studies on power spectra have identified significant differences between the power spectra of patients with pDOC and healthy controls, as well as between those in the VS/UWS and MCS (Stefan et al., 2018). Specifically, patients with pDOC demonstrated decreased α-band power and increased δ-band power, with these differences being more pronounced in individuals in the VS/UWS compared to those in the MCS (Franks, 2008). The PSD of δ waves is a commonly used linear metric that is closely associated with deep sleep stages, which are critical for assessing brain function, particularly in cases involving altered states of consciousness. The presence of stable and intense δ waves during anesthesia and deep sleep typically indicates unconsciousness (Franks, 2008). Our study reached a similar conclusion, finding that the PSD (δ) was significantly higher in the VS/UWS group than in the MCS group. However, the correlation with the CRS-R score was lower, and the diagnostic accuracy was also diminished, indicating weaker diagnostic value compared to the HFD and the TKEO.
The application of non-linear methods in EEG analysis has garnered increasing interest, recognizing that EEG production may not be solely explained by linear deterministic processes. As previously mentioned, Porcaro et al. found that HFD is more effective at detecting differences between the MCS and VS/UWS compared to traditional linear methods (Porcaro et al., 2022). In our study, both HFD and TKEO were identified as non-linear indicators, while the PSD of δ waves served as a linear indicator. We observed that the correlation between the HFD and TKEO and the CRS-R scores was significantly higher compared to the PSD (δ). In addition, the ROC curve analysis indicated that the diagnostic accuracy of both HFD and TKEO surpassed that of the PSD (δ), particularly for the HFD, which demonstrated a stronger correlation and higher diagnostic accuracy. This finding aligns with Porcaro et al.’s conclusion that the diagnostic efficacy of non-linear indicators may be superior to that of linear indicators, especially HFD, which shows promising diagnostic value in the assessment of pDOC.
In conclusion, our study identified three differential indicators in the PSG results of the patients in the MCS and VS/UWS. The correlation and ROC curve analyses demonstrated that all three differential indicators were correlated with the CRS-R scores and exhibited diagnostic value. Among these, the non-linear indicators (HFD and the TKEO) showed stronger correlations and higher diagnostic accuracy than the linear indicator, the PSD (δ), particularly HFD. This finding can help clinical practitioners distinguish between the VS/UWS and MCS, reduce the misdiagnosis rate, and provide an objective basis for clinical decision-making. However, we acknowledge that a primary limitation of the study is the relatively small sample size and the significant discrepancy in the number of participants between the two groups, which might have affected the outcomes. In addition, the 16-h testing period might not have encompassed the complete sleep–wake cycle of the patients compared to a 24-h PSG assessment. Therefore, further research is needed to validate our findings in a larger cohort and to increase the number of test leads and the duration of testing as much as possible. Furthermore, diagnosing pDOC is complex, and relying on single diagnostic methods is often insufficient; thus, we should explore as many multimodal diagnostic approaches as possible in the future.
The PSG results in the VS/UWS and MCS groups differed significantly, aiding in distinguishing between these groups and lowering the misdiagnosis rate. Notably, the HFD and PSD (δ) showed better diagnostic potential during wakefulness than during sleep, while the TKEO excelled in NREM2. In particular, the HFD during wakefulness exhibited a stronger correlation with the CRS-R scores, the highest diagnostic accuracy, and promise in diagnosing pDOC.
The raw data supporting the conclusions of this article will be made available by the authors, without undue reservation.
The studies involving humans were approved by Ethics Committee of the Fifth Affiliated Hospital of Zhengzhou University. The studies were conducted in accordance with the local legislation and institutional requirements. The participants provided their written informed consent to participate in this study. Written informed consent was obtained from the individual(s) for the publication of any potentially identifiable images or data included in this article.
KL: Data curation, Investigation, Methodology, Resources, Validation, Writing – original draft. ML: Methodology, Software, Writing – review & editing. WL: Conceptualization, Supervision, Writing – review & editing. YW: Supervision, Writing – review & editing. FL: Data curation, Supervision, Writing – review & editing. JX: Supervision, Writing – review & editing. SZ: Supervision, Writing – review & editing. SW: Data curation, Supervision, Writing – review & editing. YG: Data curation, Project administration, Supervision, Writing – review & editing. JP: Methodology, Software, Supervision, Writing – review & editing. XW: Conceptualization, Data curation, Funding acquisition, Software, Supervision, Writing – review & editing.
The author(s) declare that financial support was received for the research, authorship, and/or publication of this article. This research was supported by Open Foundation of Henan Zhongyuan Talent Program (Talent Education Series).
The authors declare that the research was conducted in the absence of any commercial or financial relationships that could be construed as a potential conflict of interest.
The author(s) declare that no Gen AI was used in the creation of this manuscript.
All claims expressed in this article are solely those of the authors and do not necessarily represent those of their affiliated organizations, or those of the publisher, the editors and the reviewers. Any product that may be evaluated in this article, or claim that may be made by its manufacturer, is not guaranteed or endorsed by the publisher.
The Supplementary material for this article can be found online at: https://www.frontiersin.org/articles/10.3389/fnhum.2025.1521355/full#supplementary-material
Bodien, Y. G., Allanson, J., Cardone, P., Bonhomme, A., Carmona, J., Chatelle, C., et al. (2024). Cognitive motor dissociation in disorders of consciousness. N. Engl. J. Med. 391, 598–608. doi: 10.1056/NEJMoa2400645
Boyce, R., and Adamantidis, A. (2017). REM sleep on it! Neuropsychopharmacol.: Official Pub. American College of Neuropsychopharmacol. 42:375. doi: 10.1038/npp.2016.227
Calabrò, R. S., Bramanti, P., and Naro, A. (2016). Towards new methods of diagnosis in disorders of consciousness. Lancet Neurol. 15, 1114–1115. doi: 10.1016/S1474-4422(16)30202-2
Chatterjee, S. (2019). Detection of focal electroencephalogram signals using higher-order moments in EMD-TKEO domain. Healthc Technol Lett. 6, 64–69. doi: 10.1049/htl.2018.5036
Cheapen, B. C., Georgekutty, J., Subbarao, B., Bavishi, S., and Cifu, D. X. (2017). Disorders of consciousness. Phys. Med. Rehabil. Clin. N. Am. 28, 245–258. doi: 10.1016/j.pmr.2016.12.003
Cologan, V., Drouot, X., Parapatics, S., Delorme, A., Gruber, G., Moonen, G., et al. (2013). Sleep in the unresponsive wakefulness syndrome and minimally conscious state. J. Neurotrauma 30, 339–346. doi: 10.1089/neu.2012.2654
Comanducci, A., Boly, M., Claassen, J., and De, L. (2020). Clinical and advanced neurophysiology in the prognostic and diagnostic evaluation of disorders of consciousness: review of an IFCN-endorsed expert group. Clin. Neurophysiol. 131, 2736–2765. doi: 10.1016/j.clinph.2020.07.015
De Ruiz Miras, J., Soler, F., and Iglesias-Parro, S. (2019). Fractal dimension analysis of states of consciousness and unconsciousness using transcranial magnetic stimulation. Comput. Methods Prog. Biomed. 175, 129–137. doi: 10.1016/j.cmpb.2019.04.017
Duclos, C., Dumont, M., Arbour, C., Paquet, J., Blais, H., Menon, D. K., et al. (2017). Parallel recovery of consciousness and sleep in acute traumatic brain injury. Neurology 88, 268–275. doi: 10.1212/WNL.0000000000003508
Franks, N. P. (2008). General anaesthesia: from molecular targets to neuronal pathways of sleep and arousal. Nat. Rev. Neurosci. 9, 370–386. doi: 10.1038/nrn2372
Gałęzia, A., and Orłowska-Gałęzia, A. (2021). Application of Teager-Kaiser's instantaneous frequency for detection of delamination in FRP composite materials. Materials (Basel) 14:1154. doi: 10.3390/ma14051154
Gangadhar, B., Janakiramiah, N., Girish, K., and Ramakrishnan, A. (2003). Post-seizure EEG fractal dimension and spectral power predict antidepressant response to unilateral ECT. Indian J. Psychiatry 45, 16–20.
Giacino, J. T., Kalmar, K., and Whyte, J. (2004). The JFK coma recovery scale-revised: measurement characteristics and diagnostic utility. Arch. Phys. Med. Rehabil. 85, 2020–2029. doi: 10.1016/j.apmr.2004.02.033
Imirzalioglu, M., and Semiz, B. (2022). Quantifying respiration effects on cardiac vibrations using Teager energy operator and gradient boosted trees. Annu Int Conf IEEE Eng Med Biol Soc. 2022, 1935–1938. doi: 10.1109/EMBC48229.2022.9871636
Kang, J., Huang, L., Tang, Y., Chen, G., Ye, W., Wang, J., et al. (2022). A dynamic model to predict long-term outcomes in patients with prolonged disorders of consciousness. Aging (Albany NY) 14, 789–799. doi: 10.18632/aging.203840
Kondziella, D., Bender, A., and Diserens, K. (2020). EAN panel on coma, disorders of consciousness. European academy of neurology guideline on the diagnosis of coma and other disorders of consciousness. Eur. J. Neurol. 27, 741–756. doi: 10.1111/ene.14151
Li, X., Zhou, P., and Aruin, A. S. (2007). Teager-Kaiser energy operation of surface EMG improves muscle activity onset detection. Ann. Biomed. Eng. 35, 1532–1538. doi: 10.1007/s10439-007-9320-z
Maetani, T., Tanabe, N., Terada, S., Shiraishi, Y., Shima, H., et al. (2023). Physiological impacts of computed tomography airway dysanapsis, fractal dimension, and branch count in asymptomatic never smokers. J. App. Physiol. (Bethesda, Md. 1985) 134, 20–27. doi: 10.1152/japplphysiol.00385.2022
Morgenthaler, T., Kramer, M., Alessi, C., Friedman, L., Boehlecke, B., Brown, T., et al. (2006). American Academy of sleep medicine. Practice parameters for the psychological and behavioral treatment of insomnia: an update. An american academy of sleep medicine report. Sleep 29, 1415–1419
Porcaro, C., Marino, M., Carozzo, S., Russo, M., Ursino, M., Ruggiero, V., et al. (2022). Fractal dimension feature as a signature of severity in disorders of consciousness: an EEG study. Int. J. Neural Syst. 32:2250031. doi: 10.1142/S0129065722500319
Porcaro, C., Nemirovsky, I. E., Riganello, F., Mansour, Z., and Cerasa, A. (2022). Diagnostic developments in differentiating unresponsive wakefulness syndrome and the minimally conscious state. Front. Neurol. 12:778951. doi: 10.3389/fneur.2021.778951
Raghavendra, B. S., Dutt, D. N., Halahalli, H. N., and John, J. P. (2009). Complexity analysis of EEG in patients with schizophrenia using fractal dimension. Physiol. Meas. 30, 795–808. doi: 10.1088/0967-3334/30/8/005
Rossi, S., Visani, E., Panzica, F., Sattin, D., and Bersano, A. (2018). Sleep patterns associated with the severity of impairment in a large cohort of patients with chronic disorders of consciousness. Clin. Neurophysiol. 129, 687–693. doi: 10.1016/j.clinph.2017.12.012
Schmidt, M. T., Kanda, P. A., and Basile, L. F. (2013). Index of alpha/theta ratio of the electroencephalogram: a new marker for Alzheimer's disease. Front. Aging Neurosci. 5:60. doi: 10.3389/fnagi.2013.00060
Septien, S., and Rubin, M. A. (2018). Disorders of consciousness: ethical issues of diagnosis, treatment, and prognostication. Semin. Neurol. 38, 548–554. doi: 10.1055/s-0038-1667384
Shi, X., Zhang, Z., Xia, Z., Li, B., Gu, X., et al. (2022). Application of Teager-Kaiser energy operator in the early fault diagnosis of rolling bearings. Sensors (Basel). 22:6673. doi: 10.3390/s2217666673
Stefan, S., Schorr, B., Lopez-Rolon, A., Kolassa, I. T., Shock, J. P., Rosenfelder, M., et al. (2018). Consciousness indexing and outcome prediction with resting-state EEG in severe disorders of consciousness. Brain Topogr. 31, 848–862. doi: 10.1007/s10548-018-0643-x
Stender, J., Gosseries, O., Bruno, M. A., Charland-Verville, V., Vanhaudenhuyse, A., Demertzi, A., et al. (2014). Diagnostic precision of PET imaging and functional MRI in disorders of consciousness: a clinical validation study. Lancet 384, 514–522. doi: 10.1016/S0140-6736(14)60042-8
Thibaut, A., Schiff, N., Giacino, J., Laureys, S., and Gosseries, O. (2019). Therapeutic interventions in patients with prolonged disorders of consciousness. Lancet Neurol. 18, 600–614. doi: 10.1016/S1474-4422(19)30031-6
Walker, T. M., Miotto, P., Köser, C. U., Fowler, P. W., Knaggs, J., Iqbal, Z., et al. (2022). The 2021 WHO catalogue of Mycobacterium tuberculosis complex mutations associated with drug resistance: a genotypic analysis. Lancet Microbe. 3, e265–e273. doi: 10.1016/S2666-5247(21)00301-3
Wei, L., Boutouil, H., Gerbatin, R., Mamad, O., Heiland, M., et al. (2021). Detection of spontaneous seizures in EEGs in multiple experimental mouse models of epilepsy. J. Neural Eng. 18:056060. doi: 10.1088/1741-2552/ac2ca0
Keywords: polysomnography, prolonged disorders of consciousness, CRS-R, fractal dimension, Teager–Kaiser energy operator
Citation: Li K, Li M, Liu W, Wu Y, Li F, Xie J, Zhou S, Wang S, Guo Y, Pan J and Wang X (2025) Electroencephalographic differences between waking and sleeping periods in patients with prolonged disorders of consciousness at different levels of consciousness. Front. Hum. Neurosci. 19:1521355. doi: 10.3389/fnhum.2025.1521355
Edited by:
Sergio Bagnato, Provincial Agency for Health Services (APSS) of Trento, ItalyReviewed by:
Xiaoyu Xia, Chinese PLA General Hospital, ChinaCopyright © 2025 Li, Li, Liu, Wu, Li, Xie, Zhou, Wang, Guo, Pan and Wang. This is an open-access article distributed under the terms of the Creative Commons Attribution License (CC BY). The use, distribution or reproduction in other forums is permitted, provided the original author(s) and the copyright owner(s) are credited and that the original publication in this journal is cited, in accordance with accepted academic practice. No use, distribution or reproduction is permitted which does not comply with these terms.
*Correspondence: Xinjun Wang, d2FuZ3hqQHp6dS5lZHUuY24=; Yongkun Guo, aG9wZXNjaUAxNjMuY29t; Jiahui Pan, cGFuamlhaHVpQG0uc2NudS5lZHUuY24=
†These authors have contributed equally to this work
Disclaimer: All claims expressed in this article are solely those of the authors and do not necessarily represent those of their affiliated organizations, or those of the publisher, the editors and the reviewers. Any product that may be evaluated in this article or claim that may be made by its manufacturer is not guaranteed or endorsed by the publisher.
Research integrity at Frontiers
Learn more about the work of our research integrity team to safeguard the quality of each article we publish.