 Kun Guo
 Bo Zhu
 Lei Zha1
 Naibing Gu
95% of researchers rate our articles as excellent or good
Learn more about the work of our research integrity team to safeguard the quality of each article we publish.
Find out more
ORIGINAL RESEARCH article
Front. Neurol. , 04 March 2025
Sec. Stroke
Volume 16 - 2025 | https://doi.org/10.3389/fneur.2025.1522868
Background: Ischemic Stroke (IS) stands as a leading cause of mortality and disability globally, with an anticipated increase in IS-related fatalities by 2030. Despite therapeutic advancements, many patients still lack effective interventions, underscoring the need for improved prognostic assessment tools. Machine Learning (ML) models have emerged as promising tools for predicting stroke prognosis, surpassing traditional methods in accuracy and speed.
Objective: The aim of this study was to develop and validate ML algorithms for predicting the 6-month prognosis of patients with Acute Cerebral Infarction, using clinical data from two medical centers in China, and to assess the feasibility of implementing Explainable ML in clinical settings.
Methods: A retrospective observational cohort study was conducted involving 398 patients diagnosed with Acute Cerebral Infarction from January 2023 to February 2024. The dataset included demographic information, medical histories, clinical evaluations, and laboratory results. Six ML models were constructed: Logistic Regression, Naive Bayes, Support Vector Machine (SVM), Random Forest, XGBoost, and AdaBoost. Model performance was evaluated using the Area Under the Receiver Operating Characteristic curve (AUC), sensitivity, specificity, predictive values, and F1 score, with five-fold cross-validation to ensure robustness.
Results: The training set, identified key variables associated with stroke prognosis, including hypertension, diabetes, and smoking history. The SVM model demonstrated exceptional performance, with an AUC of 0.9453 on the training set and 0.9213 on the validation set. A Nomogram based on Logistic Regression was developed for visualizing prognostic risk, incorporating factors such as the National Institutes of Health Stroke Scale (NIHSS) score, Barthel Index (BI), Watanabe Drinking Test (KWST) score, Platelet Distribution Width (PDW), and others. Our models showed high predictive accuracy and stability across both datasets.
Conclusion: This study presents a robust ML approach for predicting stroke prognosis, with the SVM model and Nomogram providing valuable tools for clinical decision-making. By incorporating advanced ML techniques, we enhance the precision of prognostic assessments and offer a theoretical and practical framework for clinical application.
Ischemic stroke (IS) is a leading cause of mortality and disability worldwide, with a stark increase in global IS-related deaths reaching 3.29 million in 2023, and projections estimate a rise to 4.9 million by 2030 (1). The rapid aging and industrialization of societies, along with the spread of unhealthy lifestyle and dietary habits, have made IS the primary cause of death and disability among adults in China (2, 3). Despite advancements in the management, treatment, and prevention of IS, many patients still lack effective interventions. The prognosis of stroke is a complex process, influenced by a multitude of factors (4, 5). Timely determination of prognosis is crucial for physicians to adjust intervention strategies, prevent recurrence, ascertain adverse outcomes, and provide precision treatment plans (6). However, traditional statistical methods have limitations in terms of prognostic accuracy. The advent of machine learning has shown immense promise in handling large datasets and identifying complex patterns, offering a new horizon in the assessment of stroke prognosis.
Machine learning (ML) models have garnered attention for their prowess in handling vast datasets and discerning complex patterns (7). In the realm of prognosis assessment, these models swiftly identify independent predictive factors associated with adverse outcomes (8). The precision of these models is enhanced through a rigorous evaluation that encompasses a spectrum of metrics, including accuracy, recall, F1 score, Area Under the Receiver Operating Characteristic curve (AUC), and Shapley Additive explanations (SHAP) values. This approach not only surpasses traditional predictive methods in terms of speed but also demonstrates increasing accuracy in practical clinical applications (9).
For instance, a study optimized Principal Component Analysis (PCA) and integrated models such as Random Forest, Decision Trees, and K-Nearest Neighbors (KNN) to achieve a remarkable 98.6% accuracy rate in stroke prediction (10). Another investigation harnessed machine learning to develop a risk stratification model based on data from patients with acute ischemic stroke (AIS), which exhibited excellent predictive power as assessed by AUC values (11). Furthermore, research employing diverse machine learning algorithms to predict 90-day outcomes in stroke patients identified the Random Forest model as the ultimate predictor, with the highest AUC value.
While the performance of machine learning models is contingent upon the quality and completeness of the input data, and challenges regarding dataset representativeness and model generalizability persist, the prospects for their application in stroke prognosis assessment remain promising (12). The aim of this study is to harness clinical data to predict the 6-month prognosis of patients with cerebral infarction using machine learning algorithms and to evaluate the feasibility of explainable machine learning in clinical practice, thereby providing theoretical and practical support for its clinical application.
This retrospective observational cohort study included participants from two medical institutions: Xi’an Central Hospital (Center 1) and Tongchuan Mining Bureau Central Hospital (Center 2). We collected data on 474 patients diagnosed with acute cerebral infarction who visited these hospitals between January 2023 and February 2024. After applying the inclusion and exclusion criteria, 56 individuals are excluded in data loss and we ultimately retained 398 individuals to study. The administration of intravenous tissue plasminogen activator (rt-PA) conformed to the early management guidelines for acute ischemic stroke (AIS) from 2019 and 2023 (13, 14). Inclusion and Exclusion Criteria are as follows (Figure 1).
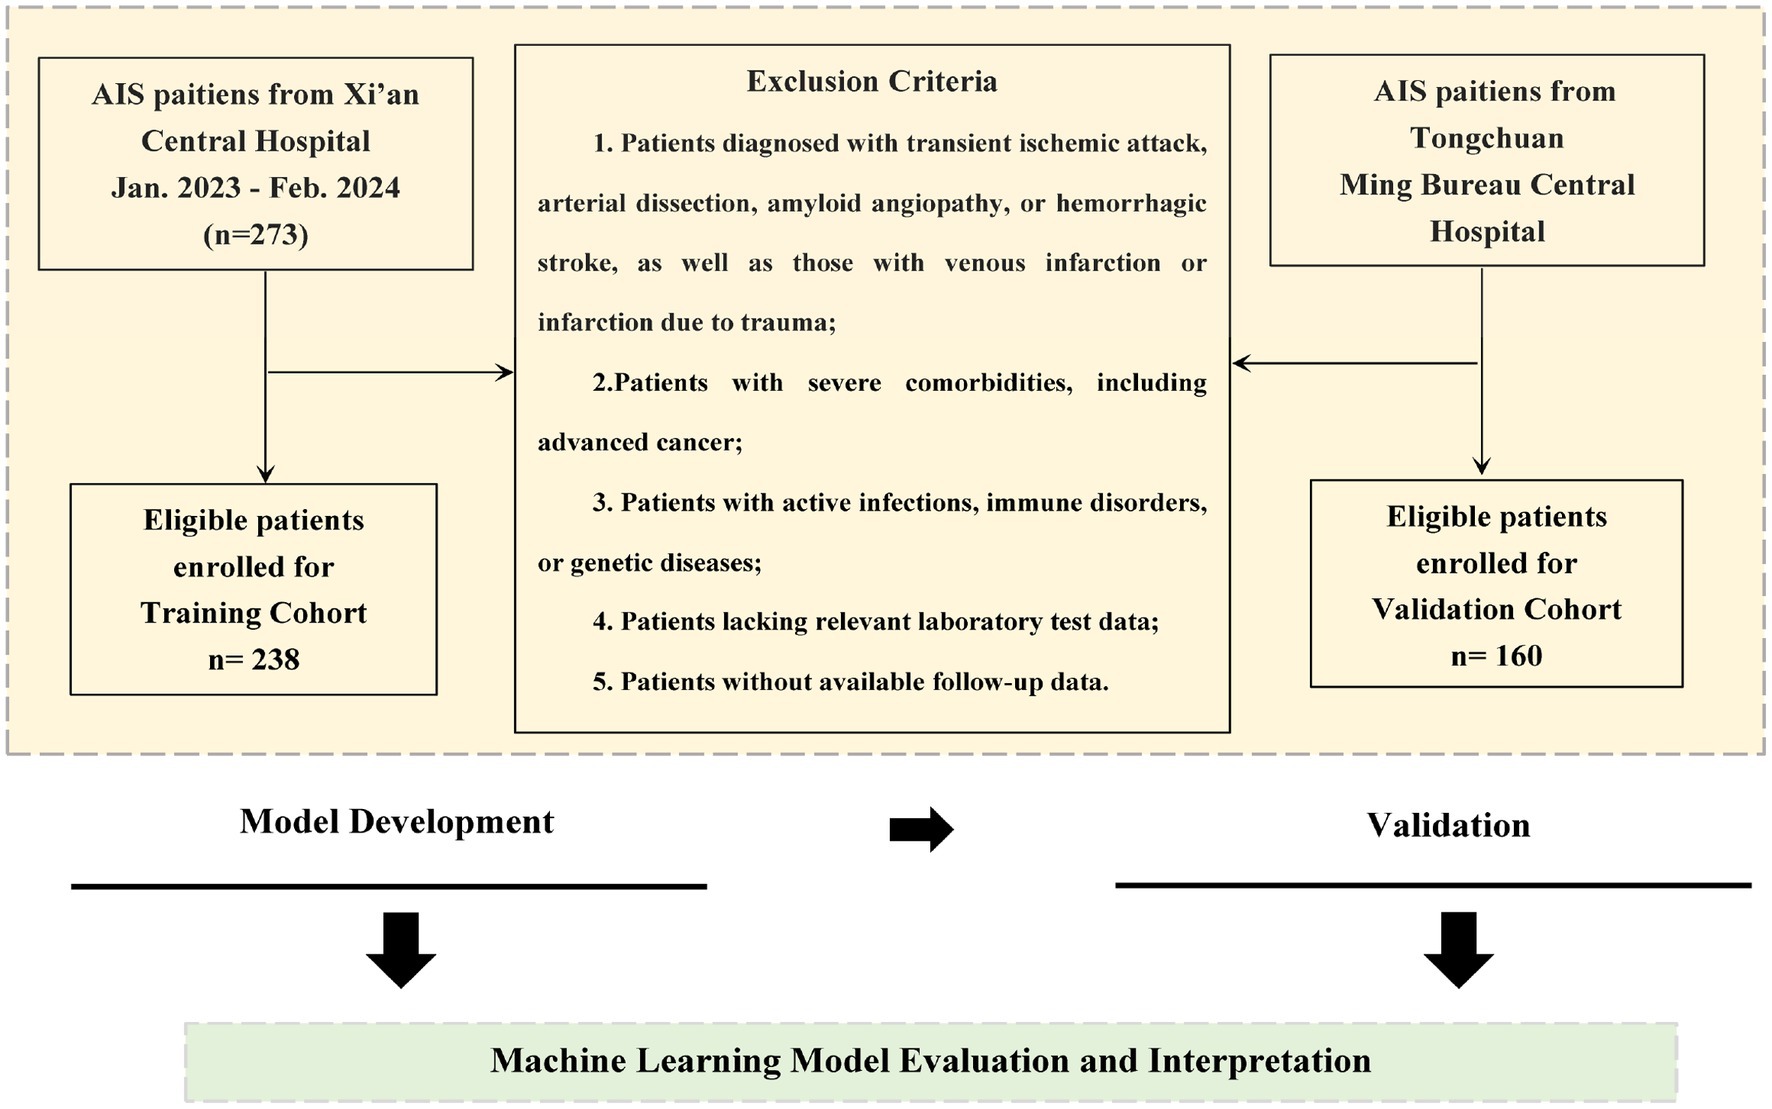
Figure 1. Workflow of the patient selection.
1. Age greater than 18 years;
2. Diagnosis of ischemic stroke within 72 h of symptom onset, in accordance with World Health Organization (WHO) criteria;
3. Received ischemic reperfusion therapy upon hospital admission.
1. Patients diagnosed with transient ischemic attack, arterial dissection, amyloid angiopathy, or hemorrhagic stroke, as well as those with venous infarction or infarction due to trauma;
2. Patients with severe comorbidities, including advanced cancer;
3. Patients with active infections, immune disorders, or genetic diseases;
4. Patients lacking relevant laboratory test data;
5. Patients without available follow-up data.
In this study, a comprehensive assessment was conducted upon admission for all participants, including demographic data and medical histories with a focus on vascular risk factors and past conditions such as hypertension, hyperlipidemia, hyperuricemia, hypoalbuminemia, hyperhomocysteinemia, and type 2 diabetes mellitus. We also documented histories of smoking, alcohol consumption, atrial fibrillation, coronary heart disease, and cerebrovascular stenosis.
Clinical evaluations included the TOAST classification, blood pressure, National Institutes of Health Stroke Scale (NIHSS) score, ADL score, and the Watanabe Drinking Test. The Watanabe Drinking Test (KWST), developed by Japanese scholar Watanabe Toshio, is a method for assessing swallowing function by observing a patient’s ability to drink a specified amount of water and noting any coughing or choking. Laboratory data encompassed a wide range of tests, including complete blood count, red cell distribution width (RDW), platelet distribution width (PDW), neutrophil (NEU), lymphocyte (LYM), monocyte (MON), red blood cell (RBC) count, hemoglobin (Hb), total bilirubin (TBIL), albumin (Alb), globulin (Glb), alanine aminotransferase (ALT), aspartate aminotransferase (AST), urea, creatinine (Cr), uric acid (UA), total cholesterol (TC), triglycerides (TG), apolipoprotein A-I (ApoAI), high-density lipoprotein (HDL), low-density lipoprotein (LDL), glucose (Glu), and homocysteine (HCY). Electrolyte levels (K, Na, Cl, Ca, P) and coagulation functions (PT, INR, APTT, TT, FIB, DD, FDP) were assessed. Cardiac function was evaluated with ejection fraction (EF) and heart rate (HR), and nutritional status with the Geriatric Nutritional Risk Index (GNRI) (15–19).
These indices, derived from routine blood tests, offer clinicians a swift and effective tool for assessing a patient’s inflammatory status. When these ratios are elevated, they are frequently indicative of heightened inflammatory activity, which can be instrumental in diagnosing and monitoring of a variety of inflammation conditions.
Prognosis assessment was conducted by two licensed neurologists who were trained in the standardized mRS (modified Rankin Scale) scoring system and were blinded to the study’s objectives. They independently evaluated the patients’ outcomes through telephone interviews at the 3-month mark following discharge. In instances where there was a disagreement between the two neurologists, a third senior neurologist, also blinded to the study, was consulted to make the final determination. The prognosis was dichotomized into two categories: good prognosis, defined as an mRS score of 2 or less, and poor prognosis, indicated by an mRS score greater than 2.
In this study, we evaluated the prognostic predictive accuracy of various clinical indicators for stroke patients using Receiver Operating Characteristic (ROC) curves and Area Under the Curve (AUC) values. We employed heatmaps to visually represent the correlation coefficients among different clinical indicators, thereby elucidating their interrelationships. To reduce the risk of multicollinearity, we initially excluded features with Spearman correlation coefficients greater than 0.9. Following this, we utilized the LASSO (Least Absolute Shrinkage and Selection Operator) regression model to further refine our variable selection. Cross-validation was employed to determine the optimal regularization parameter, Lambda, which is essential for balancing model complexity and predictive performance. By using the “lassoCV” function, we assessed the mean squared error (MSE) across a spectrum of Lambda values to pinpoint the value that minimizes MSE, thereby identifying the optimal Lambda. Our five-fold cross-validation analysis revealed that an optimal log Lambda value of approximately-4 provided the best model discrimination and predictive accuracy. After applying LASSO and subsequent multivariate analysis, we selected the variables to be included in the model.
We then proceeded to construct six distinct machine learning models to forecast the mRS score at the 6-month post-discharge mark for patients suffering from acute ischemic stroke. The models included logistic regression, naive Bayes, support vector machine (SVM), random forest, XGBoost, and AdaBoost. Each model’s performance was rigorously evaluated using a suite of metrics: the area under the receiver operating characteristic curve (AUC), sensitivity, specificity, predictive values, and the F1 score. To ascertain the robustness and generalizability of our models, a five-fold cross-validation approach was employed. This technique involves partitioning the data into five segments to ensure a comprehensive assessment.
The interpretability of machine learning models is pivotal for elucidating the predictions made by ML models and for quantifying the influence of individual features on these predictions. To enhance the interpretability of our logistic regression model, we employed a Nomogram. A Nomogram is an intuitive graphical tool that consolidates the effects of multiple predictive variables into a single visual representation, making it an excellent choice for improving model transparency and interpretability. It visually represents the contribution of each variable to the prediction outcome through scaled line segments, which significantly boosts the model’s clarity and interpretability. Furthermore, we utilized the SHAP (SHapley Additive exPlanations) method to interpret the SVM model. The SHAP method enables interpretation of model predictions at both the individual patient level and the cohort level. By computing the SHAP values for each feature across all patients and averaging them, we can gauge the significance of each feature in predicting outcomes. The SHAP feature importance plot unveils the global impact of features, where a higher average absolute SHAP value indicates a more substantial contribution to the model’s predictions. The SHAP summary plot further delineates the specific influence of each feature on model predictions, with each plot point representing the SHAP value of a particular feature for an individual patient, and the color gradient from red to blue indicating the magnitude of the feature values. Additionally, SHAP dependency plots provide insights into how changes in specific feature values affect model predictions. These analyses were conducted using SHAP version 0.46.0 within a Python environment.
Statistical analyses in this study were conducted using Python 3.12.1 and R 4.4.1. Data normality was assessed with the Kolmogorov–Smirnov test. For normally distributed continuous variables, we used independent samples t-tests; for non-normally distributed data, Mann–Whitney U tests were applied. Categorical variables were analyzed with chi-square tests or Fisher’s exact tests when appropriate. Machine learning models were also constructed for prediction. We considered p < 0.05 (two-tailed) as statistically significant.
Center 1 (n = 238) served as the training set for model development, while Center 2 (n = 160) functioned as the internal validation set. In the training set, univariate analysis identified significant differences in several key variables between the good and poor prognosis groups: hypertension (p < 0.001), diabetes (p < 0.001), smoking history (p < 0.001), alcohol consumption history (p = 0.043), platelet distribution width (PDW) (p < 0.001), hyperhomocysteinemia (p = 0.002), apolipoprotein A1 (ApoAI) (p = 0.014), activated partial thromboplastin time (APTT) (p = 0.006), D-dimer (DD) (p = 0.03), Barthel Index (BI) (p < 0.001), and the National Institutes of Health Stroke Scale (NIHSS) (p < 0.001). These variables could be linked to disease occurrence, progression, or prognosis. Variables such as age, gender, hyperlipidemia, hyperuricemia, hypoalbuminemia, white blood cell count, red blood cell count, hemoglobin, hematocrit, platelet count, albumin, globulin, etc., did not show significant differences (p ≥ 0.05), suggesting they may not be the primary drivers of prognosis (Table 1).

Table 1. Baseline characteristics of patients in training and validation cohorts.
In our study, we assessed the prognostic accuracy of various clinical indicators for stroke patients using Receiver Operating Characteristic (ROC) curves (Supplementary Figure S1A) and Area Under the Curve (AUC) values (Supplementary Figure S1B). The analysis revealed several key indicators with high sensitivity, including hypertension, diabetes, smoking history, aortic stenosis, blood viscosity, neutrophil proportion, platelet distribution width (PDW), aspartate aminotransferase, activated partial thromboplastin time (APTT), D-dimer, systemic immune-inflammation index (SII), platelet-to-lymphocyte ratio (PLR), Barthel Index (BI), and National Institutes of Health Stroke Scale (NIHSS). Notably, BI and NIHSS exhibited exceptionally high sensitivity values, with AUCs of 0.98 and 1.00, respectively, highlighting their critical role in assessing post-stroke functional prognosis. APTT, D-dimer, and SII also showed high sensitivity with AUC values of 0.98, 1.00, and 0.75, respectively, likely due to their importance in monitoring coagulation and inflammation in stroke patients. The AUC for NIHSS was 0.84, indicating strong discriminative power. Other indicators such as smoking history, PDW, blood viscosity, hyperhomocysteinemia, and diabetes demonstrated significant discriminative power with AUC values ranging from 0.68 to 0.76. In contrast, traditional cardiovascular risk factors and demographic indicators like age, gender, and heart rate had lower AUC values, suggesting their limited predictive utility in stroke prognosis. In conclusion, our AUC analysis identified a set of clinical indicators with robust discriminative power for stroke prognosis, particularly NIHSS, smoking history, and PDW, which can serve as valuable tools in evaluating stroke outcomes.
We employed heatmaps to graphically display the correlation coefficients among various clinical indicators, providing a clear visual representation of their relationships. Notable findings include an exact correlation coefficient of 1 between Smoking History and Drinking History, signifying an extremely significant positive correlation. A strong negative correlation was identified between APTT and DD, with a correlation coefficient of −0.62, indicating that as one increases, the other tends to decrease significantly. Conversely, a strong positive correlation was observed between FDP and DD, with a coefficient of 0.98, suggesting a high degree of direct relationship. The correlation coefficient of −0.64 between BI and NIHSS underscores the relationship between post-stroke functional prognosis and stroke severity. Hyperhomocysteinemia, TBIL, and SII exhibited moderate correlations with several variables, with correlation coefficients of −0.2, −0.2, and −0.4, respectively, indicating a moderate inverse relationship (Supplementary Figure S2).
In our study, the feature selection process initially excluded features with Spearman correlation coefficients exceeding 0.9 to mitigate the risk of multicollinearity. Subsequently, we employed the LASSO regression model (Figure 2) to further refine our variable selection, and based on this analysis, we selected nine variables of significant importance for predicting the prognosis of stroke patients: National Institutes of Health Stroke Scale (NIHSS), Barthel Index (BI), Watanabe Drinking Test (KWST), Apolipoprotein A1 (ApoAI), Platelet Distribution Width (PDW), Aortic Stenosis (AS), Smoking History, Diabetes, and Hypertension. Following subsequent multivariate analysis, (Table 2) we further identified several significant factors that influence stroke prognosis, including hypertension, diabetes, smoking history, Platelet Distribution Width (PDW), Watanabe Drinking Test (KWST) score, Barthel Index (BI), and National Institutes of Health Stroke Scale (NIHSS). These variables were then integrated into a nomogram model, serving as a predictive tool for poor prognosis in stroke patients.
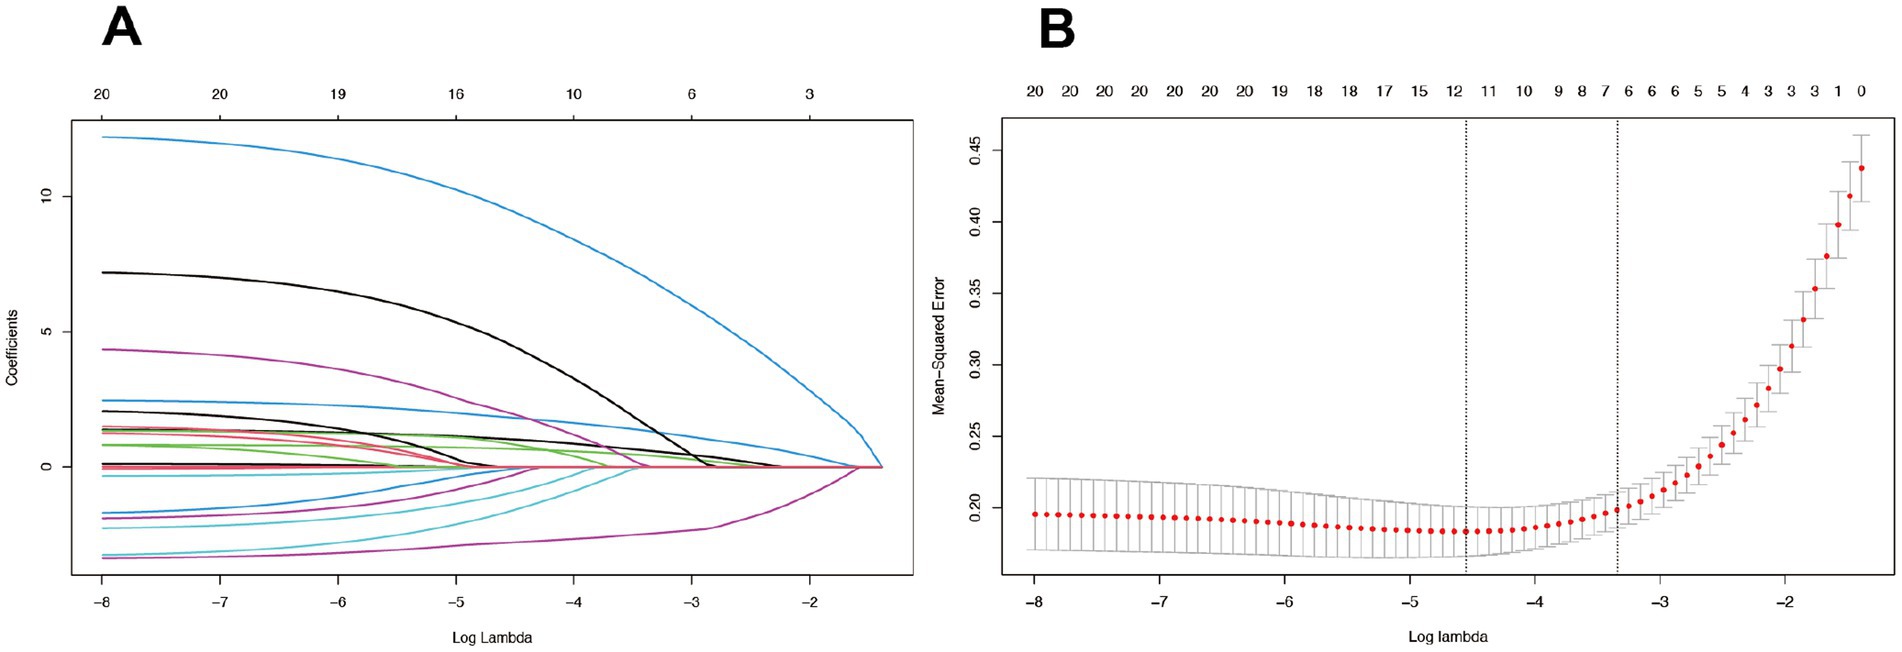
Figure 2. The LASSO model, employing a tuning parameter (λ) and utilizing fivefold cross-validation with both minimum and 1se criteria (B), was used to select radiomics features during the feature selection process (A).
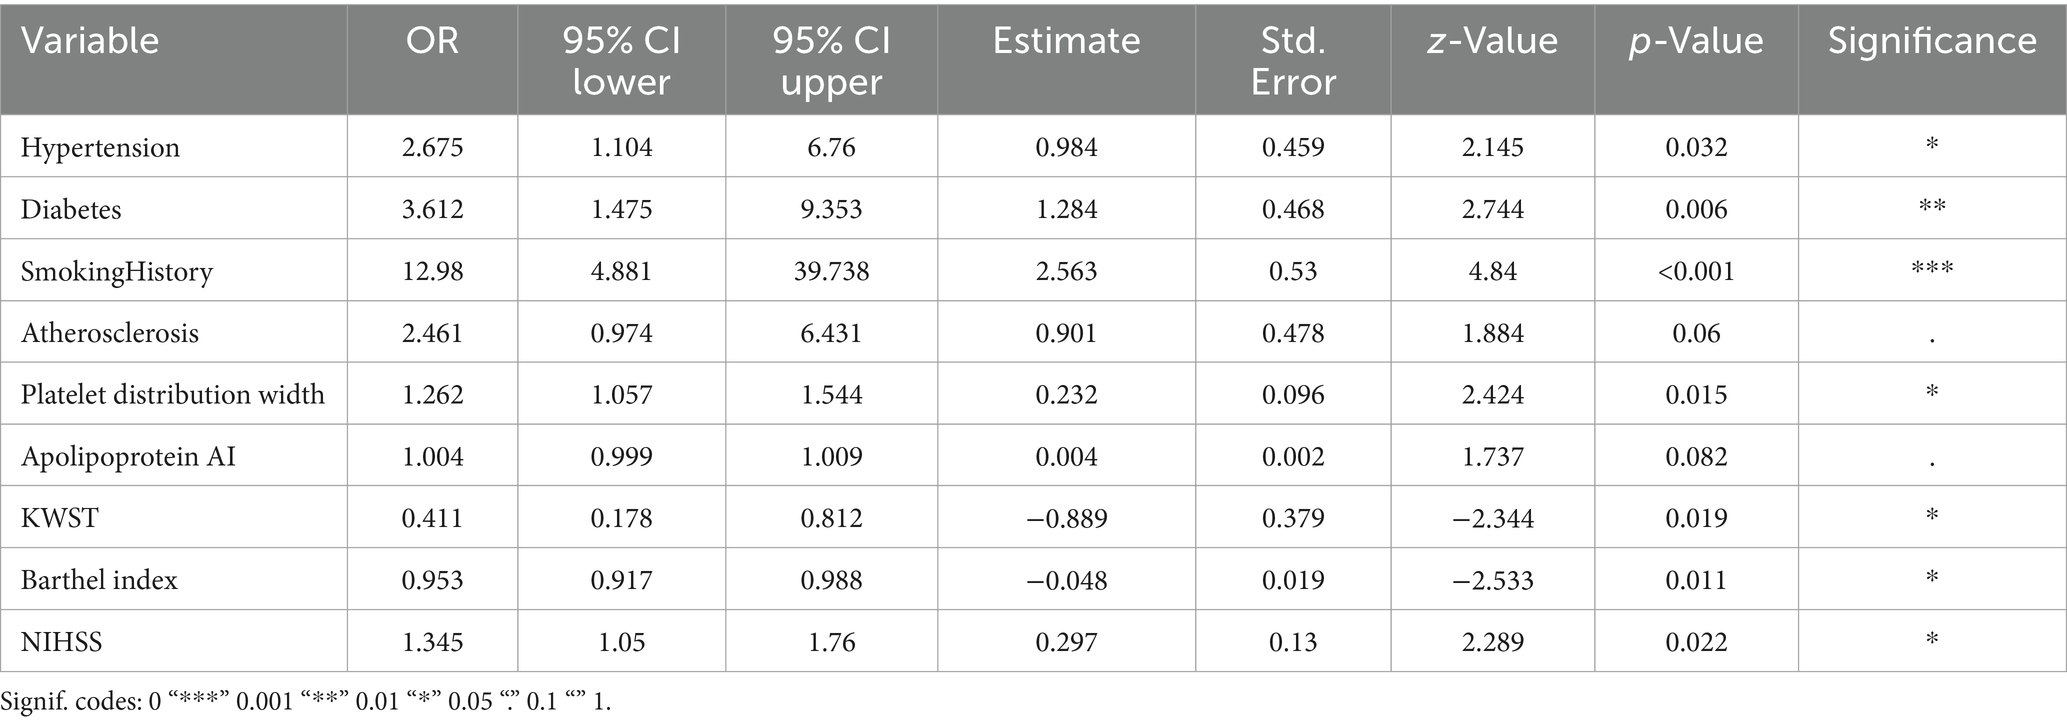
Table 2. Logistic regression analysis results.
After comparative analysis, we have compiled a performance comparison of six machine learning models (Table 3). This clearly presents the performance of each model across various evaluation metrics, providing a straightforward basis for assessing their strengths and weaknesses. These data are valuable for understanding the performance of different models in medical prediction tasks and for guiding future research and clinical practice.
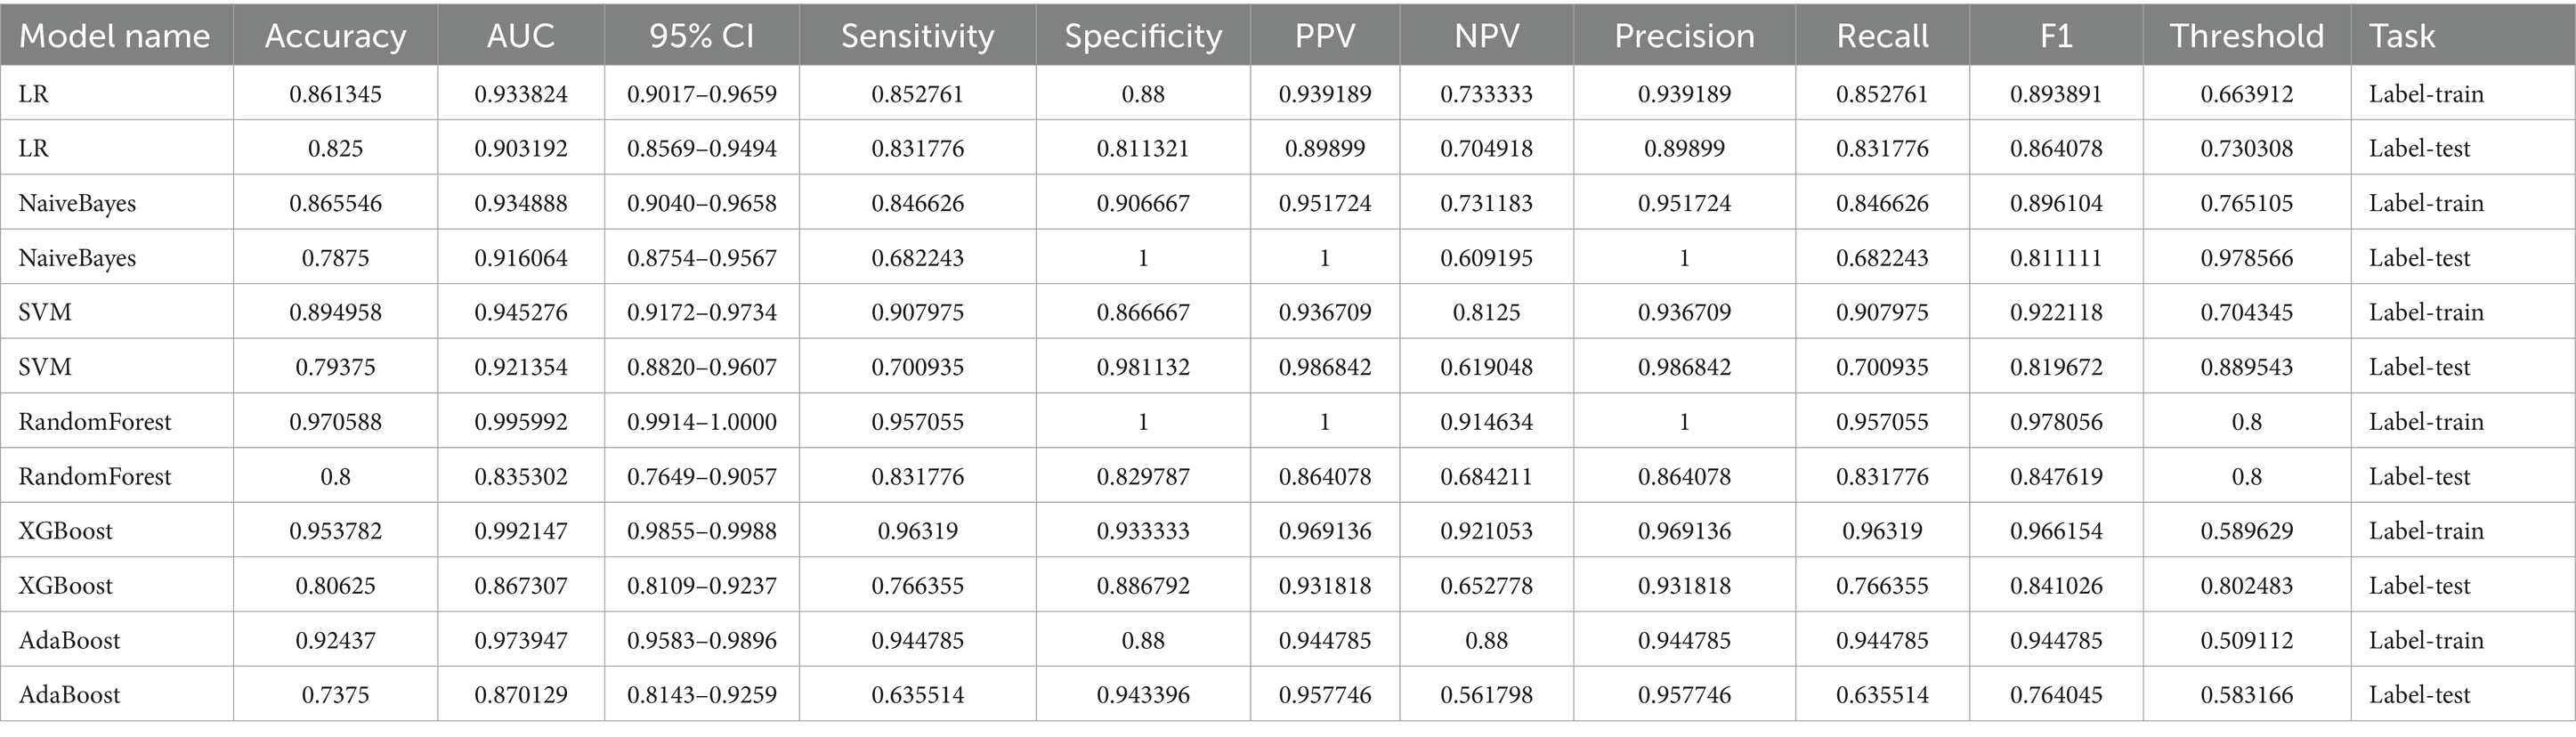
Table 3. Predictive performance of machine learning model in training and validation cohorts.
The nomogram model is an intuitive tool for evaluating the prognostic risk of individual stroke patients, assigning points to various factors based on their impact on the likelihood of a poor outcome. Key predictors such as hypertension, diabetes, and particularly smoking history, are identified as having significant influence, with smoking history being the most impactful. An increased platelet distribution width (PDW) is associated with a higher risk of poor prognosis, and continuous variables like the Watanabe Drinking Test (KWST) score, Barthel Index (BI), and National Institutes of Health Stroke Scale (NIHSS) also contribute positively to the risk assessment, with higher scores indicating a greater risk. The total score on the nomogram, ranging from 260 to 480 points, reflects the overall risk, with higher scores suggesting a higher probability of a poor prognosis. For instance, a score of 380 points might correspond to an approximately 0.8 probability of a poor prognosis, as read from the “Pr (+)” line on the nomogram, where Pr =1 represents a poor prognosis and Pr =0 a good one (Figure 3).
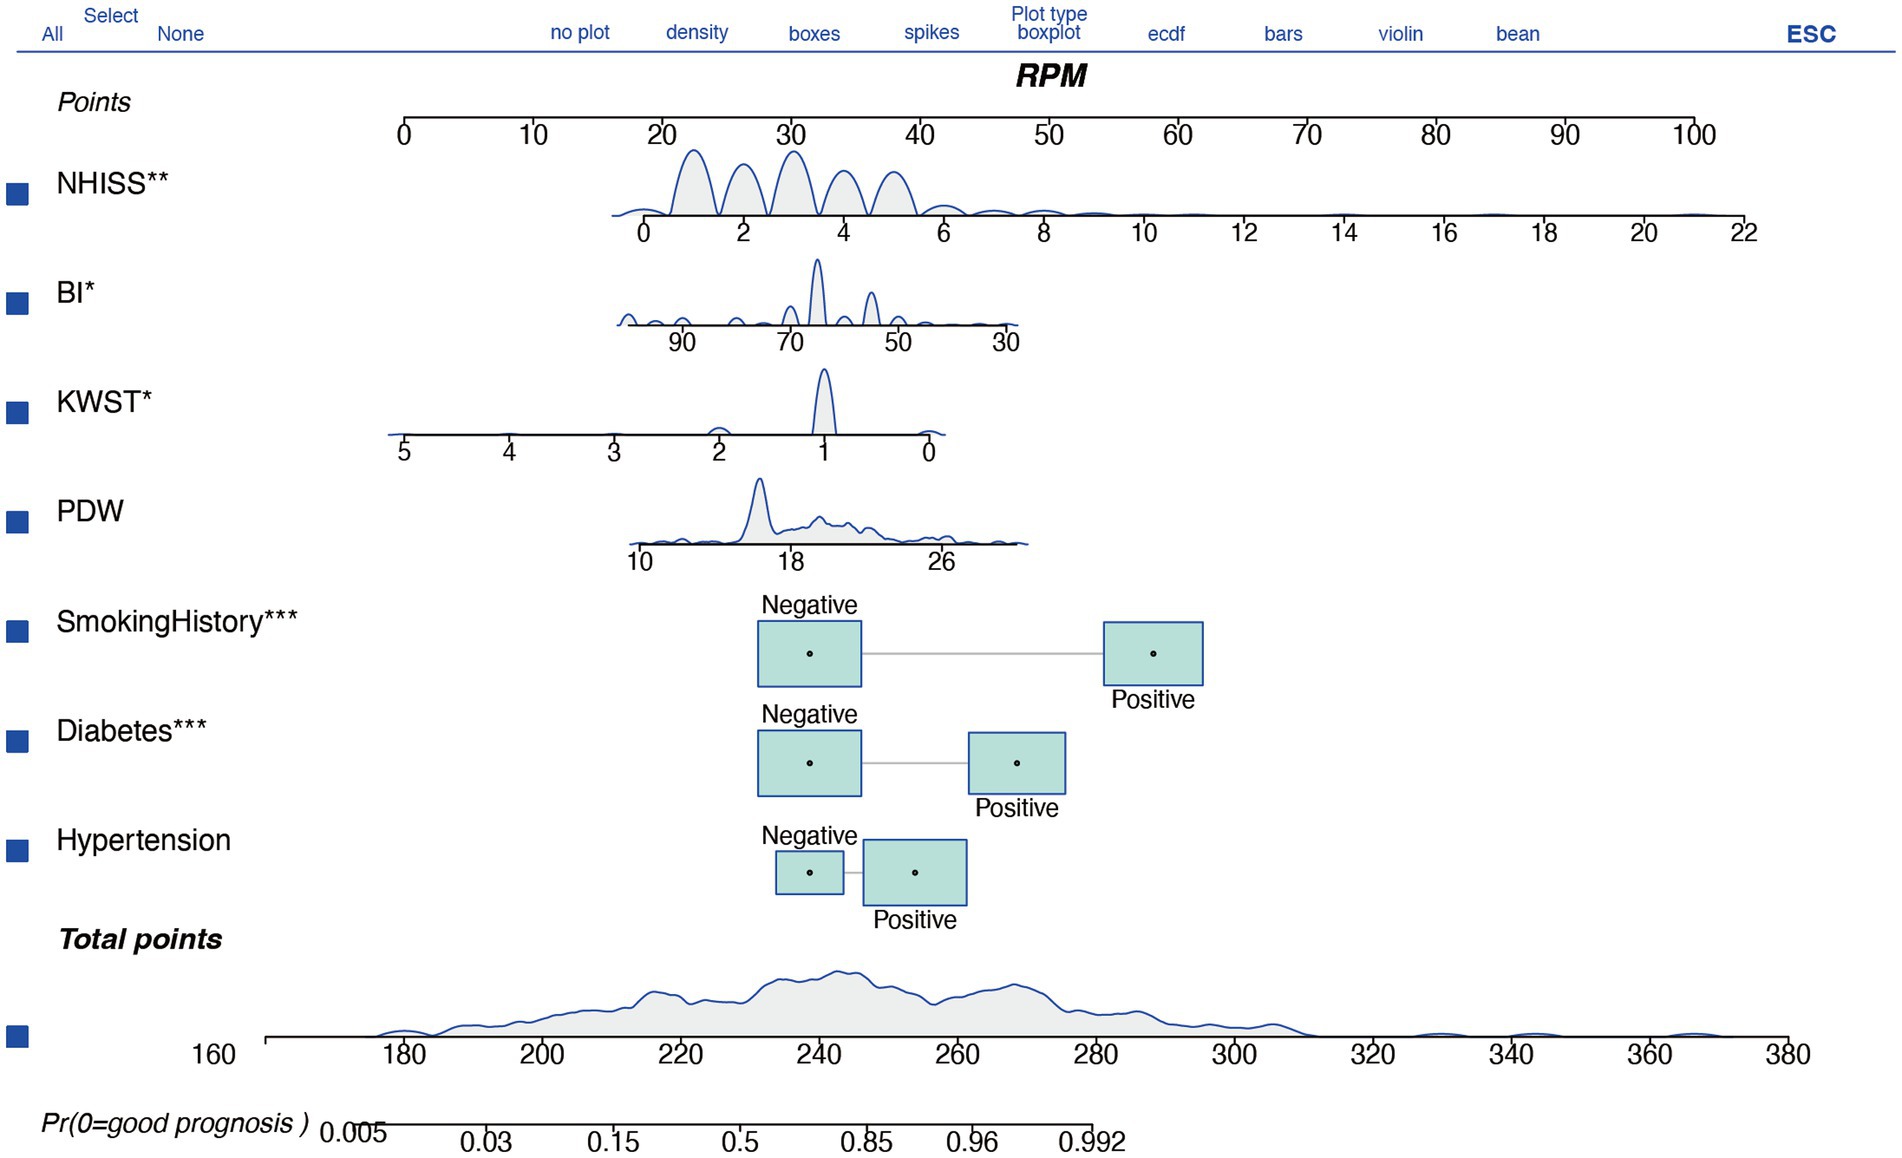
Figure 3. A nomogram based on logistic regression for clinical decision-making.
In our study, we performed a thorough ROC analysis to assess the prognostic accuracy for stroke patients. The training set’s ROC analysis yielded an AUC of 0.929, showcasing the model’s superior ability to differentiate between patients with favorable and unfavorable outcomes (Figure 4A). An AUC approaching 1 indicates exceptional model accuracy, which is crucial for informed clinical decision-making. The validation set’s AUC was 0.893, slightly lower than the training set, yet still indicative of the model’s robust discrimination ability (Figure 4B). This suggests that the model retains high predictive accuracy on new, unseen data, highlighting its strong generalization potential.
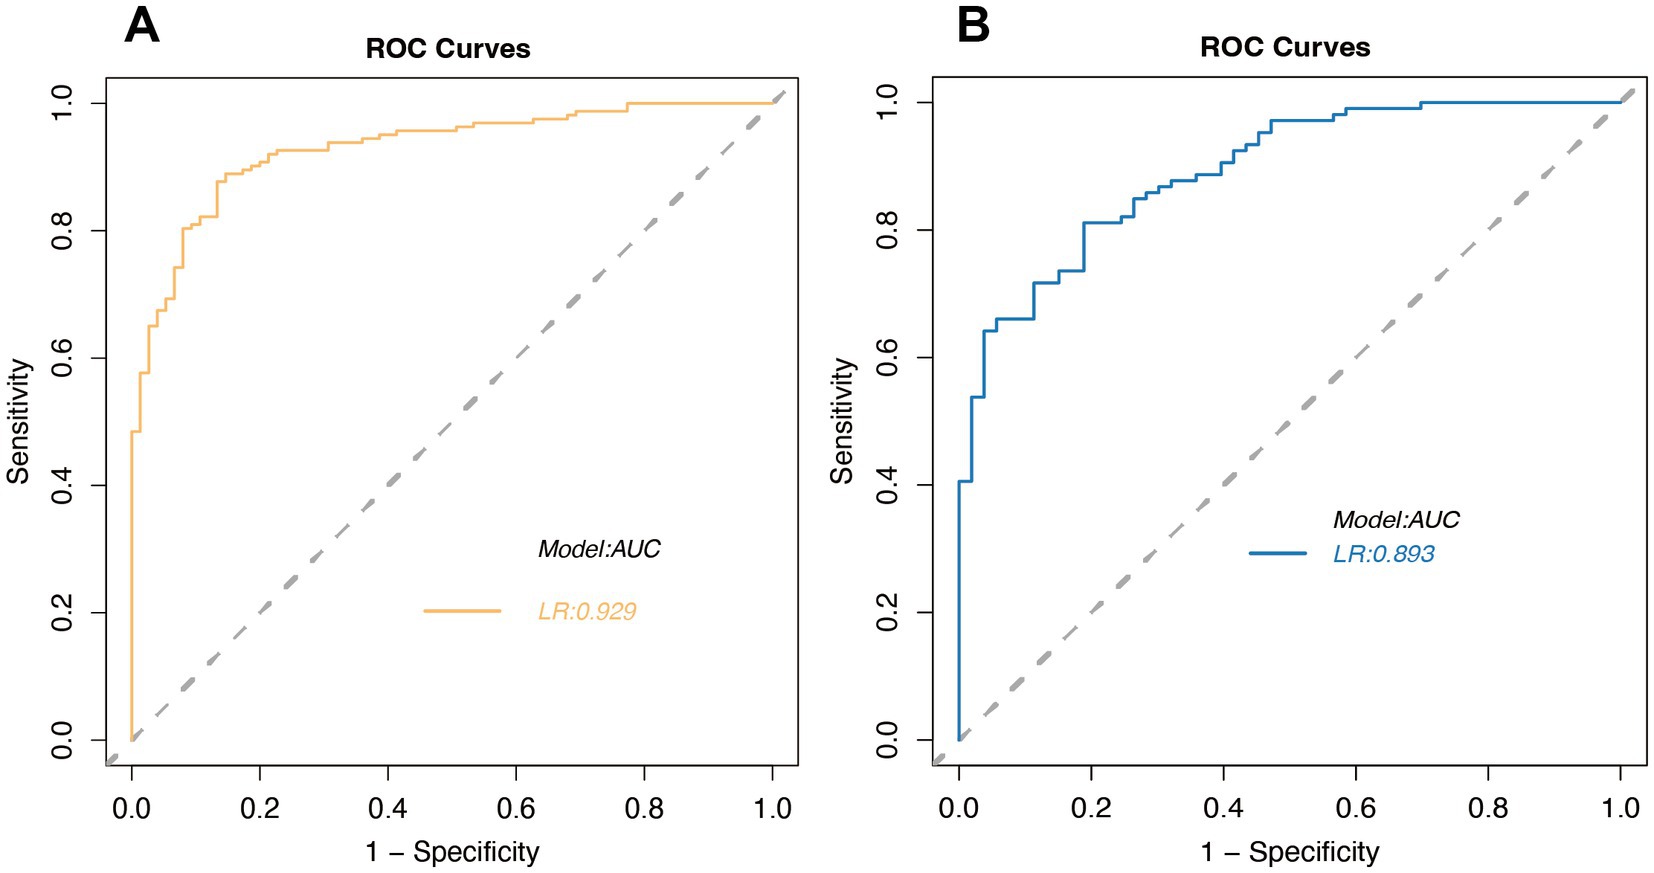
Figure 4. Receiver Operating Characteristic (ROC) curves for logistic regression in the training set (A) and validation set (B).
In our study, we rigorously evaluated the predictive accuracy of our model by comparing the predicted probabilities against actual outcomes using calibration curve analysis. The calibration curve for the training set closely aligned with the diagonal line, signifying a high level of concordance between the model’s predictions and the actual survival probabilities (Figure 5A). This alignment, coupled with a mean absolute error (MAE) of 0.013, underscored the model’s exceptional predictive precision. To bolster the model’s reliability, we subjected it to 1,000 bootstrap repetitions for refinement, thereby further enhancing the stability and accuracy of its predictions. For the validation set, the calibration curve closely adhered to the diagonal line, indicating that the model preserved predictive consistency when applied to new data. The mean absolute error (MAE) for the validation set was 0.024, which, while slightly higher than that of the training set, remained within an acceptable range (Figure 5B). This suggests that the model retains high predictive accuracy on unseen data, a crucial measure of its generalization capability. To address any potential bias, multiple bootstrap repetitions were employed, further solidifying the robustness of the model’s predictive performance. Synthesizing the analysis from both the training and validation sets, our model exhibited commendable predictive accuracy and stability across both, reinforcing its reliability in practical application.
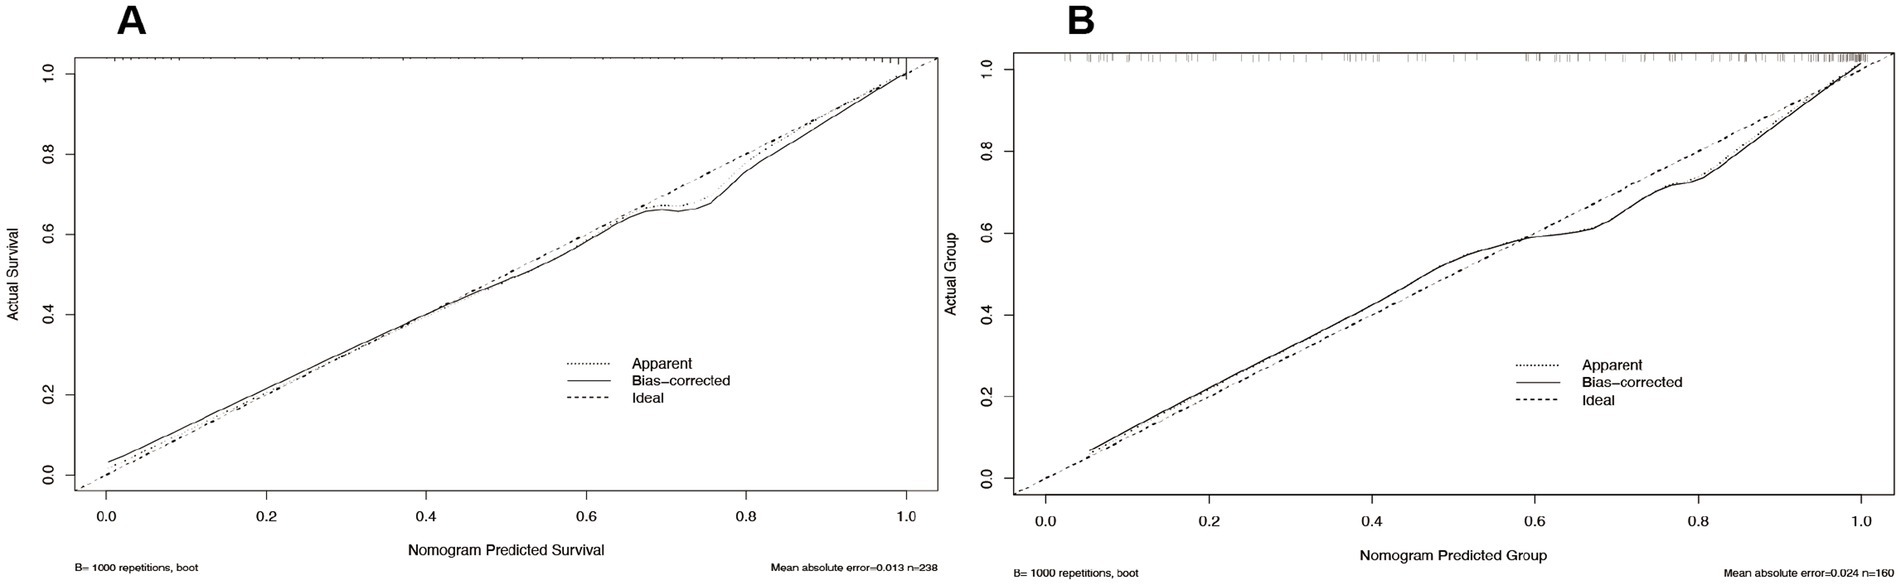
Figure 5. Calibration curves for logistic regression: training set (A) and validation set (B).
In this study, we employed Decision Curve Analysis (DCA) to evaluate the clinical utility of our machine learning model in predicting cerebral infarction. DCA is a method used to assess the clinical benefit of predictive models by comparing the net benefit between model predictions and actual clinical decisions, thereby helping to determine the clinical value of the model at different risk thresholds. The net benefit reflects the relative advantage of using the model for decision-making compared to not using it at a specific risk threshold. In the training set, the decision curve analysis revealed that the net benefit of using the model surpassed that of not using it at a risk threshold of approximately 0.2, with further increases in net benefit as the threshold rose. This indicates that the model provides greater benefits for clinical decision-making at higher risk thresholds. Non-parametric statistical validation using the Mann–Whitney U test confirmed that the decision curve for the training set was significantly different from the “no model” approach at risk thresholds above 0.2 (p < 0.05), further substantiating the model’s clinical superiority at these thresholds.
In the validation set, the decision curve mirrored the results of the training set, demonstrating the model’s robust generalization ability and significant deviation from the “no model” strategy at risk thresholds above 0.2 (p < 0.05). This consistency indicates that the model can provide reliable clinical benefits on independent datasets. Combining the analyses of both the training and validation sets, DCA further confirmed the model’s clinical utility across various risk thresholds, with the net benefit of the model significantly exceeding that of the “no model” strategy at thresholds above 0.2 (p < 0.05). These results suggest that our machine learning model not only achieves high accuracy in predicting cerebral infarction but also provides valuable decision support for clinicians in real-world applications, thereby improving patient outcomes. In conclusion, the DCA findings emphasize the significant clinical value of our machine learning model in predicting cerebral infarction. The model’s superior net benefit above a specific risk threshold indicates its important potential for application in clinical decision-making processes (Figure 6).
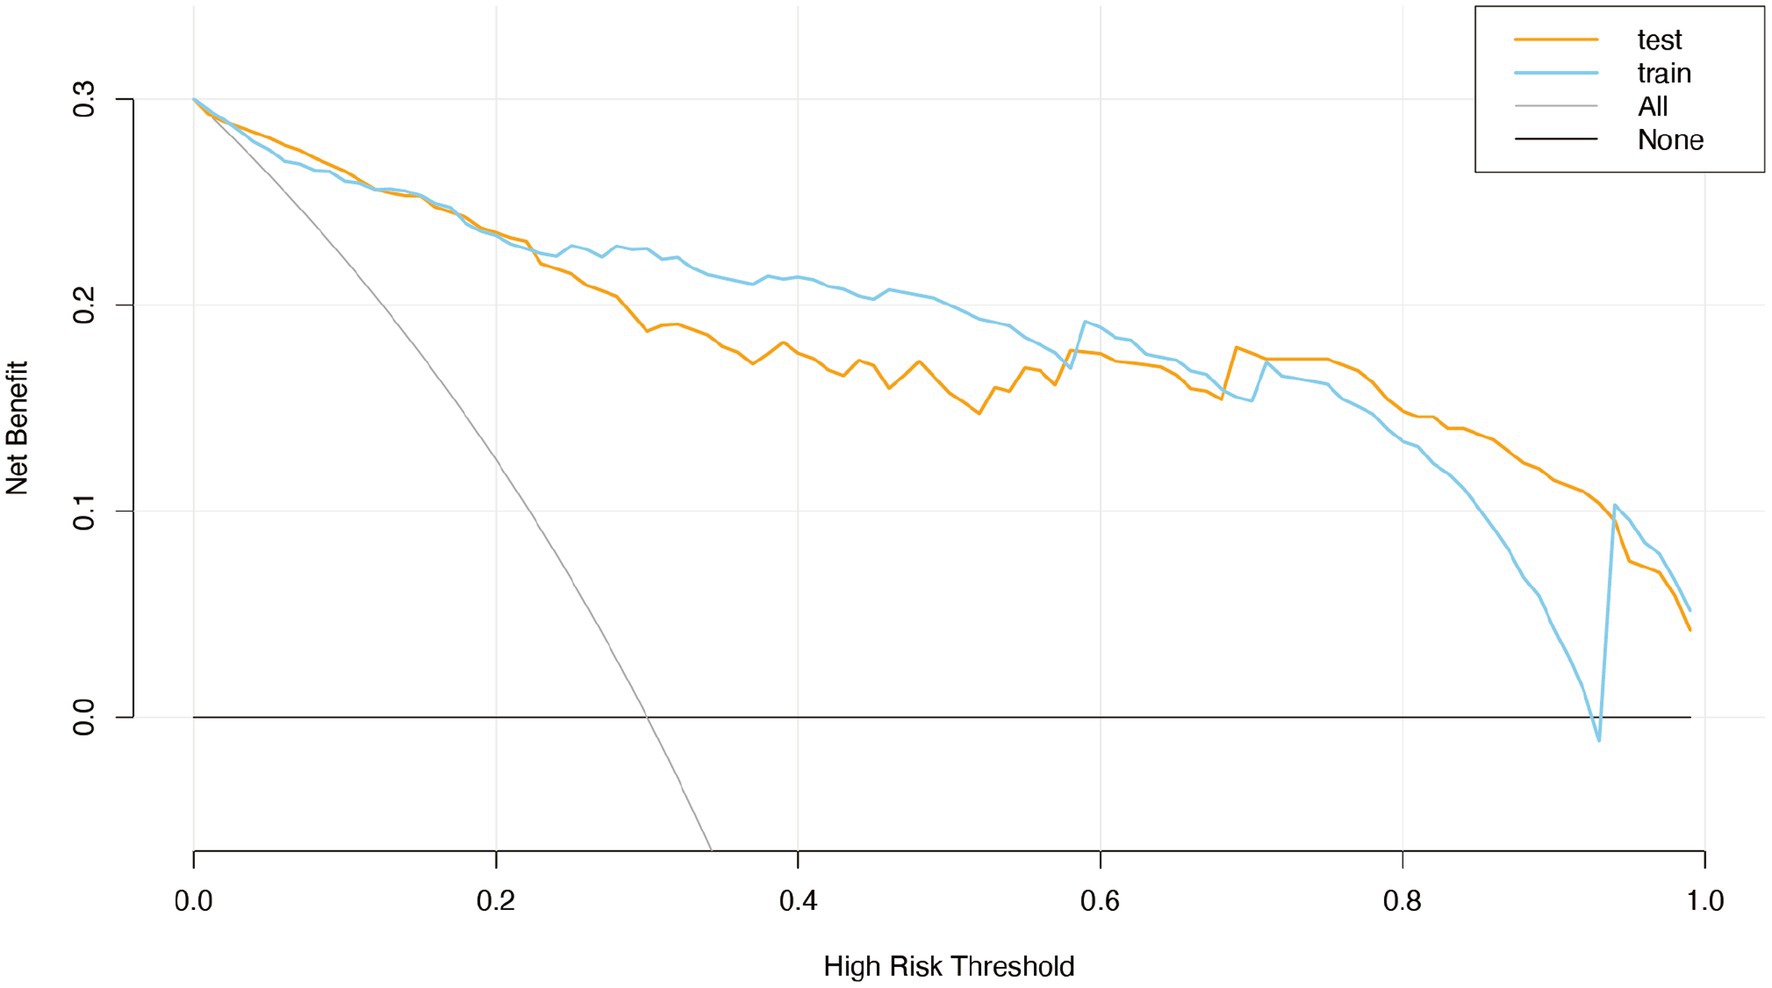
Figure 6. The clinical decision curve (DCA) of the logistic regression model for the training set and the validation set.
SHAP condensed waterfall plots visually depict feature contributions to machine learning predictions. Arrows represent each feature’s effect, with longer arrows indicating greater influence. Red arrows signify positive impacts on predictions, while blue ones denote negative impacts. Starting from the average predicted value, arrows illustrate feature-induced changes to the initial forecast. The final prediction is the aggregate of these changes. In our SVM model analysis, SHAP plots highlighted NIHSS, PDW, and BI as the most influential predictors for stroke prognosis, with higher SHAP values than other variables. Despite being less impactful, factors like hypertension, KWST, diabetes, and smoking history also played a role. This emphasizes the significance of monitoring NIHSS, PDW, and BI for accurate stroke prognosis assessments (Figure 7A).
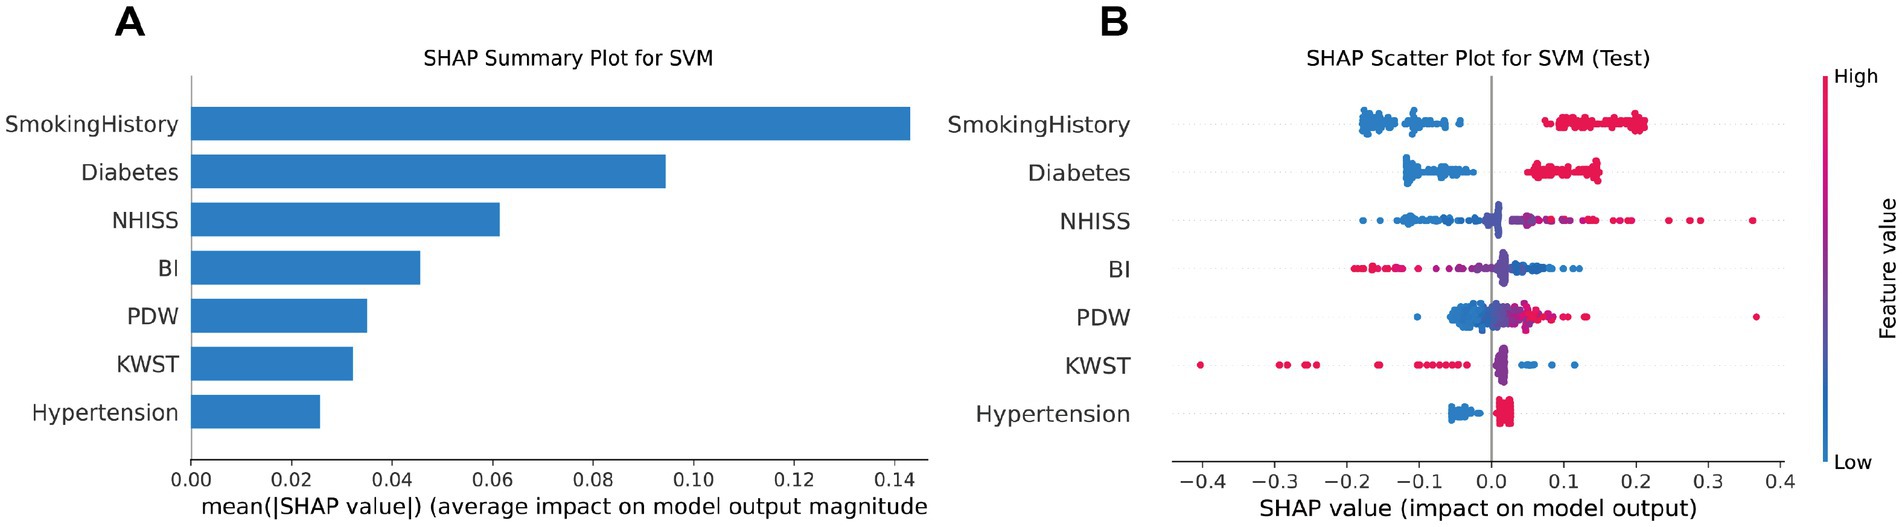
Figure 7. SVM model SHAP value summary plot (A), and SVM model SHAP value scatter plot (B).
The SHAP scatter plot uses arrows to show the effect of each feature on model predictions. Longer arrows indicate a greater impact, with red arrows pointing to an increase and blue arrows to a decrease in predicted probabilities. The plot starts from the average prediction, and the arrows show how each feature modifies this baseline. The SHAP scatter plot for our SVM model highlights that NIHSS, PDW, and BI are the most influential features in predicting stroke prognosis, with higher SHAP values than other variables. Despite being less impactful, factors like hypertension, KWST, diabetes, and smoking history also play a role. This emphasizes the significance of monitoring NIHSS, PDW, and BI for accurate stroke prognosis (Figure 7B).
SHAP analysis highlights the key clinical factors influencing stroke risk. Diabetes and smoking history show significant SHAP value changes, indicating their crucial roles. PDW and KWST also have notable impacts. BI’s interaction with smoking history suggests a complex link between smoking and functional impairment. These insights can inform clinical prevention strategies for stroke (Supplementary Figure S3).
By juxtaposing the SHAP condensed waterfall plots of these two patients, we can visually discern the disparate impacts of various features on their respective stroke predictions. This visual comparison elucidates how the model incorporates different features to make predictions and identifies which features are pivotal in determining the risk of stroke. Patient NO.45 has a 51% probability of poor prognosis (Figure 8).

Figure 8. SHAP force plot showing feature contributions.
In model selection, we prioritized AUC values and model interpretability. The SVM and LR models were selected for their high AUC stability and generalizability across datasets. These models also provided clearer interpretability, vital for deciphering prediction logic and aiding clinical decisions. Our LR model, with a nomogram and SHAP, offered a visual prognostic tool for acute cerebral infarction, achieving AUCs of 0.934 and 0.903 in training and validation sets, respectively. The SVM model excelled with AUCs of 0.935 and 0.916, underscoring its predictive strength in stroke prognosis. These outcomes affirm the models’ practicality in medical prognosis and set a basis for further analysis.
Logistic regression is a foundational classification algorithm in the machine learning repertoire, renowned for its capacity to map a linear combination of input features to a probability space via the Sigmoid function, which is instrumental in binary classification predictions (20). This model harnesses maximum likelihood estimation and gradient descent algorithms to optimize its parameters, effectively minimizing the log loss function. In the medical field, logistic regression plays a pivotal role in disease diagnosis, risk assessment, and prognosis judgment (21). It excels in the domain of disease prognosis by screening feature variables related to prognosis, constructing predictive models, and translating these models into nomograms—a visual tool that intuitively conveys the impact of different prognostic factors on outcomes, thereby providing statistical support for clinical decision-making.
Logistic regression, as a linear model, performs well in handling simple relationships but has significant limitations when dealing with complex nonlinear relationships. For example, it assumes a linear relationship between features and the target variable, which may prevent it from capturing complex interactions among features in clinical data (22). Additionally, logistic regression requires high linear independence among features; when multicollinearity is present, the stability and interpretability of the model can be compromised (23). In medical predictive modeling, these limitations of logistic regression may lead to insufficient predictive performance, especially in high-dimensional data environments.
Our model, echoing the robustness of other studies, demonstrates significant performance. It aligns with Zou’s research, where a logistic regression model predicted the prognosis of children post-transthoracic balloon pulmonary valvuloplasty with AUC values ranging from 0.723 to 0.870, indicating a reasonable predictive efficacy (24). In Wang’s study, a nomogram constructed using LASSO regression and logistic regression algorithms showcased high discriminative ability with AUC values up to 0.919 across multiple independent cohorts, demonstrating good calibration and clinical utility in predicting patients’ long-term postoperative recovery outcomes (25). Zhu’s prospective cohort study identified serum secretoneurin levels as an independent predictor of poor prognosis after intracerebral hemorrhage, with the developed multivariate logistic regression model and nomogram showing high accuracy in predicting poor outcomes for ICH patients after 90 days, with AUC values of 0.930 and 0.913, respectively (26).
The logistic regression model confirms its significant application in predicting cerebral infarction, paralleling the efficacy of models that achieved AUC values of 0.778 in training and 0.733 in validation for early ischemic neurological deterioration (27). In the challenging diagnosis and treatment of moyamoya disease, our model, akin to those in Sun’s study, excelled with AUC values as high as 0.891, 0.849, and 0.911 across different datasets, showcasing good calibration (28). Another study analyzed data from 243 moyamoya disease patients who underwent superficial temporal artery to middle cerebral artery (STA-MCA) bypass surgery, generating a nomogram through multivariate logistic regression analysis to predict good postoperative collateral circulation formation (PCF) after STA-MCA bypass surgery, with a concordance index (C index) of 0.88, exhibiting excellent calibration curves and good clinical application value (29).
Our model’s performance is commendable, offering insights and predictions that are on par with these precedents, further solidifying the utility of logistic regression in medical prognostication and decision support.
Support Vector Machine (SVM) is a premier algorithm in the realm of supervised learning, celebrated for its prowess in identifying the most discriminative hyperplane that separates classes within high-dimensional spaces (30). Its strength in binary classification has positioned SVM as a go-to tool in medical applications, where it excels in image recognition, disease prediction, and bioinformatics due to its precision and robust generalization (31).
In the medical imaging domain, SVM has demonstrated its mettle by achieving a 67% accuracy rate in analyzing resting-state functional MRI data of patients with Tourette’s syndrome, with particular acumen in identifying key neural network traits (32). Its diagnostic utility extends to distinguishing Tourette’s Disorder patients from healthy controls based on brain functional connectivity and in assessing the impact of therapeutic interventions (33). In predictive analytics, SVM has been effectively leveraged to forecast the risk of mild cognitive impairment progressing to Alzheimer’s disease and to predict the recurrence of breast cancer post-treatment. Within bioinformatics, SVM has shown high accuracy and specificity in identifying NLRP3 inhibitors, underscoring its potential in drug discovery (34). In cerebrovascular disease research, SVM has been instrumental in identifying immune-related genes associated with ischemic stroke, marking a significant advancement in early diagnosis and treatment strategies (35).
Our implementation of the SVM model in predicting stroke patient outcomes has been nothing short of exemplary. The model achieved an impressive 89.5% accuracy on the training set, with an AUC of 0.9453, reflecting its strong predictive capabilities. On the test set, despite a modest dip to 79.4% accuracy, the AUC remained high at 0.9213, indicating the model’s ability to generalize well to new data. SHAP value analysis further validated the significance of hypertension and smoking history as pivotal risk factors, providing actionable insights that can inform clinical decision-making processes.
Of course, there are some limitations of the SVM, SVM is a powerful classification model, particularly effective in handling high-dimensional data, but its “black-box” nature limits model interpretability, which is a critical issue in medical applications. SVM has high requirements for data preprocessing, especially with low tolerance for outliers, which can compromise model robustness (36). Moreover, the training process of SVM is computationally intensive, especially with large-scale datasets, limiting its application in real-time prediction scenarios (37). In medical prediction, these limitations may affect the clinical applicability of the model, especially in scenarios requiring rapid decision-making.
Diabetes is a significant independent risk factor for stroke, increasing the risk by 2–4 times and adversely affecting patient prognosis (38, 39). Proper diabetes management is crucial for reducing stroke incidence and improving outcomes. Our study supports the importance of active diabetes management in preventing ischemic stroke and enhancing patient prognosis.
Hypertension is a critical risk factor for stroke, with higher blood pressure levels increasing stroke risk and negatively impacting patient prognosis (40, 41). Antihypertensive treatment, especially when systolic pressure is over 140 mmHg, is effective in reducing stroke risk, likely due to its role in preventing vascular remodeling and atherosclerosis (42). Our study confirms that hypertensive stroke patients with poorly controlled blood pressure have worse outcomes, underscoring the need for active blood pressure management to decrease stroke risk.
Smoking is a significant independent risk factor for stroke, increasing the relative risk by 1.88 times compared to non-smokers, with risk escalating with smoking quantity (43). Quitting or reducing smoking significantly lowers stroke risk, and our study underscores the importance of smoking cessation for better stroke prognosis.
Platelet Distribution Width (PDW), a measure of the variability in platelet size within the bloodstream, has been implicated in the prognosis of cerebral infarction. Studies suggest a potential link between elevated PDW levels and adverse outcomes in patients with cerebral infarction. Shen’s research indicated that higher PDW levels correlate with poorer patient prognoses (44), possibly because increased PDW signifies heightened platelet metabolic activity, which could impede vascular recanalization and exacerbate post-stroke prognosis. A systematic review and meta-analysis further supports the predictive value of PDW and Mean Platelet Volume (MPV) in determining clinical outcomes for patients with acute ischemic stroke (2). These insights propose that PDW could be a valuable biomarker for the prognosis of cerebral infarction. Our study aligns with this notion, revealing that increased PDW levels are associated with severe stroke outcomes. In conclusion, PDW, as an indicator of platelet activity, may be correlated with the prognosis of cerebral infarction, although further research is needed to elucidate its precise mechanisms and clinical utility.
The National Institutes of Health Stroke Scale (NIHSS) score, Barthel Index (BI), and Watanabe Drinking Test (KWST) are essential tools for assessing stroke patients’ neurological function, daily living capabilities, and swallowing function, respectively. The NIHSS score is a key indicator of stroke severity, with higher scores reflecting greater neurological deficits and potentially poorer prognoses (45). The BI evaluates a patient’s capacity for activities of daily living, with lower scores indicating a poorer prognosis, higher mortality risk, and increased dependency in stroke patients (46). The KWST predicts stroke prognosis, closely with the severity of post-stroke dysphagia and well-correlated with both daily living activities and neurological deficits (47). Our study finds that patients with higher NIHSS scores, lower BI scores, and higher KWST scores are more likely to have worse outcomes. These assessments enable physicians to gain a comprehensive understanding of the conditions and prognoses of patients with cerebral infarction.
Our study, while providing significant findings, has several limitations that warrant acknowledgment. First, the modest sample size and incomplete data for certain critical variables, such as C-reactive protein (C-RP) and B-type natriuretic peptide (BNP), may affect the robustness of our results. Second, despite an adequate model fit, the potential for multicollinearity among variables poses a risk of overfitting. Third, the study’s concentration on an Asian population restricts the generalizability of our findings to other ethnic groups. Additionally, the lack of multicenter external validation is a notable limitation, which we intend to address by broadening our participant base and integrating prospective data collection. Although the LR model demonstrated strong performance, the dip in accuracy and recall rate on the test set indicates a need for further enhancement in model generalization to new datasets. The reduced sensitivity on the test set may also suggest difficulties in identifying certain cases in practical applications. Future work will focus on refining the model and conducting more extensive studies to address these limitations and to strengthen the model’s predictive accuracy and clinical applicability.
We leveraged SHAP to elucidate the SVM model’s predictions and harnessed a nomogram to render the LR model’s outcomes more comprehensible. These machine learning methodologies, both interpretable and visually accessible, excelled in forecasting the prognostic risk factors for patients afflicted with acute cerebral infarction. Moreover, they offered substantial clinical utility by reinforcing medical decision-making and facilitating the communication of prognoses to patients, thereby bridging the gap between complex analytics and practical application in healthcare. We will refine these models for easier clinical application and validate their generalizability through extensive multicenter studies. We also aim to incorporate more interpretable ML techniques to improve model transparency and clinical relevance, offering tailored treatment strategies for stroke patients.
The raw data supporting the conclusions of this article will be made available by the authors, without undue reservation.
The studies involving humans were approved by Xi’an Central Hospital Ethics Committee, Tongchuan Mining Bureau Central Hospital Ethics Committee. The studies were conducted in accordance with the local legislation and institutional requirements. The ethics committee/institutional review board waived the requirement of written informed consent for participation from the participants or the participants’ legal guardians/next of kin because retrospective observational study, we waived the informed consent from patients.
KG: Formal analysis, Methodology, Software, Visualization, Writing – original draft, Writing – review & editing. BZ: Data curation, Investigation, Validation, Writing – review & editing. LZ: Data curation, Investigation, Writing – review & editing. YS: Data curation, Resources, Writing – review & editing. NG: Conceptualization, Funding acquisition, Methodology, Project administration, Resources, Writing – review & editing. KC: Data curation, Project administration, Supervision, Writing – review & editing. ZL: Conceptualization, Formal analysis, Supervision, Writing – review & editing.
The author(s) declare that financial support was received for the research, authorship, and/or publication of this article. This project was funded by the Xi’an Science and Technology Plan Project (project code: 2023YXYJ0036) and the Shaanxi Province Science and Technology Plan Project (2022SF-418).
The authors express their sincere gratitude to all participants involved in this study.
The authors declare that the research was conducted in the absence of any commercial or financial relationships that could be construed as a potential conflict of interest.
The authors declare that no Gen AI was used in the creation of this manuscript.
All claims expressed in this article are solely those of the authors and do not necessarily represent those of their affiliated organizations, or those of the publisher, the editors and the reviewers. Any product that may be evaluated in this article, or claim that may be made by its manufacturer, is not guaranteed or endorsed by the publisher.
The Supplementary material for this article can be found online at: https://www.frontiersin.org/articles/10.3389/fneur.2025.1522868/full#supplementary-material
SUPPLEMENTARY FIGURE 1 | Univariate ROC Curve Area Under the Curve (AUC) Feature Ranking Plot (A) AUC Value Feature Ranking Plot (B).
SUPPLEMENTARY FIGURE 2 | Clinical Factors Correlation Heatmap.
1. Fan, J, Li, X, Yu, X, Liu, Z, Jiang, Y, Fang, Y, et al. Global burden, risk factor analysis, and prediction study of ischemic stroke, 1990-2030. Neurology. (2023) 101:e137–50. doi: 10.1212/WNL.0000000000207387
2. Donkor, ES. Stroke in the 21(st) century: a snapshot of the burden, epidemiology, and quality of life. Stroke Res Treat. (2018) 2018:3238165. doi: 10.1155/2018/3238165
3. Campbell, BCV, De Silva, DA, Macleod, MR, Coutts, SB, Schwamm, LH, Davis, SM, et al. Ischaemic stroke. Nat Rev Dis Primers. (2019) 5:70. doi: 10.1038/s41572-019-0118-8
4. Feigin, VL, Stark, BA, Johnson, CO, Roth, GA, Bisignano, C, Abady, GG, et al. Global, regional, and national burden of stroke and its risk factors, 1990-2019: a systematic analysis for the global burden of disease study 2019. Lancet Neurol. (2021) 20:795–820. doi: 10.1016/S1474-4422(21)00252-0
5. Mead, GE, Sposato, LA, Sampaio Silva, G, Yperzeele, L, Wu, S, Kutlubaev, M, et al. A systematic review and synthesis of global stroke guidelines on behalf of the world stroke organization. Int J Stroke. (2023) 18:499–531. doi: 10.1177/17474930231156753
6. Joundi, RA, Adekanye, J, Leung, AA, Ronksley, P, Smith, EE, Rebchuk, AD, et al. Health state utility values in people with stroke: a systematic review and meta-analysis. J Am Heart Assoc. (2022) 11:e024296. doi: 10.1161/JAHA.121.024296
7. Mainali, S, Darsie, ME, and Smetana, KS. Machine learning in action: stroke diagnosis and outcome prediction. Front Neurol. (2021) 12:734345. doi: 10.3389/fneur.2021.734345
8. Varoquaux, G, and Cheplygina, V. Machine learning for medical imaging: methodological failures and recommendations for the future. NPJ Digit Med. (2022) 5:48. doi: 10.1038/s41746-022-00592-y
9. Fernandez-Lozano, C, Hervella, P, Mato-Abad, V, Rodriguez-Yanez, M, Suarez-Garaboa, S, Lopez-Dequidt, I, et al. Random forest-based prediction of stroke outcome. Sci Rep. (2021) 11:10071. doi: 10.1038/s41598-021-89434-7
10. Wang, K, Hong, T, Liu, W, Xu, C, Yin, C, Liu, H, et al. Development and validation of a machine learning-based prognostic risk stratification model for acute ischemic stroke. Sci Rep. (2023) 13:13782. doi: 10.1038/s41598-023-40411-2
11. Abujaber, AA, Alkhawaldeh, IM, Imam, Y, Nashwan, AJ, Akhtar, N, Own, A, et al. Predicting 90-day prognosis for patients with stroke: a machine learning approach. Front Neurol. (2023) 14:1270767. doi: 10.3389/fneur.2023.1270767
12. Ghassemi, M, Naumann, T, Schulam, P, Beam, AL, Chen, IY, and Ranganath, R. A review of challenges and opportunities in machine learning for health. AMIA Jt Summits Transl Sci Proc. (2020) 2020:191–200.
13. Bathla, G, Ajmera, P, Mehta, PM, Benson, JC, Derdeyn, CP, Lanzino, G, et al. Advances in acute ischemic stroke treatment: current status and future directions. AJNR Am J Neuroradiol. (2023) 44:750–8. doi: 10.3174/ajnr.A7872
14. Khedr, EM, Abdelwarith, A, Moussa, G, and Saber, M. Recombinant tissue plasminogen activator (rTPA) management for first onset acute ischemic stroke with covid-19 and non-covid-19 patients. J Stroke Cerebrovasc Dis. (2023) 32:107031. doi: 10.1016/j.jstrokecerebrovasdis.2023.107031
15. Chen, Y, Li, Y, Liu, M, Xu, W, Tong, S, and Liu, K. Association between systemic immunity-inflammation index and hypertension in US adults from NHANES 1999-2018. Sci Rep. (2024) 14:5677. doi: 10.1038/s41598-024-56387-6
16. Zhang, YX, Shen, ZY, Jia, YC, Guo, X, Guo, XS, Xing, Y, et al. The Association of the Neutrophil-to-Lymphocyte Ratio, platelet-to-lymphocyte ratio, lymphocyte-to-monocyte ratio and systemic inflammation response index with short-term functional outcome in patients with acute ischemic stroke. J Inflamm Res. (2023) 16:3619–30. doi: 10.2147/JIR.S418106
17. Qin, Q, Yu, H, Zhao, J, Xu, X, Li, Q, Gu, W, et al. Machine learning-based derivation and validation of three immune phenotypes for risk stratification and prognosis in community-acquired pneumonia: a retrospective cohort study. Front Immunol. (2024) 15:1441838. doi: 10.3389/fimmu.2024.1441838
18. Si, Y, Chen, Q, Xiong, X, and Zheng, M. The association of inflammatory biomarkers with clinical outcomes in diabetic retinopathy participants: data from NHANES 2009-2018. Diabetol Metab Syndr. (2024) 16:181. doi: 10.1186/s13098-024-01419-4
19. Li, W, Li, M, Wang, T, Ma, G, Deng, Y, Pu, D, et al. Controlling nutritional status (CONUT) score is a prognostic factor in patients with resected breast cancer. Sci Rep. (2020) 10:6633. doi: 10.1038/s41598-020-63610-7
20. Peduzzi, P, Concato, J, Kemper, E, Holford, TR, and Feinstein, AR. A simulation study of the number of events per variable in logistic regression analysis. J Clin Epidemiol. (1996) 49:1373–9. doi: 10.1016/S0895-4356(96)00236-3
21. Tolles, J, and Meurer, WJ. Logistic regression: relating patient characteristics to outcomes. JAMA. (2016) 316:533–4. doi: 10.1001/jama.2016.7653
22. Kakani, K, and Radhika, TSL. Nonparametric and nonlinear approaches for medical data analysis. Int J Data Sci Anal. (2024). doi: 10.1007/s41060-024-00680-0
23. Dey, D, Haque, MS, Islam, MM, Aishi, UI, Shammy, SS, Mayen, MSA, et al. The proper application of logistic regression model in complex survey data: a systematic review. BMC Med Res Methodol. (2025) 25:15. doi: 10.1186/s12874-024-02454-5
24. Zou, M, Dong, S, Liu, S, Du, C, Sun, Y, Dong, J, et al. Influencing factors of prognosis in children with pulmonary atresia with intact ventricle septum after transthoracic balloon dilation of pulmonary valve and construction of a nomograph prediction model. Biotechnol Genet Eng Rev. (2024) 40:4328–40. doi: 10.1080/02648725.2023.2210448
25. Wang, H, Xu, C, Xiao, Y, Shen, P, Guo, S, Shang, Y, et al. A dynamic nomogram for predict individual risk of malignant brain edema after endovascular thrombectomy in acute ischemic stroke. Sci Rep. (2024) 14:9529. doi: 10.1038/s41598-024-60083-w
26. Zhu, X, Shan, H, Wang, Z, Wang, Y, Yan, T, Chen, Z, et al. Serum secretoneurin as a promising biomarker for predicting poor prognosis in intracerebral hemorrhage: a prospective cohort study. Neurosurg Rev. (2024) 47:320. doi: 10.1007/s10143-024-02566-y
27. Li, N, Li, YL, Shao, JM, Wang, CH, Li, SB, and Jiang, Y. Optimizing early neurological deterioration prediction in acute ischemic stroke patients following intravenous thrombolysis: a LASSO regression model approach. Front Neurosci. (2024) 18:1390117. doi: 10.3389/fnins.2024.1390117
28. Sun, H, Li, Y, Xiao, A, Li, W, Xia, C, You, C, et al. Nomogram to predict good collateral formation after the STA-MCA bypass surgery in adult patients with Moyamoya disease. Stroke. (2023) 54:751–8. doi: 10.1161/STROKEAHA.122.039975
29. Nicolae, O, Pop, DCZ, Pantiș, C, and Mekeres, F. Clinicopathological evaluation of Moyamoya disease. Case report and review of literature. Roman J Milit Med. (2020) 123:102–5. doi: 10.55453/rjmm.2020.123.2.5
30. Cortes, C, and Vapnik, V. Support-vector networks. Mach Learn. (1995) 20:273–97. doi: 10.1007/BF00994018
31. Sun, S, Rappaport, TS, Thomas, TA, Ghosh, A, Nguyen, HC, Kovacs, IZ, et al. Investigation of prediction accuracy, sensitivity, and parameter stability of large-scale propagation path loss models for 5G wireless communications. IEEE Trans Veh Technol. (2016) 65:2843–60. doi: 10.1109/TVT.2016.2543139
32. Zito, GA, Hartmann, A, Beranger, B, Weber, S, Aybek, S, Faouzi, J, et al. Multivariate classification provides a neural signature of Tourette disorder. Psychol Med. (2023) 53:2361–9. doi: 10.1017/S0033291721004232
33. Zhu, Y, Kim, M, Zhu, X, Kaufer, D, and Wu, G Alzheimer’s Disease Neuroimaging Initiative. Long range early diagnosis of Alzheimer’s disease using longitudinal MR imaging data. Med Image Anal. (2021) 67:101825. doi: 10.1016/j.media.2020.101825
34. Zulfat, M, Hakami, MA, Hazazi, A, Mahmood, A, Khalid, A, Alqurashi, RS, et al. Identification of novel NLRP3 inhibitors as therapeutic options for epilepsy by machine learning-based virtual screening, molecular docking and biomolecular simulation studies. Heliyon. (2024) 10:e34410. doi: 10.1016/j.heliyon.2024.e34410
35. Zheng, PF, Chen, LZ, Liu, P, Pan, HW, Fan, WJ, and Liu, ZY. Identification of immune-related key genes in the peripheral blood of ischaemic stroke patients using a weighted gene coexpression network analysis and machine learning. J Transl Med. (2022) 20:361. doi: 10.1186/s12967-022-03562-w
36. Aluvalu, R, Devi, VS, Kumar, CN, Goutham, N, and Nikitha, K. Unveil the black-box model for healthcare explainable AI In: R Aluvalu, M Mehta, and P Siarry, editors. Explainable AI in health informatics. Singapore: Springer Nature Singapore (2024). 49–70.
37. Kumari, A, Akhtar, M, Shah, R, and Tanveer, M. Support matrix machine: a review. Neural Netw. (2025) 181:106767. doi: 10.1016/j.neunet.2024.106767
38. Nayak, SS, Kuriyakose, D, Polisetty, LD, Patil, AA, Ameen, D, Bonu, R, et al. Diagnostic and prognostic value of triglyceride glucose index: a comprehensive evaluation of meta-analysis. Cardiovasc Diabetol. (2024) 23:310. doi: 10.1186/s12933-024-02392-y
39. Tu, WJ, and Wang, LD Special Writing Group of China Stroke Surveillance Report. China stroke surveillance report 2021. Mil Med Res. (2023) 10:33. doi: 10.1186/s40779-023-00463-x
40. Whelton, PK, Carey, RM, Aronow, WS, Casey, DE Jr, Collins, KJ, Dennison Himmelfarb, C, et al. 2017 ACC/AHA/AAPA/ABC/ACPM/AGS/APhA/ASH/ASPC/NMA/PCNA guideline for the prevention, detection, evaluation, and Management of High Blood Pressure in adults: executive summary: a report of the American College of Cardiology/American Heart Association task force on clinical practice guidelines. Hypertension. (2018) 71:1269–324. doi: 10.1161/HYP.0000000000000066
41. Schiffrin, EL, and Fisher, NDL. Diagnosis and management of resistant hypertension. BMJ. (2024) 385:e079108. doi: 10.1136/bmj-2023-079108
42. Ettehad, D, Emdin, CA, Kiran, A, Anderson, SG, Callender, T, Emberson, J, et al. Blood pressure lowering for prevention of cardiovascular disease and death: a systematic review and meta-analysis. Lancet. (2016) 387:957–67. doi: 10.1016/S0140-6736(15)01225-8
43. Bushnell, C, Kernan, WN, Sharrief, AZ, Chaturvedi, S, Cole, JW, Cornwell, WK 3rd, et al. 2024 guideline for the primary prevention of stroke: a guideline from the American Heart Association/American Stroke Association. Stroke. (2024) 55:e344–424. doi: 10.1161/STR.0000000000000475
44. Shen, T, Fan, J, Zheng, Y, Luo, Y, and Liu, P. Potential predictive value of platelet distribution width for functional outcome after ischemic stroke. Mol Neurobiol. (2024). doi: 10.1007/s12035-024-04556-z
45. Hagberg, G, Ihle-Hansen, H, Abzhandadze, T, Reinholdsson, M, Hansen, HI, and Sunnerhagen, KS. Prognostic value of acute National Institutes of Health stroke scale items on disability: a registry study of first-ever stroke in the western part of Sweden. BMJ Open. (2023) 13:e080007. doi: 10.1136/bmjopen-2023-080007
46. Li, QX, Zhao, XJ, Wang, Y, Wang, DL, Zhang, J, Liu, TJ, et al. Value of the Barthel scale in prognostic prediction for patients with cerebral infarction. BMC Cardiovasc Disord. (2020) 20:14. doi: 10.1186/s12872-019-01306-1
Keywords: ischemic stroke, machine learning, prognosis, predictive modeling, clinical decision support
Citation: Guo K, Zhu B, Zha L, Shao Y, Liu Z, Gu N and Chen K (2025) Interpretable prediction of stroke prognosis: SHAP for SVM and nomogram for logistic regression. Front. Neurol. 16:1522868. doi: 10.3389/fneur.2025.1522868
Edited by:
Wen-Jun Tu, Capital Medical University, ChinaReviewed by:
Jie Yang, Sichuan Academy of Medical Sciences and Sichuan Provincial People’s Hospital, ChinaCopyright © 2025 Guo, Zhu, Zha, Shao, Liu, Gu and Chen. This is an open-access article distributed under the terms of the Creative Commons Attribution License (CC BY). The use, distribution or reproduction in other forums is permitted, provided the original author(s) and the copyright owner(s) are credited and that the original publication in this journal is cited, in accordance with accepted academic practice. No use, distribution or reproduction is permitted which does not comply with these terms.
*Correspondence: Kongbo Chen, eWVndWkwODI0QDE2My5jb20=; Naibing Gu, Z3VuYWliaW5nQDEyNi5jb20=
Disclaimer: All claims expressed in this article are solely those of the authors and do not necessarily represent those of their affiliated organizations, or those of the publisher, the editors and the reviewers. Any product that may be evaluated in this article or claim that may be made by its manufacturer is not guaranteed or endorsed by the publisher.
Research integrity at Frontiers
Learn more about the work of our research integrity team to safeguard the quality of each article we publish.