- Department of Physics, University of California, San Diego, La Jolla, CA, United States
The nucleus HVC within the avian song system produces crystalized instructions which lead to precise, learned vocalization in zebra finches (Taeniopygia guttata). This paper proposes a model of the HVC neural network based on the physiological properties of individual HVC neurons, their synaptic interactions calibrated by experimental measurements, as well as the synaptic signal into this region which triggers song production. This neural network model comprises of two major neural populations in this area: neurons projecting to the nucleus RA and interneurons. Each single neuron model of HVCRA is constructed with conductance-based ion currents of fast Na+ and K+ and a leak channel, while the interneuron model includes extra transient Ca2+ current and hyperpolarization-activated inward current. The synaptic dynamics is formed with simulated delivered neurotransmitter pulses from presynaptic cells and neurotransmitter receptor opening rates of postsynaptic neurons. We show that this network model qualitatively exhibits observed electrophysiological behaviors of neurons independent or in the network, as well as the importance of bidirectional interactions between the HVCRA neuron and the HVCI neuron. We also simulate the pulse input from A11 neuron group to HVC. This signal successfully suppresses the interneuron, which leads to sequential firing of projection neurons that matches measured burst onset, duration, and spike quantities during the zebra finch motif. The result provides a biophysically based model characterizing the dynamics and functions of the HVC neural network as a song motor, and offers a reference for synaptic coupling strength in the avian brain.
1 Introduction
Adult male zebra finches are extraordinary singers that produce highly crystallized and complex sequence of syllables during courtship (Bolhuis et al., 2010; Margoliash, 2010; Daou et al., 2013; Mooney, 1991; Mooney and Prather, 2005; Simonyan et al., 2012). Birdsong production from male zebra finches when they are directed toward females is an interesting model for studying complex vocal behavior. Birdsong and human speech share similar precisely integrated vocal and respiratory muscle activity, and have similar critical periods for vocal learning, which depends on early auditory experience and feedback (Doupe and Kuhl, 1999; Deregnaucourt et al., 2005; Mooney, 2009). Moreover, birds and humans share the same basic organizational features in their auditory periphery (Mooney, 2009). Therefore, modeling of the zebra finches’ song system can be very helpful to understand the mechanisms behind human audition and speech.
Studies of zebra finches have identified a specialized forebrain pathway that ultimately regulates syringeal and respiratory muscles to produce songs. Premotor nucleus HVC plays a critical role in singing and song learning (Fee and Scharff, 2010; Fee and Goldberg, 2011; Daou et al., 2013).
A subclass of HVC neurons (HVCRA neurons) sends excitatory projections to the robust nucleus of arcopallium (RA), which in turn controls song acoustic features. During singing behavior, HVCRA neurons fire short bursts of action potentials consistent across repeated renditions of the song (Kadakia et al., 2016; Hahnloser et al., 2002). An important hypothesis posits that the observed HVCRA neurons’ bursts encode the temporal evolution of the birdsong (Long and Fee, 2008; Long et al., 2010; Lynch et al., 2016). Identifying how action potential bursts of HVCRA neurons are generated and transferred from one cell to the next through the local neural network provides a foundation for understanding the generation of song timing information. This paper explores two major types of neurons in HVC: the HVCRA projection neurons and the interneurons. HVCRA neurons give rise to a descending song motor pathway required for song generation, while the inhibitory effect of HVCI neurons is critical for modulating the activity of HVCRA neurons (Long et al., 2010).Numerous intracellular recordings of HVC neurons have unveiled a variety of physiological properties and circuit mechanisms within the HVC (Daou et al., 2013; Daou and Margoliash, 2020; Mooney and Prather, 2005; Long et al., 2010), as well as the trigger input into HVC before the motif and neuron spikes during singing (Ben-Tov et al., 2023). There are also many HVC single neuron models focused on spike characteristics and different ion channels (Kadakia et al., 2016; Daou et al., 2013; Daou and Margoliash, 2020; Meliza et al., 2014; Breen et al., 2016), but less work has been done to reproduce the network activity (Li and Greenside, 2006; Long et al., 2010; GGA1; Armstrong and Abarbanel, 2016). Several earlier network models have successfully generated the series of HVCRA neuron firing patterns. However, these models either proposed chain models without explaining the biophysical mechanism behind the series propagation, or failed to include electrical recording confirmed synaptic connections among various of neurons in the HVC (Li and Greenside, 2006; Gibb et al., 2009; Jin et al., 2007; Cannon et al., 2015; Armstrong and Abarbanel, 2016).
Here, we begin with conductance-based neuron models for individual HVCRA and HVCI cells. Each single-neuron model consists of ion channel dynamic equations verified by experiments, and both of them reproduce the spontaneous firing behavior of their corresponding neuron types under a background current (Daou et al., 2013; Armstrong and Abarbanel, 2016). Next, a microcircuit model is constructed with HVCRA and HVCI neurons based on experimentally established neurotransmitter pulses (Destexhe et al., 1994; Destexhe and Sejnowski, 2001), as well as recorded bidirectional synaptic interactions between them (Mooney and Prather, 2005). This microcircuit exhibits the basic neuron behavior when zebra finches are silent, and reproduces the sparse bursting patterns seen during female directed singing behavior once a model of dopaminergic innervation onto HVC from A11 neurons is included (Ben-Tov et al., 2023). Then, we extend the model microcircuit by adding more projection neurons along with homotypic synaptic interactions, and demonstrate that this framework successfully reproduces the time-locked firing pattern of excitatory HVC neurons during repeated renditions of zebra finches’ song discovered by Hahnloser et al. (2002). Most parameters in the single neuron models and synaptic current models are backed by experimental and simulation papers, and we discuss the model robustness under variation of the unknown or fine-tuned parameters.
2 Methods
2.1 Single neuron models
The basic units of our HVC neural network model are individual HVCRA and HVCI cells. The HVCRA population projects to RA and gives rise to the song motor pathway (SMP). It plays a fundamental role in coordinating ensembles of neurons in RA, which in turn send motor commands to the brainstem for the precise control of the syringeal motor neurons and respiratory premotor neurons (Mooney, 2009; Mooney 2022). We also focus on the HVCI neurons because prior works have shown that interneuron activity can modulate HVCRA neurons’ firing and is important for birdsong (Armstrong and Abarbanel, 2016; Long et al., 2010).
Our neuron model is developed from conductance-based Hodgkin-Huxley-type neurons with sodium, potassium, and leak channels (Hodgkin and Huxley, 1952). The specific HVCRA projecting neuron model is based on Kadakia et al. (2016) and Armstrong and Abarbanel (2016), as well as the electrophysiological recordings and simulations from Daou et al. (2013). Among the HVCRA neuron channels, sodium and potassium currents produce fast-response spikes in response to stimulating currents, and leak current is a widely existing channel which is carried mainly by chloride and other ions. The model of inhibitory neurons (HVCI) is adapted from Breen et al. (2016), Armstrong and Abarbanel (2016) and Daou et al. (2013). Aside from the basic NaKL channels, the HVCI cells are also shown to have a T-type low threshold calcium current (ICaT) and a hyperpolarization activated current (IH) (Breen et al., 2016; Armstrong and Abarbanel, 2016; Daou et al., 2013). The behavior of the calcium current is described by the Goldman–Hodgkin–Katz (GHK) equation to better reflect its current–voltage curve (Sterratt et al., 2011; Johnston and Samuel Miao-Sin, 1996). Compared to the classic Hodgkin–Huxley formulation, the GHK equation adds extra nonlinearity to the calcium channel (Bard Ermentrout and Terman, 2010).
The time evolutions of the cross-membrane voltages of the HVCRA and HVCI neurons are functions of the currents that flow across ion channels specific for certain types of neurons, as well as synaptic interactions and background stimulus current. All these components can be summarized in the following equations:
RA projection neuron:
Interneuron:
Here, C is the membrane capacitance. and are the membrane potentials of HVCRA and HVCI neuron, respectively. Sodium, potassium, leak, low threshold calcium, and hyperpolarization activated currents are represented by Itype, i.e., INa, IK, IL, ICaT, and IH, respectively. The summation of the terms represents all the synaptic input currents from both inside and outside HVC. refers to the ambient background stimulus which is usually a DC current. Each ion channel current can be expressed as a function of voltage V(t) and gating variables = [ , , , , , ] (Johnston and Samuel Miao-Sin, 1996, Daou et al., 2013, Kadakia et al., 2016, Armstrong and Abarbanel, 2016), illustrated in the following equations:
With the definition of written as:
In the ion current equations, all parameters denoted as “ ” are the maximum conductances of corresponding ion channels. The parameters named as “ ” are the respective reversal potentials. In the GHK equation, is the constant extracellular concentration of calcium ions, and is the intracellular calcium concentration evolving with time. Z is the valence of calcium ions. F is the Faraday constant and R is the gas constant. T represents the temperature which is 310 K in our case. All the gating variables = [ , , , , , ] obey a similar set of equations (Johnston and Samuel Miao-Sin, 1996, Daou et al., 2013, Kadakia et al., 2016, Armstrong and Abarbanel, 2016):
Here, , , and are parameters for their corresponding gating variable . The dynamics of is the only exception here: and use different values of . The intracellular calcium concentration is also a function of time:
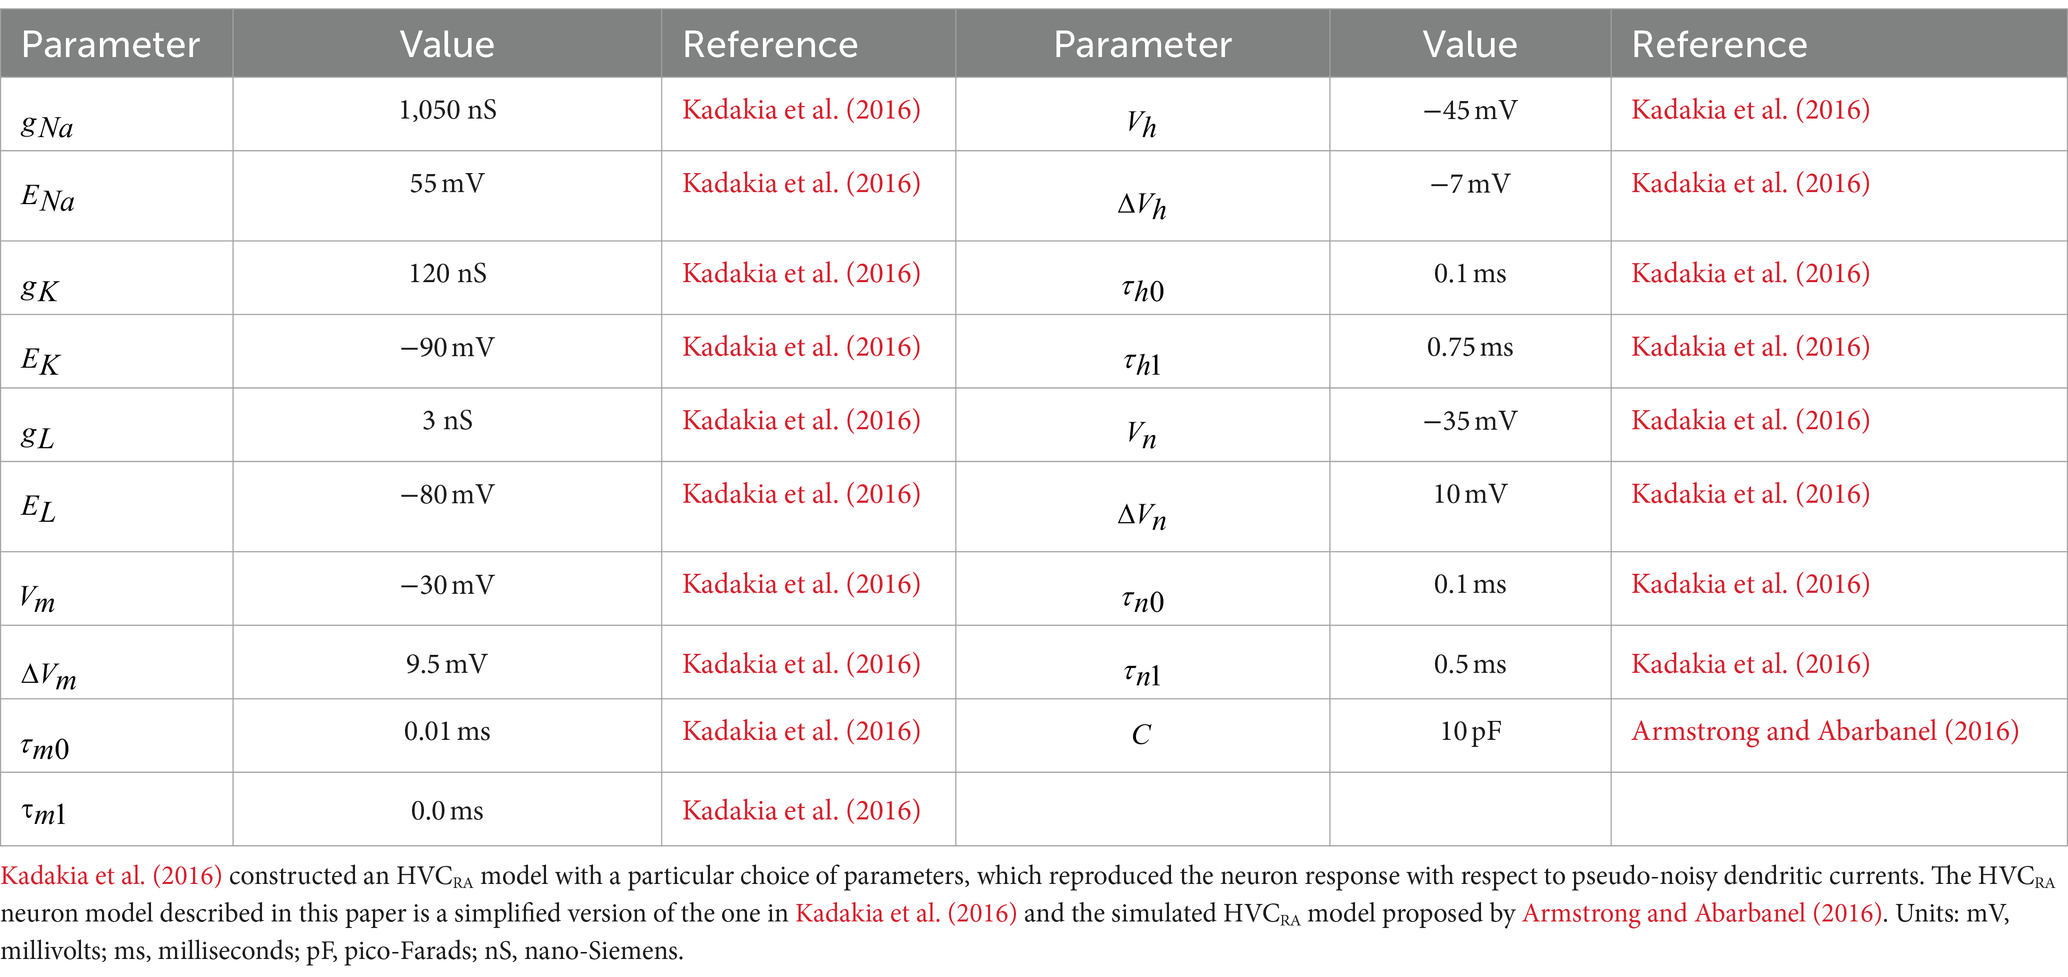
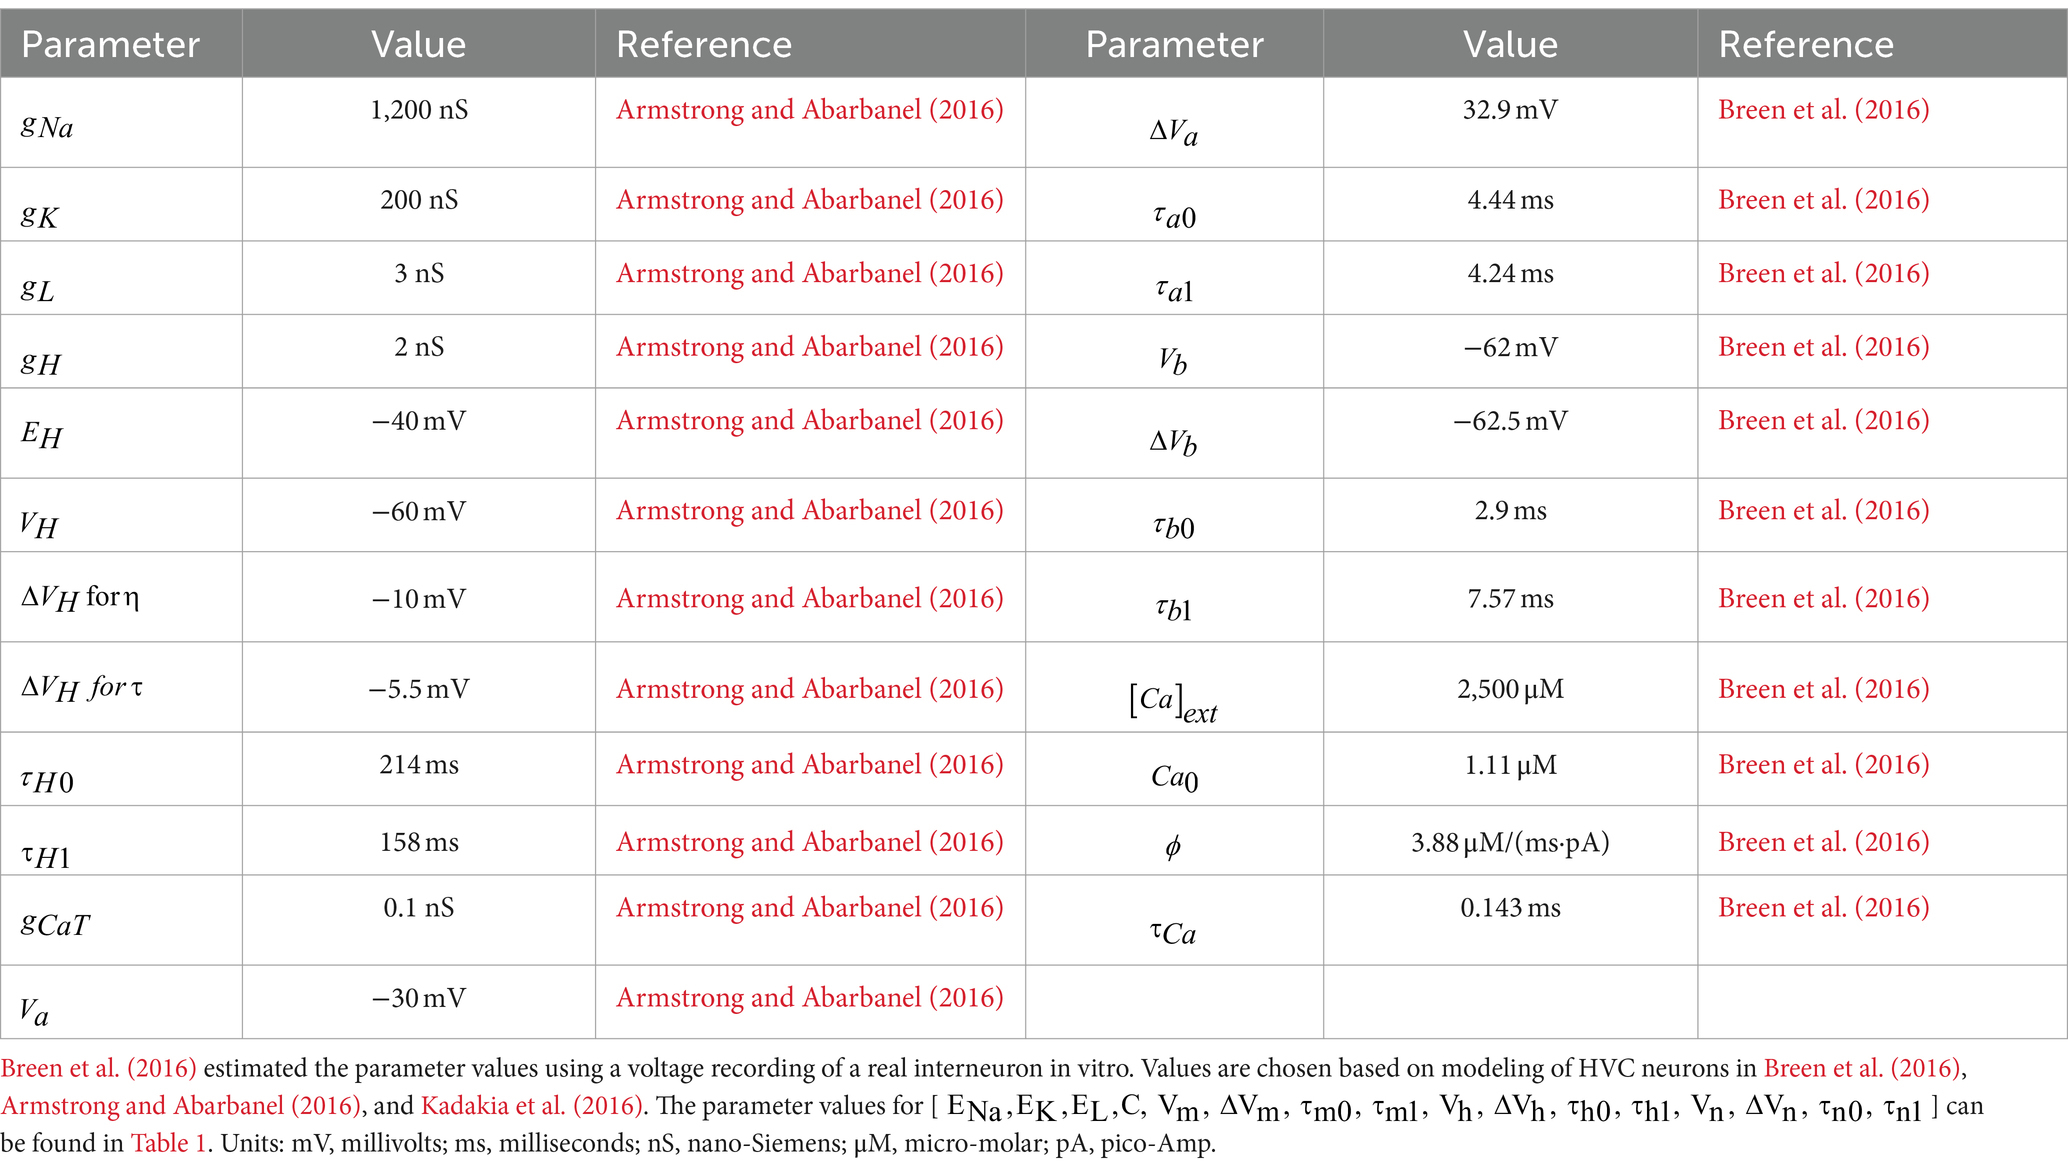
where the parameter is the intracellular calcium concentration during equilibrium state. All the values for the HVCRA neuron model parameters are listed in Table 1; corresponding values for the HVCI cell can be found in Table 2. The parameters governing the dynamics of gating variables [ , , ] and the parameters [ ] have the same set of values for both the HVCRA neuron model and the interneuron model, which are listed in Table 1.
2.2 Synapses
The synaptic dynamics is built on the formalism of neurotransmitter pulses and the fraction of opening neurotransmitter acceptors, based on the data from Destexhe and Sejnowski (2001) and Destexhe et al. (1994). For presynaptic neurotransmitter release, assuming that all intervening reactions in the release process are fast and can be considered at steady state, the neurotransmitter concentration [T] can be expressed as:
where is the maximal concentration of neurotransmitters in the synaptic cleft. is the presynaptic cell voltage. is the steepness and sets the value of which the function is half activated. This is a simplified model of the neurotransmitter release process compared to a kinetic model involving calcium diffusion and gradients, which introduces a smoother transformation between presynaptic voltage and neurotransmitter concentration.
Postsynaptic neurotransmitter receptors have several different types, each with specific response to the same concentration of corresponding neurotransmitters. Previous studies have confirmed that the local axon collaterals of HVCRA neurons release glutamate, and excite interneurons by activating ionotropic glutamate receptors of the α-amino-3-hydroxy-5-methyl-4-isoxazolepropionic acid (AMPA) subtype (Mooney and Prather, 2005; Colquitt et al., 2021). For the inhibitory connections from interneurons to HVCRA cells, this fast hyper-polarizing response is mediated by γ-aminobutyric acid (GABA) and GABAA type receptors (Mooney and Prather, 2005; Colquitt et al., 2021). Under the assumption that these two types of neurotransmitters both bind to the receptors at a constant rate, the postsynaptic kinetics can be described by the following set of equations:
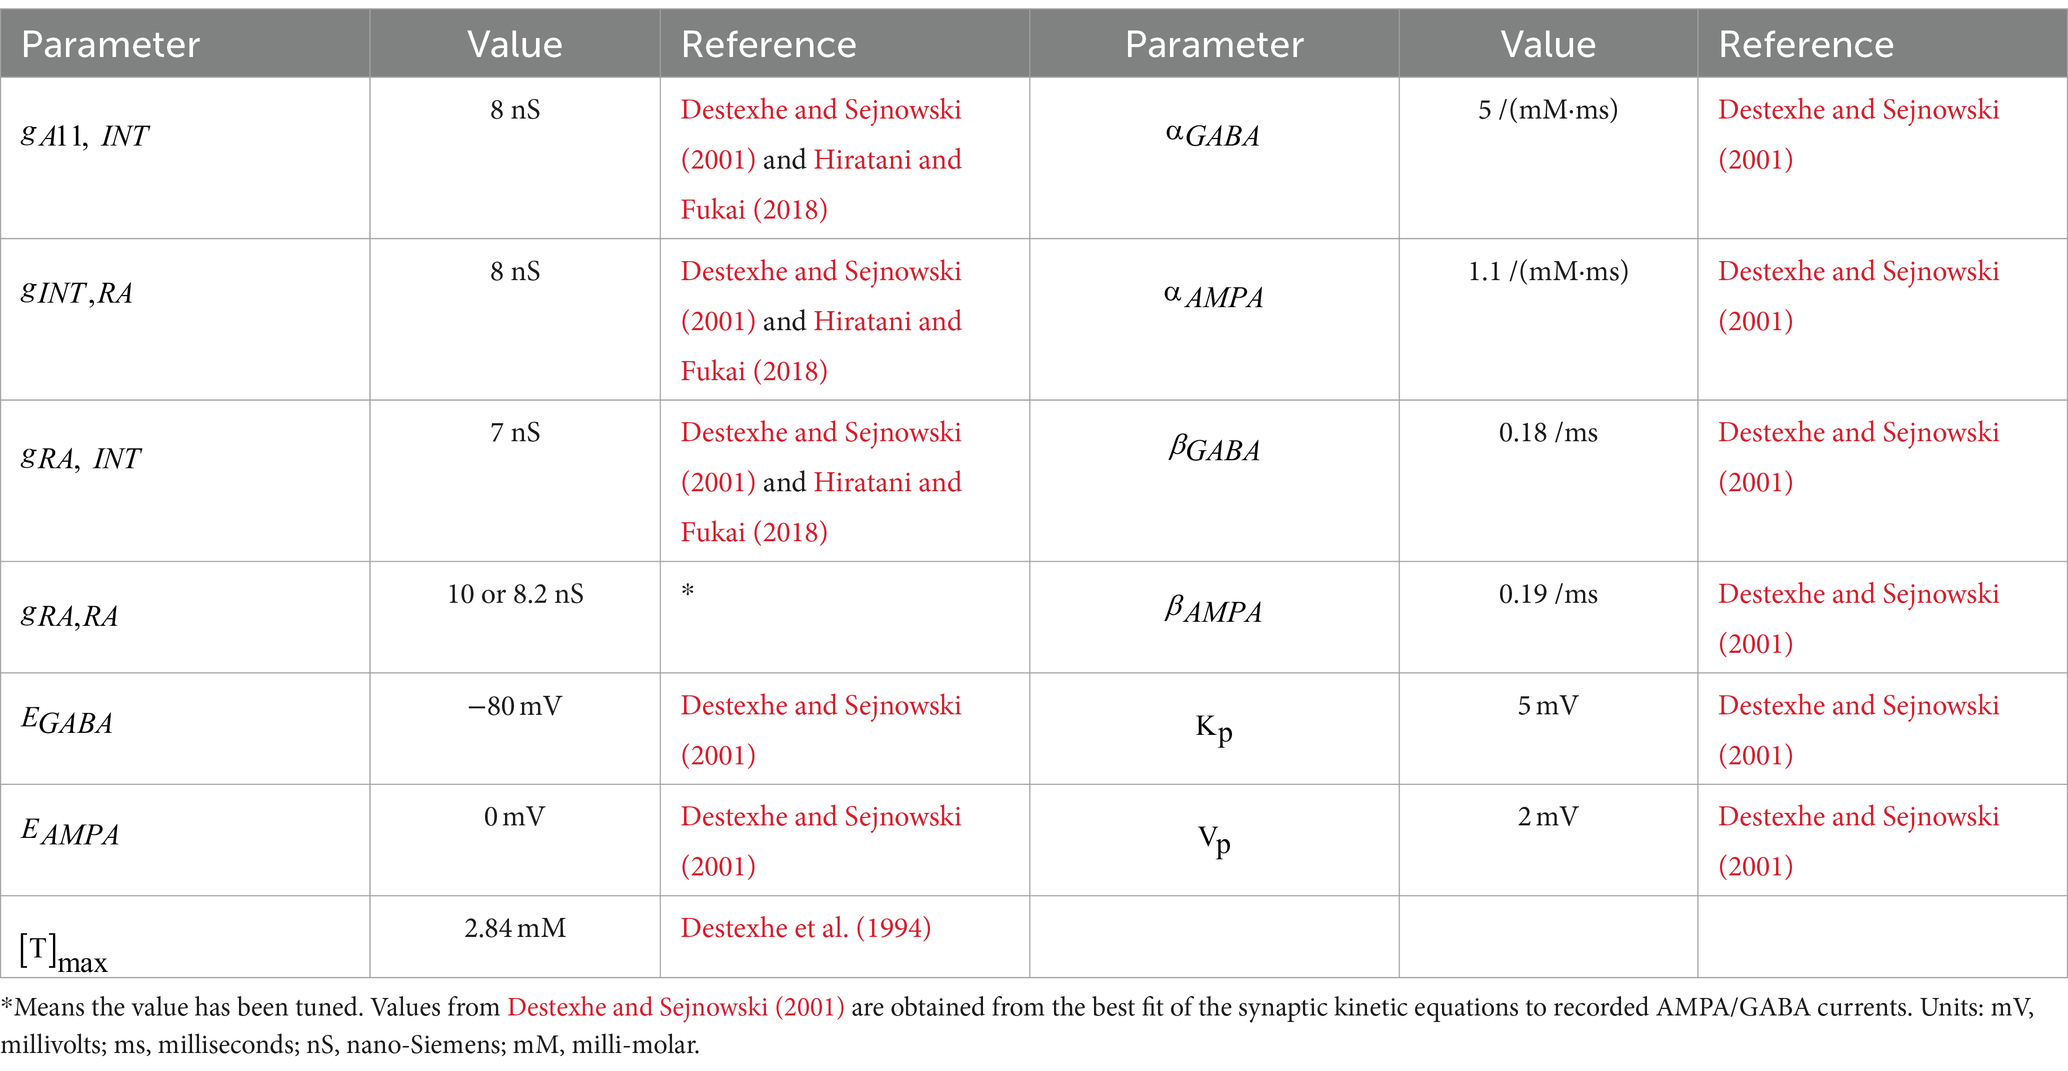
where r is the fraction of the postsynaptic receptors in the open state. Its dynamics depends on , the gate opening rate, and , the gate closing rate. They take different values for AMPA and GABAA type receptors. is the current seen by postsynaptic cell j as a result of input from presynaptic neuron i. is the maximal conductance and is the synaptic reversal potential. is the instantaneous membrane voltage of the postsynaptic cell. Parameter values for synaptic dynamics can be found in Table 3.
The value of maximal conductance of the synaptic current between two neurons is obtained by two factors: the number of synapses connecting neuron i and neuron j, and the maximal conductance for a single synapse. Previous morphological studies show that there are usually multiple synaptic connections between two connected neurons in different cortical circuits across the brain (Hiratani and Fukai, 2018). More specifically, the average number of synapses per connection is estimated to be around 10 in the barrel cortex (Hiratani and Fukai, 2018). For inhibitory interactions, estimation for the maximal conductance of a single GABAergic synapse with GABAA type currents is in the range of 0.25 to 1.2 nS (Ropert et al., 1990; De Koninck and Mody, 1994). Therefore, we take the median value of 0.8 nS, so the maximal conductance for inhibitory connections between two neurons is estimated to be around 8 nS. For excitatory synaptic interactions, measurements of miniature synaptic currents and analysis estimate that the maximal conductance of AMPA-mediated is between 0.35–1.0 nS in the neocortical and hippocampus pyramidal cells (Stricker et al., 1996; Burgard and Hablitz, 1993; McBain and Dingledine, 1992). Thus, , the maximal conductance from an excitatory HVCRA neuron to the postsynaptic HVCI neuron is set to 7 nS in our modeling. The only parameter we vary is the maximal conductance from one HVCRA neuron to another, i.e., This synaptic connection strength for homotypic HVCRA cell pairs is assigned a higher value to ensure the excitatory input is large enough to awaken the postsynaptic HVCRA neuron. There will be more discussion about this fine-tuned parameter value in the Results section.
2.3 Trigger signal
When male zebra finches sing during courtship, HVC activity is closely synchronized with song production. To enable directed song production, a neural circuit receives information about sexual motivations and then communicates with the HVC neural network to start the sequence of stereotyped syllables. A11 cells are part of this neural circuit, which connect to HVC to gate the song motif (Ben-Tov et al., 2023).
The midbrain A11 cell group is implicated in motor control, motivation, and reproduction (Mohebi et al., 2019; da Silva et al., 2018). A11 neurons in songbirds receive sexual motivation input from the medial preoptic nucleus (POM) (Riters and Alger, 2004), and project axons into HVC amongst other regions. A11 neurons and their axons in HVC are crucial for female-directed singing. Male zebra finches with lesioned A11 cell bodies or A11 terminals in HVC failed to sing when presented with a female bird (Ben-Tov et al., 2023). We sought to simulate the physiological changes in HVC neural network following activation of A11-HVC projection.
During in vivo experiment, fiber photometry reveals that the GCaMP signal of A11 axons in HVC first rapidly increases during the introductory notes (repetitive call-like vocalizations that immediately precede the song motif), reaches the peak point at the motif onset, and then decreases at an almost constant speed (Figure 1). By assuming that the trajectory of the neurotransmitter concentration in the synaptic cleft in HVC is similar to the shape of the measured calcium signal, we can approximate the dynamics of neurotransmitter concentration from A11 axons with the following equations:
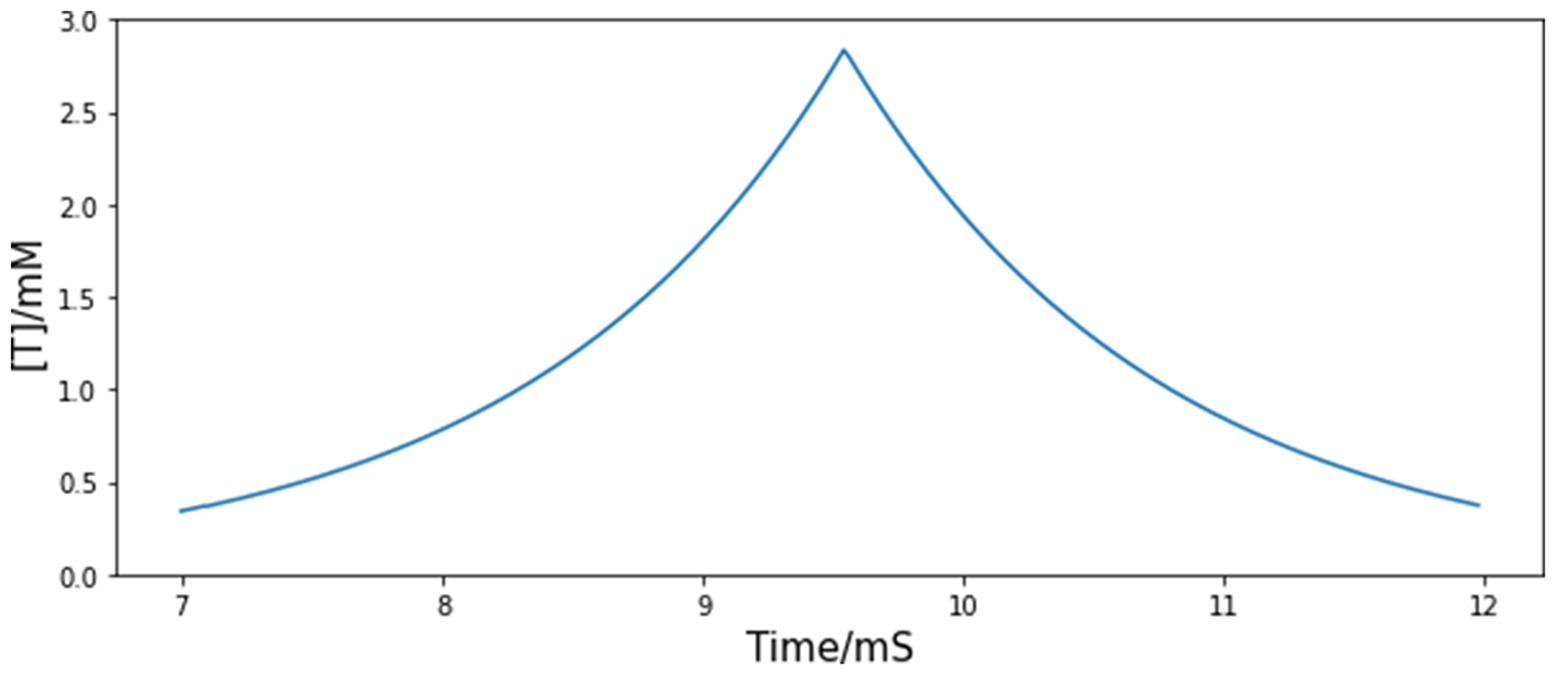
Figure 1. Simulated time course of injected neurotransmitter concentration [T] from A11 axons to HVC. The shape of the simulated trajectory of [T] is similar to the GCaMP recordings from A11 axons in HVC during female directed song motifs (see Figure 6F, Ben-Tov et al., 2023), but the timescale is determined to match the measured time course of neurotransmitters in the synaptic cleft since GCaMP signal has a large time lag.
Again, is the neurotransmitter concentration as a function of time. represents the baseline concentration, i.e., [T] before the trigger signal arrives. and are the time constants which determine the rate of rise and fall for neurotransmitters, respectively. means the time point when the concentration transits from rise to fall. For , it is a constant chosen to ensure the continuity of neurotransmitter concentration at time . Therefore, the value of is entirely determined by other parameters:
Assuming that the maximum neurotransmitter concentration is , the value of the transition time can be derived from previous equations:
The values of all parameters related to the A11 neurotransmitter dynamics are listed in Table 4. The time course of the trigger signal neurotransmitter concentration is displayed in Figure 1. We choose to be 2.84 mM, a value which corresponds to the observation of maximal transmitter concentration in Destexhe et al. (1994). is chosen to be positive so that the value of is not constantly zero, and it is set to a small value so that the A11 stimulus does not affect HVC neural network outside the motif onset period. Other than these two restrictions, the exact value of does not make a big difference to the modeling result (see Results section for more details about this parameter). The rise and fall timescales for the recorded GCaMP signal are up to 1 s, but we do not use this to determine the values of or . The reason is that GCaMP recordings have a large time lag compared to real neuron activities, whose value could be up to a few seconds (Storace et al., 2015). The fall time constant is set to 1.2 ms, same as the measured decay time course of free neurotransmitters in the synaptic cleft of cultured hippocampal synapses (Clements et al., 1992), and within the normally estimated decay time range (Scimemi and Beato, 2009). The rise time constant is chosen to match it so that the trajectory of neurotransmitter concentration is symmetric. Based on the above choices of parameter values, the combined time span of rise and fall is approximately 5 ms (see Figure 1). The postsynaptic kinetics of the A11-HVC projection can be described with the same equations in Section 2 Synapses.
2.4 Simulation
For all the voltage and current time series shown in this paper, the dynamical equations were written in Python, and the results were integrated with Python’s adaptive fourth order Runge–Kutta “odeINT” using a step size of 0.02 ms. A smaller step size did not lead to different results.
3 Results
This section illustrates, via the time course of cross-membrane voltages of two types of neuron models, how they function independently, respond to external stimulus, and coordinate within the network to reproduce important experimental observations. We also test the importance of various experimental established synaptic currents by adding them to the modeled network one by one, and explore model robustness at the end of this section.
3.1 Behavior of single neuron model
With the published set of parameters shown in Tables 1, 2, the two models reproduce qualitative features of HVCRA and HVCI neurons observed in whole-cell patch clamp experiments (Daou et al., 2013). For the excitatory neurons, although an HVCRA neuron in vivo usually generates a single burst synchronized with singing, those projecting neurons will no longer fire once per song, but rather multiple times without inhibitory neurons (Long et al., 2010). Without inhibition input from any HVCI neurons, HVCRA cells can fire with a background stimulus above the threshold of about 100 pA (Daou et al., 2013). Our simulations reproduce this behavior with a threshold of about 140 pA. Figure 2 shows the membrane voltage of one independent HVCRA neuron given an injected current of this threshold stimulus. For the interneuron, Figure 2 shows the stereotyped firing of the interneuron model under the same injected current.
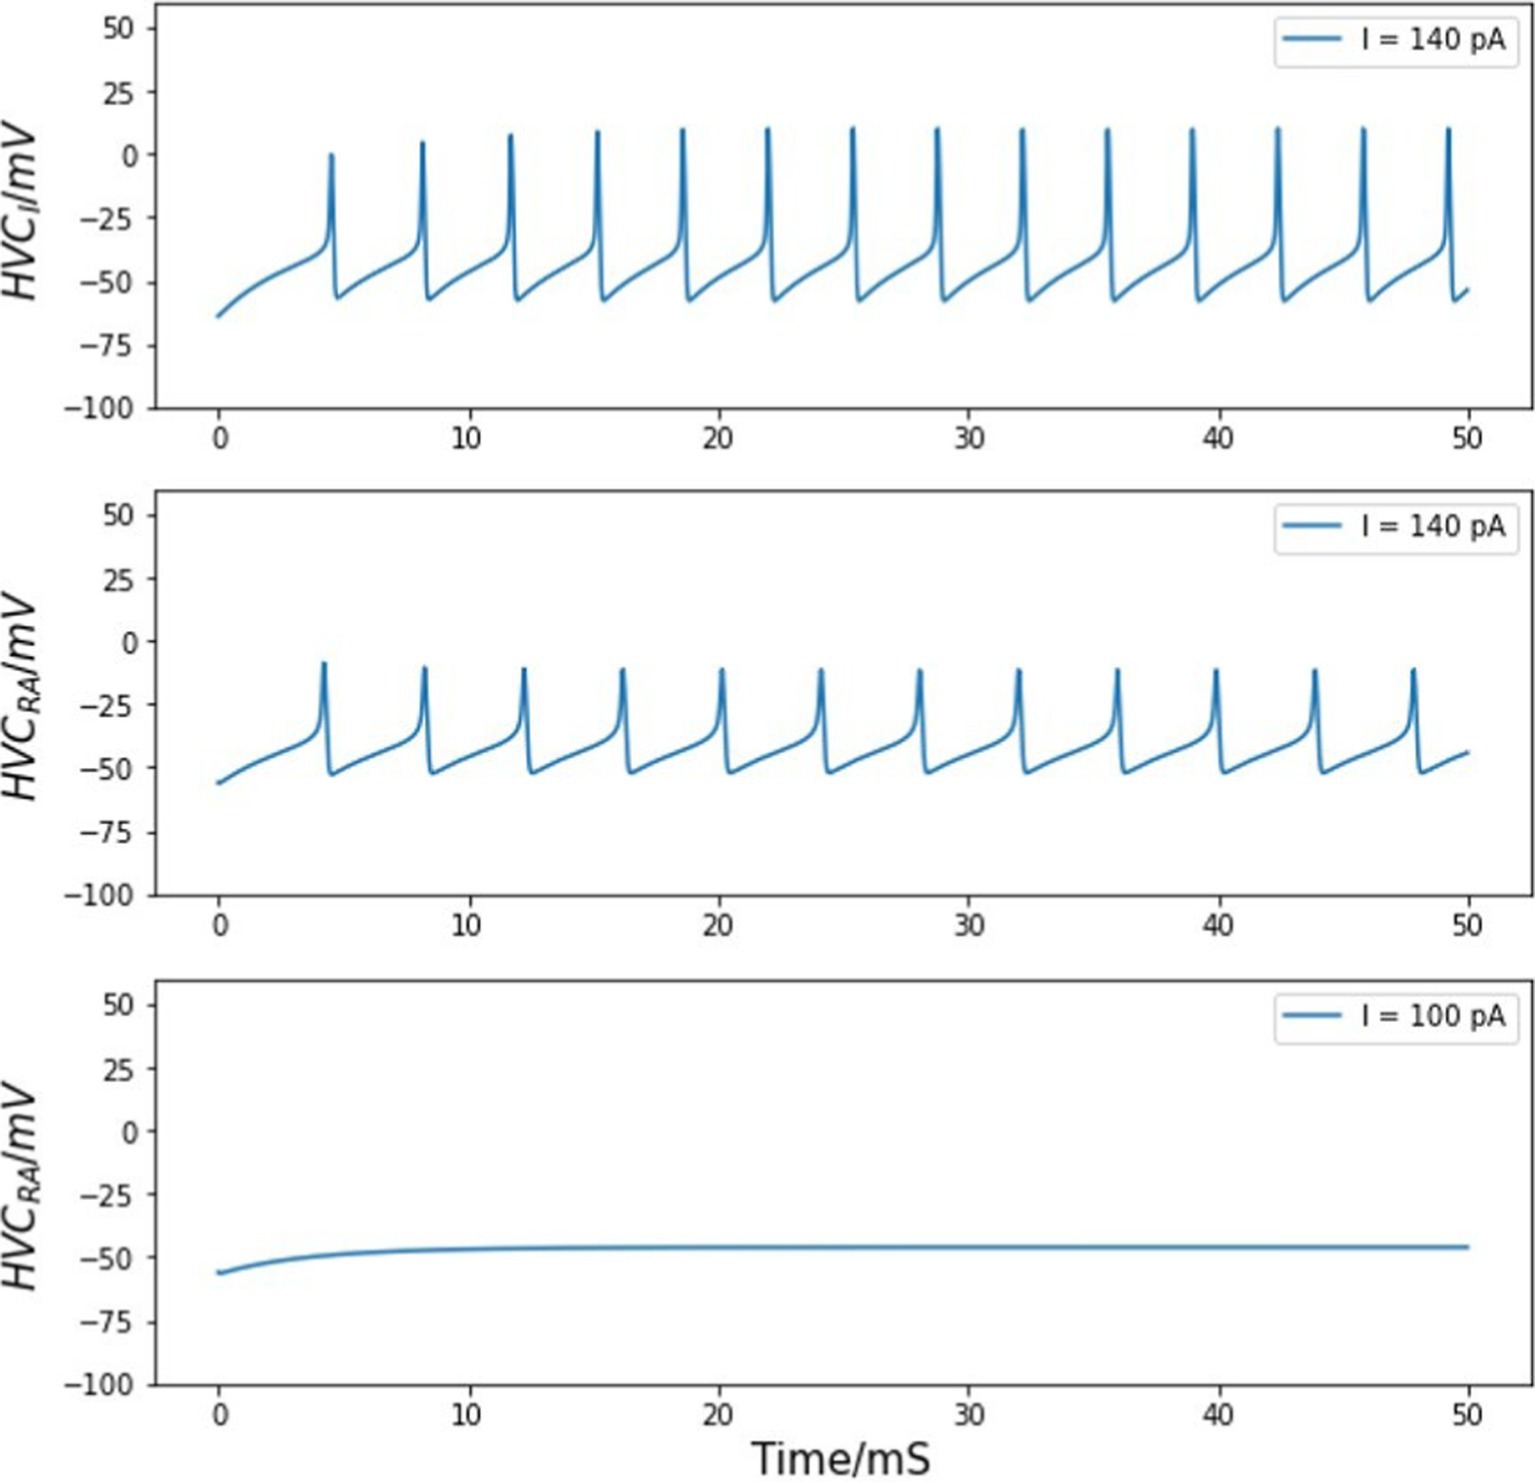
Figure 2. Voltage traces of HVC neurons. Top panel: voltage of an HVC interneuron neuron in response to a background current. Middle panel: an HVCRA neuron exhibits action potential given a threshold stimulus of about 140 pA. Bottom panel: the HVCRA model stays silent under a lower background current of 100 pA.
3.2 Trigger signal into HVC
The midbrain A11 cell group is implicated in motor control, motivation, and reproduction (Mohebi et al., 2019; da Silva et al., 2018). A11 neurons in songbirds receive sexual motivation input from the medial preoptic nucleus (POM) (Riters and Alger, 2004), and project axons into HVC amongst other regions. A11 neurons and their axons in HVC are crucial for female-directed singing. Male zebra finches with lesioned A11 cell bodies or A11 terminals in HVC failed to sing when presented with a female bird (Ben-Tov et al., 2023). We sought to simulate the physiological changes in HVC neural network following activation of A11-HVC projection.
The A11 cell group is thought to distribute information about sexual motivation to HVC. The activity of A11 terminals in HVC starts to increase above the baseline before the first syllable as shown in Figure 1, which may serve as a trigger for motif initiation (Ben-Tov et al., 2023).
To simulate HVC neuron activities after the trigger signal arrives, we first expose an interneuron to the neurotransmitter pulses. We choose interneuron instead of HVCRA neuron because those projecting neurons fail to fire at a particular temporal location during each motif without the presence of HVCI cells (Kosche et al., 2015; Armstrong and Abarbanel, 2016). Therefore, there is a high probability that the interneurons receive the signal from A11 cell group and then coordinate the behavior of HVCRA neurons.
Normal and uninterrupted singing consists of a fixed sequence of syllables, which are interspaced by brief inhalation gaps. Both the syllables and the gaps occur in a fixed chronological order, and they are precisely timed during repeated renditions of the same motif. During this process, single HVCI neuron’s recordings show relatively sustained firing throughout the song with intermittent gaps (Armstrong and Abarbanel, 2016). However, each HVCRA neuron is observed to only burst once throughout a motif at a specific time. Together with the fact that HVCRA neurons fail to fire at a particular temporal location during each motif without the presence of interneurons (Kosche et al., 2015; Armstrong and Abarbanel, 2016), we can assume the input from A11 axons to interneurons to be inhibitory, which stops HVCI neurons from continually firing. Following the postsynaptic current equations, the inhibitory current corresponding to A11 neurotransmitters and the response of single HVCI neuron are depicted in Figure 3. The trigger signal is not present until 10 ms so that the interneuron voltages before and after the motif onset are both revealed.
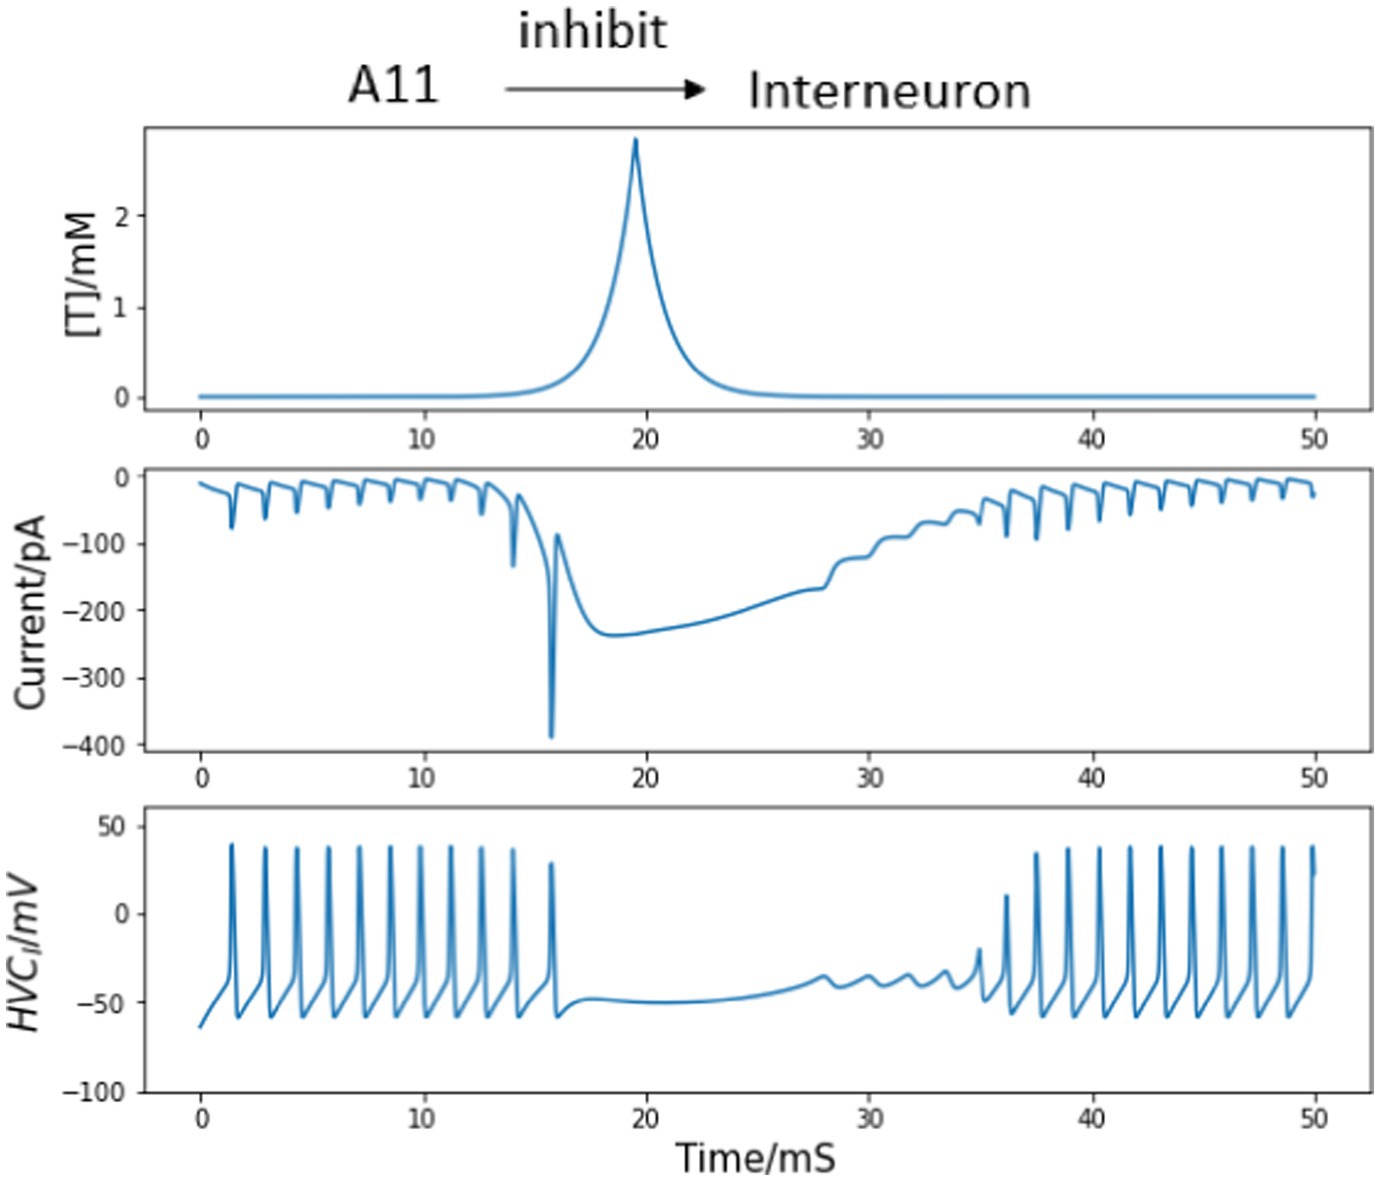
Figure 3. HVCI neuron responses to the trigger current. The trigger signal happens at 10 ms. Top panel: synaptic connections between A11 axons and interneuron. Middle top: Simulated trajectory of injected neurotransmitter concentration [T] from A11 axons to HVC. Middle bottom: postsynaptic current from A11 cell axons to interneuron corresponding to the neurotransmitter concentration path in the middle top panel. Bottom panel: membrane voltage of the interneuron. The continuous firing of HVCI neurons is interrupted by the inhibition input arising from 10 ms, corresponding to the intermittent silence throughout singing.
3.3 Interactions between HVCI and HVCRA neuron
Since the axonal and dendritic processes from all major types of HVC neurons as well as axons from HVC afferents are interwoven with each other, it is almost impossible to analyze every intrinsic connectivity and synaptic interaction based on morphological reconstruction (Fortune and Margoliash, 1995; Foster and Bottjer, 1998; Mooney, 2000; Nixdorf, 1989). However, the synaptic interaction between an isolated neuron pair can be studied by recording the depolarizing or hyperpolarizing membrane voltage response in one cell immediately after the spontaneous or stimulus-evoked spikes from the other cell in the recorded pair (Perkel et al., 1967; Mooney and Prather, 2005; Long et al., 2010).
By blind dual sharp microelectrode recordings from synaptic coupled pairs of an HVCI and an HVCRA neuron, HVCRA axon collaterals often show short-latency, excitatory and strong synaptic connections with interneurons (Mooney and Prather, 2005). A single spike from the HVCRA cell is often sufficient to evoke the HVCI neuron to spike threshold, and spike doublets or triplets from the HVCRA neuron could drive depolarizing responses which can evoke action potentials in the interneuron. Recordings in the same pairs also provide direct evidence that interneurons have synaptic contacts on HVCRA neurons. At the population level, the HVCRA - HVCI coupling is robust and bidirectional, and synaptic transmissions from the interneurons to HVCRA neurons mostly evoke hyperpolarizing responses (IPSPs) in the latter ones (Mooney and Prather, 2005). Bidirectional connections between interneurons and projecting neurons can form bistable networks and generate low-frequency rhythms or no output according to the amount of excitatory input applied to the HVCRA cells (Börgers and Kopell, 2005).
First, we permit one interneuron to form inhibitory synapses directly to an HVCRA neuron. There is no evidence of reciprocal connections from HVC back to A11 cell group, so we only consider the inhibition from A11 axons to HVCI cells. When the trigger input has not arrived and an awake zebra finch is not singing, the population of interneurons are active continually while the HVCRA neurons only stay silent (Kozhevnikov and Fee, 2007). With the synaptic model described in the Method section, the inhibitory current from HVCI neuron is strong enough to overcome the background stimulus of 300 pA (Armstrong and Abarbanel, 2016), and silence the HVCRA neuron during the interneuron’s active time (see Figure 4 first 10 ms).
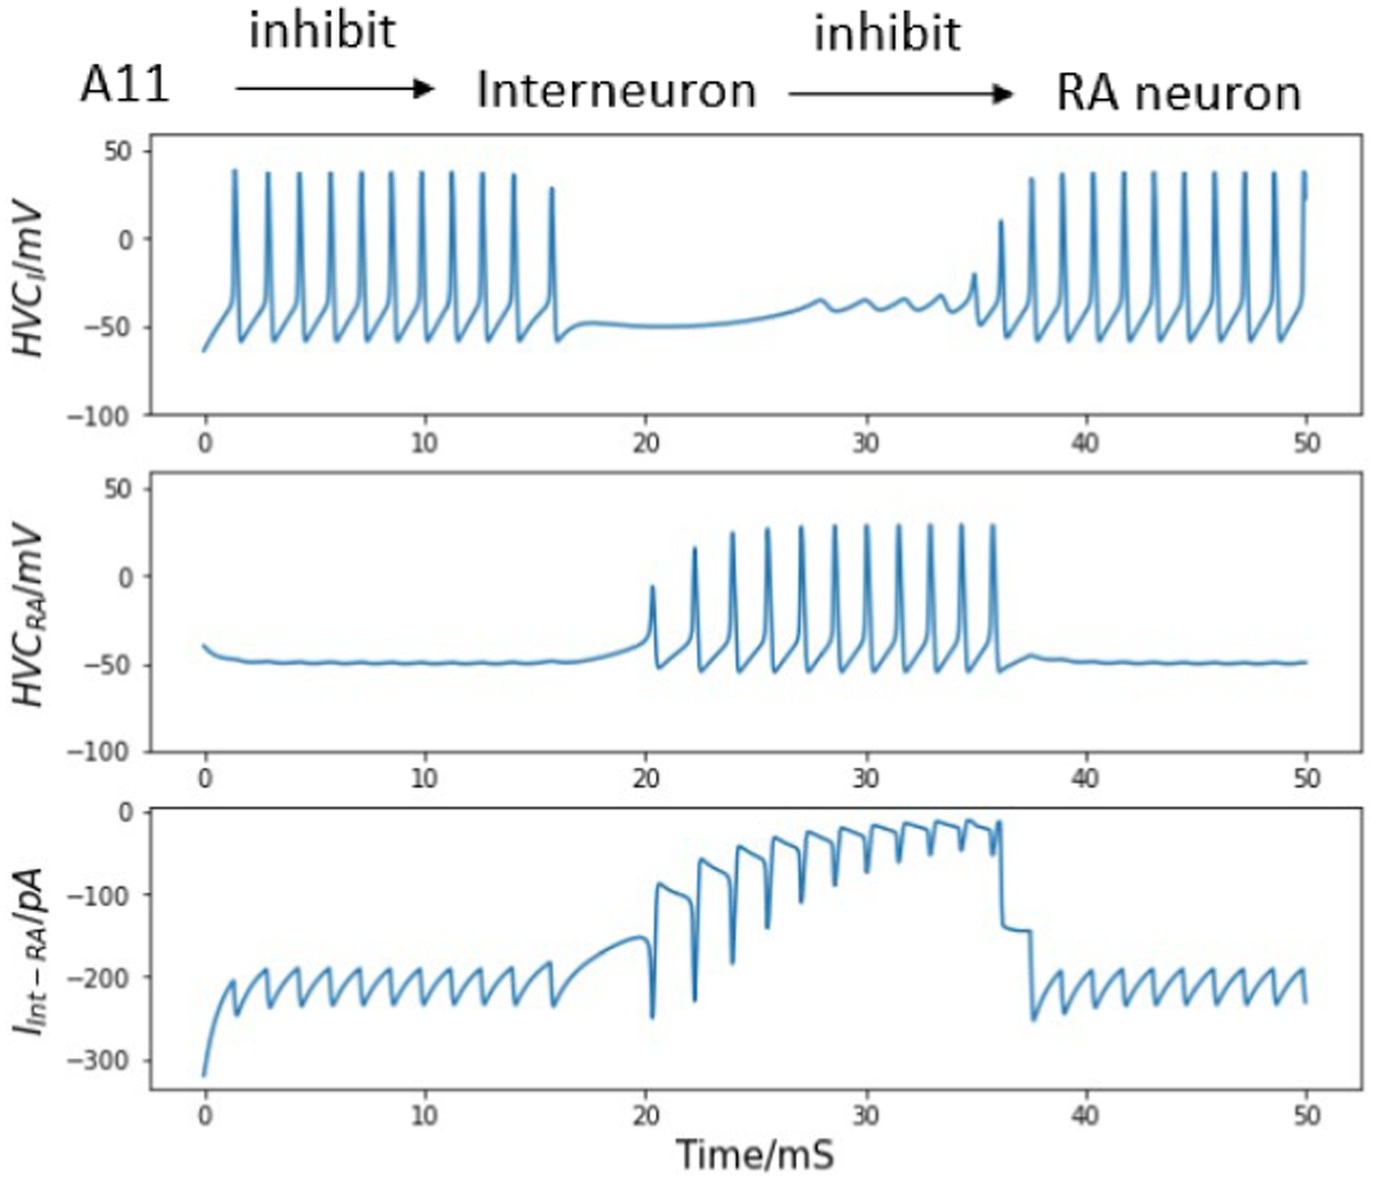
Figure 4. Inhibitory synaptic interaction from HVCI to HVCRA neuron and their voltage traces. Top: diagram of neural circuit simulated in this figure. Note there is only one unidirectional synaptic current between the interneuron and the HVCRA neuron. Top middle: continuous firing of the interneuron and the quiet time induced by trigger current (dynamics of the trigger current is presented in Figure 1). Bottom middle: membrane voltage of the HVCRA neuron with a burst when the interneuron is not active. Bottom: inhibitory current from HVCI to HVCRA cell (Int represents the interneuron, and RA refers to the HVCRA neuron.) See text for important details.
In Figure 4, the simulated interneuron stops firing after the A11 inhibitory current emerges, which enables the HVCRA neuron to generate a burst of spikes. In this context, a burst refers to a series of action potentials which last a very brief time. However, recordings of the HVCRA neuron voltages during singing reveal that a burst usually consists of around 4 spikes and lasts approximately 8 ms (Hahnloser et al., 2002), while the modeled are almost doubled. At this stage the network model output does not fully agree with experimental observations.
Second, if the reciprocal excitatory current from the HVCRA neuron to the interneuron is added to the model, the simulated burst behavior better matches the recorded burst pattern of real HVCRA neurons, as illustrated in Figure 5. After the trigger signal appears, the interneuron becomes, leading to the cessation of inhibition HVCI to HVCRA cell, which in turn allows the HVCRA neuron to start its burst. Then, the excitation current generated by the spikes from HVCRA neuron successfully drives the silent interneuron to spike again before the A11 activity completely vanishes. As the HVCI neuron generates continuous spikes again, the interneuron’s sustained firing suppresses the activity of the HVCRA neuron. Now the burst duration and the spike number of the HVCRA neuron closely match the in vivo neuron observation. Therefore, the microcircuit model demonstrates that the synaptic interactions of both directions between the interneuron and the HVCRA neuron are necessary for the neural network model to generate the correct activity.
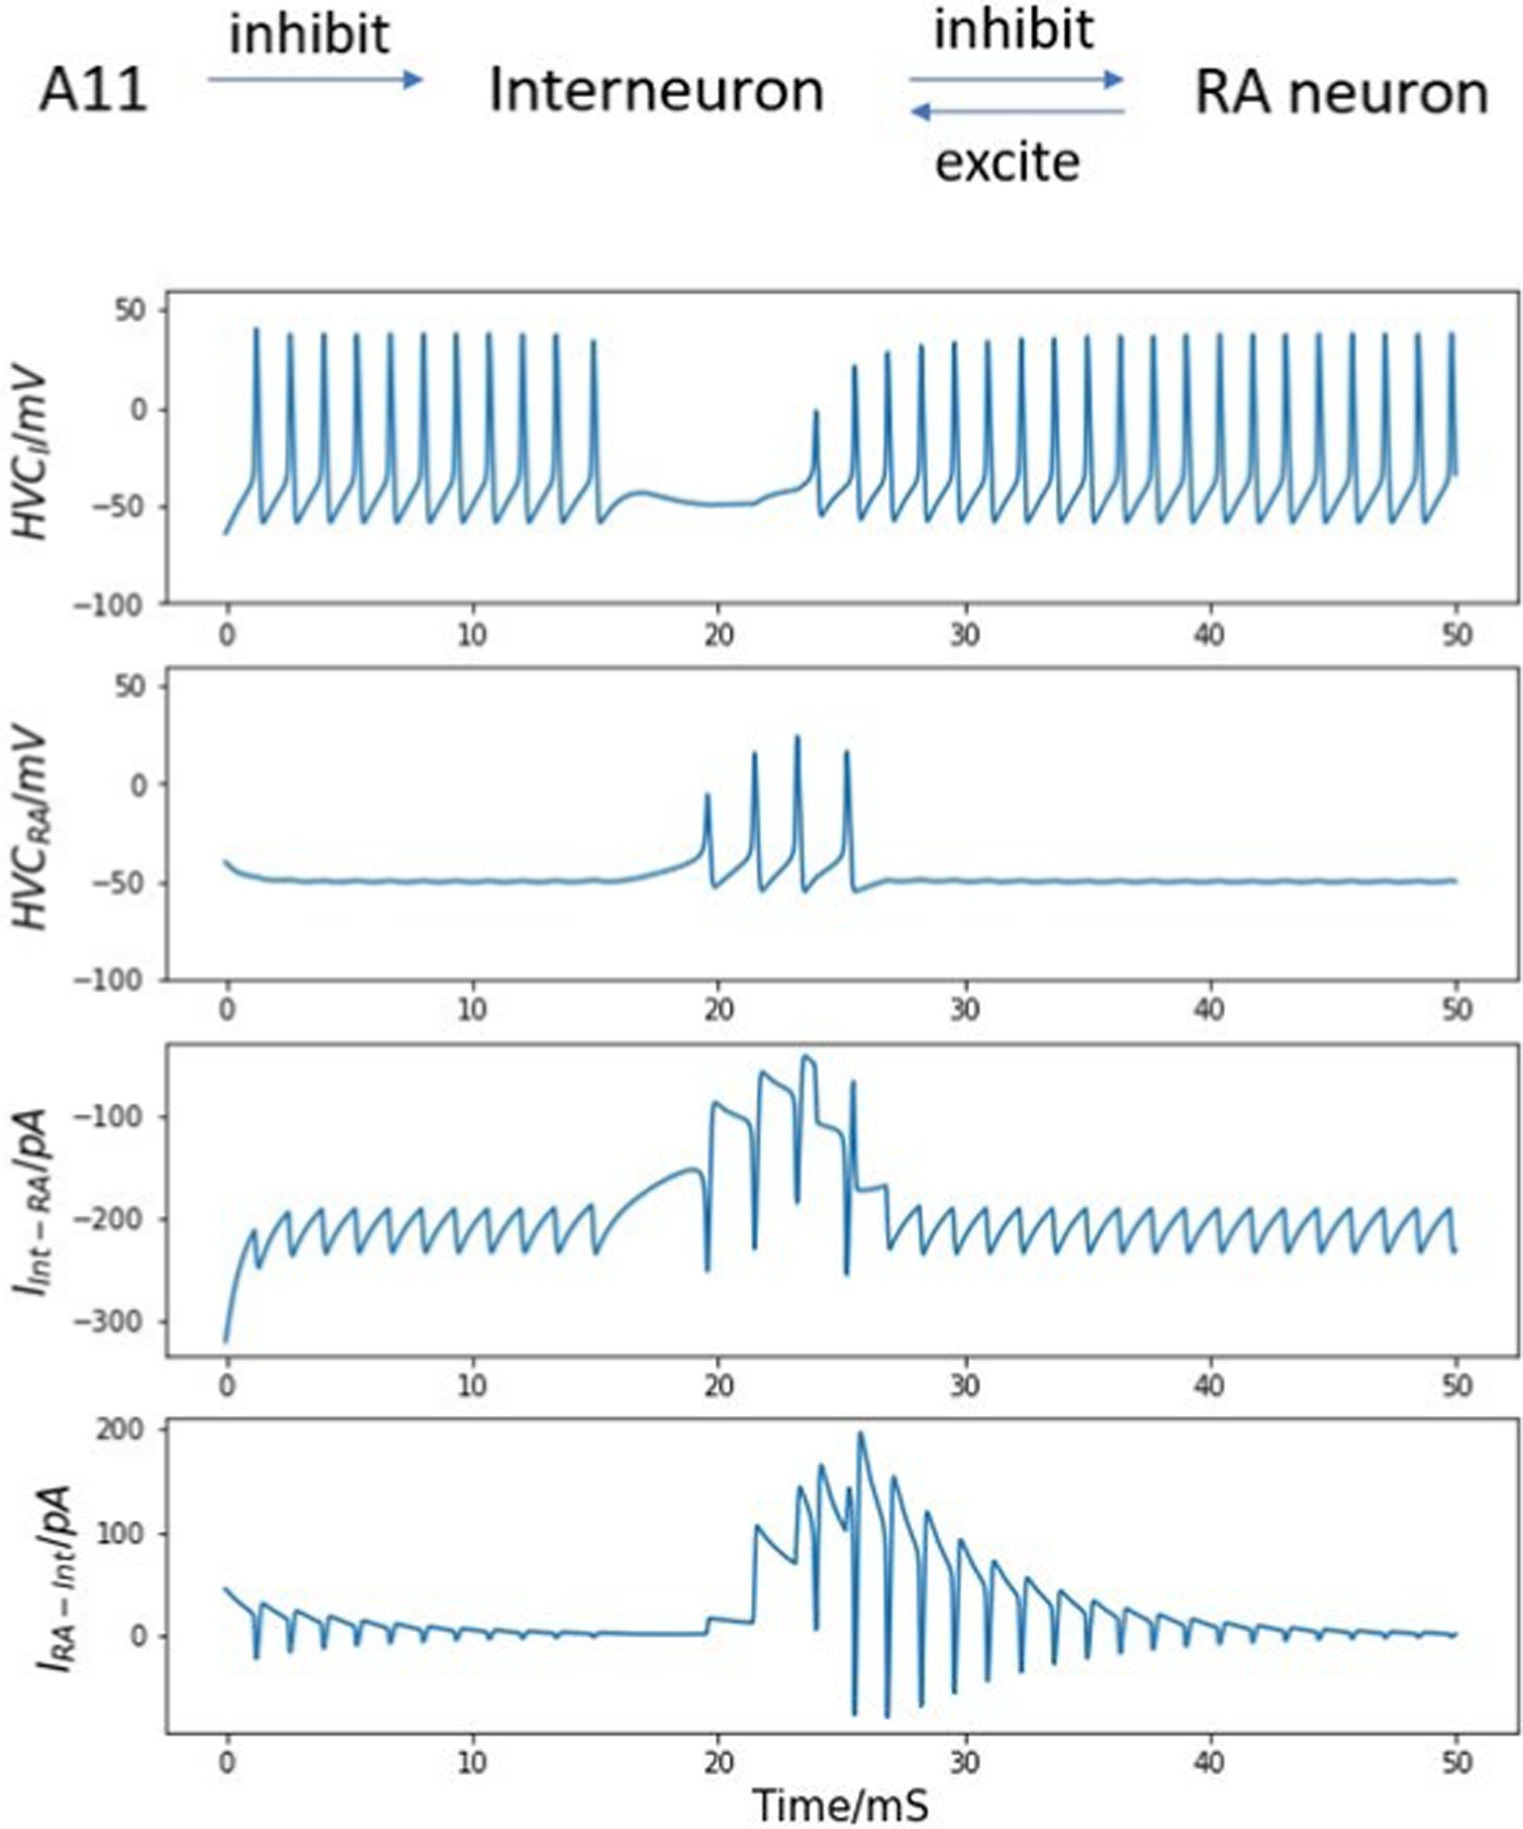
Figure 5. Bidirectional synaptic interactions between an HVCI - HVCRA neuron pair and their voltage traces. Top: synaptic connections among A11 cell group, the interneuron and the HVCRA neuron. Note bidirectional synaptic currents between the interneuron and the HVCRA neuron are included. Top center: continuous firing of the interneuron and the quiet time induced by trigger current. Center: membrane voltage of the HVCRA neuron with a single burst. After involving the reciprocal current from HVCRA neuron back to the interneuron, the burst duration and spike number match experimental observations better than that in Figure 4. Bottom center: inhibitory current from HVCI to HVCRA cell (Int represents the interneuron, and RA refers to the HVCRA neuron). Bottom: excitation connection from HVCRA back to the interneuron. See text for important details.
3.4 Building a synaptic chain
We now demonstrate how to introduce multiple excitatory neurons to build a complete synaptic chain. A first syllable from the highly stereotyped song motif from the zebra finch is used as an example, and the recorded qualitative behavior of projection neuron populations in HVC during the syllable is reproduced in this process.
A full motif contains a fixed number of syllables in an invariant sequence. Although extracellular recordings in vivo during singing confirms that each HVCRA neuron usually generates a single burst at a fixed location of one syllable during each song, multiple HVCRA neurons are observed to fire successively. During normal singing, this firing order is fixed, and the time between bursts of two HVCRA cells is also relatively stable. This phenomenon is presented in the experimental raster plot by Hahnloser et al. (2002) in Figure 6, which is compared to our modeling results in Figure 7.
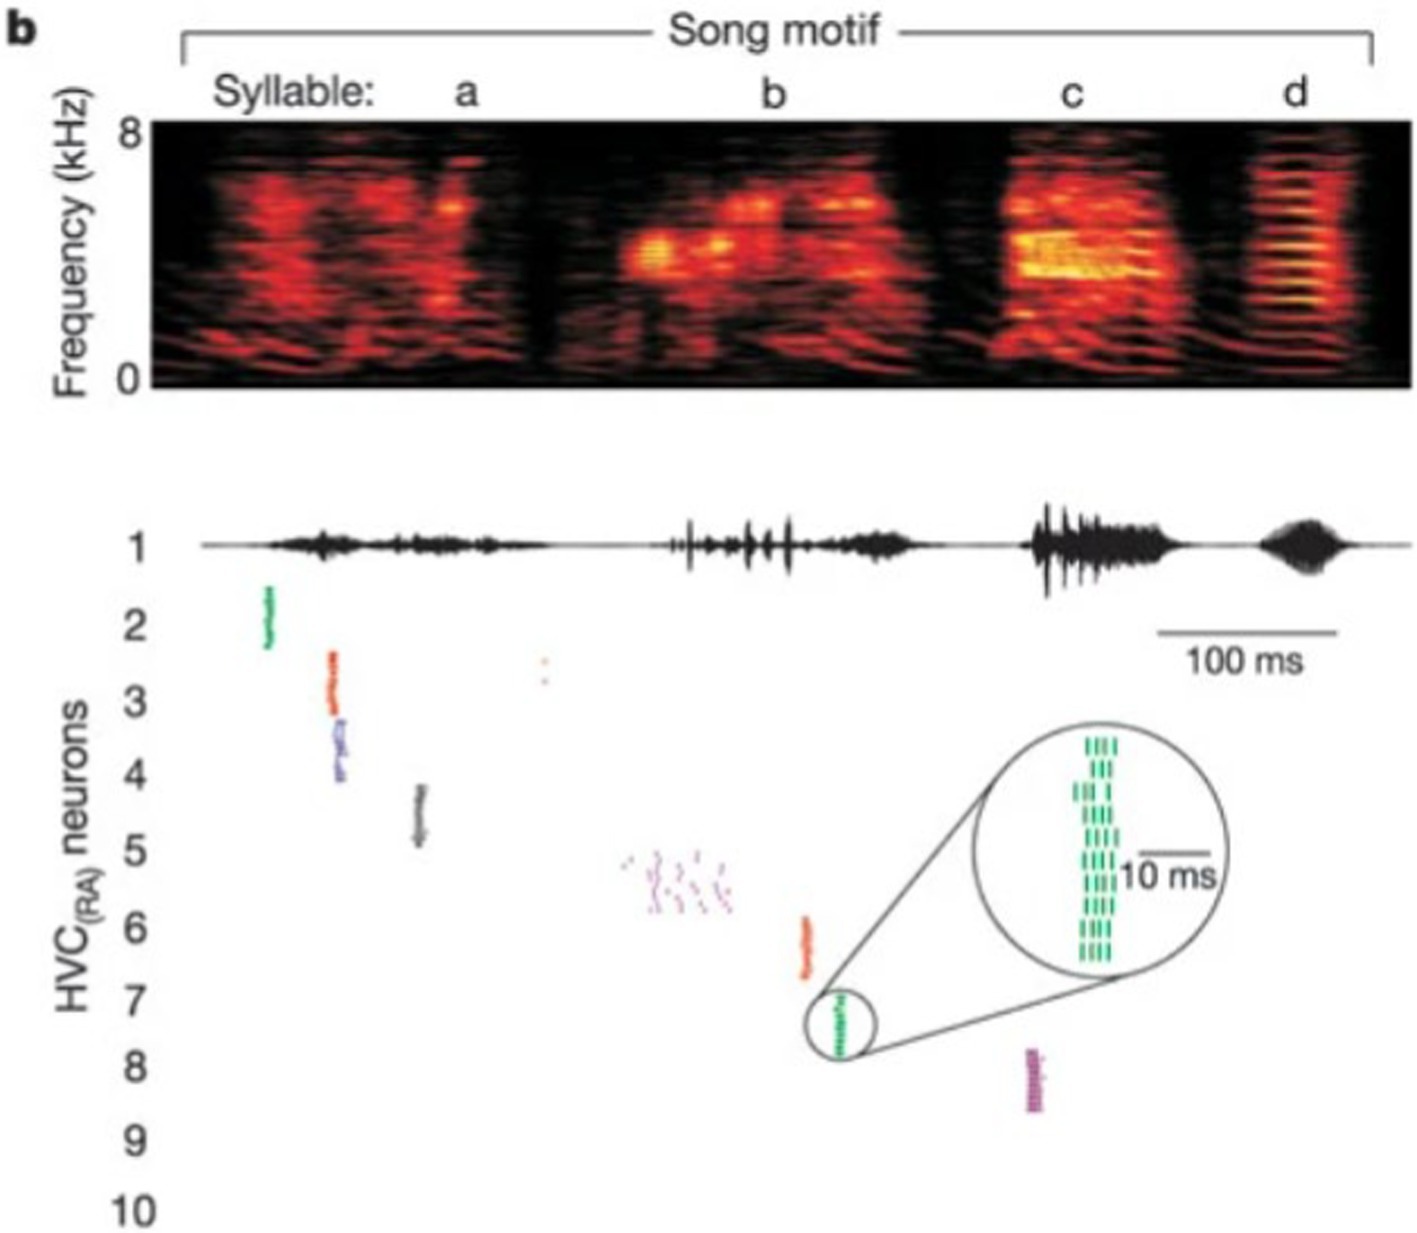
Figure 6. A raster plot of spike times of HVCRA during repeated renditions of the zebra finch motif [Reprinted from Nature by permission from Springer Nature (Hahnloser et al., 2002)]. Readers may find it of interest to compare these spiking times to the voltage plots in Figure 7.
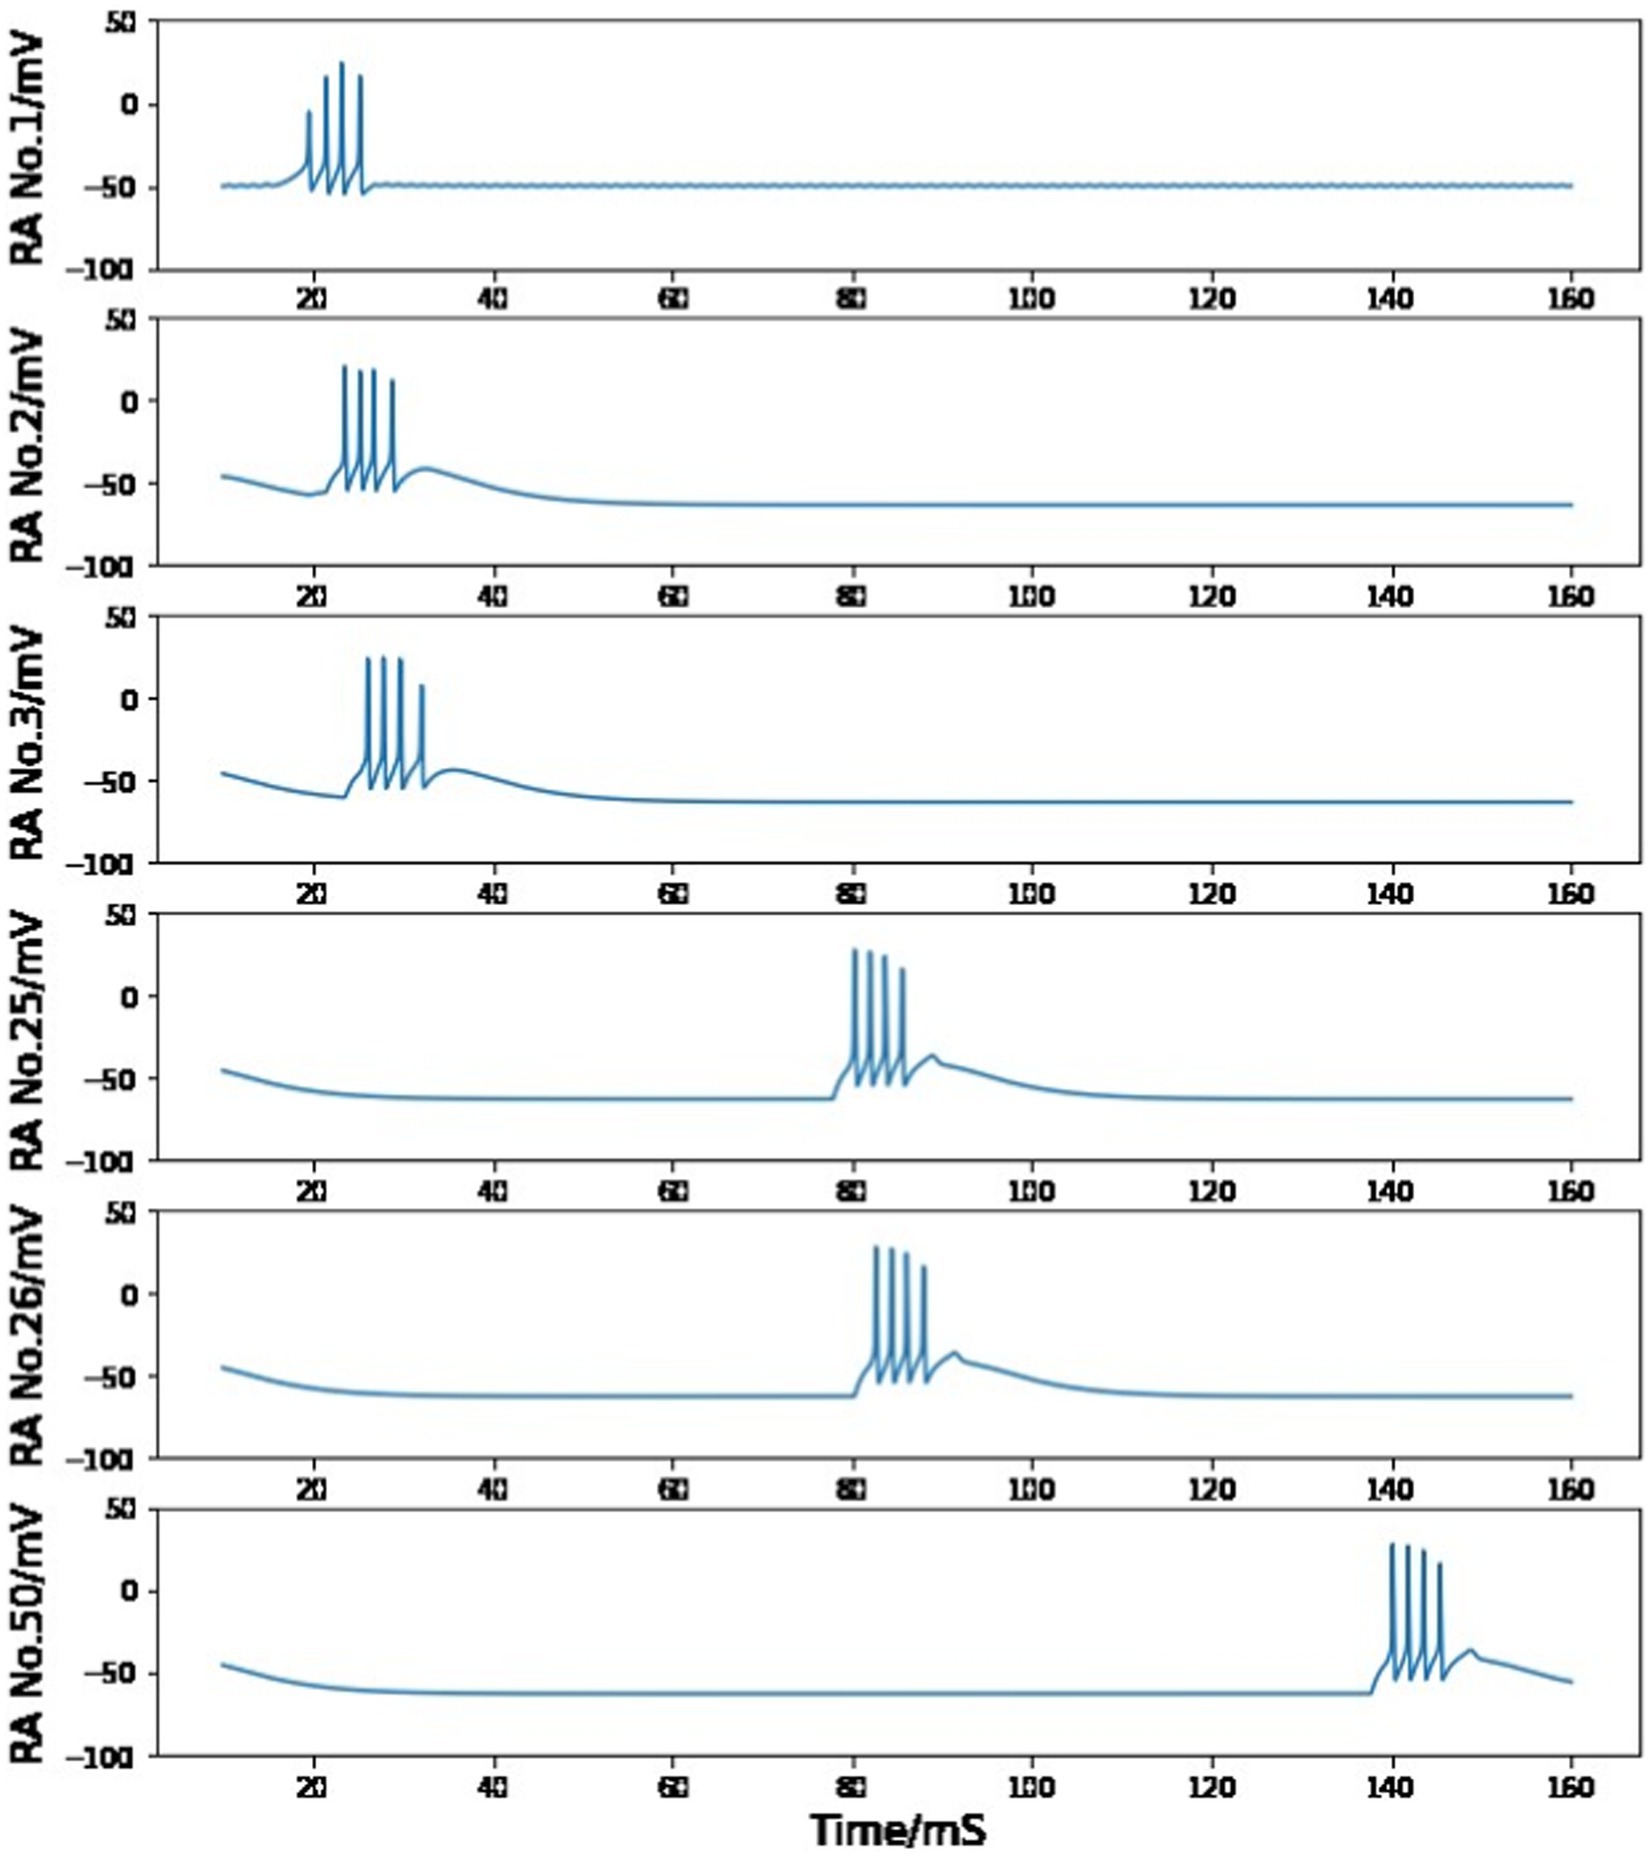
Figure 7. Simulated voltage plots of multiple HVCRA neurons during singing. The first neuron follows the same activity as the HVCRA cell in Figure 5, while this figure shows a time course of 10–160 ms. Given the trigger signal, HVCRA neuron No.2, No.25, No.26, and No.50 reproduce the measured raster plots of neuron 2–5 from Figure 6. Their burst duration, number of spikes in a burst and time intervals between two neuron bursts closely match the experimental recordings.
This chain-like propagation of spikes among various HVCRA neurons can be explained by direct connections among excitatory neurons (Figure 8). Alternatively, a propagation of silent periods among a sequence of interneurons could occur first, and then the silent time in each interneuron may allow a corresponding HVCRA neuron to burst. The prior mechanism is of higher probability since (1) it agrees with the observed high ratio (about 8:1) of HVCRA to interneuron populations in the nucleus (Armstrong and Abarbanel, 2016), (2) paired recordings show that most HVCRA cell pairs exhibit unidirectional EPSPs, but few homotypic synaptic interactions are observed among interneurons (Mooney and Prather, 2005).
In this network, the first excitatory neuron follows the same HVCI - HVCRA neuron interaction and the voltage trace in Figure 5, and passes that burst to the second HVCRA neuron by homotypic excitation current, and so on (Figure 8). Most HVCRA neurons in the chain (except for the first HVCRA neuron) do not fire spontaneously considering the general inhibitory effect from the HVCI and HVCX projecting neuron populations. Simulating the potential inhibition current from each individual neuron is beyond the scope of this paper, but we account for this phenomenon by lowering the background stimulation to 50 pA, which is known to allow those excitatory neurons to stay silent during in vitro experiments (Daou et al., 2013). The average maximal conductance of excitatory synaptic currents between two neurons is estimated to be around 7 nS, as stated in the Method section. However, if the synaptic connection strength for homotypic HVCRA cell pairs is set to 7 nS, the excitatory input would not be large enough to awake an HVCRA neuron (see the Model Robustness section for further discussions about tuning this parameter values). Therefore, the synaptic connection strength for homotypic HVCRA cell pairs is set to 8.2 nS to ensure that the postsynaptic neuron will copy the burst pattern of the presynaptic neuron. The only exception happens at the first HVCRA cell which is directly impacted by the trigger signal. The spikes in its one-time burst are relatively weak, so the value of gRA,RA for the first and second neuron is tuned to 10 nS so that the second HVCRA neuron can generate the same number of spikes.
Figure 7 shows the simulated cross-membrane voltages of the sequentially connected excitatory neural network in response to the neurotransmitter trigger signal depicted in Figure 1. The firing timings of neuron No.2, No.25, No.26, and No.50 correspond closely with the repeated electrode recordings of neuron 2–5 in the plot of Hahnloser et al. (2002) (Figure 6). During the first syllable, each HVCRA cell generates a short burst consisting of four spikes. The time span of a single burst is on the order of 10 ms, and the short (∼ 3 ms) or long (∼ 50 ms) time intervals between spikes from different neurons are also reproduced in Figure 7.
3.5 Model robustness
In our numerical simulations, most parameter values are obtained from published literatures, with two exceptions: [T]min and gRA,RA. There is no convincing analysis of the baseline concentration of neurotransmitters before the onset of a trigger signal, so we choose the [T]min value to be 0.001 mM, which is much smaller than the maximum neurotransmitter concentration [T]max. Fortunately, varying the value of the minimum neurotransmitter concentration does not change the simulation result as long as it stays positive and small compared to [T]max. In Figure 9, even if the value of [T]min increases/decreases by 10 times, the magnitude, duration, and shape of neurotransmitter dynamics stays almost the same. The only difference that is introduced by the [T]min value is the peak time of the neurotransmitter concentration from A11 axons, which has no impact on any simulation conclusions since this paper does not focus on the exact onset time of the trigger current.
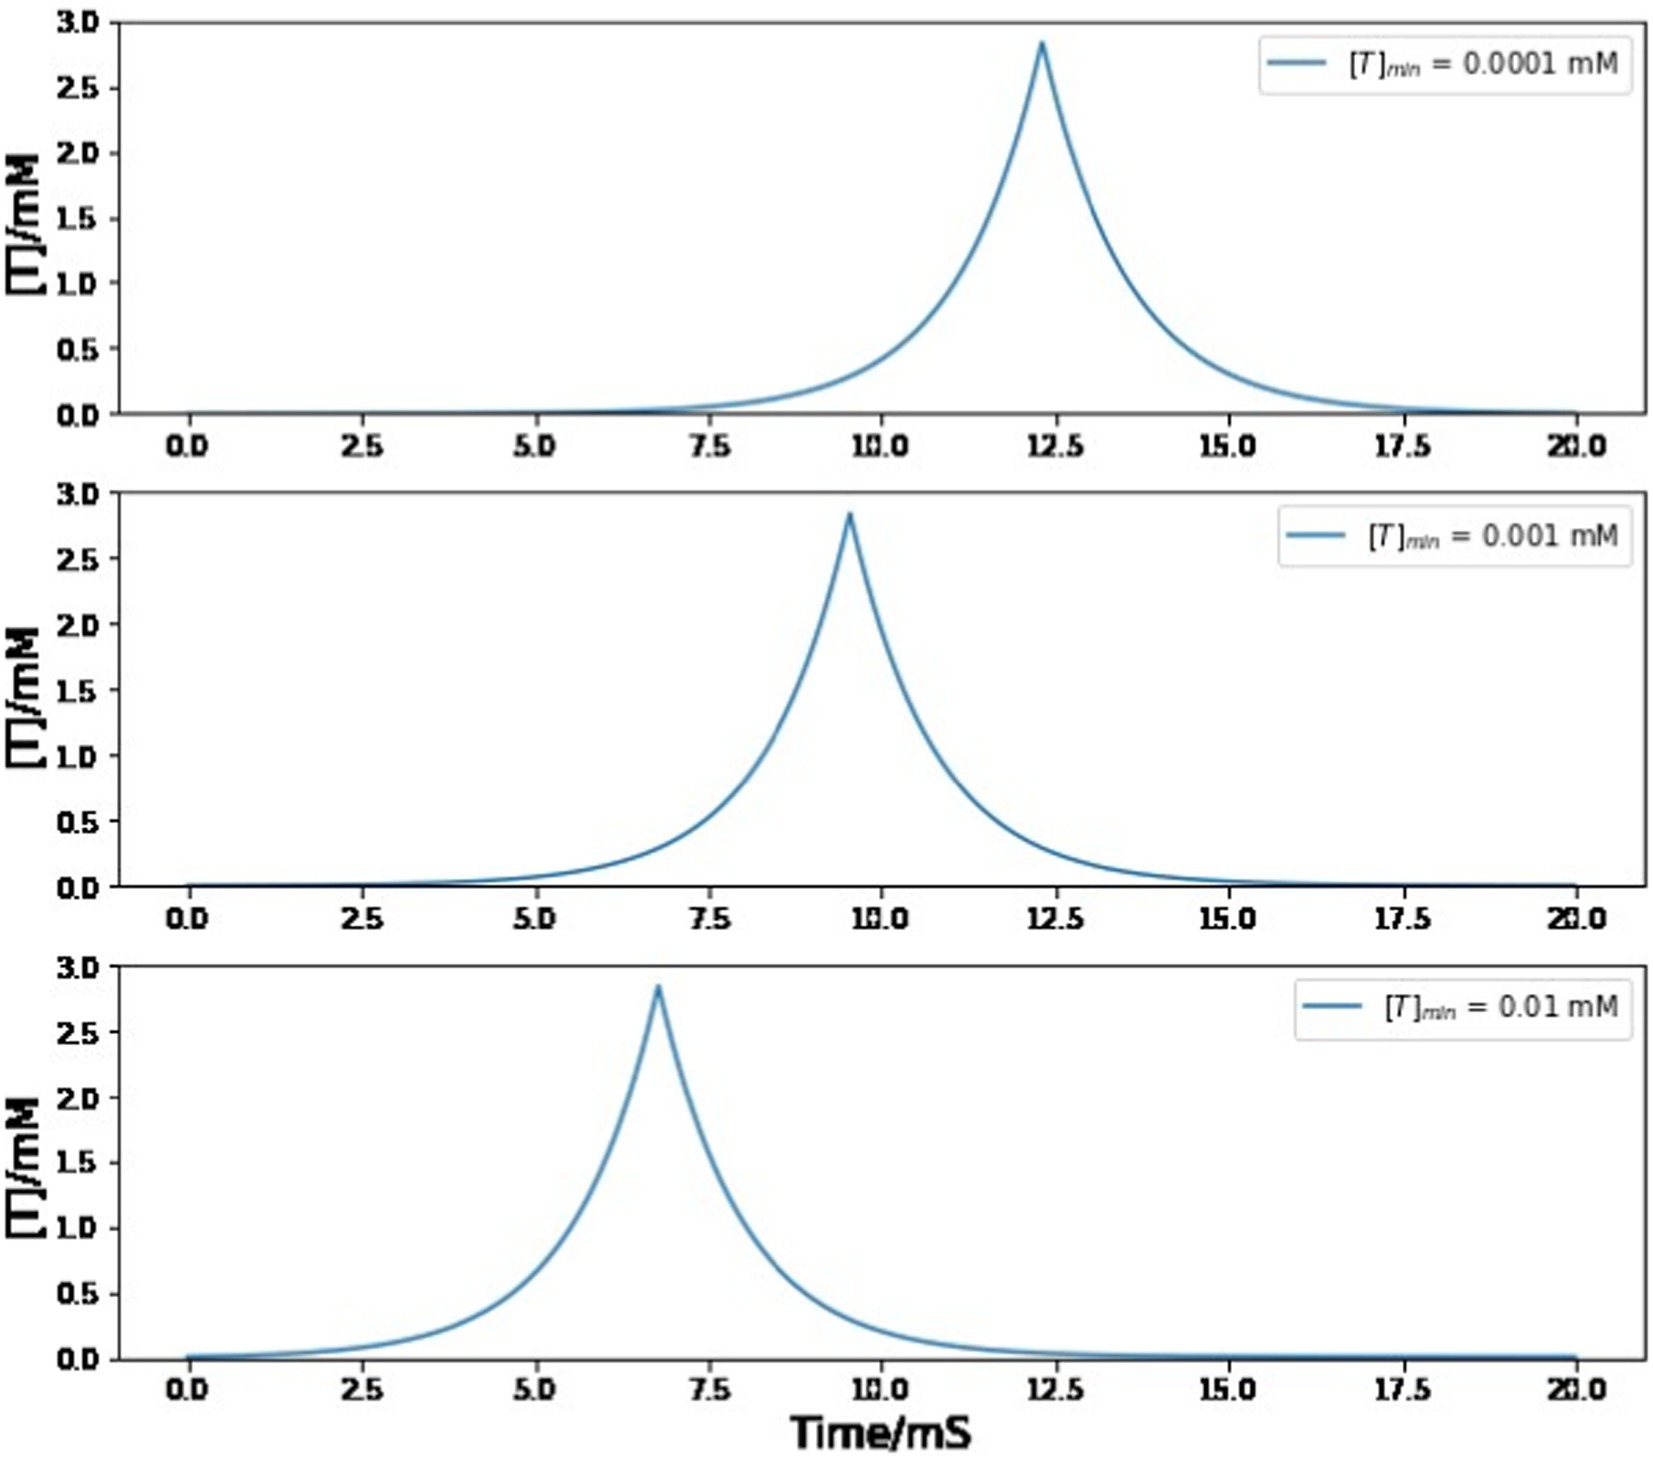
Figure 9. Simulated trajectory of neurotransmitter concentration in the synaptic cleft between A11 axons and HVC neurons under different choices of [T]min value. Varying the value of [T]min does not affect the magnitude, duration, and shape of neurotransmitter dynamics. The behavior of the neural network model exhibits considerable robustness with respect to variations in the value of [T]min.
As stated in the section Building a syllable, the value of maximum conductance for connecting the chain of HVCRA neurons is chosen to be 8.2 nS or 10 nS for the first pair of HVCRA neurons, which allows the postsynaptic cell to reproduce the burst duration and spike number of the presynaptic neuron. As discussed in the Method section, the maximal conductance of AMPA-mediated current for a single synaptic connection is measured between 0.35–1.0 nS, and there are approximately 10 synapses between a pair of connected neurons. Therefore, a reasonable value of maximum conductance should be in the range of 3.5–10 nS, which includes our proposed parameter value. Furthermore, the presynaptic HVCRA neuron will still pass its firing pattern to the postsynaptic cell if this maximum conductance varies a small portion. When the first HVCRA neuron is the presynaptic cell, gRA,RA is tuned to a larger value compared to other interactions since this neuron’s first burst spike is weaker than full firing. As long as gRA,RA stays within the range of 9.9–10.3 nS, the second HVCRA neuron will still generate four full spikes. Otherwise, the postsynaptic neuron burst will not reach four full firings if the maximum conductance is too small, or there will be a fifth miniature peak if the value is too large (See Figure 10). We select 10 nS as the modeling parameter value because it is within the reasonable value of measured maximum conductance between two neurons.
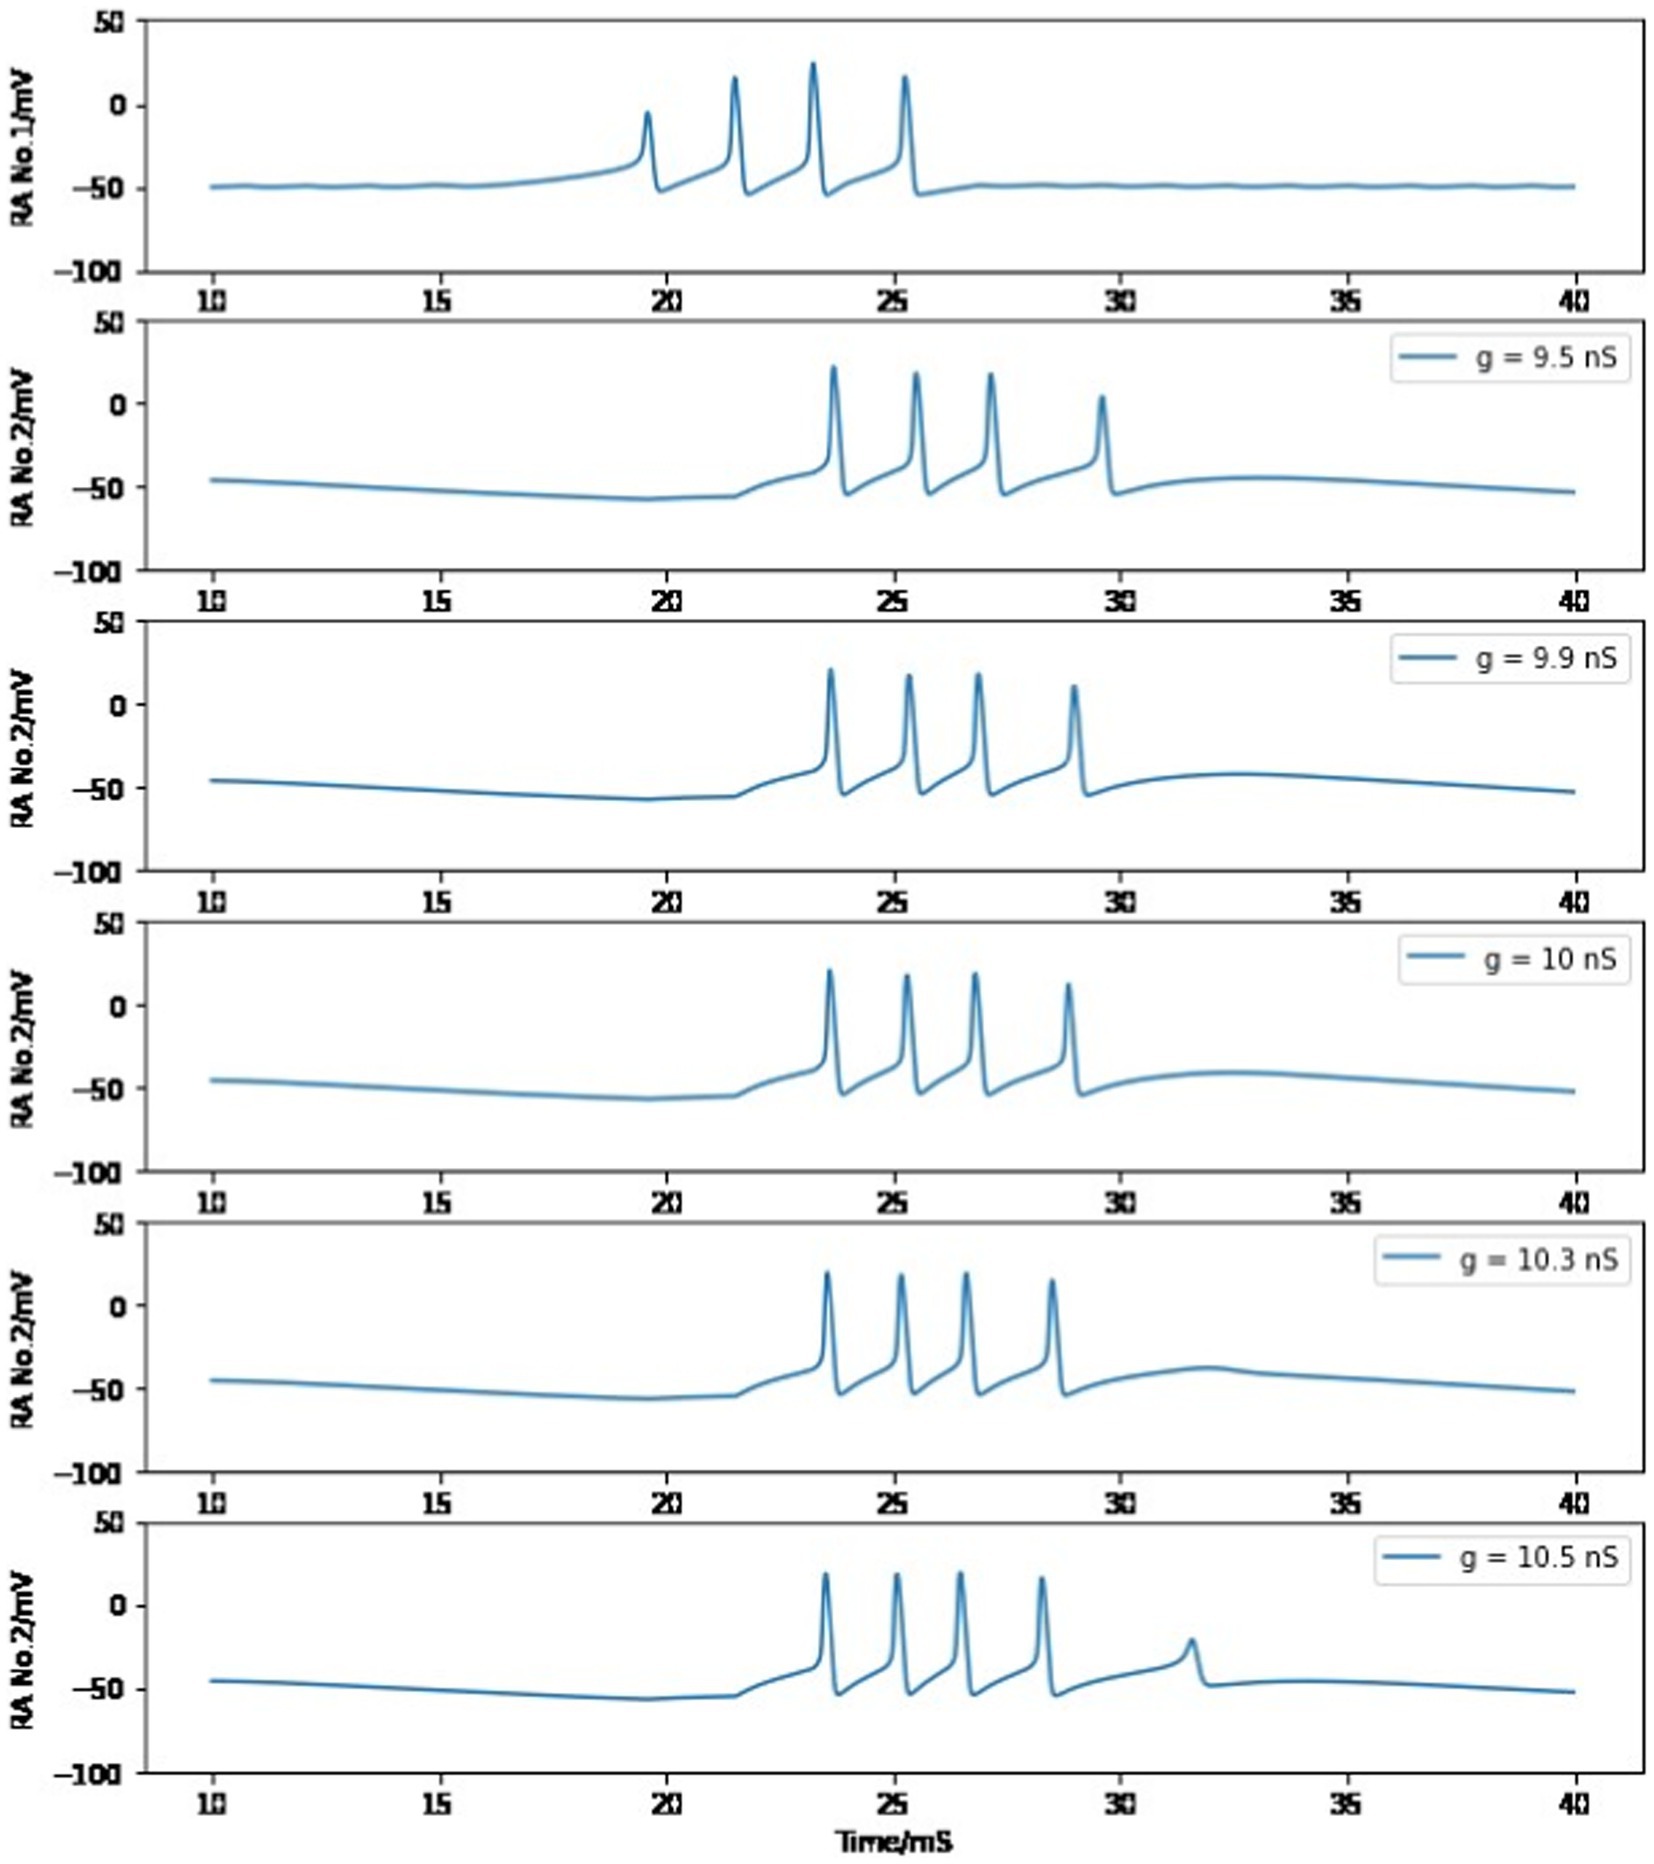
Figure 10. Simulated voltage plots of the first HVCRA neuron and the second HVCRA neuron with different values of maximum conductance for the synaptic interaction between them. See text for more information.
In the chain of HVCRA neurons after the first pair, the maximum conductance is set to 8.2 nS to ensure that the burst of four spikes can be spread by the unidirectional connections. If the value of gRA,RA is smaller than 8.18 nS, the burst will gradually disappear during this long transfer process (Figure 11); if it is larger than 8.27 nS, the burst spike number will increase as more neurons are added to this sequence of HVCRA neurons (Figure 12). The selected value of 8.2 nS for the maximum conductance in the sequence of HVCRA neurons is reasonably close to the measured median value of maximum conductance for excitatory currents, which is 7 nS.
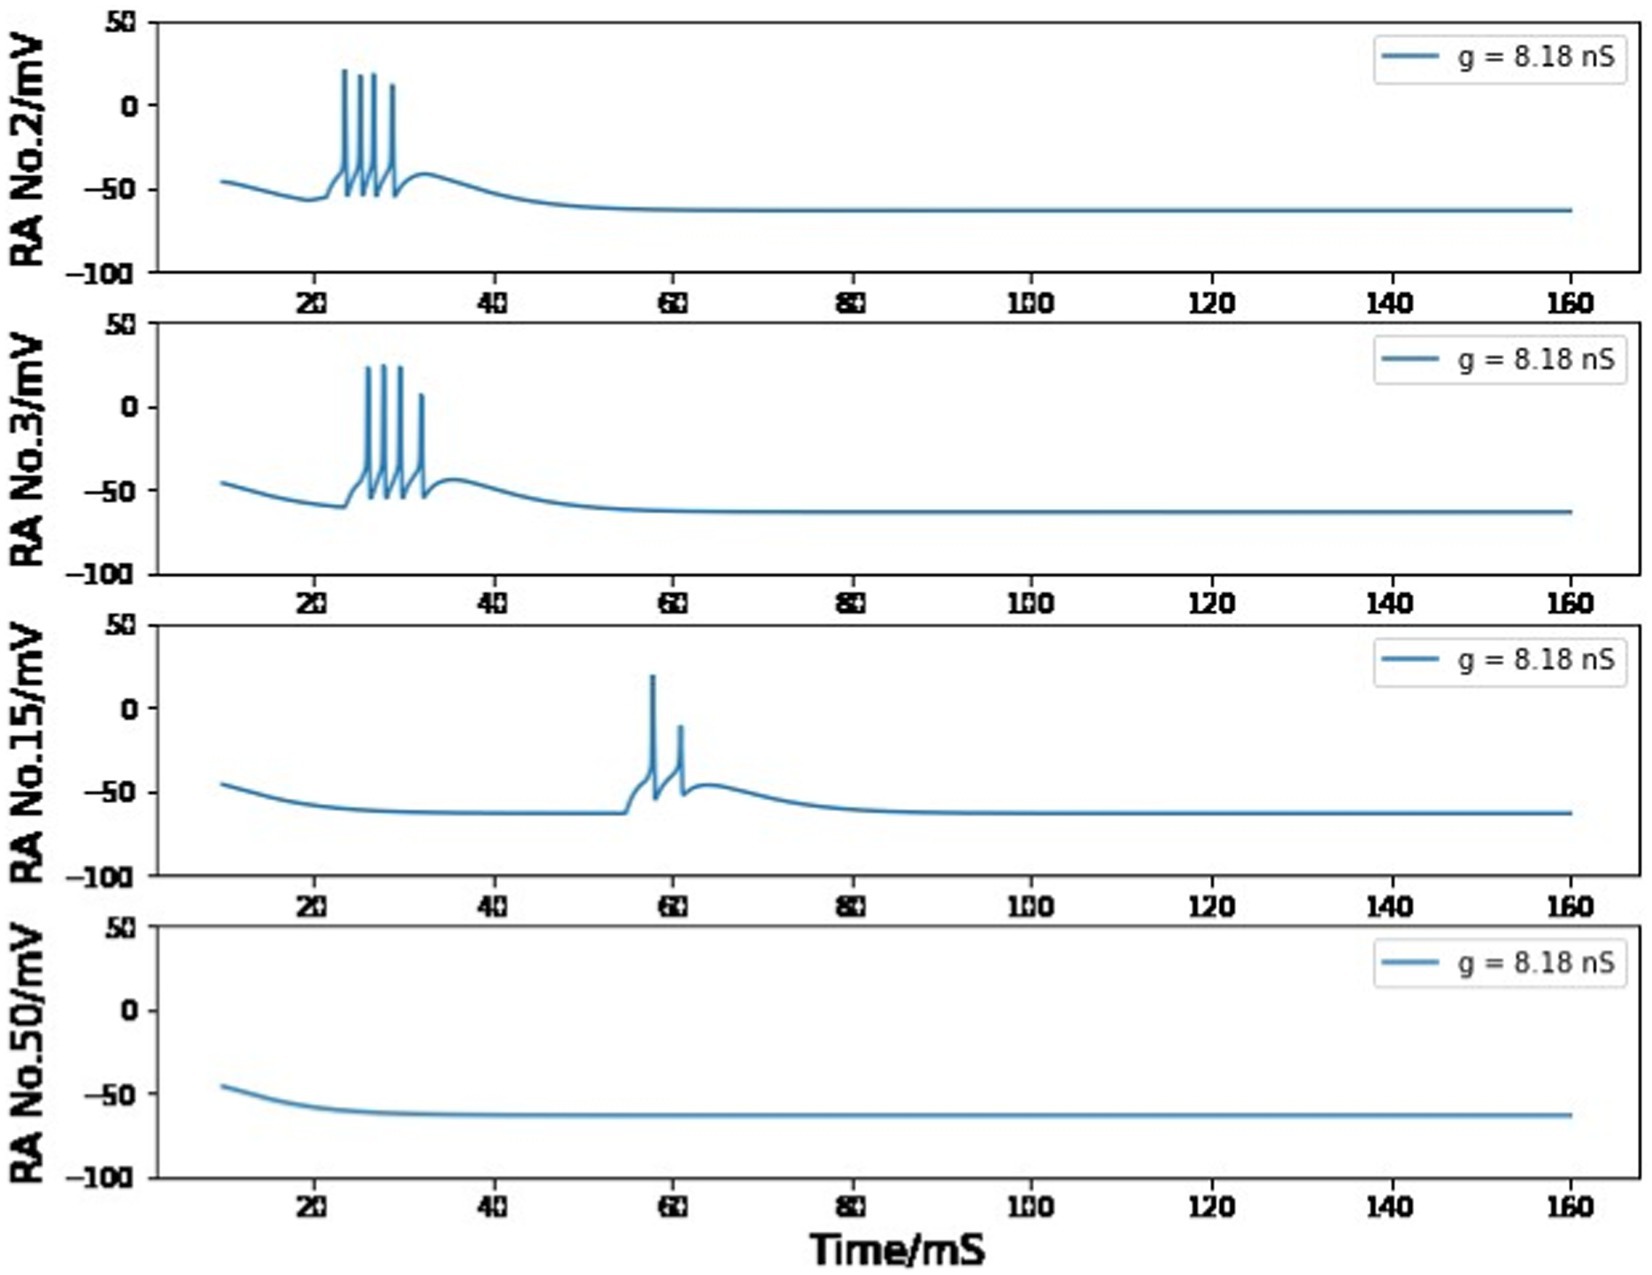
Figure 11. Simulated voltage plots of multiple HVCRA neurons during singing with gRA,RA = 8.18 nS. For the first several neurons, the postsynaptic cell is able to copy the burst behavior of the presynaptic neuron, but this one-time burst gradually disappears as it is passed through more synaptic connections.
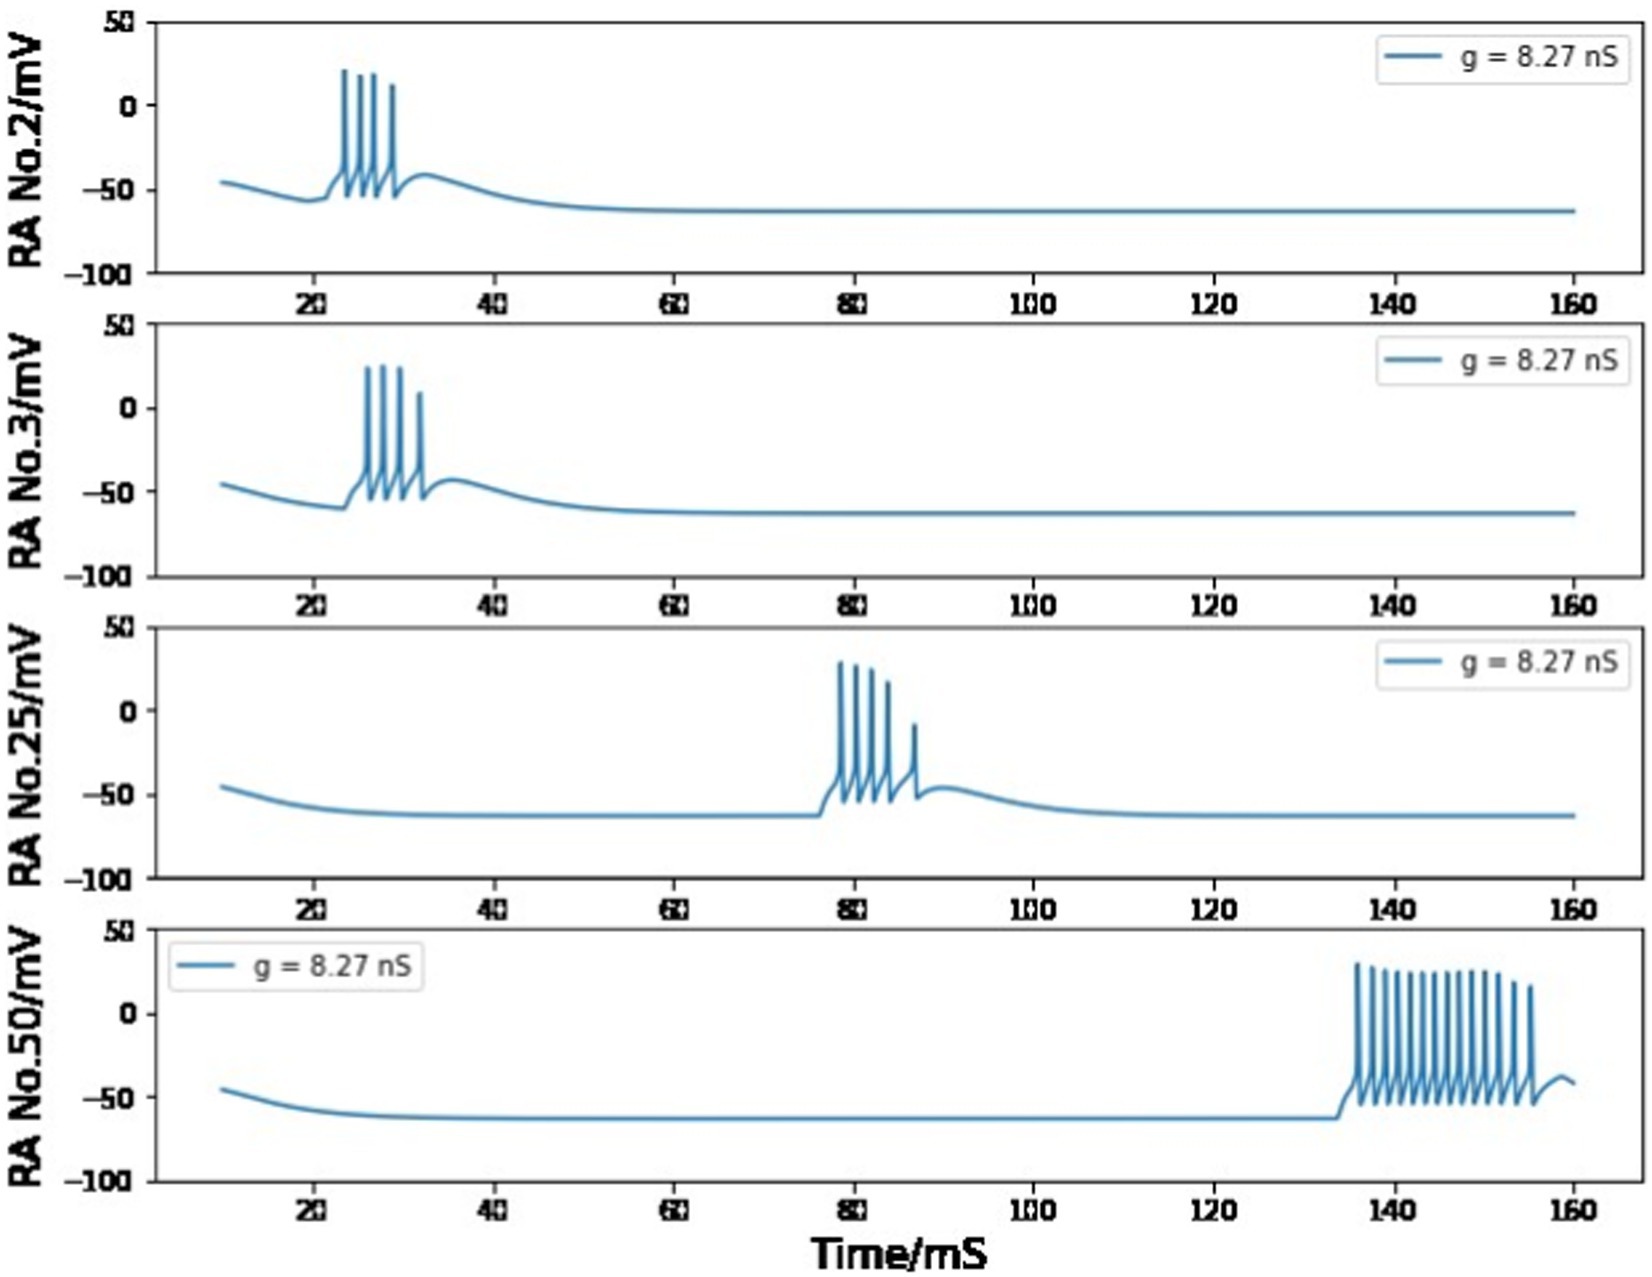
Figure 12. Simulated voltage plots of multiple HVCRA neurons during singing with gRA,RA = 8.27 nS. For the first several neurons, the postsynaptic cell is able to copy the burst behavior of the presynaptic neuron, but more spikes are added to the burst because of the strong synaptic interaction strength.
However, if we only care about one pair of HVCRA neurons, the voltage trace of the postsynaptic cell will still be very similar to the presynaptic one when gRA,RA = stays in the range of 8.1–8.3 nS. Moreover, if the maximum conductance value of each HVCRA - HVCRA neuron pair is distributed uniformly between 8.1 nS and 8.3 nS, the neuron behavior and model conclusion will not be changed (see Figure 13).
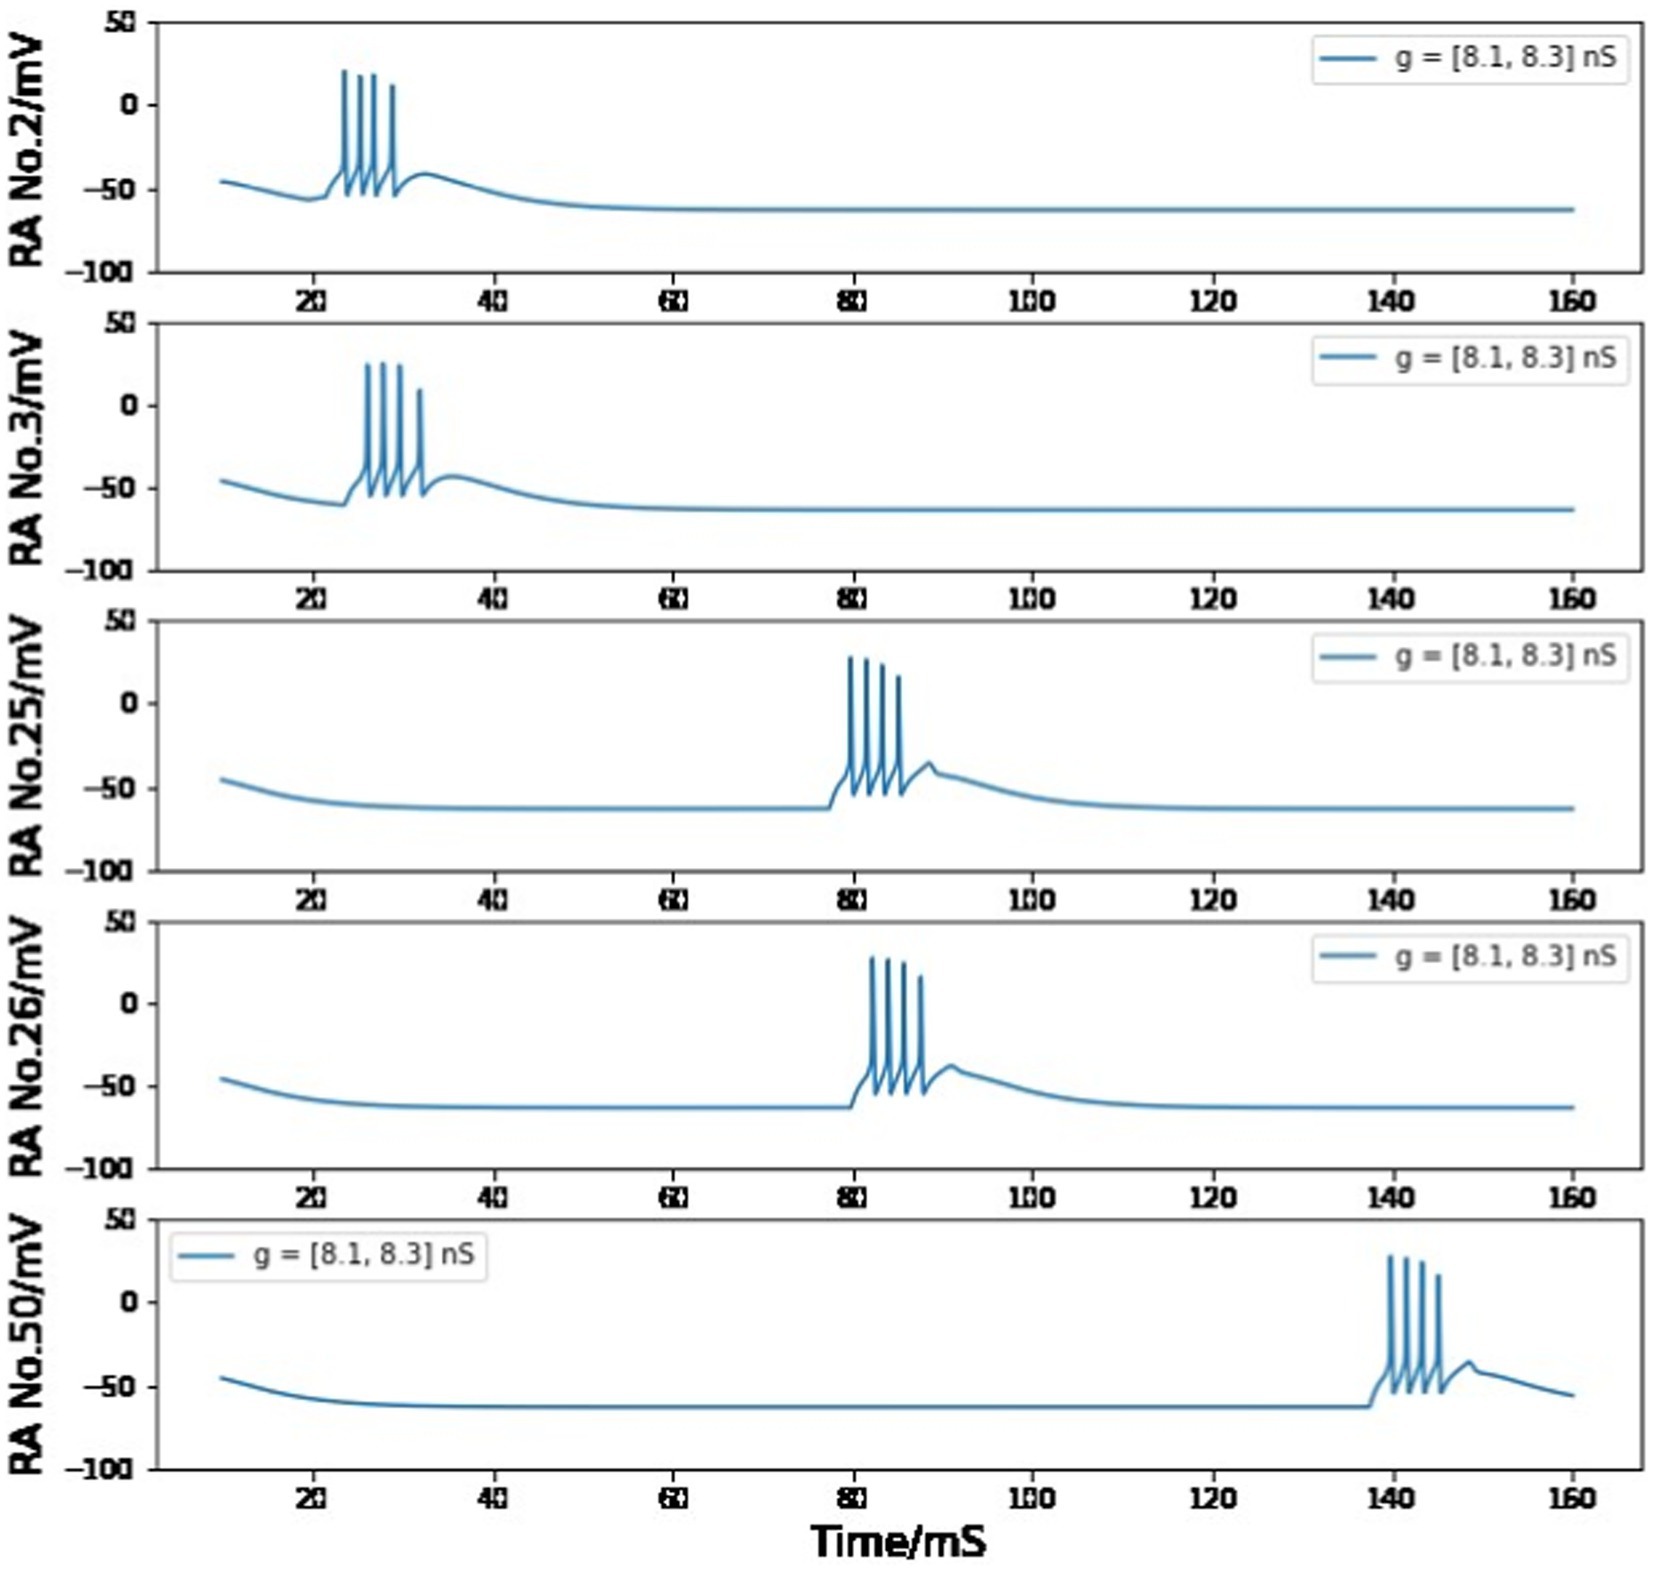
Figure 13. Simulated voltage plots of multiple HVCRA neurons during singing as the value of gRA,RA for each synaptic interaction is evenly distributed in the range of 8.1–8.3 nS. The firing patterns of all neurons are similar to Figure 7 from Building a syllable section.
4 Discussion
This paper has described a HVC neural network model consisting of single neuron models of HVCI and HVCRA neurons in the HVC nucleus, as well as synaptic current equations and a trigger signal model based on Ben-Tov et al. (2023). We began with single neuron models describing fundamental ion channels in the HVCRA and HVCI neurons, and showed that the HVCRA neuron fired continuously under a background current above its experimental threshold. After introducing an inhibitory connection from the interneuron to the HVCRA neuron, this HVCRA neuron became silent, which was expected in the absence of singing behavior. Then, the current from A11 cell group to HVC allows the interneuron model to reproduce the continuous firing with intermittent pauses reminiscent of the HVCRA neurons during song production. Now, the HVCRA neuron was able to generate a burst, but the burst duration and spike quantity initially did not match experimental observations. This mismatch was resolved after the excitatory interaction from the HVCRA neuron back to the interneuron was added to the circuit, which suggested that the bidirectional connections in the HVCRA-HVCI neuron pair observed in vitro might be necessary to maintain the firing pattern of neurons in this nucleus. Finally, more HVCRA neurons were included in a chain configuration, successfully reproducing the time-locked sequential burst from multiple HVCRA neurons during a syllable. All but one of the parameters in the single neuron models and synaptic current models were backed by other simulation or experimental papers. The only parameter that was fine-tuned was the maximal conductance of synaptic current between two HVCRA neurons. In the Results section, we discussed the possible range for the parameter and showed that the fine-tuned value fell within the measured range of maximal conductances for excitatory synaptic currents.
The model could be further applied to describing the functions and dynamics of HVC neurons in other songbirds such as Bengalese Finch or canary (Clayton, 1987; Brenowitz et al., 1997). The fine-tuned parameter in the synaptic current model may also provide a reference for synaptic coupling strength in the avian brain. Our work in this paper offers tools to understand the dynamics of HVC and its function as a song motor in the avian song system.
4.1 Another type of projecting neurons
Our model focuses exclusively on HVCRA projecting neurons as well as interneurons which serve as an important coordination for projecting neurons to function properly. This network does not include HVCX projecting neurons, a third major type of neurons in this region. HVCX neurons projects onto area X, which in turn give rise to the anterior forebrain pathway (Mooney, 2009). The synaptic connections from HVCX to HVCRA neurons are detected but relatively less frequently than the connections from HVCI to HVCRA neurons. The chance that the spike-evoked responses from HVCX to HVCRA cells are hyperpolarizing or depolarizing are approximately the same (Mooney, 2009). Moreover, induced death of HVCX neurons does not significantly alter neuronal recruitment or song productions in adult zebra finches (Scharff et al., 2000). Therefore, the role of HVCX neurons in coordinating HVCRA neuron behavior may be not as critical as interneurons, and it is beyond the scope of this paper to address alternative detailed network structures involving all three major populations of neurons, resulting in the requirement for further observations and studies.
4.2 Possible additional ion currents
Previous studies have proposed several models of individual HVCRA neurons and interneurons. These models contains different combinations of ion currents, as well as different equations and parameters for each ion current (Jin et al., 2007; Daou et al., 2013; Breen et al., 2016; Kadakia et al., 2016; Armstrong and Abarbanel, 2016). Our single neuron models are adapted from earlier works. Each neuron model in this paper includes only the basic ion channels which previous papers agree to be important for that specific neuron type. Follow-up work may examine additional possible ion currents such as A-type potassium current, high-threshold L-type calcium current, persistent sodium current, and calcium dependent potassium current.
4.3 Previous models of HVC sequence generation
In a previous model of sequence generation by HVCRA neurons, Jin proposed that the burst sequence is generated by a synburst chain within the HVCRA population alone (Jin, 2007). The model assumes that HVCRA neurons are intrinsically bursting, and the burst durations are set by cellular properties. Burst sequences generated from the model are similar to those observed in HVC. However, the paper assumes that the burst sequences are not driven by input from any upstream brain areas, and it does not address how to initiate the spiking activities in the chain of neurons. The paper claims that its intrinsic bursting model improves the spike robustness against synaptic connectivity strength. However, most parameters proposed in this neural network model do not have experimental or simulation evidence to validate their plausibility, and the improvement of robustness has only been tested based on the proposed group of parameters. The model also neglects the influence of interneurons on the HVCRA population.
Cannon et al. (2015) describes a feedforward excitatory chain model with local feedback inhibition, designed to generate stereotyped neural sequences. The model integrates inhibition into the series propagation of HVCRA neuron activations, but the proposed integration mechanism is carefully engineered without biophysical motivations. The individual neurons are modeled using quadratic integrate-and-fire equations. The excitatory and inhibitory post-synaptic current equations are independent of pre-synaptic voltages. The paper does not intend to describe HVC neurons and their connections in biological details, so most parameter values employed in this model lack experimental validation and are chosen primarily to ensure the functionality of the model.
A more recent model reproduces the observed series of HVCRA activities by introducing a small neuronal loop capable of transitioning between an “active” and “quiescence” state (Armstrong and Abarbanel, 2016). Multiple neural loops are arrayed in a chain, stimulated in sequence to excite an “active” state that propagates down the chain. The mechanism of connectivity between two neuronal loops and the method of achieving a sequence of ‘active’ states is unspecified. Certain parameter values lack experimental or simulation evidence to support their reasonability, and the sensitivity of the modeling results upon those parameter values has not been examined.
4.4 Building a complete song
In this paper we consider what happens when the neural network is exposed to a neurotransmitter pulse induced by a male zebra finch’s need to attract a female, and the injected neurotransmitters start the first syllable of a motif. It is interesting to further examine the plausibility of generating a complete song following similar neuromodulator mechanisms. Each bird’s whole song comprises an average of 12 harmonic syllables of around 80–200 ms each in duration (Woolley et al., 2010; Glaze and Troyer, 2016). Within our framework, the full motif could be explained by a chain-like propagation linking HVCRA to HVCRA neurons, similar to how to construct the first syllable. This continuous synaptic architecture within HVC agrees with the observation that local HVC circuit connectivity contains sufficient information to propagate throughout the song sequence during sleep replay (Elmaleh et al., 2021). Since HVC is responsible for temporal order rather than sound of syllables (Fee and Scharff, 2010, Long and Fee, 2008; Simpson and Vicario, 1990), we do not worry about how to generate acoustic features for different syllables.
An alternative scenario would be that the active series of syllables is achieved by sequentially arrived neuromodulator from A11 axons. Even though the excitatory synaptic connections between HVCRA neurons simulate the distributed bursts inside one syllable, it is possible that each syllable represents a relatively independent structure in the nucleus. During experiments of singing interruption, individual syllables are more robust than the full song: direct electrical interference is necessary to interrupt a syllable, but ongoing motif can be interrupted by noninvasive techniques such as strobe light (Cynx, 1990; Armstrong and Abarbanel, 2016). Experimental results also show that the thalamic axon activity is critical for starting the following syllable but no for completing the ongoing syllable (Moll et al., 2023). These evidences suggest that the connectivity among syllables may follow a different mechanism from the direct synaptic interactions. We speculate that a neural feedback loop involving other nucleus may activate a succession release of neurotransmitters, which triggers multiple syllables to play a whole motif.
Another alternative to achieve a full song would be that the neurotransmitters diffuse and arrive at different parts of HVC sequentially. In this case, the microcircuits of neurons responsible for their own syllables are located at different locations throughout the nucleus. The triggering neurotransmitters are released from the A11 axons all at once and then diffuse within HVC, activating spatial organized microcircuits to sing each syllable sequentially.
4.5 Learning
Multiple HVC neurons of different types form correlational connectivity to ensure the functionality of the nucleus. How could neurons in junior zebra finches develop this cooperation during learning? One possibility is that these neurons adapt both spatial organization and synaptic plasticity to achieve bird’s own song. There is evidence of directed neural networks within the HVC matures during sensorimotor learning (Day et al., 2013), which indicates the existence of spatial organization development. Neurons in the HVC also regulate their ion channel conductances over the arc of development (Daou and Margoliash, 2020), suggesting that the strength of synaptic currents may also covary during vocalization development.
Data availability statement
The raw data supporting the conclusions of this article will be made available by the authors, without undue reservation.
Author contributions
PX: Writing – original draft, Writing – review & editing. HA: Conceptualization, Data curation, Formal analysis, Funding acquisition, Investigation, Methodology, Project administration, Resources, Software, Supervision, Validation, Visualization, Writing – original draft.
Funding
The author(s) declare financial support was received for the research, authorship, and/or publication of this article. The research was funded by the National Institutes of Health (NIH) under Federal Award No. 1 UF1NS115821.
Acknowledgments
We appreciate Dr. Arij Daou and Prof. Richard Mooney for enlightening explanations and perspectives in terms of biology and experiments. Thanks also to Prof. Nigel Goldenfeld and Prof. Elena Koslover for valuable guidance on model improvement, presentation, and writing. Content of the manuscript have previously appeared in a thesis (Xia, 2023).
Conflict of interest
The authors declare that the research was conducted in the absence of any commercial or financial relationships that could be construed as a potential conflict of interest.
Publisher’s note
All claims expressed in this article are solely those of the authors and do not necessarily represent those of their affiliated organizations, or those of the publisher, the editors and the reviewers. Any product that may be evaluated in this article, or claim that may be made by its manufacturer, is not guaranteed or endorsed by the publisher.
References
Armstrong, E., and Abarbanel, H. D. (2016). Model of the songbird nucleus HVC as a network of central pattern generators. J. Neurophysiol. 116, 2405–2419. doi: 10.1152/jn.00438.2016
Bard Ermentrout, G. B., and Terman, D. H. (2010). Mathematical foundations of neuroscience. New York: Springer Science & Business Media. 35, 331–367.
Ben-Tov, M., Duarte, F., and Mooney, R. (2023). A neural hub for holistic courtship displays. Curr. Biol. 33, 1640–1653.e5. doi: 10.1016/j.cub.2023.02.072
Bolhuis, J. J., Okanoya, K., and Scharff, C. (2010). Twitter evolution: converging mechanisms in birdsong and human speech. Nat. Rev. Neurosci. 11, 747–759. doi: 10.1038/nrn2931
Börgers, C., and Kopell, N. (2005). Effects of noisy drive on rhythms in networks of excitatory and inhibitory neurons. Neural Comput. 17, 557–608. doi: 10.1162/0899766053019908
Breen, D, Shirman, D, Armstrong, E, Kadakia, N, and Abarbanel, H. (2016). HVC-I neuron properties from statistical data assimilation. arXiv:1608.04433 [q-bio.NC]. doi: 10.48550/arXiv.1608.04433
Brenowitz, E. A., Margoliash, D., and Nordeen, K. W. (1997). An introduction to birdsong and the avian song system. J. Neurobiol. 33, 517–531. doi: 10.1002/(SICI)1097-4695(19971105)33:5<495::AID-NEU1>3.3.CO;2-D
Burgard, E. C., and Hablitz, J. J. (1993). NMDA receptor-mediated components of miniature excitatory synaptic currents in developing rat neocortex. J. Neurophysiol. 70, 1841–1852. doi: 10.1152/jn.1993.70.5.1841
Cannon, J., Kopell, N., Gardner, T., and Markowitz, J. (2015). Neural sequence generation using spatiotemporal patterns of inhibition. PLoS Comput. Biol. 11:e1004581.
Clayton, N. S. (1987). Song learning in Bengalese finches: a comparison with Zebra finches. Ethology 76, 247–255. doi: 10.1111/j.1439-0310.1987.tb00687.x
Clements, J. D., Lester, R. A. J., Tong, G., Jahr, C. E., and Westbrook, G. L. (1992). The time course of glutamate in the synaptic cleft. Science 258, 1498–1501. doi: 10.1126/science.1359647
Colquitt, B. M., Merullo, D. P., Konopka, G., Roberts, T. F., and Brainard, M. S. (2021). Cellular transcriptomics reveals evolutionary identities of songbird vocal circuits. Science 371:eabd9704. doi: 10.1126/science.abd9704
Cynx, J. (1990). Experimental determination of a unit of song production in the zebra finch (Taeniopygia guttata). J. Comp. Psychol. 104, 303–308. doi: 10.1037//0735-7036.104.1.3
da Silva, J. A., Tecuapetla, F., Paixão, V., and Costa, R. M. (2018). Dopamine neuron activity before action initiation gates and invigorates future movements. Nature 554, 244–248. doi: 10.1038/nature25457
Daou, A., and Margoliash, D. (2020). Intrinsic neuronal properties represent song and error in zebra finch vocal learning. Nat. Commun. 11:952. doi: 10.1038/s41467-020-14738-7
Daou, A., Ross, M. T., Johnson, F., Hyson, R. L., and Bertram, R. (2013). Electrophysiological characterization and computational models of HVC neurons in the zebra finch. J. Neurophysiol. 110, 1227–1245. doi: 10.1152/jn.00162.2013
Day, N. F., Terleski, K. L., Nykamp, D. Q., and Nick, T. A. (2013). Directed functional connectivity matures with motor learning in a cortical pattern generator. J. Neurophysiol. 109, 913–923. doi: 10.1152/jn.00937.2012
De Koninck, Y., and Mody, I. (1994). Noise analysis of miniature IPSCs in adult rat brain slices: properties and modulation of synaptic GABAA receptor channels. J. Neurophysiol. 71, 1318–1335. doi: 10.1152/jn.1994.71.4.1318
Deregnaucourt, S., Mitra, P. P., Feher, O., Pytte, C., and Tchernichovski, O. (2005). How sleep affects the developmental learning of bird song. Nature 433, 710–716. doi: 10.1038/nature03275
Destexhe, A., Mainen, Z. F., and Sejnowski, T. J. (1994). Synthesis of models for excitable membranes, synaptic transmission and neuromodulation using a common kinetic formalism. J. Comput. Neurosci. 1, 195–230. doi: 10.1007/BF00961734
Destexhe, A., and Sejnowski, T. J. (2001). Thalamocortical assemblies: How ion channels, single neurons and large-scale networks organize sleep oscillations. Oxford, UK: Oxford University Press.
Doupe, A. J., and Kuhl, P. K. (1999). Birdsong and human speech: common themes and mechanisms. Annu. Rev. Neurosci. 22, 567–631. doi: 10.1146/annurev.neuro.22.1.567
Elmaleh, M., Kranz, D., Asensio, A. C., Moll, F. W., and Long, M. A. (2021). Sleep replay reveals premotor circuit structure for a skilled behavior. Neuron 109, 3851–3861.e4. doi: 10.1016/j.neuron.2021.09.021
Fee, M. S., and Goldberg, J. H. (2011). A hypothesis for basal ganglia-dependent reinforcement learning in the songbird. Neuroscience 198, 152–170. doi: 10.1016/j.neuroscience.2011.09.069
Fee, M. S., and Scharff, C. (2010). The songbird as a model for the generation and learning of complex sequential behaviors. ILAR J. 51, 362–377. doi: 10.1093/ilar.51.4.362
Fortune, E. S., and Margoliash, D. (1995). Parallel pathways and convergence onto HVC and adjacent neostriatum of adult zebra finches (Taeniopygia guttata). J. Comp. Neurol. 360, 413–441. doi: 10.1002/cne.903600305
Foster, E. F., and Bottjer, S. W. (1998). Axonal connections of the high vocal center and surrounding cortical regions in juvenile and adult male zebra finches. J. Comp. Neuro. 397, 118–138. doi: 10.1002/(SICI)1096-9861(19980720)397:1<118::AID-CNE9>3.0.CO;2-3
Gibb, L., Gentner, T. Q., and Abarbanel, H. D. (2009). Brain stem feedback in a computational model of birdsong sequencing. J. Neurophysiol. 102, 1763–1778. doi: 10.1152/jn.91154.2008
Glaze, C. M., and Troyer, T. W. (2016). Temporal structure in zebra finch song: implications for motor coding. J. Neurosci. 26, 991–1005.
Hahnloser, R., Kozhevnikov, A., and Fee, M. (2002). An ultra-sparse code underlies the generation of neural sequences in a songbird. Nature 419, 65–70. doi: 10.1038/nature00974
Hiratani, N., and Fukai, T. (2018). Redundancy in synaptic connections enables neurons to learn optimally. Proc. Natl. Acad. Sci. 115, E6871–E6879. doi: 10.1073/pnas.1803274115
Hodgkin, A. L., and Huxley, A. F. (1952). A quantitative description of membrane current and its application to conduction and excitation in nerve. J. Physiol. 117, 500–544. doi: 10.1113/jphysiol.1952.sp004764
Jin, D. Z., Ramazanoğlu, F. M., and Sebastian Seung, H. (2007). Intrinsic bursting enhances the robustness of a neural network model of sequence generation by avian brain area HVC. J. Comput. Neurosci. 23, 283–299. doi: 10.1007/s10827-007-0032-z
Johnston, D., and Samuel Miao-Sin, W. (1996). Foundations of cellular neurophysiology. The MIT Press.
Kadakia, N., Armstrong, E., Breen, D., Morone, U., Daou, A., Margoliash, D., et al. (2016). Nonlinear statistical data assimilation for HVC-RA neurons in the avian song system. Biol. Cybern. 110, 417–434. doi: 10.1007/s00422-016-0697-3
Kosche, G., Vallentin, D., and Long, M. A. (2015). Interplay of inhibition and excitation shapes a premotor neural sequence. J. Neurosci. 35, 1217–1227. doi: 10.1523/JNEUROSCI.4346-14.2015
Kozhevnikov, A. A., and Fee, M. S. (2007). Singing-related activity of identified HVC neurons in the zebra finch. J. Neurophysiol. 97, 4271–4283. doi: 10.1152/jn.00952.2006
Li, M., and Greenside, H. (2006). Stable propagation of a burst through a one-dimensional homogeneous excitatory chain model of songbird nucleus HVC. Phys. Rev. E Stat. Nonlinear Soft Matter Phys. 74:011918. doi: 10.1103/PhysRevE.74.011918
Long, M. A., and Fee, M. S. (2008). Using temperature to analyse temporal dynamics in the songbird motor pathway. Nature 456, 189–194. doi: 10.1038/nature07448
Long, M. A., Jin, D. Z., and Fee, M. S. (2010). Support for a synaptic chain model of neuronal sequence generation. Nature 468, 394–399. doi: 10.1038/nature09514
Lynch, G. F., Okubo, T. S., Hanuschkin, A., Hahnloser, R. H. R., and Fee, M. S. (2016). Rhythmic continuous-time coding in the songbird analog of vocal motor cortex. Neuron 90, 877–892. doi: 10.1016/j.neuron.2016.04.021
McBain, C., and Dingledine, R. (1992). Dual-component miniature excitatory synaptic currents in rat hippocampal CA3 pyramidal neurons. J. Neurophysiol. 68, 16–27. doi: 10.1152/jn.1992.68.1.16
Meliza, C. D., Kostuk, M., Huang, H., Nogaret, A., Margoliash, D., and Abarbanel, H. D. I. (2014). Estimating parameters and predicting membrane voltages with conductance-based neuron models. Biol. Cybern. 108, 495–516. doi: 10.1007/s00422-014-0615-5
Mohebi, A., Pettibone, J. R., Hamid, A. A., Wong, J.-M. T., Vinson, L. T., Patriarchi, T., et al. (2019). Dissociable dopamine dynamics for learning and motivation. Nature 570, 65–70. doi: 10.1038/s41586-019-1235-y
Moll, F. W., Kranz, D., Corredera Asensio, A., Elmaleh, M., Ackert-Smith, L. A., and Long, M. A. (2023). Thalamus drives vocal onsets in the zebra finch courtship song. Nature 616, 132–136. doi: 10.1038/s41586-023-05818-x
Mooney, R. D. (1991). The development of connectivity and the nature of synaptic transmission between avian song control nuclei. Dissertation (Ph.D.), California Institute of Technology. doi: 10.7907/SBMB-1A95
Mooney, R. (2000). Different subthreshold mechanisms underlie song selectivity in identified HVC neurons of the zebra finch. J. Neurosci. 20, 5420–5436. doi: 10.1523/JNEUROSCI.20-14-05420.2000
Mooney, R. (2009). Neural mechanisms for learned birdsong. Learn. Mem. 16, 655–669. doi: 10.1101/lm.1065209
Mooney, R., and Prather, J. F. (2005). The HVC microcircuit: the synaptic basis for interactions between song motor and vocal plasticity pathways. J. Neurosci. 25, 1952–1964. doi: 10.1523/JNEUROSCI.3726-04.2005
Nixdorf, B. E. (1989). Ultrastructural analysis of the development and maturation of synapses and subsynaptic structures in the ectostriatum of the zebra finch. J. Comp. Neurol. 290, 472–486. doi: 10.1002/cne.902900403
Perkel, D. H., Gerstein, G. L., and Moore, G. P. (1967). Neuronal spike trains and stochastic point processes. I. The single spike train. Biophys. J. 7, 391–418. doi: 10.1016/S0006-3495(67)86596-2
Riters, L. V., and Alger, S. J. (2004). Neuroanatomical evidence for indirect connections between the medial preoptic nucleus and the song control system: possible neural substrates for sexually motivated song. Cell Tissue Res. 316, 35–44. doi: 10.1007/s00441-003-0838-6
Ropert, N., Miles, R., and Korn, H. (1990). Characteristics of miniature inhibitory postsynaptic currents in CA1 pyramidal neurones of rat hippocampus. J. Physiol. 428, 707–722. doi: 10.1113/jphysiol.1990.sp018236
Scharff, C., Kirn, J. R., Grossman, M., Macklis, J. D., and Nottebohm, F. (2000). Targeted neuronal death affects neuronal replacement and vocal behavior in adult songbirds. Neuron 25, 481–492. doi: 10.1016/S0896-6273(00)80910-1
Scimemi, A., and Beato, M. (2009). Determining the neurotransmitter concentration profile at active synapses. Mol. Neurobiol. 40, 289–306. doi: 10.1007/s12035-009-8087-7
Simpson, H. B., and Vicario, D. S. (1990). Brain pathways for learned and unlearned vocalizations differ in zebra finches. J Neurosci. 10, 1541–1556.
Simonyan, K., Horwitz, B., and Jarvis, E. D. (2012). Dopamine regulation of human speech and bird song: a critical review. Brain Lang. 122, 142–150. doi: 10.1016/j.bandl.2011.12.009
Sterratt, D., Graham, B., Gillies, A., and Willshaw, D. (2011). Principles of computational modeling in neuroscience. Cambridge: Cambridge University Press.
Stricker, C., Field, A. C., and Redman, S. J. (1996). Statistical analysis of amplitude fluctuations in EPSCs evoked in rat CA1 pyramidal neurones in vitro. J. Physiol. 490, 419–441. doi: 10.1113/jphysiol.1996.sp021155
Storace, D., Braubach, O., and Jin, L. (2015). Monitoring Brain Activity with Protein Voltage and Calcium Sensors. Sci Rep, 5, 10212.
Woolley, S. M., Hauber, M. E., and Theunissen, F. E. (2010). Developmental experience alters information coding in auditory midbrain and forebrain neurons. Dev. Neurobiol. 70, 235–252. doi: 10.1002/dneu.20783
Keywords: computational model, HVC, neuron interaction, song system, zebra finch
Citation: Xia P and Abarbanel HDI (2024) Model of the HVC neural network as a song motor in zebra finch. Front. Comput. Neurosci. 18:1417558. doi: 10.3389/fncom.2024.1417558
Edited by:
Gennady Cymbalyuk, Georgia State University, United StatesReviewed by:
Joel Tabak, University of Exeter, United KingdomHenrique Prado von Gersdorff, Oregon Health and Science University, United States
Copyright © 2024 Xia and Abarbanel. This is an open-access article distributed under the terms of the Creative Commons Attribution License (CC BY). The use, distribution or reproduction in other forums is permitted, provided the original author(s) and the copyright owner(s) are credited and that the original publication in this journal is cited, in accordance with accepted academic practice. No use, distribution or reproduction is permitted which does not comply with these terms.
*Correspondence: Pan Xia, cGF4aWFAdWNzZC5lZHU=
†These authors have contributed equally to this work and share first authorship
 Pan Xia
 Henry D. I. Abarbanel