- 1Department of Mathematics, University of Texas at Arlington, Arlington, TX, United States
- 2Division of Data Science, College of Science, University of Texas at Arlington, Arlington, TX, United States
- 3Department of Psychology, University of Notre Dame, Notre Dame, IN, United States
- 4Department of Psychology, University of Texas at Arlington, Arlington, TX, United States
Introduction: Sustaining attention is a notoriously difficult task as shown in a recent experiment where reaction times (RTs) and pupillometry data were recorded from 350 subjects in a 30-min vigilance task. Subjects were also presented with different types of goal, feedback, and reward.
Methods: In this study, we revisit this experimental data and solve three families of machine learning problems: (i) RT-regression problems, to predict subjects' RTs using all available data, (ii) RT-classification problems, to classify responses more broadly as attentive, semi-attentive, and inattentive, and (iii) to predict the subjects' experimental conditions from physiological data.
Results: After establishing that regressing RTs is in general a difficult task, we achieve better results classifying them in broader categories. We also successfully disambiguate subjects who received goals and rewards from those who did not. Finally, we quantify changes in accuracy when coarser features (averaged throughout multiple trials) are used. Interestingly, the machine learning pipeline selects different features depending on their resolution, suggesting that predictive physiological features are also resolution-specific.
Discussion: These findings highlight the potential of machine learning to advance research on sustained attention and behavior, particularly in studies incorporating pupillometry or other physiological measurements, offering new avenues for understanding and analysis.
1 Introduction
1.1 Background
Sustained attention is an umbrella term used in the field of cognitive psychology generally referring to a subject's readiness to detect unpredictably occurring signals over prolonged periods (Sarter et al., 2001). Studies dating back from over a century have addressed the difficulties of remaining vigilant when performing trivial or repetitive tasks (Bills, 1931a,b; Thorndike, 1912). Since then, several authors have explored the pitfalls of human inattentiveness in a variety of contexts, from driving accidents (National Highway Traffic Safety Administration, 2020) to in-class pedagogical activities (Bligh, 2000; Wang et al., 2021). This remains an active research topic in experimental psychology, with ongoing efforts to identify effective strategies to mitigate decrements in vigilance and task engagement (Massar et al., 2016; Hopstaken et al., 2015a,b; Esterman et al., 2016).
In a recent study, Robison et al. (2021) examined the specific effects of goal-setting, feedback, and incentives to counter attention deficits in a psychomotor vigilance task. Although some of the experimental manipulations were effective in mitigating slower Reaction Times (RTs) at later trials, none eliminated it. Specifically, both providing participants with a specific goal to strive toward and giving them performance feedback mitigated the a worsening of task performance across time. Further, participants in these conditions self-reported feeling more motivated and exhibited greater evoked pupillary responses. Traditionally, pupil diameter has been used as a measure of attentional effort (Beatty, 1982). In recent years, pupillometry has become an increasingly common psychophysiological tool, as we learn more about its neurobiological derivations and the psychological processes it accompanies. For example, it has been demonstrated that the pupil is sensitive to cognitive conflict (van der Wel and van Steenbergen, 2018), momentary lapses of attention (Unsworth and Robison, 2016, 2018), successful/unsuccessful memory retrieval (Papesh et al., 2012; Goldinger and Papesh, 2012), and can even be used to determine whether or not an individual is mind-wandering (Franklin et al., 2013; Mittner et al., 2016). Further, eye-gaze based detection of mind-wandering has been successfully employed while people read (Foulsham et al., 2013), watch films and video lectures (Mills et al., 2016; Hutt et al., 2017) and engage with online learning systems (Hutt et al., 2019). Therefore, we had reason to believe we could leverage state-of-the-art machine learning tools to predict an individual's psychological state, momentary level of attentiveness, and behavior via pupillometry and gaze positions during a simple sustained attention task.
1.2 Objectives
The objective of this work is to revisit the extensive pupillometry and reaction time (RT) data collected in Robison et al. (2021) and create new predictive models of attentiveness using a modern machine learning (ML) framework. In ML, a typical model (estimator) starts with a set of preprocessed features (explanatory variables) and is trained to predict a target variable from these features. If the target variable is continuous, the task is considered a regression problem. If the target variable is categorical, the task is a classification problem. The richness of the original study allows us to propose multiple ML problems of interest by varying the corresponding target variable and the composition of the feature set. We will solve:
1. RT-regression problems: for these models, the target variable is the continuous, raw RT value. The differences in problems arise from the initial feature list, which can vary in size from 12 to 360 features.
2. RT-classification problems: for these models, each RT value is categorized into attentive, semi-attentive, or inattentive. Broadly classifying responses in this manner is more feasible than predicting exact RT values. In these models, the number of initial features can vary from 7 to 12.
3. EC-classification problems: for this third family of problems, we propose a radically different approach. In the previous problems, the experimental conditions (EC) were used as explanatory variables. However, in these problems, the ECs become the target variables. For instance, we study whether it is possible to predict, based on the RTs, whether a subject received an incentive or not.
RT predictions similar to the first family of problems were attempted in Robison et al. (2021). However, here we explore various initial feature lists and regressors available in scikit-learn. The last two families of ML problems have not been explored yet. The outline of the paper is as follows: First, we review the experimental setup of the psychomotor vigilance task from Robison et al. (2021), describing how eye measurements were collected throughout the trials and detailing the various experimental manipulations that subjects underwent, which could impact their motivation and, consequently, their RTs. Next, we explain our pipeline for pre-processing the features that will be used in the subsequent models and carefully define the three families of machine learning problems investigated in our study. Third, we describe the feature matrices and pipelines used in each case. In the results section, we summarize the balanced accuracy scores and R-squared values for all classification and regression problems, along with a ranking of features according to their importance. Finally, we discuss and interpret our results in light of modern psychological theories.
2 Methods
2.1 Psychomotor vigilance task
Figure 1 illustrates the psychomotor vigilance task described in Robison et al. (2021). Briefly, subjects (N = 353) in a dark room stare at a blank screen that is first replaced by a fixation screen and then by a screen that displays zeroes for a random interval between 2–10 s. After this delay, the zeroes begin counting forward like a stopwatch. Subjects were instructed to press the space bar as soon as the stopwatch starts (timer phase). Once pressed, the counting stops, the screen freezes for 1 s (in some cases displaying a feedback screen), the RT is recorded, the screen resets, and a new trial begins. The subject's eye movements (diameter of left/right pupils and their gaze positions) are recorded throughout the process (140 trials).
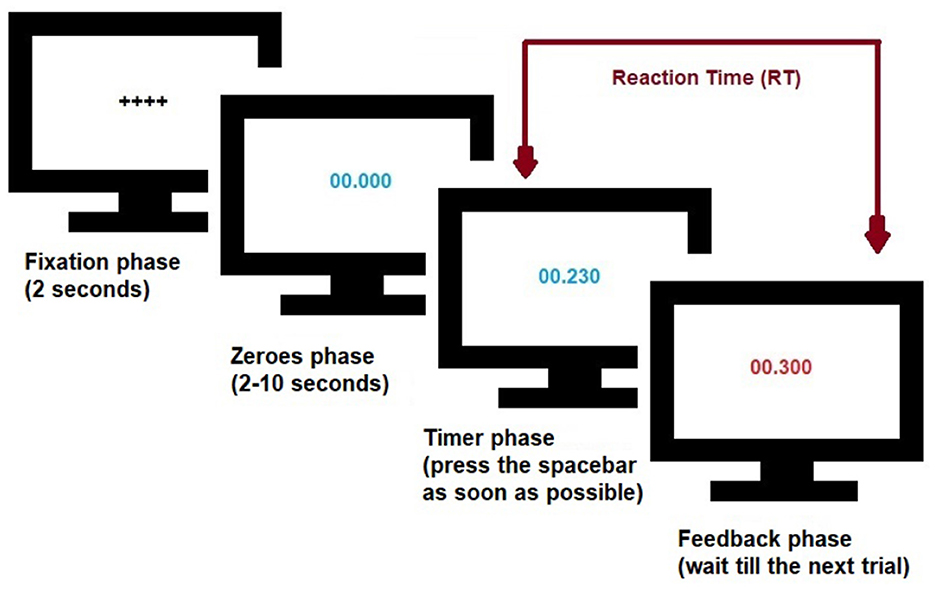
Figure 1. Schematics of the Psychomotor vigilance task. Screen undergoes different phases, changing from fixation, zeroes, timer, to feedback. The zeroes phase consists of a random interval of 2–10 s. Subjects were asked to press the space bar as soon as the stopwatch starts and have their Reaction Time (RT) recorded for that trial. See Robison et al. (2021) and text for details.
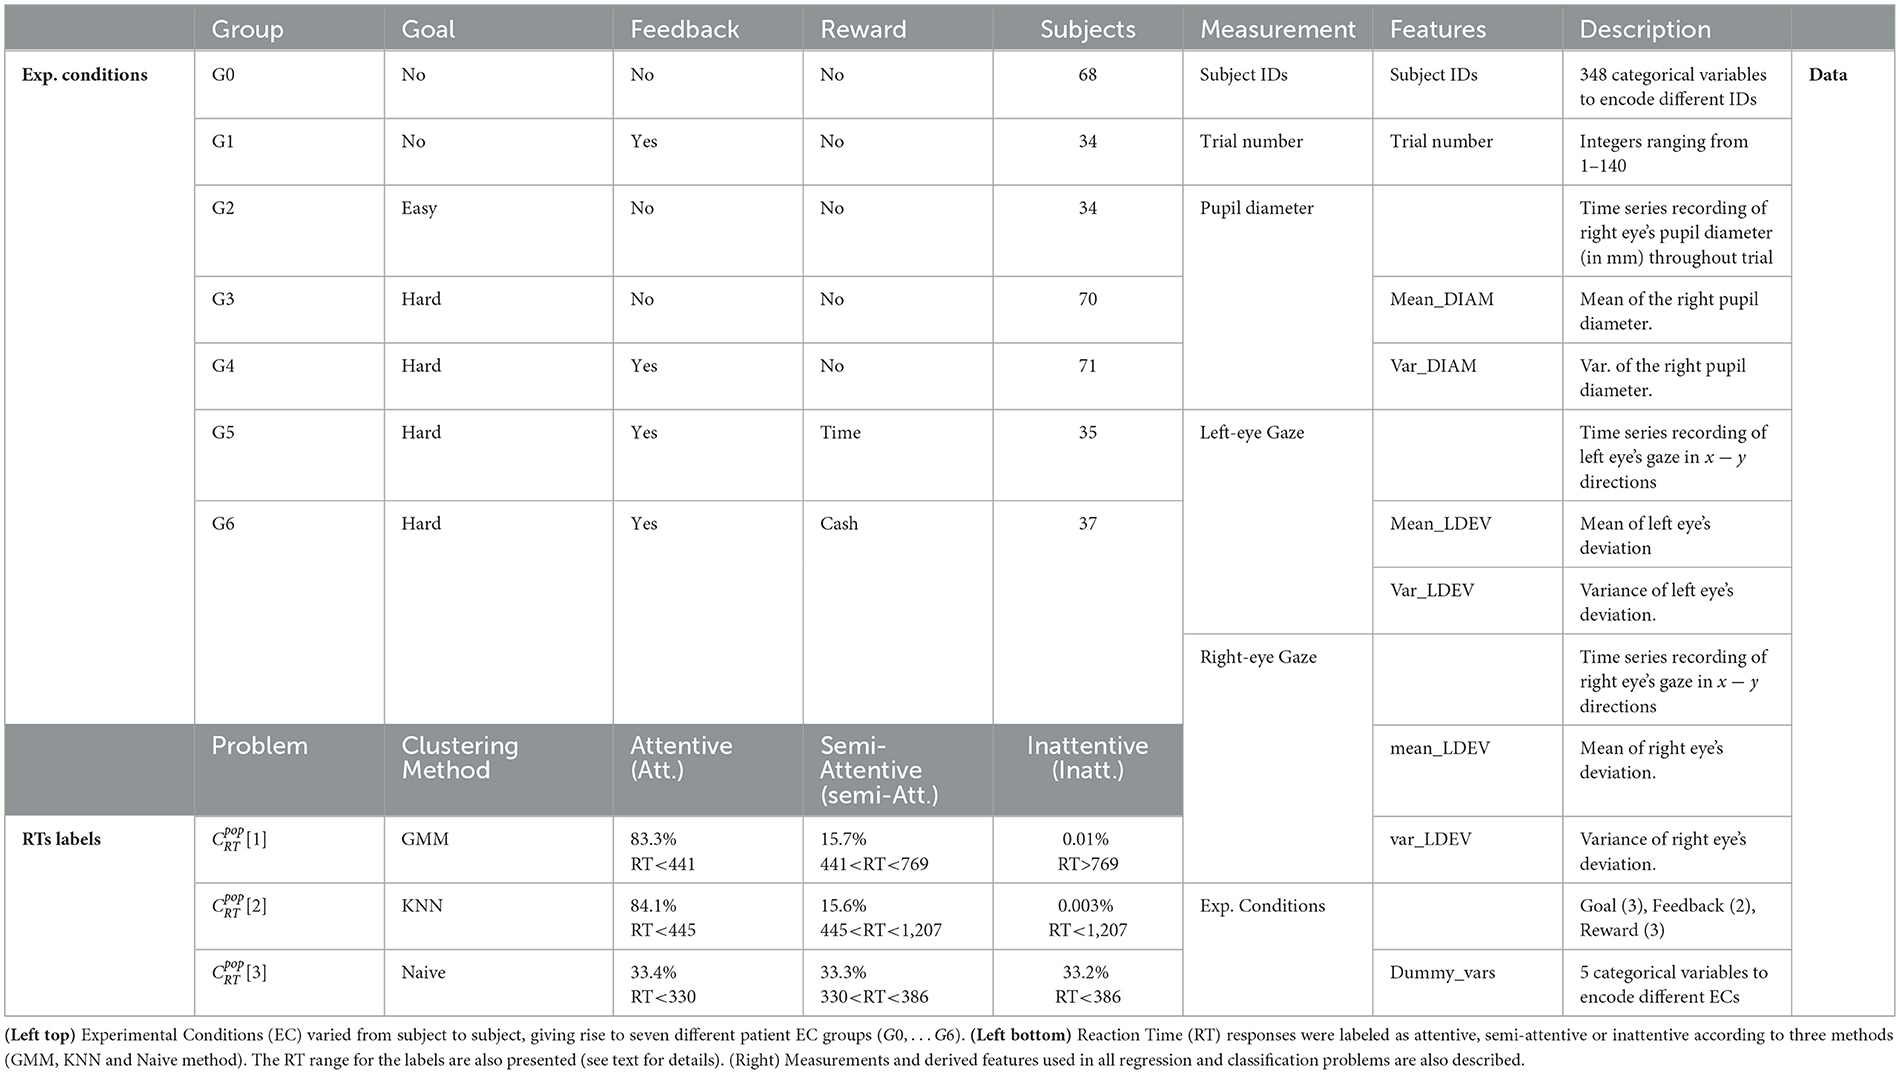
As listed in Table 1 (top left), the experimental conditions varied among subjects in terms of the type of goal (easy, hard, or none), feedback (yes/no), and reward conditions (time incentive, cash incentive, or none). Subjects in group G0 were asked to respond to the cue as quickly as possible. For subjects in group G1, the average reaction time (RT) was provided every 28 trials. Subjects in group G2 were asked to keep their RT below 800 ms (easy goal). Subjects in groups G3 and G4 were asked to keep their RT below 300 ms (hard goal), with G4 subjects receiving the same feedback as those in G1. Subjects in group G5 were told they could leave early if they met the goal, while group G6 subjects were promised $10 upon reaching the goal. In reality, all groups completed the same number of trials, regardless of performance. Table 1 (right) lists all measurements collected during the experiment and the derived features used in our study.
2.2 Description of the problems
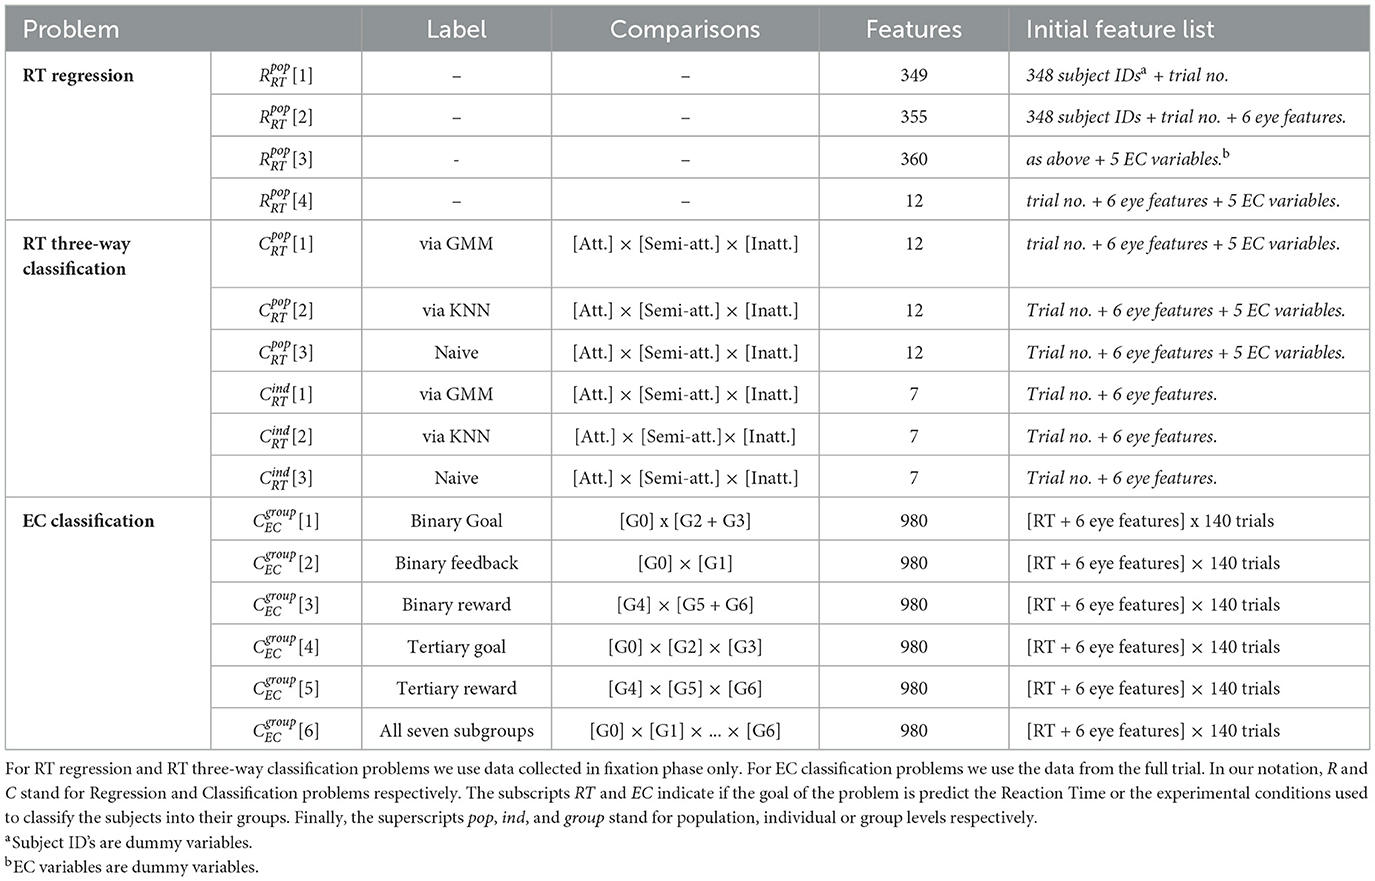
In our study, we solve three families of machine learning problems: (i) four RT-regression problems at the population level, (ii) three RT-classification problems at both individual and population levels, and (iii) six Experimental Condition (EC) classification problems at group levels. See Table 2 for details.
2.2.1 RT-regression problems
For task (i), we regress reaction times at the population level using the experimental conditions and pupillometry data collected during the fixation phase. As shown in Table 2, the initial feature list varies between problems 1–4, containing 349, 355, 360, and 12 features respectively. This is a challenging ML task because we do not use eye measurements collected during the random interval (2–10 s) between the fixation phase and the start of the stopwatch that records the RT for the trial.
2.2.2 RT-classification problems and
For (ii), we classify RT responses into three classes: attentive, semi- attentive, and inattentive using three labeling methods listed in Table 1: Gaussian Mixture Model (GMM), K-Nearest Neighbors (KNN), and the naive method (see Supplementary material for details). This can be viewed as a coarser reformulation of the regression problems, where instead of predicting the exact RT values we try to predict broader RT categories. These classification problem are solved both at the population (pop) level and at the individual (ind) level. Here again, we do not utilize any eye measurements collected during the zeroes phase.
2.2.3 EC-classification problems
For (iii), we classify subjects according to labels given by experimental conditions. We use pupillometry data collected throughout the entire experiment as well as RTs as features to predict the label. The labels are based on the subject's group and the classification problem that we solve. For some binary classification problems, for example, we merge two groups into one label. See Table 2 for details.
2.3 Machine-learning pipelines
Figure 2 depicts the seven key steps in the general pipeline used in the regression and classification problems: data curation, feature engineering, data imputation, data standardization, feature selection, model selection, and hyper parameter tuning. See the paragraphs below for some details.

Figure 2. Overview of the machine learning pipeline. We tailor this general outline for the RT-regression problems, for the RT three-way classification problems, and for the EC-classification problems. See text for details.
2.3.1 Data curation and feature engineering
We curate the data by (i) removing subjects 1,041, 1,191, 1,192, and 1,205 who lacked eye-related measurements. (ii) by capping RT values at 3,000 ms to avoid outlying RTs from having an outsized influence on the results. To avoid redundancies in the feature list, we disregard the left-pupil measurements as they are highly correlated with the right-pupil ones. See the pairwise correlation matrix between the original features in Supplementary Figure 8. We also combine the eye gazes in the x−y directions (capped at 10 mm) to create an overall deviation feature denoting how much they deviate from the center of the screen located at (0.5, 0.5):
The eye-tracker used in this study (Tobii T300) reports the position of visual gaze using a coordinate system where (0.5, 0.5) represents the center of the screen (half the screen width, half the screen height). Since numerical values are standardized later in the pipeline, this choice of coordinate system does not affect the results. For each subject, we calculate the means and variances of all eye-derived features throughout trials.
2.3.2 Data imputation and standardization
The filling of missing eye data is done using sklearn's k-neighbors imputer, and values are subsequently standardized (individually) to stay within a 0–1 range via min-max scaler.
2.3.3 Inclusion of categorical data in feature list
We use dummy encoding to account for categorical data (subject IDs and experimental conditions) in the RT-regression and classification problems. This is not necessary for the EC-classification problems as they only consider numerical features.
2.3.4 Wrapper for multiple classifiers and regressors
There are numerous models to solve classification and regression problems. Instead of manually implementing each model, we use a wrapper called lazy predict (Pandala, 2021) that automatically tests 42 regressors or 32 classifiers available in scikit-learn (Pedregosa et al., 2011) to your data. This allows us to automatically get R-squared values or balanced accuracy scores for all listed models. We adjust the original wrapper to also return the Akaike Information Criterion (AIC) values to help us select the most informative models. Since the wrapper results may vary depending on the splitting of the train/test subsets, we perform five-fold cross-validation and consider the mean of the results.
2.3.5 Hyperparameter tuning
Once we identify the best model using the lazy wrapper, we further optimize all parameters used by the chosen regressor or classifier to improve the results. We report our final R-squared and balanced accuracy scores for five-fold (stratified) cross validations.
2.3.6 Pipeline adjustments for RT-problems
We use step-wise backward regression in our feature selection step for problems , , and . These problems have initially fewer features compared to the EC-classification problems, and this choice provides us with a reasonable number of features to work with. problems use p-value = 0.05, but uses p-value = 0.9 as the algorithm fails to converge at lower values. We use a more stringent p-value of 0.01 for . For the individual level classification problems, we start with a p-value = 0.05, but we relax this value (up to 50%) for three subjects who did not have any features selected.
2.3.7 Pipeline adjustments for EC-problems
Problems have initially a large number of features (n = 980), which we first reduce and sort using a combination of LASSO lars and Ridge regression. See Supplementary material for details. We run the wrapper five times (with different train/test splittings of the data) for every subset of features. We select the classifier that provides the highest (mean) balanced accuracy and lowest (mean) AIC to avoid overfitting,
3 Results
3.1 Summary of results
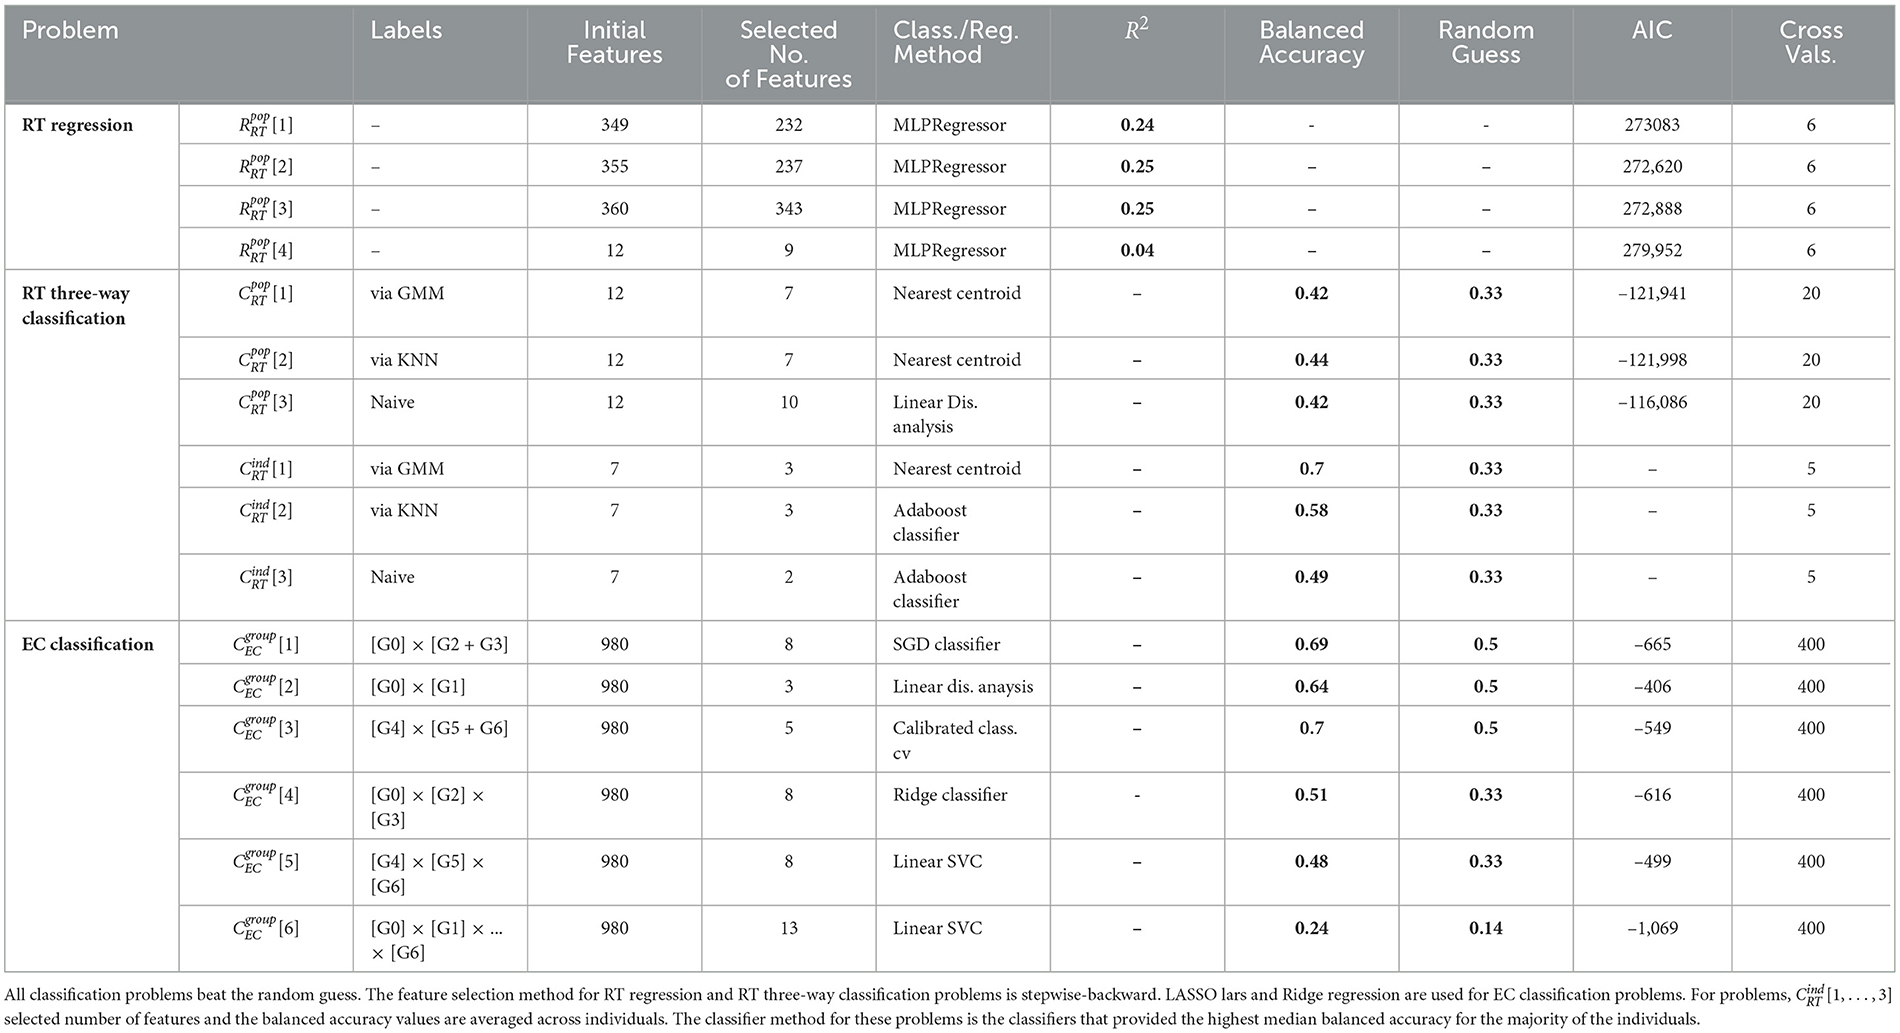
Table 3 summarizes the results for the three families of machine learning problems that we solve: (i) four RT-regression problems at the population level , (ii) six RT-classification problems and , and (iii) six experimental Condition (EC) classification problems at group levels . We list the number of features before and after feature selection, the best classifier or regressor for each problem, and the corresponding balanced accuracy or R-squared score. We favor balanced accuracy scores over (simple) accuracy for all classification problems to account for differences in group sizes for the different labels. Note that the scores for all classification problems surpass random guessing by a significant margin.
3.2 Subject ID as key regressor for predicting RTs at population level
The box-plots in Figure 3 depicts R-squared values over 400 cross-validations for problems using our top model, the Multi-layer Perceptron regressor (MLP regressor). Problems include 348 subject IDs in the initial feature list, and their mean R-squared are 0.25 ± 0.03, 0.25 ± 0.03, 0.24 ± 0.03 respectively. Contrasting, the mean R-squared for problem (that does not include subject IDs) is 0.04 ± 0.01, demonstrating the importance of IDs as RT predictors. Interestingly, the addition of categorical variables encoding experimental conditions (problem vs. ) did not lead to any improvement in the predictions.
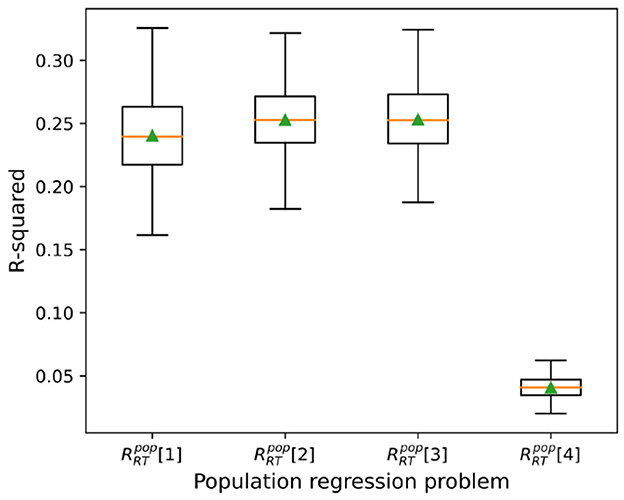
Figure 3. Regression results. Box plots depicting mean, median, and standard deviation of R2 values in cross validations for regression problems.
3.3 Results for RT-classification problems
Table 4 lists the selected features for problems . Note that the trial number and the categorical variable encoding the presence of a goal were selected by all problems. All problems select at least one of the pupillometry features and an experimental condition, with the Nearest centroid classifier being the best method for problems . Many classifiers provide similar balanced accuracy scores for (adaboost, label propagation, linear discriminant, LGBM, random forest, SVC), so we chose linear discriminant as it is simpler to hyper-tune. We run five cross-validations with the wrapper (testing all methods) and 20 cross-validations for the best one.
We solve the RT-classification problems also at the individual level, i.e., trying to classify RT responses as attentive, semi-attentive, and inattentive for each subject in turn. For these problems (), the experimental conditions are not included in the feature list. Table 3 shows the mean of the balanced accuracy scores (using the best method) over all subjects. We run five cross-validations with the wrapper (testing all methods) and rank the methods according to the median of the balanced accuracy scores. Figure 4 shows histograms for the frequency of selected features for problem . Similar to the results obtained at the population level, the trial number was also the most frequently selected feature for most subjects.

Figure 4. Frequency of features for individual, RT-classification problems under each clustering method. Majority of the individuals selected less than three out of the seven features.
3.4 Identifying experimental conditions from physiological data
The last family of machine learning problems examined in this study is significantly different from the other two; while and try to predict or categorize RT responses, problems try to disambiguate subjects exposed to different experimental conditions. As shown in Table 1, subjects were binned into groups G0, …, G6 depending on the presented type of goal (easy, hard, or none), feedback (yes/no), and reward (time incentive, cash incentive, or none). For these problems, experimental conditions are no longer features used to predict RTs. In fact, RTs are now themselves features used in the six n-way classification tasks (see label type in Table 2). Also, the eye-derived features are no longer collected solely at the fixation phase of the experiment, but instead, throughout the entire trial.
With this different setup, we can now investigate if differences in experimental conditions imprint noticeable changes in the collected physiological data. In problem , for example, we combine subjects who received either easy or hard goals into a single group [G2+G3] and compare them with those who received none [G0]. This leads to a binary classification problem, [G0] × [G2+G3]. In problem , we keep G2 and G3 separate, which lead to a three-way classification problem instead, [G0] × [G2] × [G3]. The setup for the other problems follows the same rationale, and our best classification results are listed in the bottom part of Table 3.
Problems consist of binary classification tasks for one type of experimental condition (vs. control group). Top balanced accuracy scores for the presence of goal, feedback, and reward are 0.69, 0.70, and 0.64 respectively. Problems consist of three-way classification tasks for goal and reward with top scores of 0.51 and 0.48. Finally, is a seven-way classification task for all groups, for which we achieve a 0.24 score. All scores surpass random guessing by a significant margin, and in all problems except , the most accurate model was also the most informative (using AIC).
Figure 5 depicts the selected features for problems . Since their initial feature list is very large (with 980 features), it is expected that in some cases, the pipeline's original feature-selection step might provide sub-optimal solutions. In an effort to improve our results, we empirically complemented the list of selected features of some problems with features selected by others. Specifically, improved when we added features from , improved when we added features from , and improved when we added features from . As expected, the number of features is proportional to the complexity of the task, with significant overlap between the corresponding binary and three-way tasks ( and ).
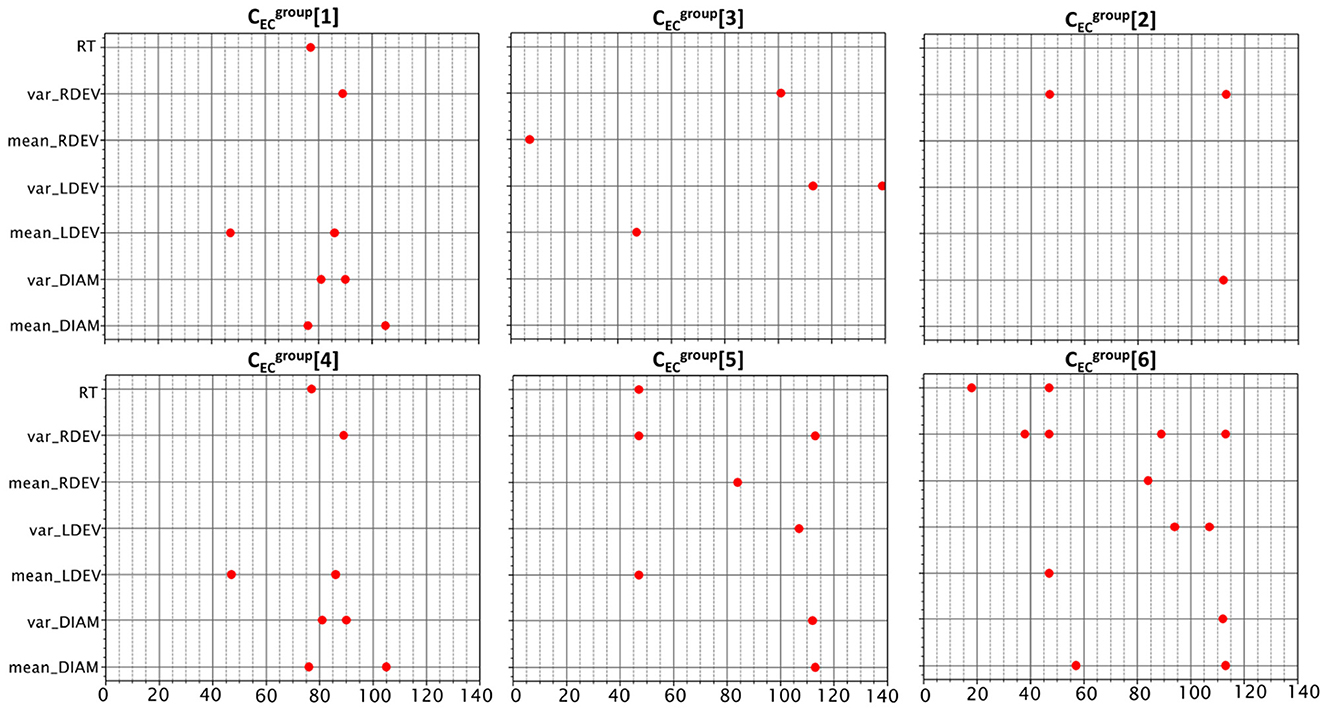
Figure 5. Features selected for the six classification problems. There were common features among the binary and three-way problems of goal and reward experimental conditions. The binary classification problems are on the top row. The three-way problems for goal and reward are placed under their respective binary problems.
3.5 Accuracy vs. feature resolution for EC-classification problems
The initial feature list for problems is large because we collect six pupillometry features along with the RT per trial (7 × 140 = 980). In what follows, we investigate how well can we classify subjects using coarser measurements. Instead of collecting features at every trial, we average them over 10, 20, and 35 trials, thus obtaining physiological data with decreasing resolution. We use the same feature sorting and selection methods used in the original problems.
Figure 6 displays the mean of the balanced accuracy scores over 400 cross-validations (repeated stratified k fold with 20 splits and 20 repeats) for the best method found by the wrapper. In general, scores tend to slowly decrease as we average features over more trials. Problems have similar decay rates in balanced accuracy (≈ −0.005), while is slightly more robust (≈ −0.002). We report the number of selected features, the exact scores, the standard deviations, the best classifiers, and the AIC values for all problems (at different resolutions) in the Supplementary material.
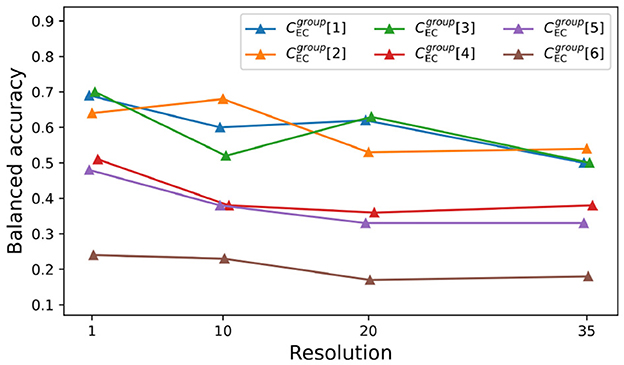
Figure 6. Balanced accuracy for problems at different resolutions. Average balanced accuracy for problems at different resolution levels (1, 10, 20, and 35). We used repeated Stratified K-Fold with 20 folds and 20 repeats totaling 400 cross-validations. Best fit lines are given by y1 = −0.006x + 0.69, y2 = −0.005x + 0.67, y3 = −0.005x + 0.66, y4 = −0.004x+0.47, y5 = −0.005x + 0.46 and y6 = –0.002x + 0.24 respectively.
Figure 7 shows the important features for problems , with green/blue blocks representing features selected once/twice under any resolution level. Moreover, if a selected feature is averaged over k trials, we color all corresponding k trials in the matrix plot. Note that there are no overlaps for more than two resolution levels, indicating that predictive features at the highest resolution level are not optimal at the lower ones.
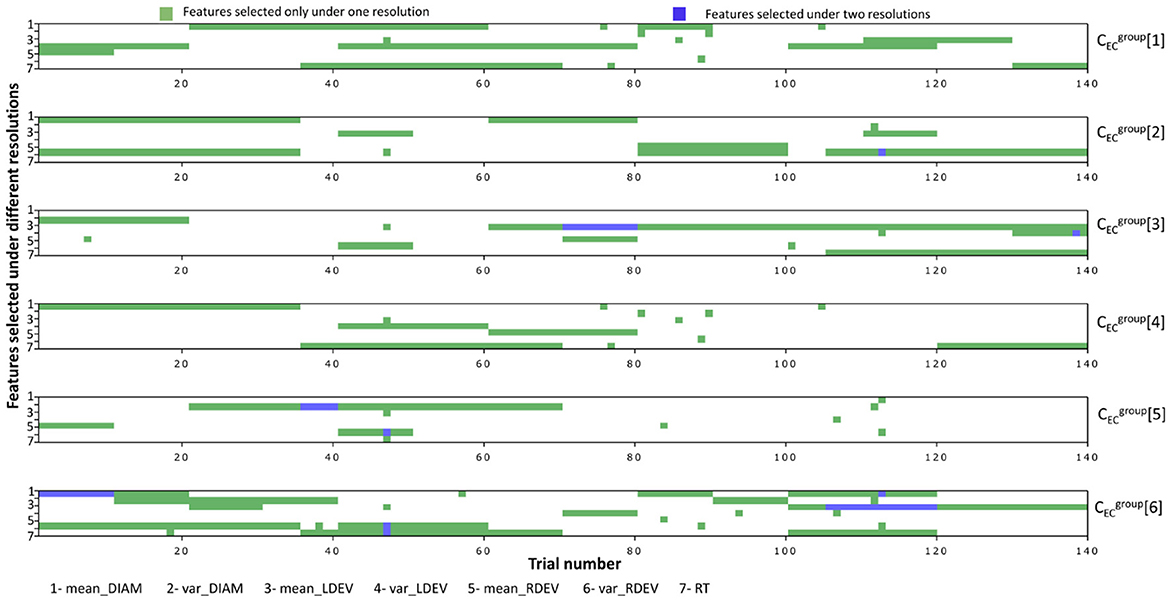
Figure 7. Key features selected for each problem under different resolutions. If a feature was selected for a combined trial (10, 20, and 35), then the whole block was colored. The dark green color indicated overlaps in features in different resolutions.
4 Discussion
Sustaining attention is difficult, and it has been made perhaps more difficult by the dynamic environments in which we live and work. As people complete their daily tasks, they experience failures of sustained attention, caused by both internal (e.g., mind-wandering) and external distraction (e.g., from smartphone notifications). Many situations, like driving a car, learning in a classroom, and screening baggage for dangerous items, require sustained attention. Cognitive psychologistsv and cognitive neuroscientists still do not have a firm grasp on precisely why humans find sustaining attention so challenging. Modern machine learning methods may reveal, via data-driven approaches, moment-to-moment psychological and physiological features that are indicative of greater versus letter attentiveness. Our goal here was to determine whether we could categorize attentiveness using both psychological (i.e., goal state, feedback presence, reward) and physiological (i.e., eye-tracking) features of individuals.
Specifically, we revisit the psychomotor vigilance experiment from Robison et al. (2021) through the lens of modern machine learning techniques. Specifically, we solve three families of machine learning problems: (i) four RT-regression problems at the population level , (ii) three RT-classification problems at the population level and at the individual level, and (iii) six Experimental Condition (EC) classification problems at group levels .
In (i), we find that predicting RTs is a notoriously difficult task (R-squared ≈ 0.24, see Table 3). The best models for did not select any eye-related features from the fixation phase as predictors, instead choosing a combination of subject IDs, trial number, and experimental conditions. During the experiment, subjects first stared at a blank screen, followed by a fixation screen, and then a screen displaying zeroes for a random interval between 2–10 s. After this delay, the zeroes began counting forward like a stopwatch, and subjects pressed the space bar as soon as the stopwatch started (timer phase). Our analysis utilized eye-derived features from the fixation phase, where subjects could still be attentive and preparing for the task ahead. Any signs of inattention may not have developed yet. In contrast, during the random interval, subjects might experience a drop in attentiveness or their eyes might wander off the screen, which could be more predictive of slower RTs. This interval represents a period of waiting and uncertainty, potentially leading to lapses in attention that could be more indicative of the subject's state and performance. Therefore, future analyses might benefit from incorporating eye-derived features from this interval to improve RT predictions. We also note that including Subject ID in the RT-regression model significantly improved its performance, underscoring the importance of individual differences in experiments on sustained attention using RT measures. This finding aligns with existing literature, which shows that these are nested observations, and RTs naturally cluster within individuals, as some people tend to respond faster than others (Unsworth and Robison, 2018).
In (ii), instead of trying to predict exact RT values, we settle for a less ambitious classification of RT-responses as attentive, semi-attentive, and inattentive. We use four different clustering methods to define these broader categories, which lead to balanced accuracy scores of ≈ 0.43 at the population level and ≈ 0.6 at the individual level. The trial number feature was the most frequently-selected feature across all problems (see Figure 4), which is compatible with the natural, growing inattentiveness reported in Robison et al. (2021). The analysis also revealed that pupil and eye-tracking measures were not key predictors of RT in both RT-regression and RT-classification models. This could be due to the restricted time period of eye measures or because RT and pupil measures index different aspects of attention. Existing literature supports the latter possibility, suggesting that post-stimulus dilations and RT have different sensitivities to task demands (Hershman and Henik, 2019; Richer and Beatty, 1987). Therefore, including wider windows of pupil data may not have straightforwardly predicted RTs.
In (iii), we solve a much different type of machine learning problem. Instead of trying to categorize or predict RTs, we try to classify subjects that exposed to different experimental conditions, such as the presence of a goal, feedback, and reward. This led to the six n-way classification problems . Contrary to the previous problems, RTs are now themselves features and eye-measurements are no longer restricted to the fixation phase (they are averaged throughout the entire trial). Our good classification scores (see Table 3) suggest that manipulations in experimental conditions do imprint noticeable changes in the recorded physiological data, although predictors may vary according to the resolution of the features (see Figures 6, 7). The analysis showed that pupil measures are key predictors of task type in the EC-classification problem, with prediction accuracy decreasing when measures are averaged across trials rather than using individual trial-level data. This suggests that while broad pupil/eye data can indicate the overall arousal or attentional state of participants, trial-level data offers a weaker prediction with temporal resolution. We believe this finding may help guide future research methodology in cognitive psychology, reinforcing the importance of maintaining data resolution throughout the experiment.
Overall, our machine-leaning approach indicates that the behavioral and physiological measures we used accurately predicted the experimental conditions, demonstrating that global, qualitative changes in attentional state are detectable. In this design, participants were assigned to various conditions, and it is plausible that similar techniques could predict natural states of extreme stress, anxiety, fatigue, or their opposites like contentment, calm, and alertness. These states would manifest as distinct patterns in eye movements, pupillary dynamics, and behavior. However, the same model might be less effective in predicting specific moments of stress or fatigue, as evidenced by our lower success rate in predicting specific RTs.
4.1 Outlook
The application of ML to analyze sustained attention data presents significant theoretical, analytical, and practical benefits. Theoretically, ML allows us to identify complex patterns and relationships within the data, enhancing our understanding of cognitive processes in sustained attention. This analytical approach is particularly valuable in behavioral neuroscience and psychology, providing deeper insights into complex behaviors.
Analytically, ML offers robust and flexible tools to handle high-dimensional data, enabling the development of predictive models with high accuracy and generalizability. Our study demonstrates the potential of these models to classify attentional states and predict RTs. The experimental setup led to multiple ML problems, highlighting the importance of carefully defining problems, as the initial feature list and target variable may change. For the same setup, we proposed three families of ML problems. However, predicting human responses remains challenging, even in controlled setups, illustrating the necessity of sophisticated ML pipelines.
Practically, predicting and understanding attentiveness through ML has far-reaching implications. In education, predictive models can inform personalized learning strategies to maintain engagement. In occupational health, these models can monitor and enhance productivity and safety by identifying periods of low attentiveness and implementing timely interventions. Additionally, adaptive user interfaces and assistive technologies can respond to users' attentional states, improving overall user experience and performance.
The present results are a first step toward leveraging pupil diameter and gaze position data to predict moments of inattentiveness. Recent work has pursued similar goals with more dynamic environments and additional data (e.g., body movement, blinking) (D'Mello et al., 2022; Bosch and D'Mello, 2022). In future work, we aim to design tasks that produce robust indices of inattentiveness using eye data and additional sensors for multidimensional data collection. Ultimately, our goal is to build a reproducible and generalizable model that detects attentional lapses in real time, mitigating failures of sustained attention. Portable and accurate wearable eye-tracking technology could be especially useful in air traffic control, baggage screening, life-guarding, and others.
Data availability statement
The machine learning code supporting this study is available upon reasonable request by contacting bmV0em5hbmFAZ21haWwuY29t. Access to the dataset can be obtained by contacting bXJvYmlzb25AbmQuZWR1.
Ethics statement
Ethical approval was not required for the study involving humans in accordance with the local legislation and institutional requirements. Written informed consent to participate in this study was not required from the participants or the participants' legal guardians/next of kin in accordance with the national legislation and the institutional requirements. Written informed consent was obtained from the individual(s) for the publication of any potentially identifiable images or data included in this article.
Author contributions
NF: Data curation, Formal analysis, Investigation, Methodology, Validation, Visualization, Writing – original draft, Writing – review & editing. MR: Conceptualization, Investigation, Methodology, Resources, Supervision, Validation, Writing – review & editing. PM: Conceptualization, Formal analysis, Resources, Supervision, Validation, Writing – review & editing, Investigation, Methodology, Project administration, Software, Visualization.
Funding
The author(s) declare that no financial support was received for the research, authorship, and/or publication of this article.
Conflict of interest
The authors declare that the research was conducted in the absence of any commercial or financial relationships that could be construed as a potential conflict of interest.
Publisher's note
All claims expressed in this article are solely those of the authors and do not necessarily represent those of their affiliated organizations, or those of the publisher, the editors and the reviewers. Any product that may be evaluated in this article, or claim that may be made by its manufacturer, is not guaranteed or endorsed by the publisher.
Supplementary material
The Supplementary Material for this article can be found online at: https://www.frontiersin.org/articles/10.3389/fnbeh.2024.1386723/full#supplementary-material
References
Beatty, J. (1982). Task-evoked pupillary responses, processing load, and the structure of processing resources. Psychol. Bull. 91, 276–292. doi: 10.1037/0033-2909.91.2.276
Bills, A. G. (1931b). Blocking: A new principle of mental fatigue. Am. J. Psychol. 43, 230–245. doi: 10.2307/1414771
Bosch, N., and D'Mello, S. K. (2022). Can computers outperform humans in detecting user zone-outs? Implications for intelligent interfaces. ACM Trans. Comput. Hum. Interact. 29, 1–33. doi: 10.1145/3481889
D'Mello, S. K., Tay, L., and Southwell, R. (2022). Psychological measurement in the information age: machine-learned computational models. Curr. Dir. Psychol. Sci. 31, 76–87. doi: 10.1177/09637214211056906
Esterman, M., Grosso, M., Liu, G., Mitko, A., Morris, R., DeGutis, J., et al. (2016). Anticipation of monetary reward can attenuate the vigilance decrement. PLoS ONE 11:e0159741. doi: 10.1371/journal.pone.0159741
Foulsham, T., Farley, J., and Kingstone, A. (2013). Mind wandering in sentence reading: Decoupling the link between mind and eye. Can. J. Exp. Psychol. 67:51. doi: 10.1037/a0030217
Franklin, M. S., Broadway, J. M., Mrazek, M. D., Smallwood, J., and Schooler, J. W. (2013). Window to the Wandering Mind: Pupillometry of Spontaneous thought While Reading. London: Sage. doi: 10.1080/17470218.2013.858170
Goldinger, S. D., and Papesh, M. H. (2012). Pupil dilation reflects the creation and retrieval of memories. Curr. Dir. Psychol. Sci. 21, 90–95. doi: 10.1177/0963721412436811
Hershman, R., and Henik, A. (2019). Dissociation between reaction time and pupil dilation in the stroop task. J. Exp. Psychol. Learn. Mem. Cogn. 45:1899. doi: 10.1037/xlm0000690
Hopstaken, J. F., Van Der Linden, D., Bakker, A. B., and Kompier, M. A. (2015a). A multifaceted investigation of the link between mental fatigue and task disengagement. Psychophysiology 52, 305–315. doi: 10.1111/psyp.12339
Hopstaken, J. F., Van Der Linden, D., Bakker, A. B., and Kompier, M. A. (2015b). The window of my eyes: task disengagement and mental fatigue covary with pupil dynamics. Biol. Psychol. 110, 100–106. doi: 10.1016/j.biopsycho.2015.06.013
Hutt, S., Hardey, J., Bixler, R., Stewart, A., Risko, E., D'Mello, S. K., et al. (2017). Gaze-based detection of mind wandering during lecture viewing. Int. Educ. Data Mining Soc.
Hutt, S., Krasich, K., Mills, C., Bosch, N., White, S., Brockmole, J. R., et al. (2019). Automated gaze-based mind wandering detection during computerized learning in classrooms. User Model. User-adapt. Interact. 29, 821–867. doi: 10.1007/s11257-019-09228-5
Massar, S. A., Lim, J., Sasmita, K., and Chee, M. W. (2016). Rewards boost sustained attention through higher effort: a value-based decision making approach. Biol. Psychol. 120, 21–27. doi: 10.1016/j.biopsycho.2016.07.019
Mills, C., Bixler, R., Wang, X., and D'Mello, S. K. (2016). Automatic gaze-based detection of mind wandering during narrative film comprehension. Int. Educ. Data Mining Soc.
Mittner, M., Hawkins, G. E., Boekel, W., and Forstmann, B. U. (2016). A neural model of mind wandering. Trends Cogn. Sci. 20, 570–578. doi: 10.1016/j.tics.2016.06.004
National Highway Traffic Safety Administration (2020). Distracted driving 2018. National Center for Statistics and Analysis, Research Note Report DOT HS 812 926. Washington, DC: National Highway Traffic Safety Administration.
Pandala, S. (2021). Lazy predict. Available at: https://github.com/shankarpandala/lazypredict
Papesh, M. H., Goldinger, S. D., and Hout, M. C. (2012). Memory strength and specificity revealed by pupillometry. Int. J. Psychophysiol. 83, 56–64. doi: 10.1016/j.ijpsycho.2011.10.002
Pedregosa, F., Varoquaux, G., Gramfort, A., Michel, V., Thirion, B., Grisel, O., et al. (2011). Scikit-learn: machine learning in Python. J. Mach. Learn. Res. 12, 2825–2830.
Richer, F., and Beatty, J. (1987). Contrasting effects of response uncertainty on the task-evoked pupillary response and reaction time. Psychophysiology 24, 258–262. doi: 10.1111/j.1469-8986.1987.tb00291.x
Robison, M., Unsworth, N., and Brewer, G. (2021). Examining the effects of goal-setting, feedback, and incentives on sustained attention. J. Exp. Psychol. Hum. Percept. Perform. 47. doi: 10.31234/osf.io/97t8w
Sarter, M., Givens, B., and Bruno, J. P. (2001). The cognitive neuroscience of sustained attention: where top-down meets bottom-up. Brain Res. Rev. 35, 146–160. doi: 10.1016/S0165-0173(01)00044-3
Thorndike, E. L. (1912). The curve of work and the curve of satisfyingness. J. Appl. Psychol. 1, 165–194. doi: 10.1037/h0073541
Unsworth, N., and Robison, M. K. (2016). Pupillary correlates of lapses of sustained attention. Cogn. Affect. Behav. Neurosci. 16, 601–615. doi: 10.3758/s13415-016-0417-4
Unsworth, N., and Robison, M. K. (2018). Tracking arousal state and mind wandering with pupillometry. Cogn. Affect. Behav. Neurosci. 18, 638–664. doi: 10.3758/s13415-018-0594-4
van der Wel, P., and van Steenbergen, H. (2018). Pupil dilation as an index of effort in cognitive control tasks: a review. Psychon. Bull. Rev. 25, 2005–2015. doi: 10.3758/s13423-018-1432-y
Keywords: sustained attention, pupillometry data, reward, reaction time, machine learning, classification, regression, feature selection
Citation: Fernando N, Robison M and Maia PD (2024) Analysis of goal, feedback and rewards on sustained attention via machine learning. Front. Behav. Neurosci. 18:1386723. doi: 10.3389/fnbeh.2024.1386723
Received: 15 February 2024; Accepted: 25 November 2024;
Published: 19 December 2024.
Edited by:
Liana Fattore, CNR Neuroscience Institute (IN), ItalyReviewed by:
Shinya Sakai, Hokkaido University, JapanEric Schumacher, Georgia Institute of Technology, United States
Copyright © 2024 Fernando, Robison and Maia. This is an open-access article distributed under the terms of the Creative Commons Attribution License (CC BY). The use, distribution or reproduction in other forums is permitted, provided the original author(s) and the copyright owner(s) are credited and that the original publication in this journal is cited, in accordance with accepted academic practice. No use, distribution or reproduction is permitted which does not comply with these terms.
*Correspondence: Nethali Fernando, cXRrOG5yQHZpcmdpbmlhLmVkdQ==; Pedro D. Maia, cGVkcm8ubWFpYUB1dGEuZWR1
 Nethali Fernando
 Matthew Robison
 Pedro D. Maia